Article

Load Deformation Effect of CBD Ground Cluster in Zhengzhou City

1
College of Surveying and Geo-Informatics, North China University of Water Resources and Electric Power, Zhengzhou 450045, China
2
College of Geosciences and Engineering, North China University of Water Resources and Electric Power, Zhengzhou 450045, China
*
Author to whom correspondence should be addressed.
Sustainability 2022, 14(7), 4047; https://doi.org/10.3390/su14074047
Submission received: 31 December 2021 / Revised: 25 March 2022 / Accepted: 25 March 2022 / Published: 29 March 2022

Abstract

:
With the increase of the number of urban cluster buildings, it is bound to cause land subsidence near cluster buildings. Based on Farrell’s load deformation theory, this paper studies the surface deformation and geoid change caused by Zhengzhou CBD cluster buildings. The results show that the maximum horizontal displacement of the International Convention and Exhibition Center is 0.1 mm, the maximum vertical displacement is 0.33 mm, and the maximum geoid fluctuation is 17.4 mm; the maximum inclination of geoid is 1.89 s. In addition, the influence of independent single buildings on ground deformation is centered on the single building and diffuses outward; the influence of cluster load buildings on the ground deformation of a single building is nonlinear attenuation and superimposed with each other.

1. Introduction

Under the action of various factors, the shape of the earth is changing at all times. These factors include the force source generated by the change of the earth’s internal structure and the change of surface load mass, as well as the tidal force of external celestial bodies [1,2,3]. Among them, solid tide and load tide have relatively complete theoretical models, and the deformation effect can be obtained by actual observation or theoretical simulation [4]. As the physical structure of the real earth’s interior is very complex, people can only simulate the deformation effects of solid tide and load tide through various earth models, which is the tide simulation theory [5].
The theoretical models of earth deformation mainly include: (1) Linear model, establishing the relationship between environmental load changes in local areas and shape variables, and calculate the corresponding values. This model was first studied by Caputo [6,7] and Rabbel and Zschau [8], among whom, the research results of Rabbel W et al. were written into the IERS Code in 1996. (2) Spherical harmonic function model, that is, spherical harmonic expansion of force source and calculation of shape variables combined with load Love numbers. For example, Longman [9,10], Farrell [11], Guo [12], etc. calculated the load off number of the isotropic earth model by using different methods based on Farrell theory. In addition, Xi [13] and Wu et al. [14] gave the theoretical model of the variation of the earth’s gravity field. (3) Load Green’s function, that is, the load is convoluted with the load Green’s function to obtain the load deformation. The essence of load Green’s function is the same as that of spherical harmonic function, and its prototype is derived from the theory of Caputo M et al. Based on Longman’s theory, the load Green’s function for calculating surface displacement, ground tilt, gravity and strain was derived, and the numerical solution of 1066 Earth model was calculated [15]. In the past decade, more and more scholars have studied the application of Green’s function. For example, Sun [16] studied Green’s function of atmospheric gravity. Refs. [17,18] compared the differences of the two Green’s functions calculated in Fourier space. Zhang et al. [19] derived the relationship between ground displacement and crustal stress change by using Green’s second internal integral formula, and discussed the calculation of earth stress field change by using the change rate of ground displacement. Shen et al. [20] compared the calculation accuracy of Green’s function and spherical harmonic function for surface displacement under surface fluid mass load. Wang et al. [21] used spherical harmonic transformation and load response theory to calculate the surface deformation of the surrounding area when the surface water storage migrated greatly. Li et al. [22] studied the vertical deformation of land water load in China over 10 months by using radial load Love numbers.
In recent years, there have been more and more studies on the application of load deformation theory to engineering examples. Wu et al. [23] studied the load effect of gravity field and crustal deformation based on the theory of elasticity. Xing et al. [24] studied the relationship between the water storage of the Three Gorges Reservoir and the activity of Xiannushan Fault. Akatsuka et al. [25] studied the seasonal response of continental water load in southern Alaska to crustal deformation; Gladkikh et al. [26] systematically analyzed the influence of atmospheric load on crustal deformation in New Zealand; Sun et al. [27] used the digital crustal deformation and tide data of Hubei Province from 2003 to 2013, and the wavelet analysis method, to study the response of crustal deformation observation data to various influencing factors of atmospheric environment change (atmospheric pressure, temperature, rainfall, typhoon and solar eclipse activity); Wang et al. [28], based on SRTM, used the water storage load model of the Three Gorges Reservoir area’s construction to study the response of surface gravity and deformation caused by water storage. The change of environmental load can cause the vertical displacement of tens of mm on the surface, and the influence on the horizontal displacement is 1/3 to 1/10 [29,30].
At present, load tides have become the main research field of scholars at home and abroad, and most of them focus on the changes in the geophysical field under the action of natural loads. Scholars involved include Zhang et al. [31]. Wang [32] took the Three Gorges Reservoir and cluster buildings as examples to study the geoid deformation caused by man-made loads. Based on previous studies, this paper is based on load tide theory, adopts load Green’s function, and uses actual data of Zhengzhou CBD cluster load buildings to calculate and analyze the geoid undulation, vertical crustal deformation, and its effect on elevation caused by the load of the building group.

2. Research Methods and Data Sources

2.1. Research Method of Cluster Load Effect

For a given internal structure model of the Earth (including the distribution of elastic parameters, density, gravity, etc.), the tidal deformation equation of the elastic (or rheological) earth can be solved theoretically by using elastic mechanics or rheological methods, which is the solid tide theory [33]. The classical tidal theory of the Earth is derived from an elastic earth model with spherical cambium distribution, self-gravitation, and non-rotation. Its numerical solution was first obtained by Takenuchi and developed by Molodensky, Altermon, Longman, and others. For rigid earth, the theoretical values of geoid tide, gravity earth tide, and tilt earth tide (astronomical longitude and latitude earth tide) can be calculated [34,35,36]. Load tide is the deformation of the earth under the action of surface load, and changes the earth’s gravity field, astronomical longitude, and latitude. Compared with the earth tides, the time function of the two tides are the same. The difference is that the earth tide is the direct effect, while the load tide is the indirect effect. The solution of earth tidal generating force is supported by relevant theories, while the solution of load tidal generating force relies more on the elastic structure of the earth crust. Since the Earth is not a real rigid body, in order to describe the elastic deformation of the Earth under the action of tidal forces, Love [37], in England, introduced two dimensionless numbers, h and k, in 1909. In 1912, T.Shida [38] of Japan introduced the third dimensionless, number L. These three numbers, collectively known as Love Numbers, are parameters that mark the internal characteristics of the Earth. They are the ratio of the tidal amount of the elastic earth to the rigid earth and can be used to describe the elasticity of the earth. H is the ratio of the radial displacement of the elastic earth tidal deformation (true earth tidal height) to the gravity level tidal height (theoretical earth tidal height); k is the ratio of the additional gravitational potential generated by the tidal deformation part of the elastic earth to the tide-generating potential. L is the ratio of the horizontal displacement of the elastic earth’s tidal deformation to the horizontal component of tidal generating force. The special feature of l is that it is the ratio of displacement to force, and the dimension is not uniform [34]. Hn is the ratio of the radial displacement of a point on the Earth under tidal level action to the radial displacement of the corresponding point when the earth is assumed to be in equilibrium tidal state. ln is the ratio of the tangential displacement of a point on the Earth under the action of tidal level to that of the corresponding point under the assumption that the Earth is in equilibrium tidal state. kn represents the ratio of the additional gravitational potential to tidal potential caused by the redistribution of density in the solid earth due to tidal deformation. Load Love number is related to the elasticity and density distribution of the earth’s internal structure and material, and it is used to describe the deformation of the solid elastic earth under the load of space-time changes. There are three quantities, hn′, ln′, and kn′, corresponding to Love numbers hn, ln, and kn respectively.
Subsequently, many people have studied different structures in detail. In view of the accuracy of current experimental observation techniques and the accuracy of tidal load correction, the global theoretical Love number is considered to be a known parameter value. In 1962, I.M.Long Man of University of California first introduced load Love number and Green’s function, and calculated load Love number from n = 20 to n = 40 using the Gutenberg Earth model in order to obtain load tide load Love number. However, due to the slow convergence rate, Farrell (1972) calculated the load Love number to 10,000 orders by changing the boundary conditions of the Love number. Since then, domestic and foreign scholars have found, on the basis of Longman and Farrell’s theory of load deformation, that the load Love values with higher order and precision are calculated by numerical calculation method.

2.1.1. Ground Deformation Caused by a Single Building

For the convenience of calculation, each building is considered as a point of mass, with the center of mass as its geometric center. As shown in Figure 1, in spherical coordinate system, O is the center of the earth, P(r1) is the calculation point, and r1 is the OP vector. r1 = (γ, ψ, λ), where r is the distance from point P to the center of the earth, ψ is codimension, and γ is longitude. Q(r2) is the centroid of the building, r2 is OQ vector, r2 = (γ′, ψ′, λ′), the mass of the building is m, s is the distance from point P to point Q, and the gravitational potential of point Q to point P is [39]:
v = G m | r 2 r 1 | = G m s
G is the universal gravitational constant. Expand 1/s according to Legendre polynomial to obtain:
ν = G m n = 0 | r 1 | n | r 2 | n + 1 P n ( c o s β )
Since P and Q are on the surface of the earth, R is the average radius of the Earth:
| r 1 | | r 2 | R
So there are:
ν = G m R n = 0 P n ( c o s β )
g = G M R 2
Substitute the Equation (5) into the above equation to obtain:
v = m g R M n = 0 P n ( c o s β )
According to the definition of load Love number, according to Equation (7), and the calculated load Love numbers hn, ln, and kn, the vertical displacement and horizontal displacement of point P caused by particle load Q are [40]:
u = n = 0 u n = u ( r ) P n ( c o s θ ) v = n = 0 v n = n = 0 v ( r ) θ P n ( c o s θ ) φ = n = 0 φ n = n = 0 Q ( r ) θ P n ( c o s θ )
{ u r = R m M n = 0 h n P n ( c o s β ) u θ = R m M n = 0 l n p n ( c o s β ) β
In the formula, the vertical displacement UR is positive upward, and the horizontal displacement UV is positive in the direction of increasing β Angle.
Gravity potential of undeformed Earth [41]:
φ ( θ ) = R M g 0 ( R ) n = 0 ( 1 + k n ) P n ( c o s θ )
The gravity perturbation potential on the deformed earth’s surface is:
φ ( θ ) = R M g 0 ( R ) n = 0 ( 1 + k n h n ) P n ( c o s θ )
According to the asymptotic property of load Love number, when n is large, the load numbers hn′ and nln′ are constant. According to Farrell definition (11), the vertical displacement of P caused by particle load Q can be written as a Kummer transform (12) by using the asymptotic value of hn′.
l i m n { h n n l n n k n } = { h l k }
u r = R m h M n = 0 P n ( c o s β ) + R m M n = 0 ( h n h ) P n ( c o s β )
The sum of the first term in the formula can be obtained:
n = 0 P n ( c o s β ) = 1 2 s i n 1 β 2
The second term of Equation (13) approaches zero after a finite number of terms.
n > N , h n h
u r = R m h 2 M s i n β 2 + R m M n = 0 N ( h n h ) P n ( c o s β ) R m h 2 M s i n β 2
According to the RN factor method used to calculate the load Love number under the SNREI earth model calculated by Zhang et al. [39], it can be seen that when n = 13,000, the calculation accuracy reached the requirement.
Using the asymptotic property of nln′, the horizontal displacement of point P caused by particle load Q can be expressed as:
u θ = R m l M n = 1 1 n P n ( c o s β ) β + R m M n = 1 ( n l n l ) 1 n P n ( c o s β ) β
The sum formula of the first term in the formula can be obtained according to the spherical harmonic function:
n = 1 1 n P n ( c o s β ) β = c o s β 2 ( 1 + 2 s i n β 2 ) 2 s i n β 2 ( 1 + s i n β 2 )
u θ = R m l M c o s β 2 ( 1 + 2 s i n β 2 ) 2 s i n β 2 ( 1 + s i n β 2 ) + R m M n = 1 N ( n l n l ) 1 n P n ( c o s β ) β R m l M c o s β 2 ( 1 + 2 s i n β 2 ) 2 s i n β 2 ( 1 + s i n β 2 )
The second term in Equation (18) tends to zero after a finite number of terms.
In the analysis of geoid variation caused by building load, the change of gravity level at ground point under surface load was first calculated by Green’s function. The gravity variation of deformed surface depends on three factors: the direct attraction of particle load, the change of internal density field, and the deformation of earth surface. Combining these three factors, the gravity change function can be obtained as [42]:
δ g = m g 0 M n = 0 [ n + 2 h n ( n + 1 ) k n ] P n ( c o s β )
On the deformable ground, according to the progressive load Love number, h is substituted for h n , and ( n + 1 ) k n substituted for ( n + 1 ) k n , and the change of gravity at point P under load is obtained as follows:
δ g = m g 0 M n = 0 ( n + 2 h k ) P n ( c o s β ) + m g 0 M n = 0 [ 2 ( h n h ) ( n + 1 ) k n + k ] P n ( c o s β )
According to the properties of spherical harmonic function,
{ n = 0 P n ( c o s β ) = 1 2 s i n 1 β 2 n = 0 n P n ( c o s β ) = 1 4 s i n 1 β 2
Thus, Equation (21) can be simplified as:
δ g = m g 0 4 M s i n ( β 2 ) ( 1 + 4 h 2 k ) + m g 0 M n = 0 N [ 2 ( h n h ) ( n + 1 ) k n + k ] P n ( c o s β )
The gravity perturbation potential on the deformed earth’s surface is:
v ( θ ) = m R M g 0 ( R ) n = 0 ( k n h n ) P n ( c o s θ )
Therefore, the total displacement generated by point P is:
ϕ = ν + ν
The fluctuation of geoid is obtained according to Bruns formula [43]:
δ h = ϕ g = G m g R n = 0 P n ( c o s β ) ( 1 + k n h n )
Substitute the Equation (5) into the above equation, then:
δ h = ϕ g = m R M n = 0 P n ( c o s β ) ( 1 + k n h n )
According to the load tide theory, the derivative of the gravitational potential to the horizontal direction is the horizontal component of the gravitational change, which is represented by the tilt change of the geoid, δ Λ . It was previously determined that the sum of the gravitational potential generated by the building load Q on point P and the additional response potential of the ground is:
ϕ = ν + ν = G m R n = 0 ( 1 + k n h n ) P n ( c o s β )
δ Λ = 1 g R ϕ β
According to Equation (29), the total inclination of the geoid at point P is:
δ Λ = G m g R 2 n = 0 ( 1 + k n h n ) P n ( c o s β ) β
Substitute the Equation (5) into the above equation, then:
δ Λ = m M n = 0 ( 1 + k n h n ) P n ( c o s β ) β

2.1.2. Calculation Model of Ground Deformation and Geoid Change Caused by Cluster Load

It is necessary to calculate the total vertical and horizontal ground displacements of observation points caused by many buildings. Since the vertical displacements are in the same direction, the total ground vertical displacements of observation points caused by all buildings can be obtained by adding them together.
δ u r = δ u r
Horizontal displacement directions are not identical. The building of the horizontal displacement observation point cannot be directly together. So, first of all, we choose east-west and north-south directions at our observation sites. Second, the horizontal displacement of the point caused by each building is decomposed into east-west and north-south directions. Third, the east-west and north-south components are added separately. Fourth, it is synthesized according to the principle of vector addition. Finally, the total horizontal displacement of the observation point is obtained.
Suppose the azimuth of PQ is A, then:
{ u λ = u ν s i n ( A ) u ϕ = u ν c o s ( A )
A can be solved by spherical triangle, as shown in Figure 2:
A = a r c t g c o s φ s i n ( λ λ ) c o s φ s i n φ s i n φ c o s φ c o s ( λ λ )
When the gaussian plane coordinates of two points are known, A can be directly obtained by calculating the azimuth angle from the coordinates of two points. The total horizontal displacement of observation points caused by the whole building group can be expressed as:
u = ( u γ ) 2 + ( u φ ) 2
The horizontal displacement angle can be calculated according to the displacement of east-west and north-south, namely:
α = a r c t g μ λ 1 μ φ 1 + { 0 π 2 π
The total displacement change of observation point caused by the urban architectural group is equal to the sum of the displacement change of observation point caused by each building. The geoid fluctuation caused is the sum of the geoid fluctuation caused by each building:
δ h = δ h i
The inclination of the tilt is:
δ Λ = δ Λ i

2.2. Data Source

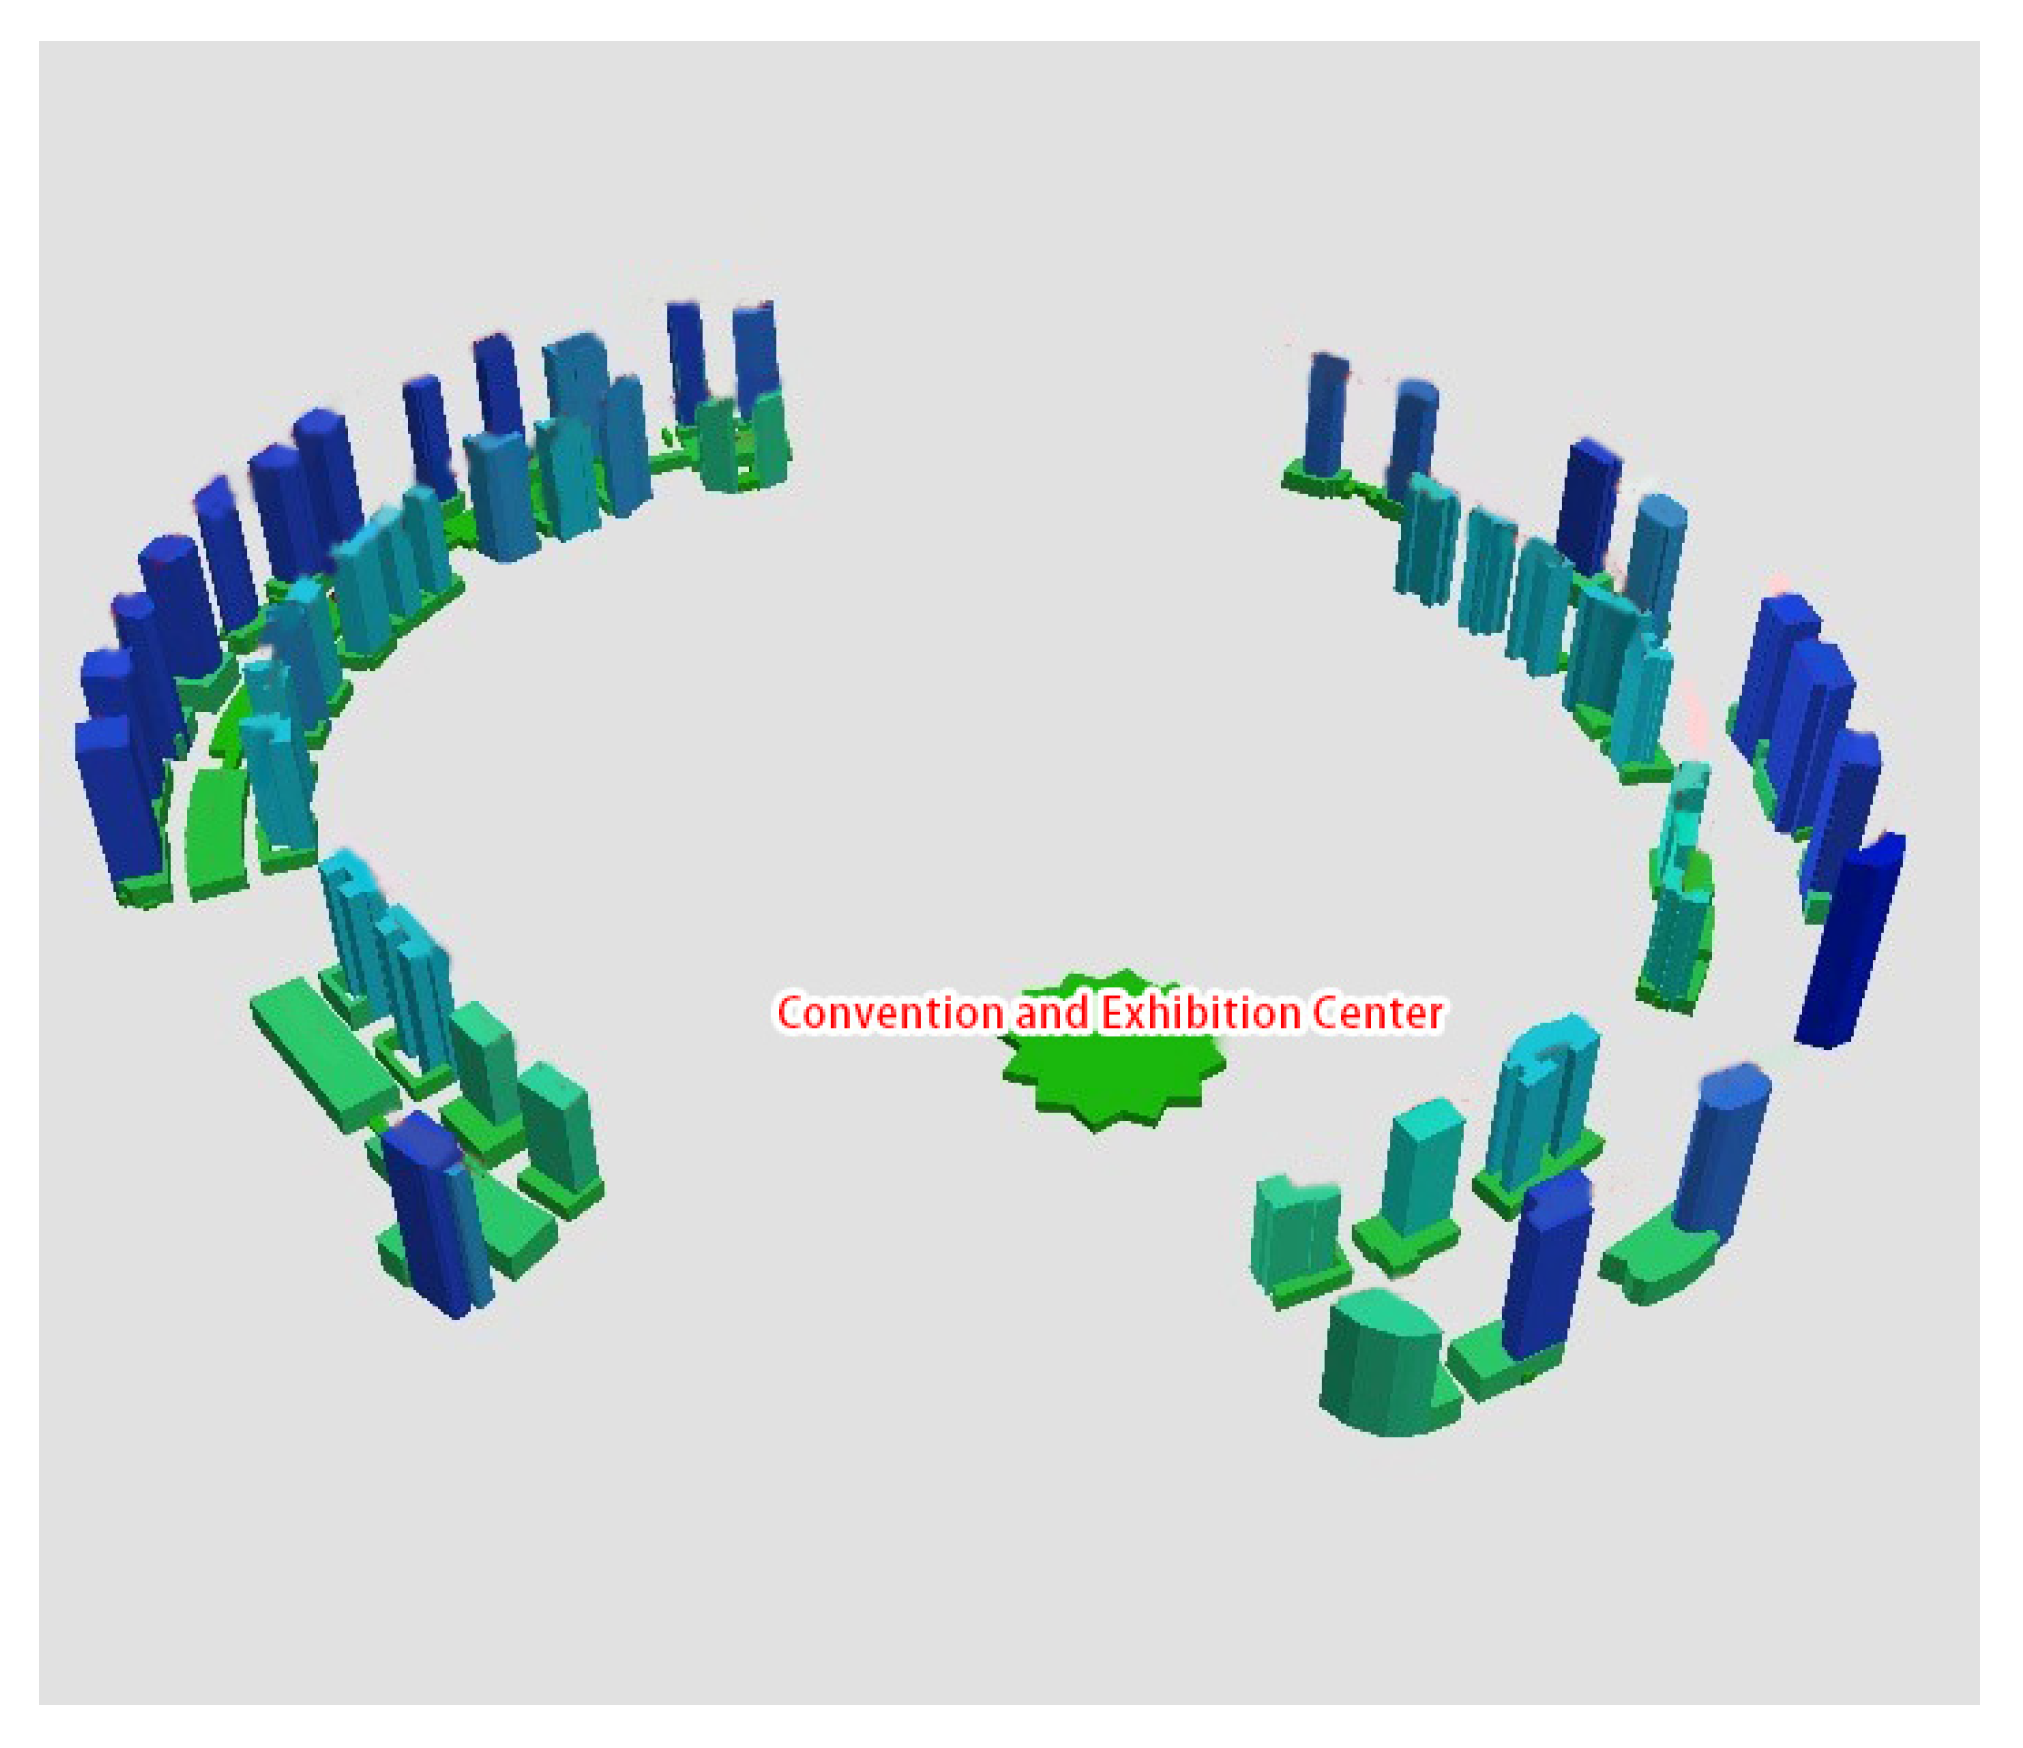
According to the data provided by the Surveying and Mapping Institute of the Bureau of Geology and Mineral Resources of Henan Province, Zhengzhou Millennium Plaza Minsheng Bank is used as an example to calculate the impact of the independent single building on the ground and geoid. The height of the building is 180 m. The single-story building area is 1560 m2, and the weight of the building is 112,300 tons. When analyzing the cluster load effect, the International Convention and Exhibition Center of Zhengzhou Millennium Plaza was used as the target to calculate the deformation of the ground and geoid under the load of 58 cluster buildings in Millennium Plaza (Figure 3).

2.3. Counting Process

According to the calculation formula in Section 2.1, Equations (15) and (18) were adopted for vertical displacement and horizontal displacement generated by single buildings on the ground. Equations (26) and (30) were adopted for geoid fluctuation and inclination. Equation (31) can calculate the vertical displacement produced by cluster load on Zhengzhou Millennium Square International Convention and Exhibition Center. Equation (34) can calculate the horizontal displacement produced by cluster load on Zhengzhou Millennium Square International Convention and Exhibition Center. Equation (36) can calculate the geoid fluctuation caused by cluster load on Zhengzhou Millennium Square International Convention and Exhibition Center. Equation (37) can calculate the geoid tilt caused by cluster load on the International Convention and Exhibition Center in Zhengzhou Millennium Square. It can be seen from the above formula that vertical displacement, horizontal displacement, fluctuation of geoid, and inclination of geoid are proportional to the earth radius, R, building mass, M, and the corresponding load Love number. The earth mass, M, building, and the target body and the core of the angle β are inversely proportional. The included angle β can be converted by the latitude and longitude of the building and the target body, and is directly related to the distance between the building and the target body. Given the earth radius, R, and the earth mass, M, the corresponding load Love number was found by substituting the building mass, M, and the distance, R, between the building and the target body into the above formula. Table 1 and Table 2 show the calculations.

3. Result Analysis

3.1. Analysis of Ground Deformation and Stress Change Caused by Single Building

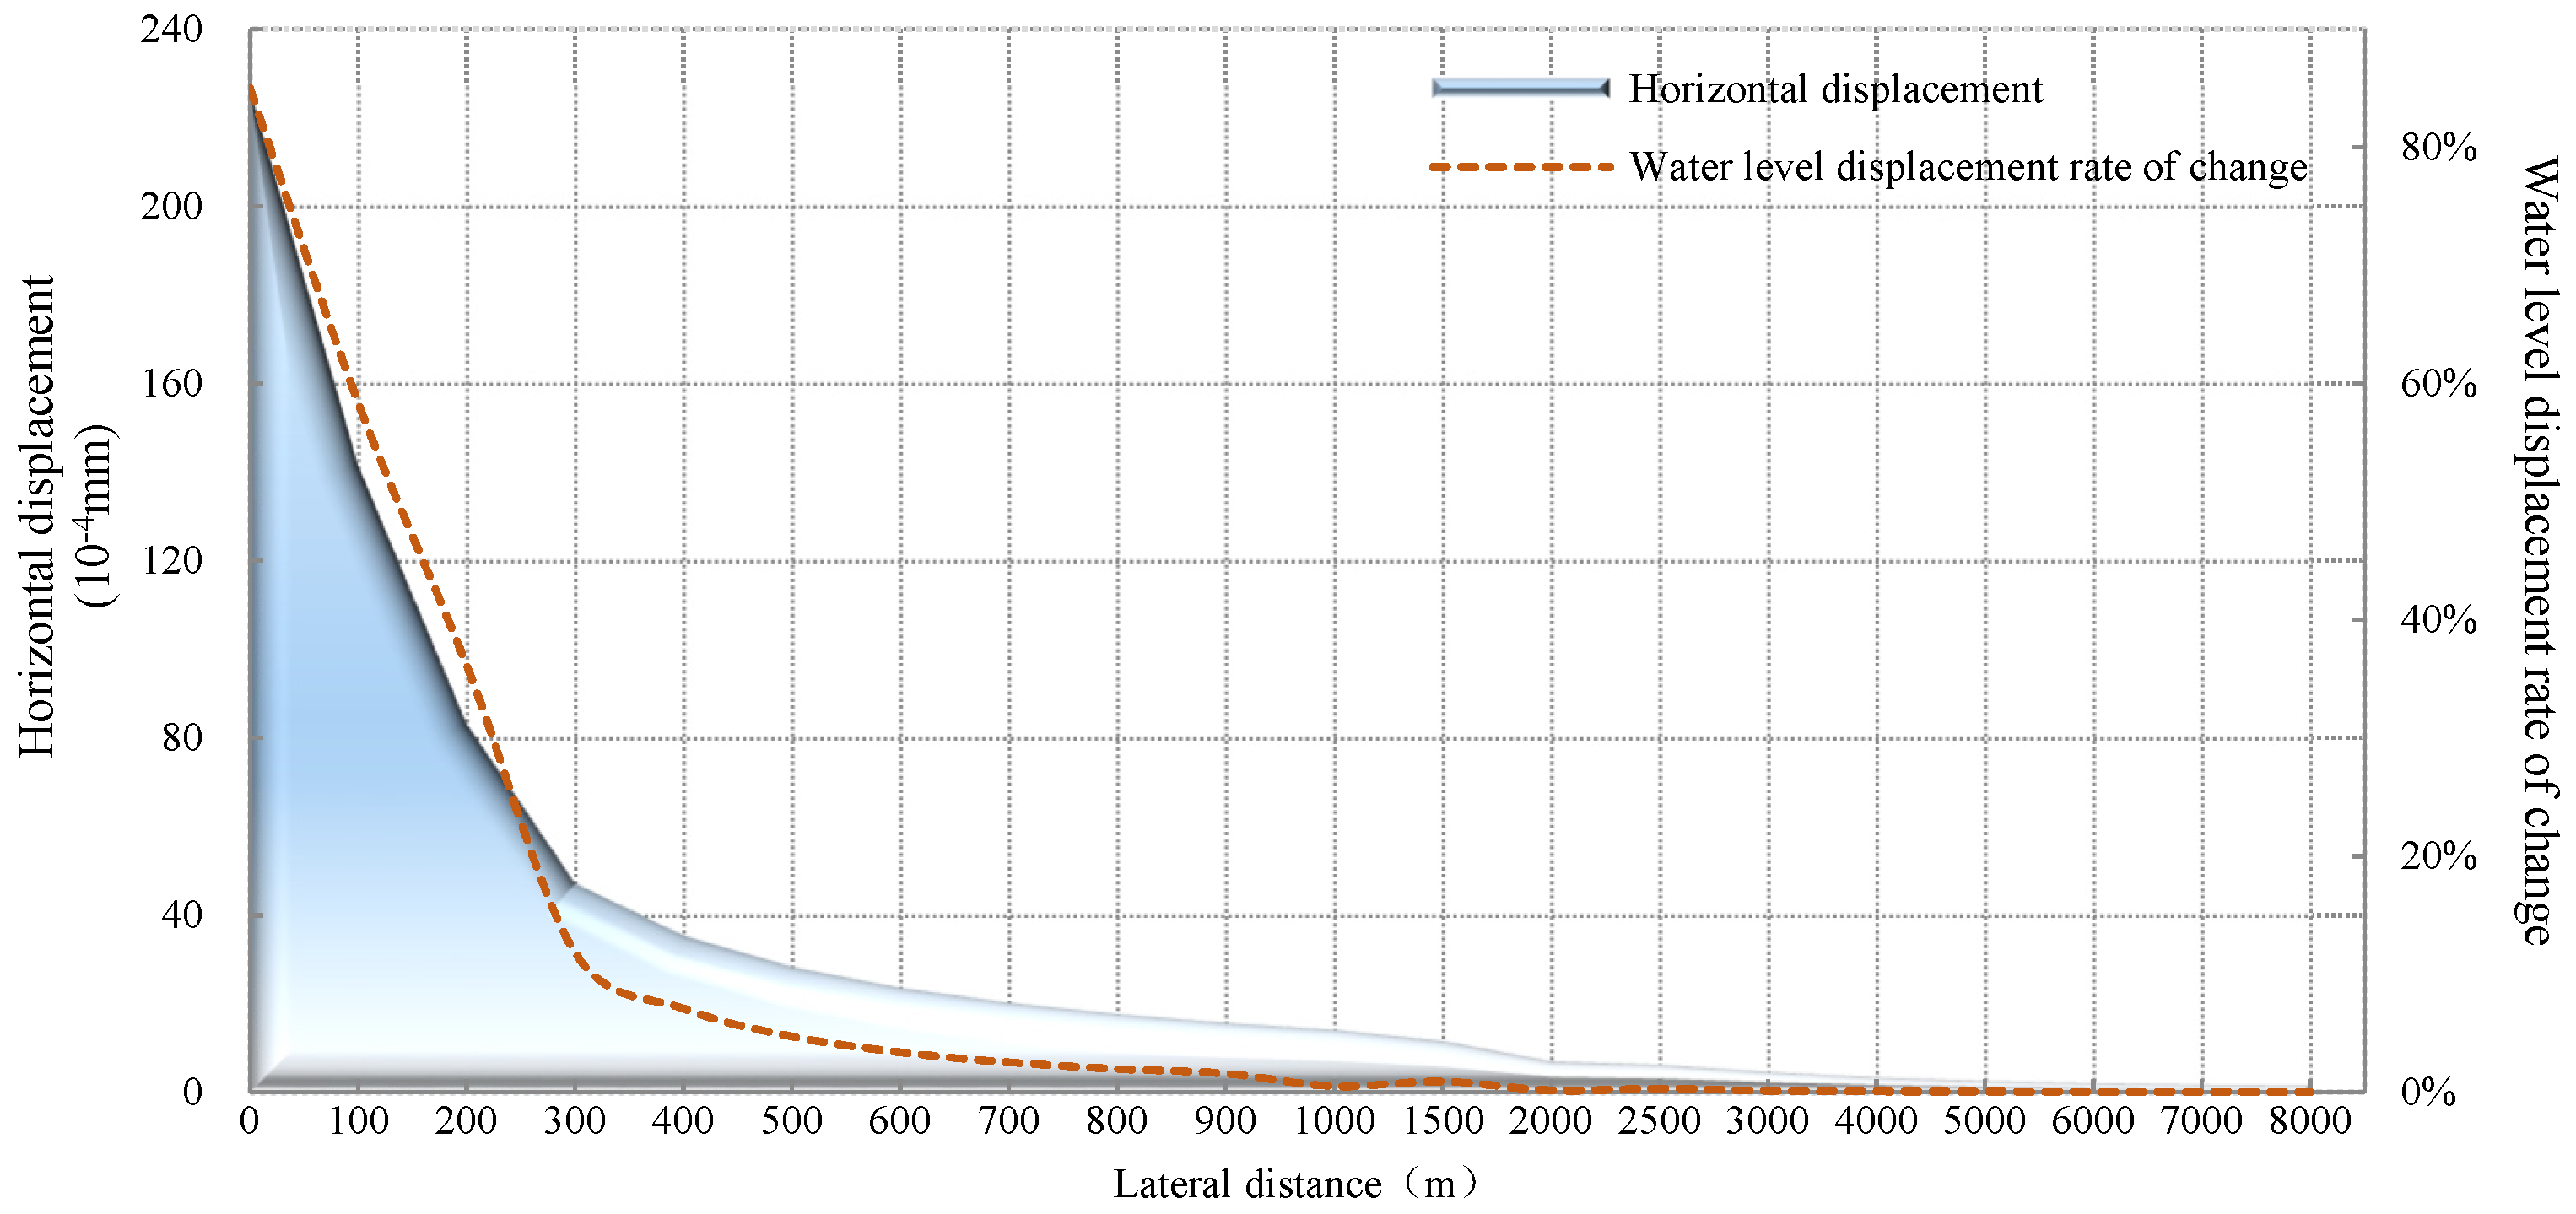
The horizontal displacement at 100 m distance from Minsheng Bank was the largest, at 0.01417 mm; the horizontal displacement at 8000 m was the smallest, at 0.026 mm (Table 1). The maximum change rate of horizontal displacement was 70.84%, which gradually decreased to 0.02%, within 500 m from the ground of Minsheng Bank. The displacement change rate was the most obvious, decreasing from 70.84% to 4.7%; in the range of 500–1000 m, the change rate decreased from 4.7% to 0.5%, and the trend slowed down significantly. After 1000 m, the values of the horizontal displacement change rate were all less than 0.5%, and the changes were not obvious (Figure 4).
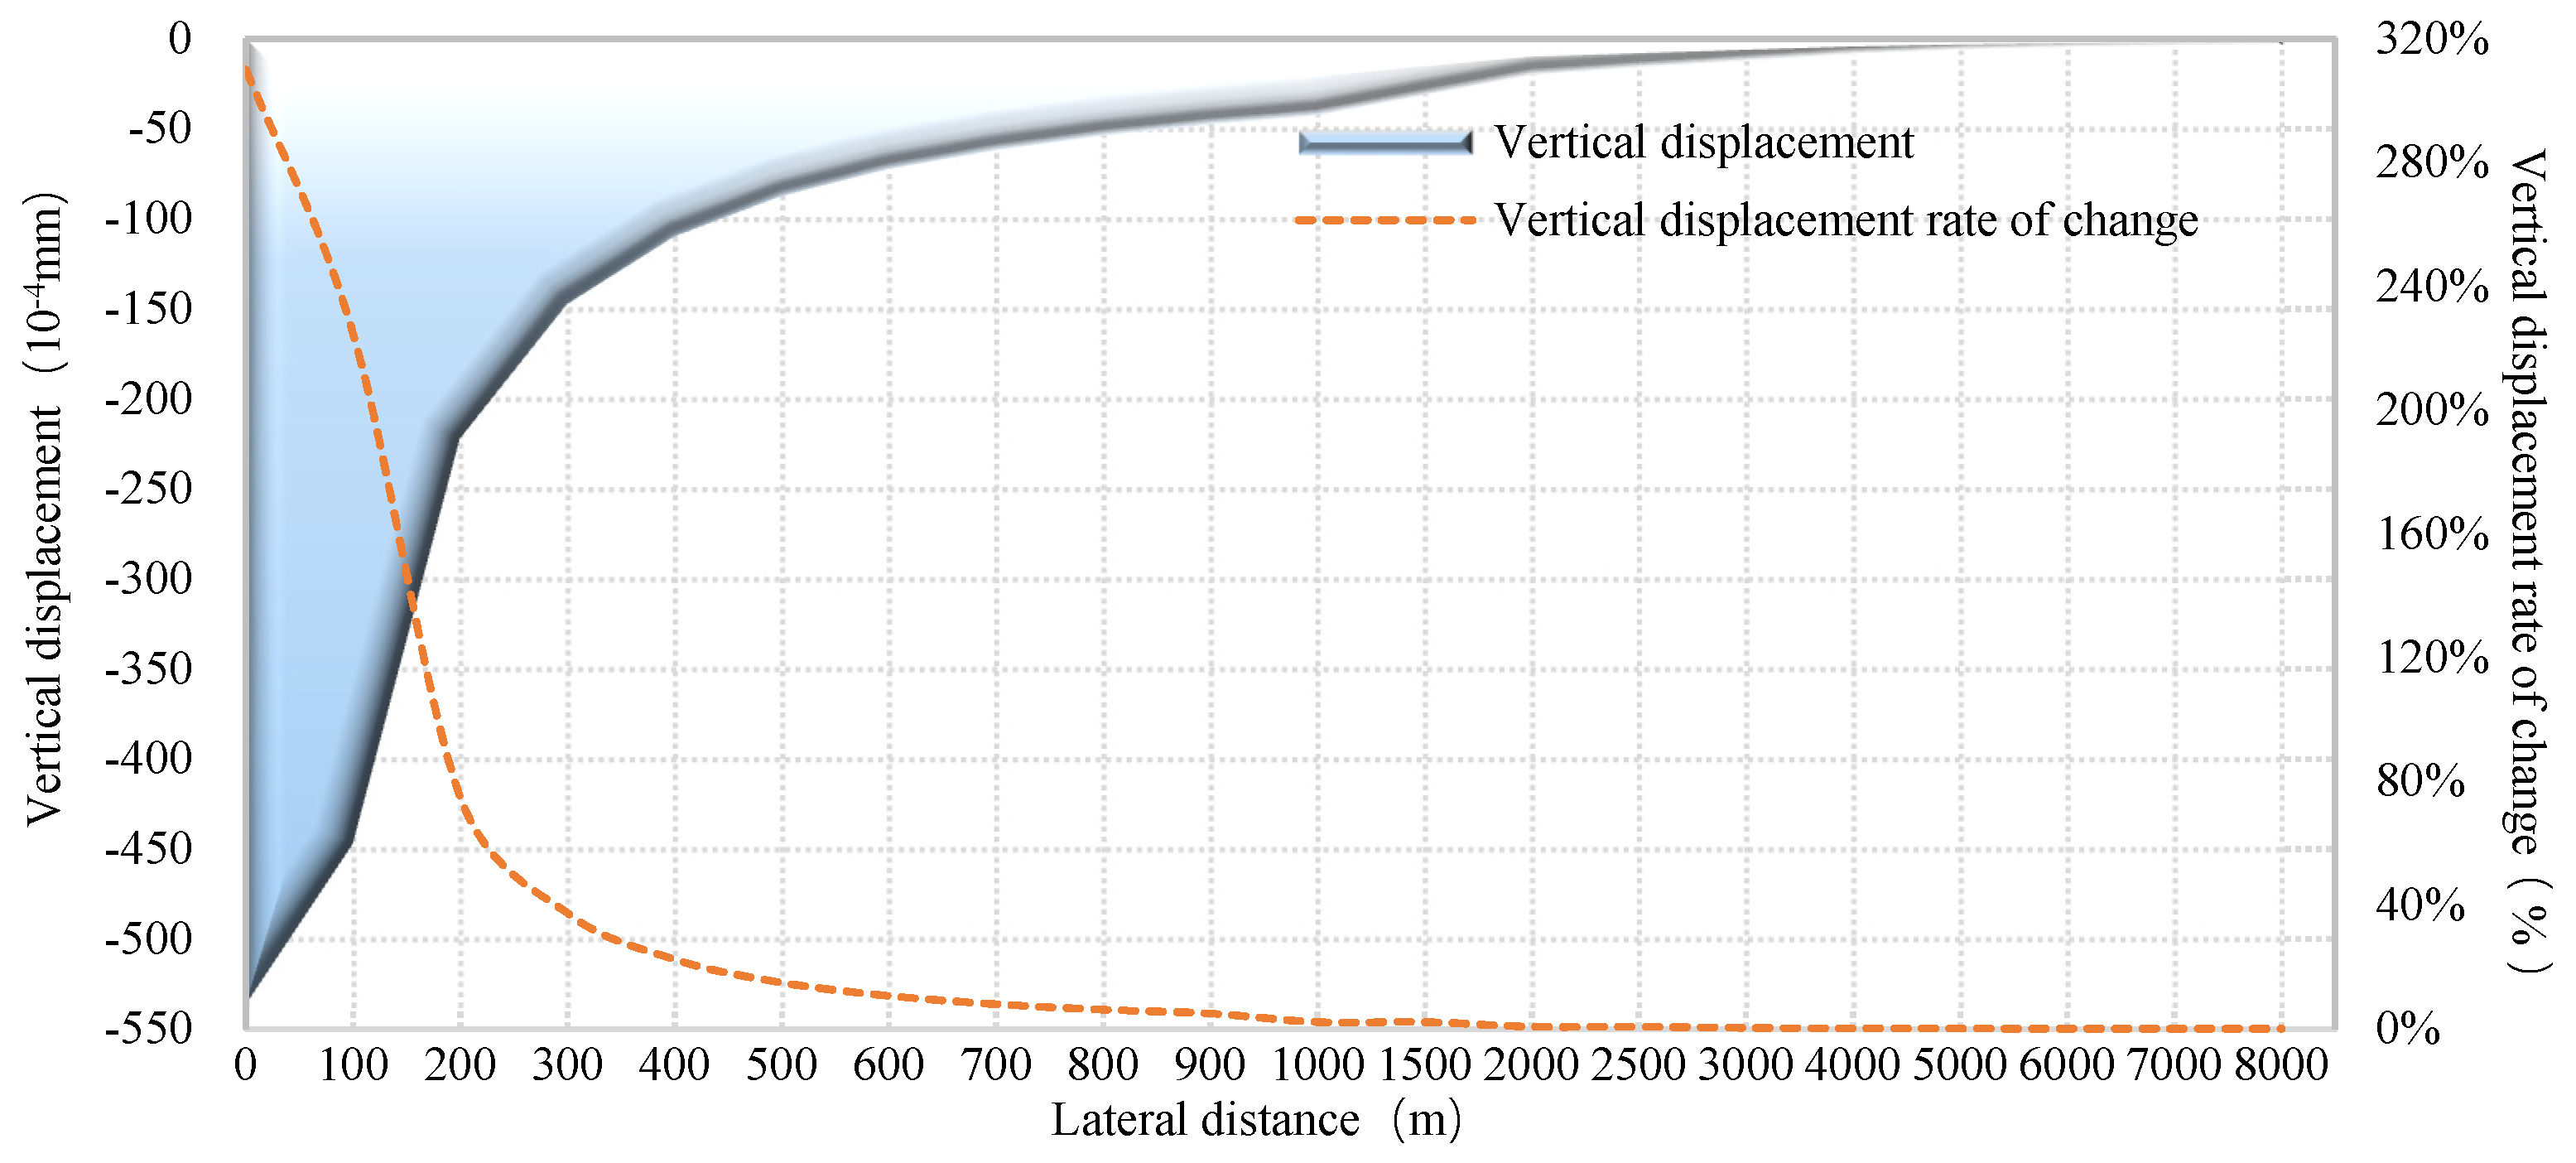
The maximum vertical displacement at 100 m from the Minsheng Bank was 0.0447 mm, and the farthest vertical displacement at 8000 m was 0.000378 mm (Table 1). The maximum vertical displacement change rate of 225% was gradually reduced to 0.05%, and the distance from the ground of Minsheng Bank was within 500 m. The vertical displacement change rate was the most obvious, decreasing from 225% to about 15%; within the range of 500–1000 m, the vertical displacement’s rate of change decreased from 15% to 2%, and the trend was obviously slowed; within the range of 1000–2000 m, the value of the rate of vertical displacement decreased from 2% to 0.7%; after 2000 m, the rate of change of vertical displacement was less than 0.7%, and the change was not obvious (Figure 5).
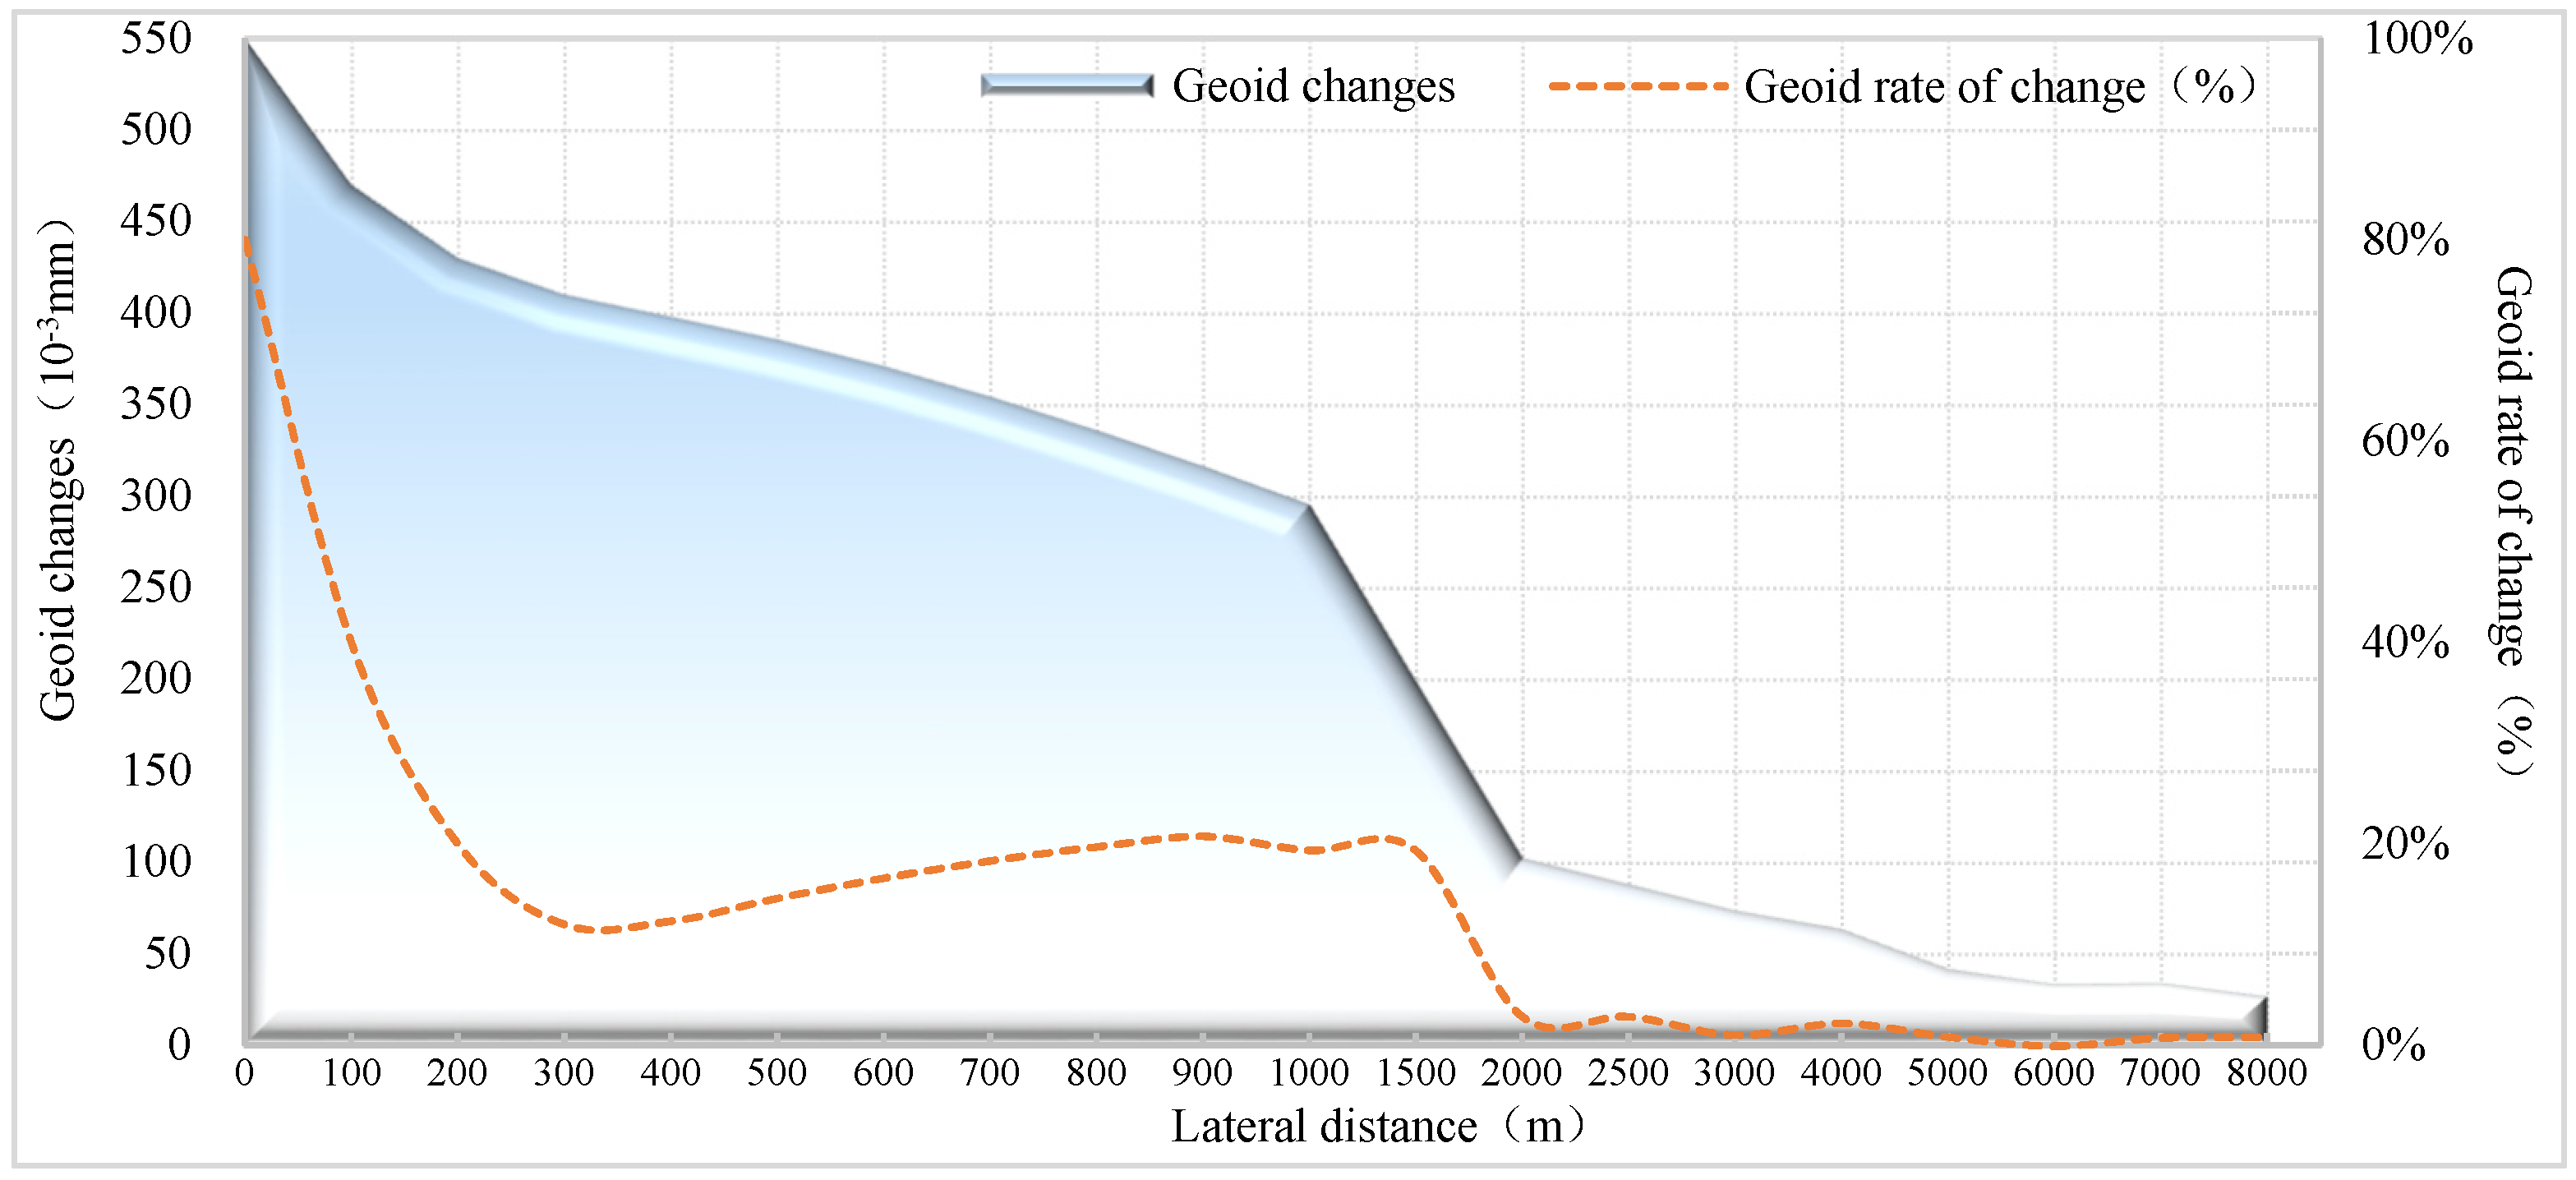
The geoid fluctuates the most at the nearest 100 m from the Minsheng Bank, which was 0.47 mm, and the vertical displacement at the farthest 8000 m was 0.026 mm (Table 1). The maximum geoid undulation rate was gradually reduced to 0.21%, and the distance from the ground of Minsheng Bank was within 300 m. The geoid undulation rate was the most obvious, decreasing from 80% to about 12%; within the range of 300–1500 m, the vertical displacement’s rate of change hovered around 15–20%, and the rate of change was not large, indicating that the change of the geoid no longer dropped sharply, but was relatively slow; within the range of 1500–3000 m, the fluctuation rate of the geoid increased again, indicating that the region’s geoid undulations increased; the undulation rate of the geoid outside the 3000 m range was close to smooth (Figure 6).

3.2. Analysis of Nearby Ground Deformation and Gravity Changes Caused by Cluster Loads

The maximum horizontal displacement caused by the CBD cluster building load on the center was the Zhongchuliang Building (Table 2), with a distance of 310 m from the ground of the center, a building height of 140 m, and a bottom area of 1955 m2, resulting in a horizontal displacement of 0.0064 mm; the minimum horizontal displacement generated by the center was Dennis 6 Tiandi, which was 1100 m from the center of the ground, the height of the building was 12 m, and the bottom area was 1240 m2. The amount of horizontal displacement caused was 0.0001 mm (Figure 7 and Figure 8).
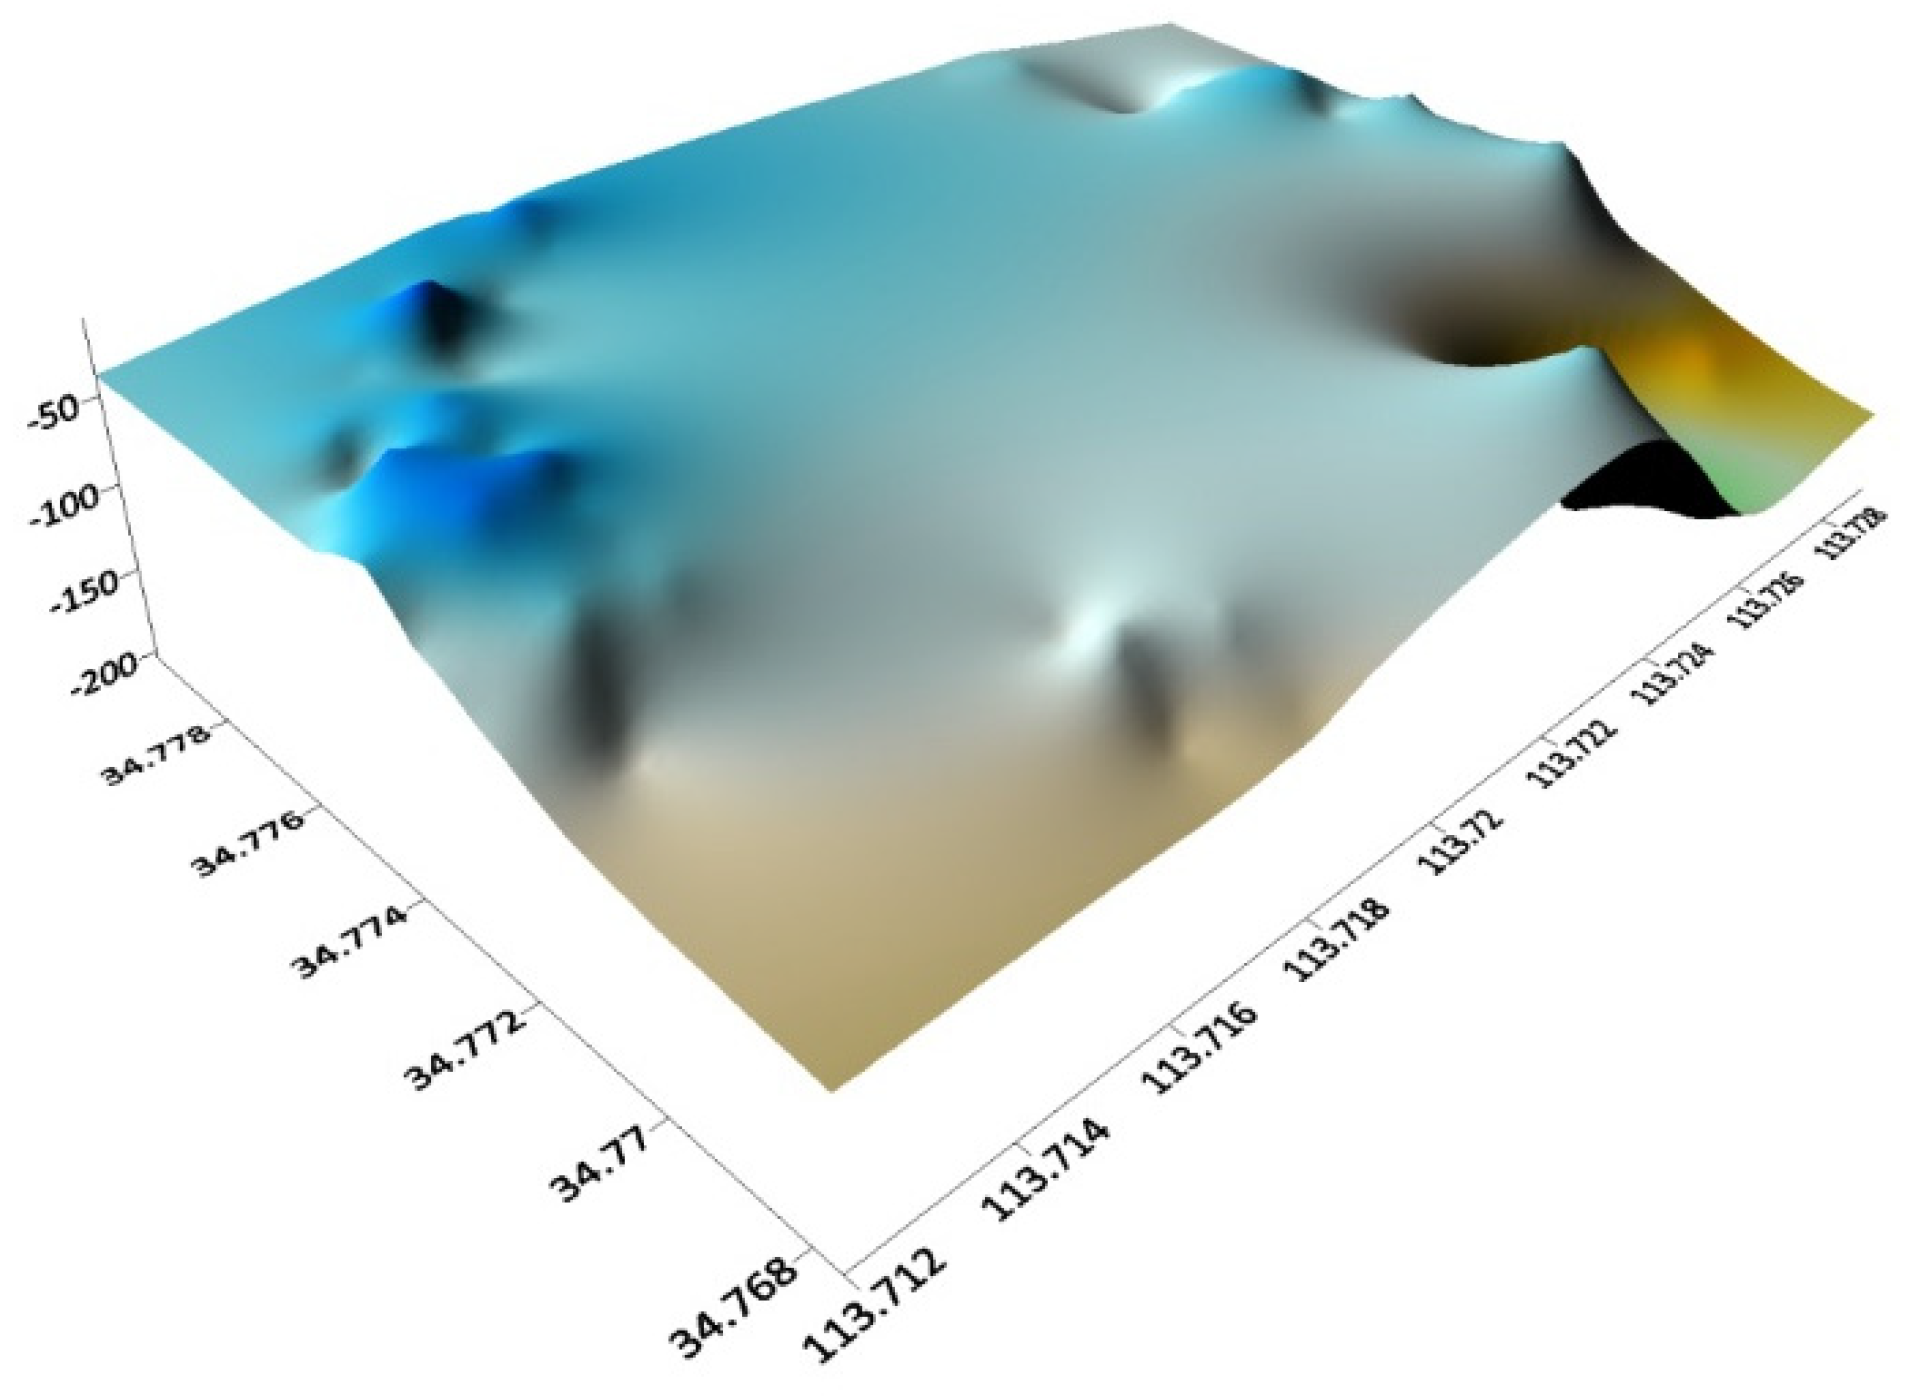
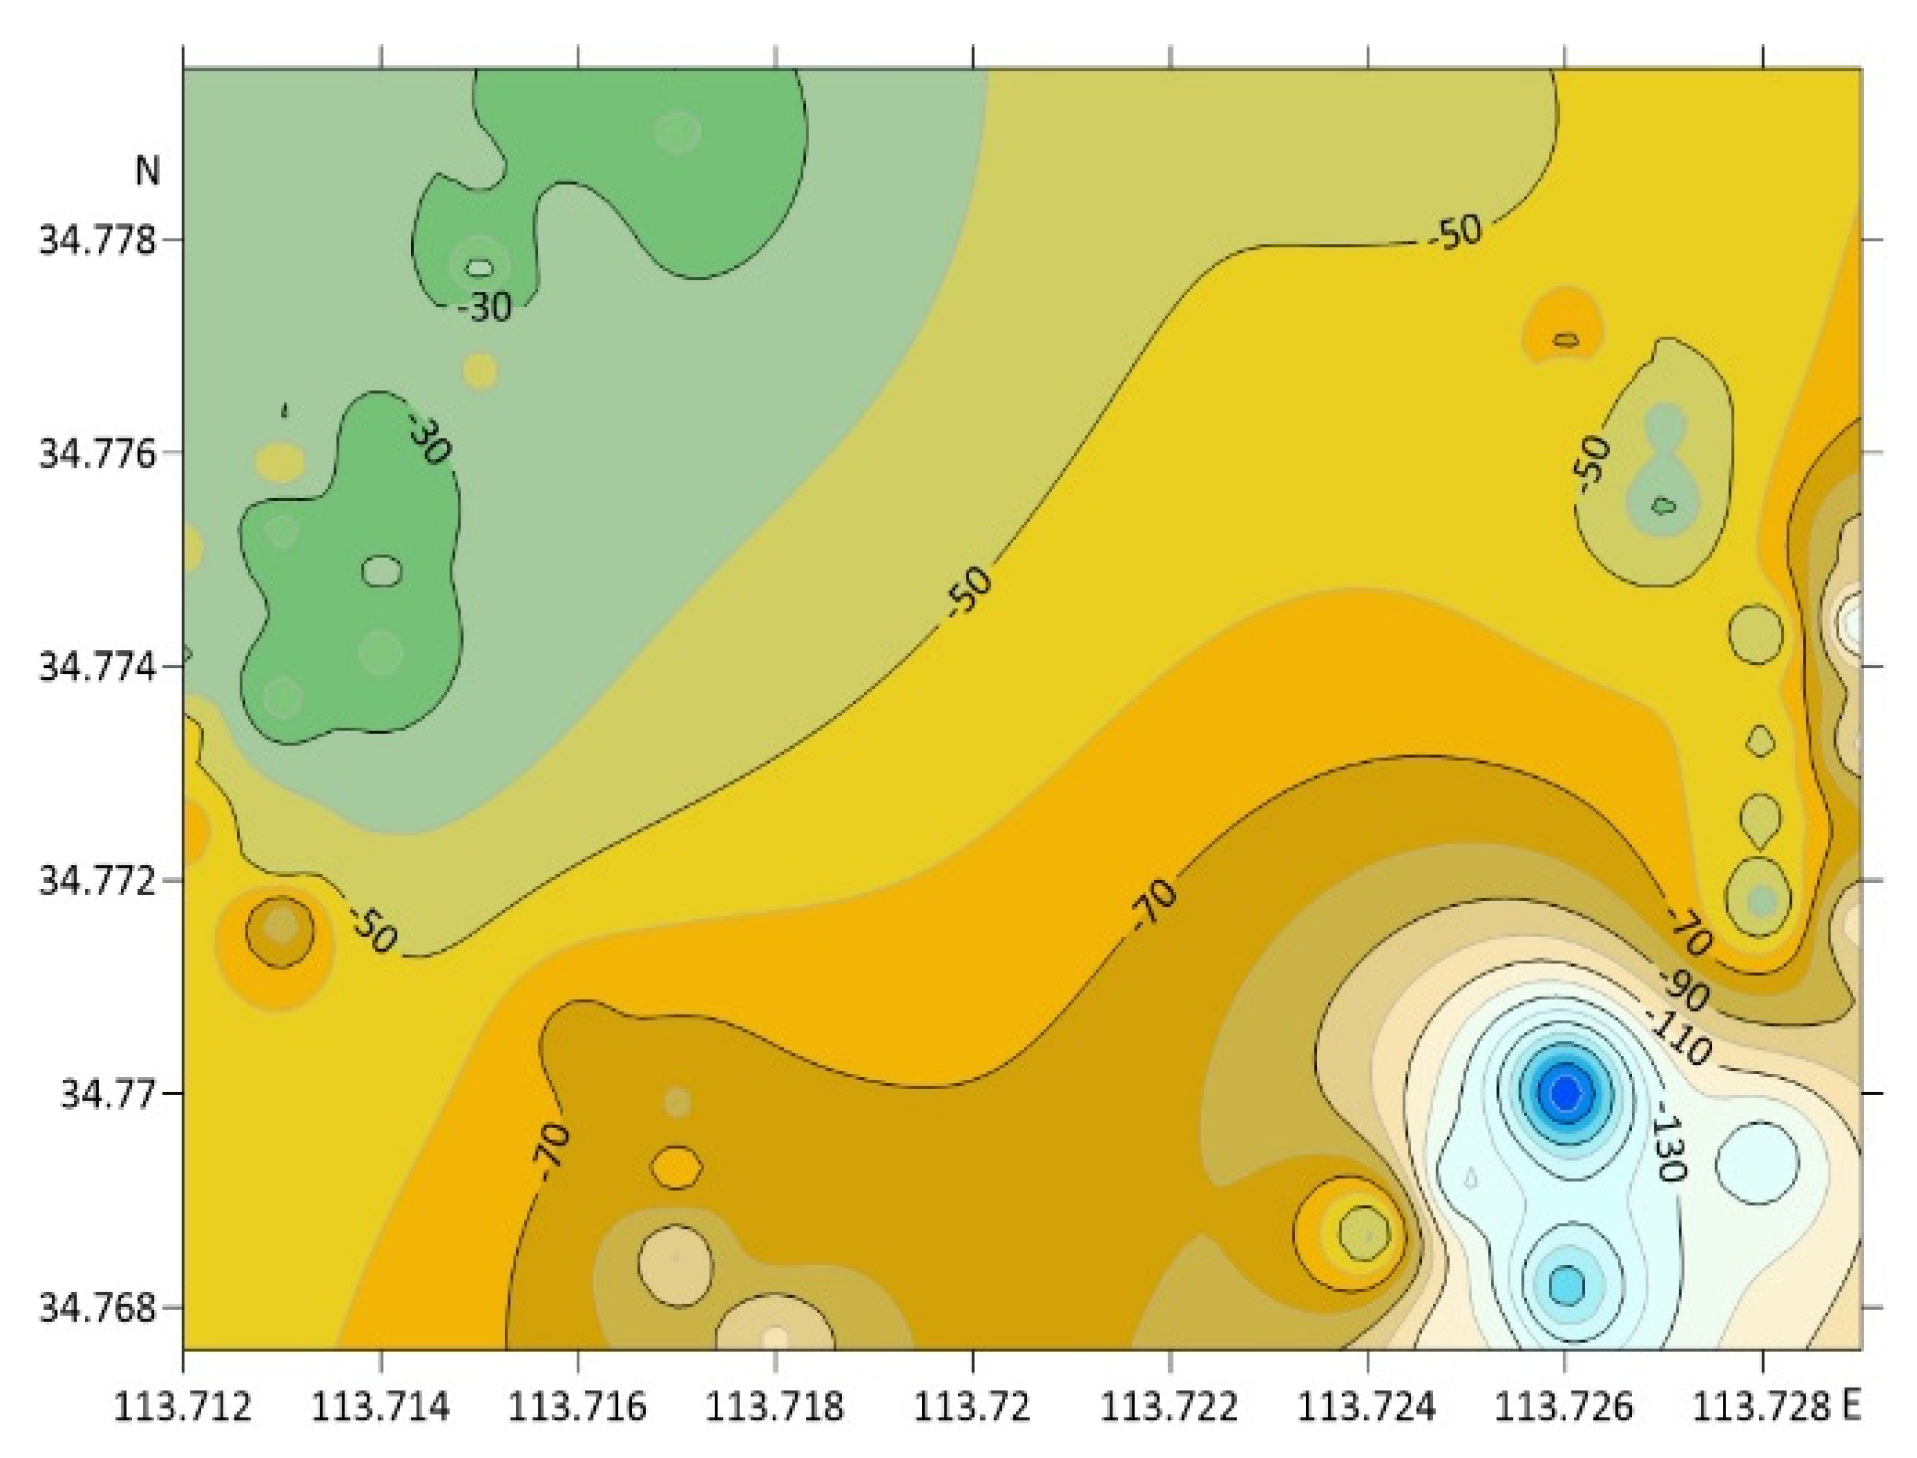
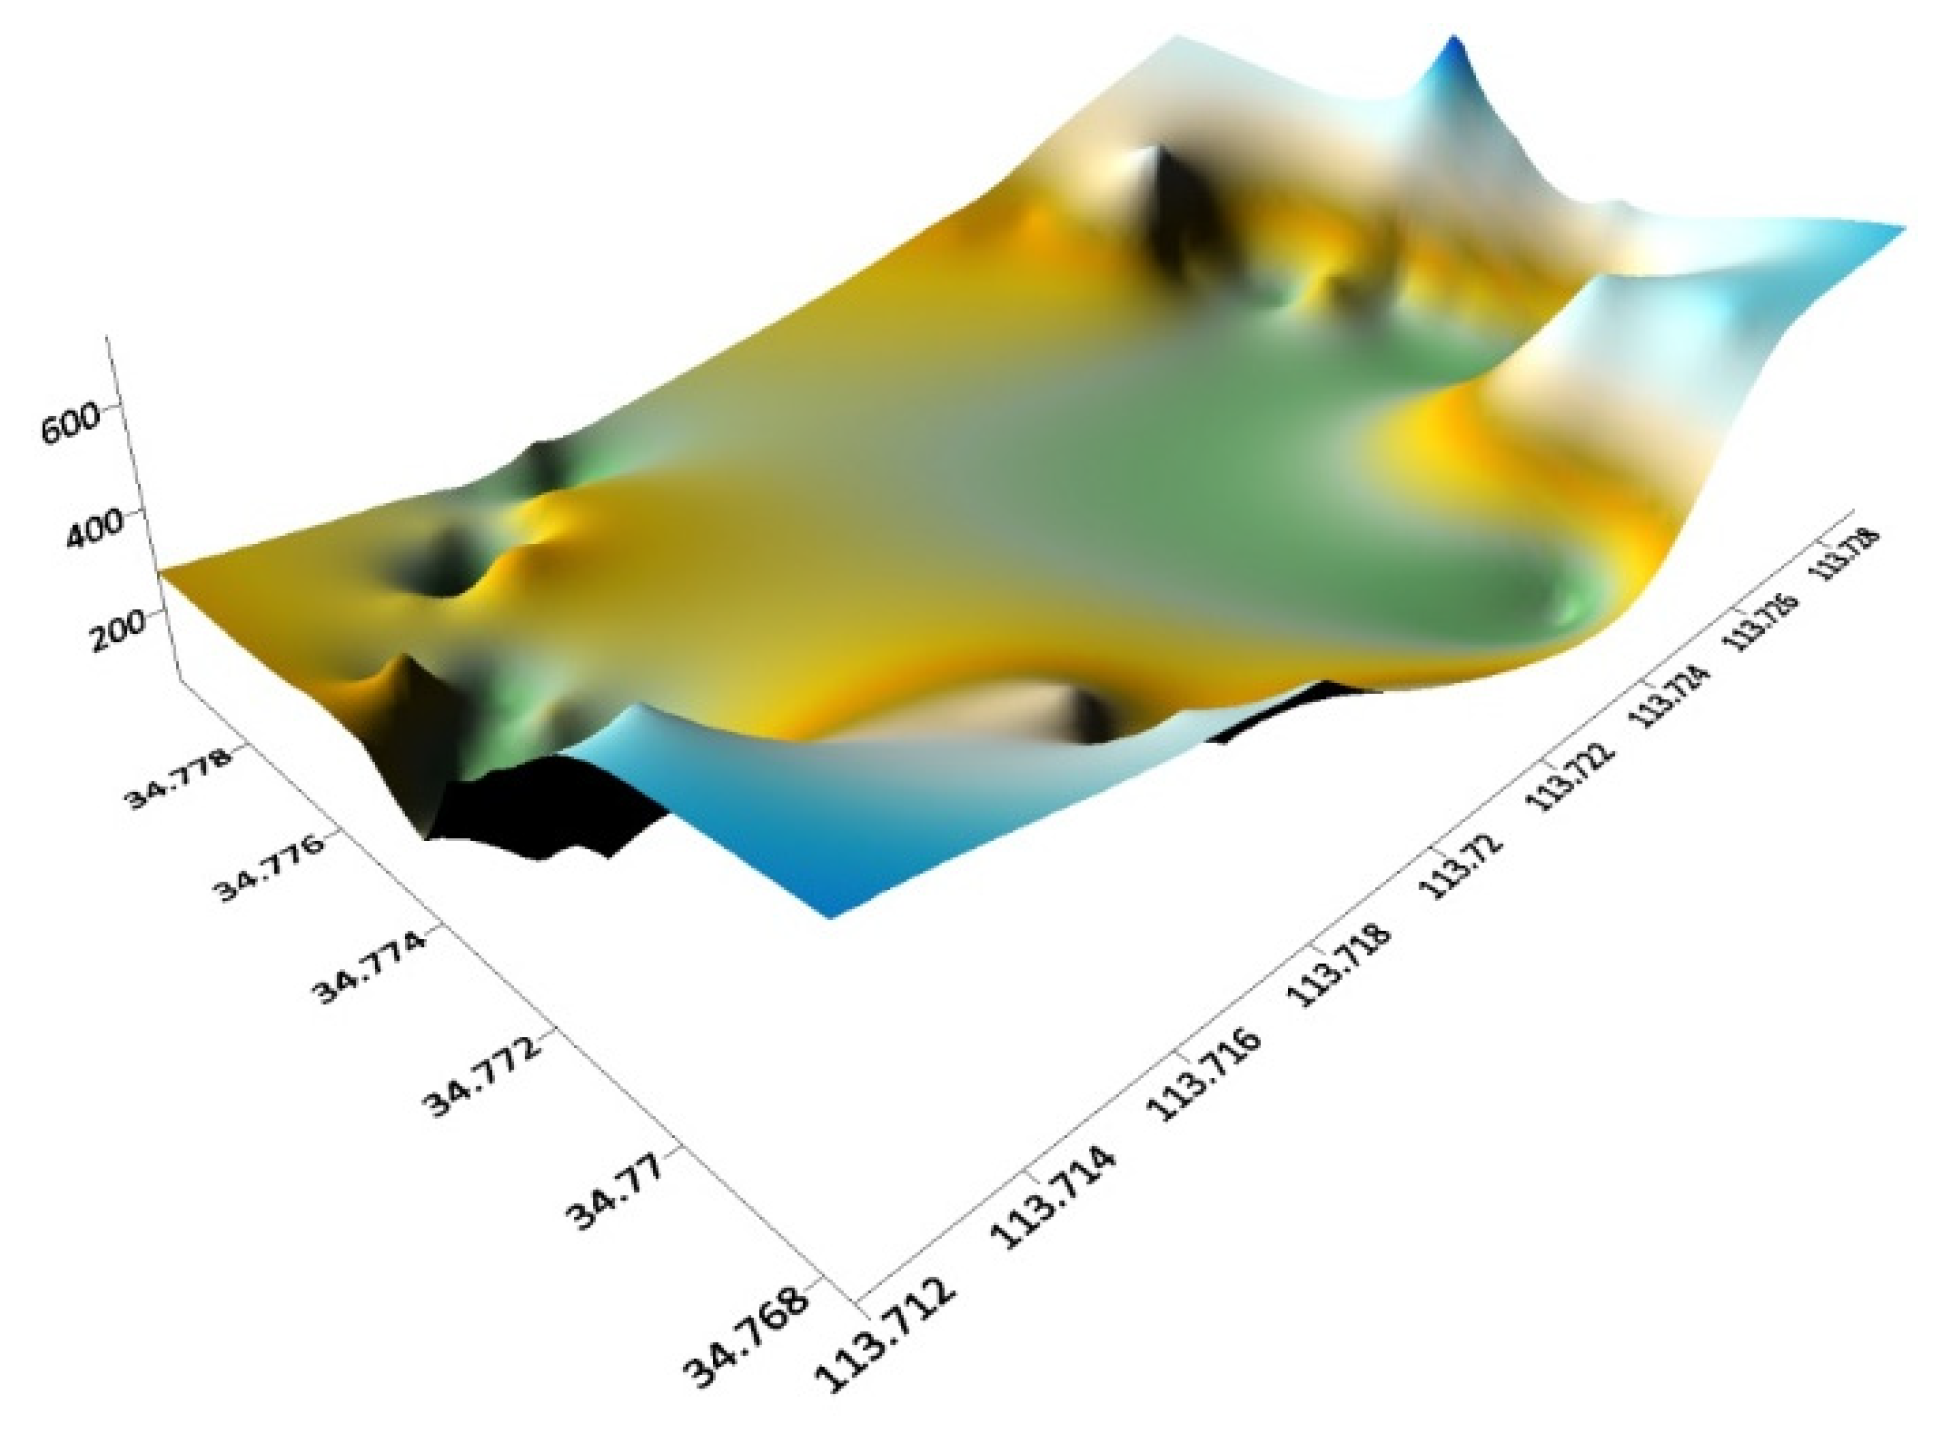
The maximum vertical displacement caused by the CBD cluster building load on the center was the Zhongchuliang Building (Table 2), and the vertical displacement caused by it was −0.0208 mm; the minimum vertical displacement caused by the center was Dennis 6 days, and the vertical displacement was −0.0003 mm (Figure 9, Figure 10 and Figure 11).
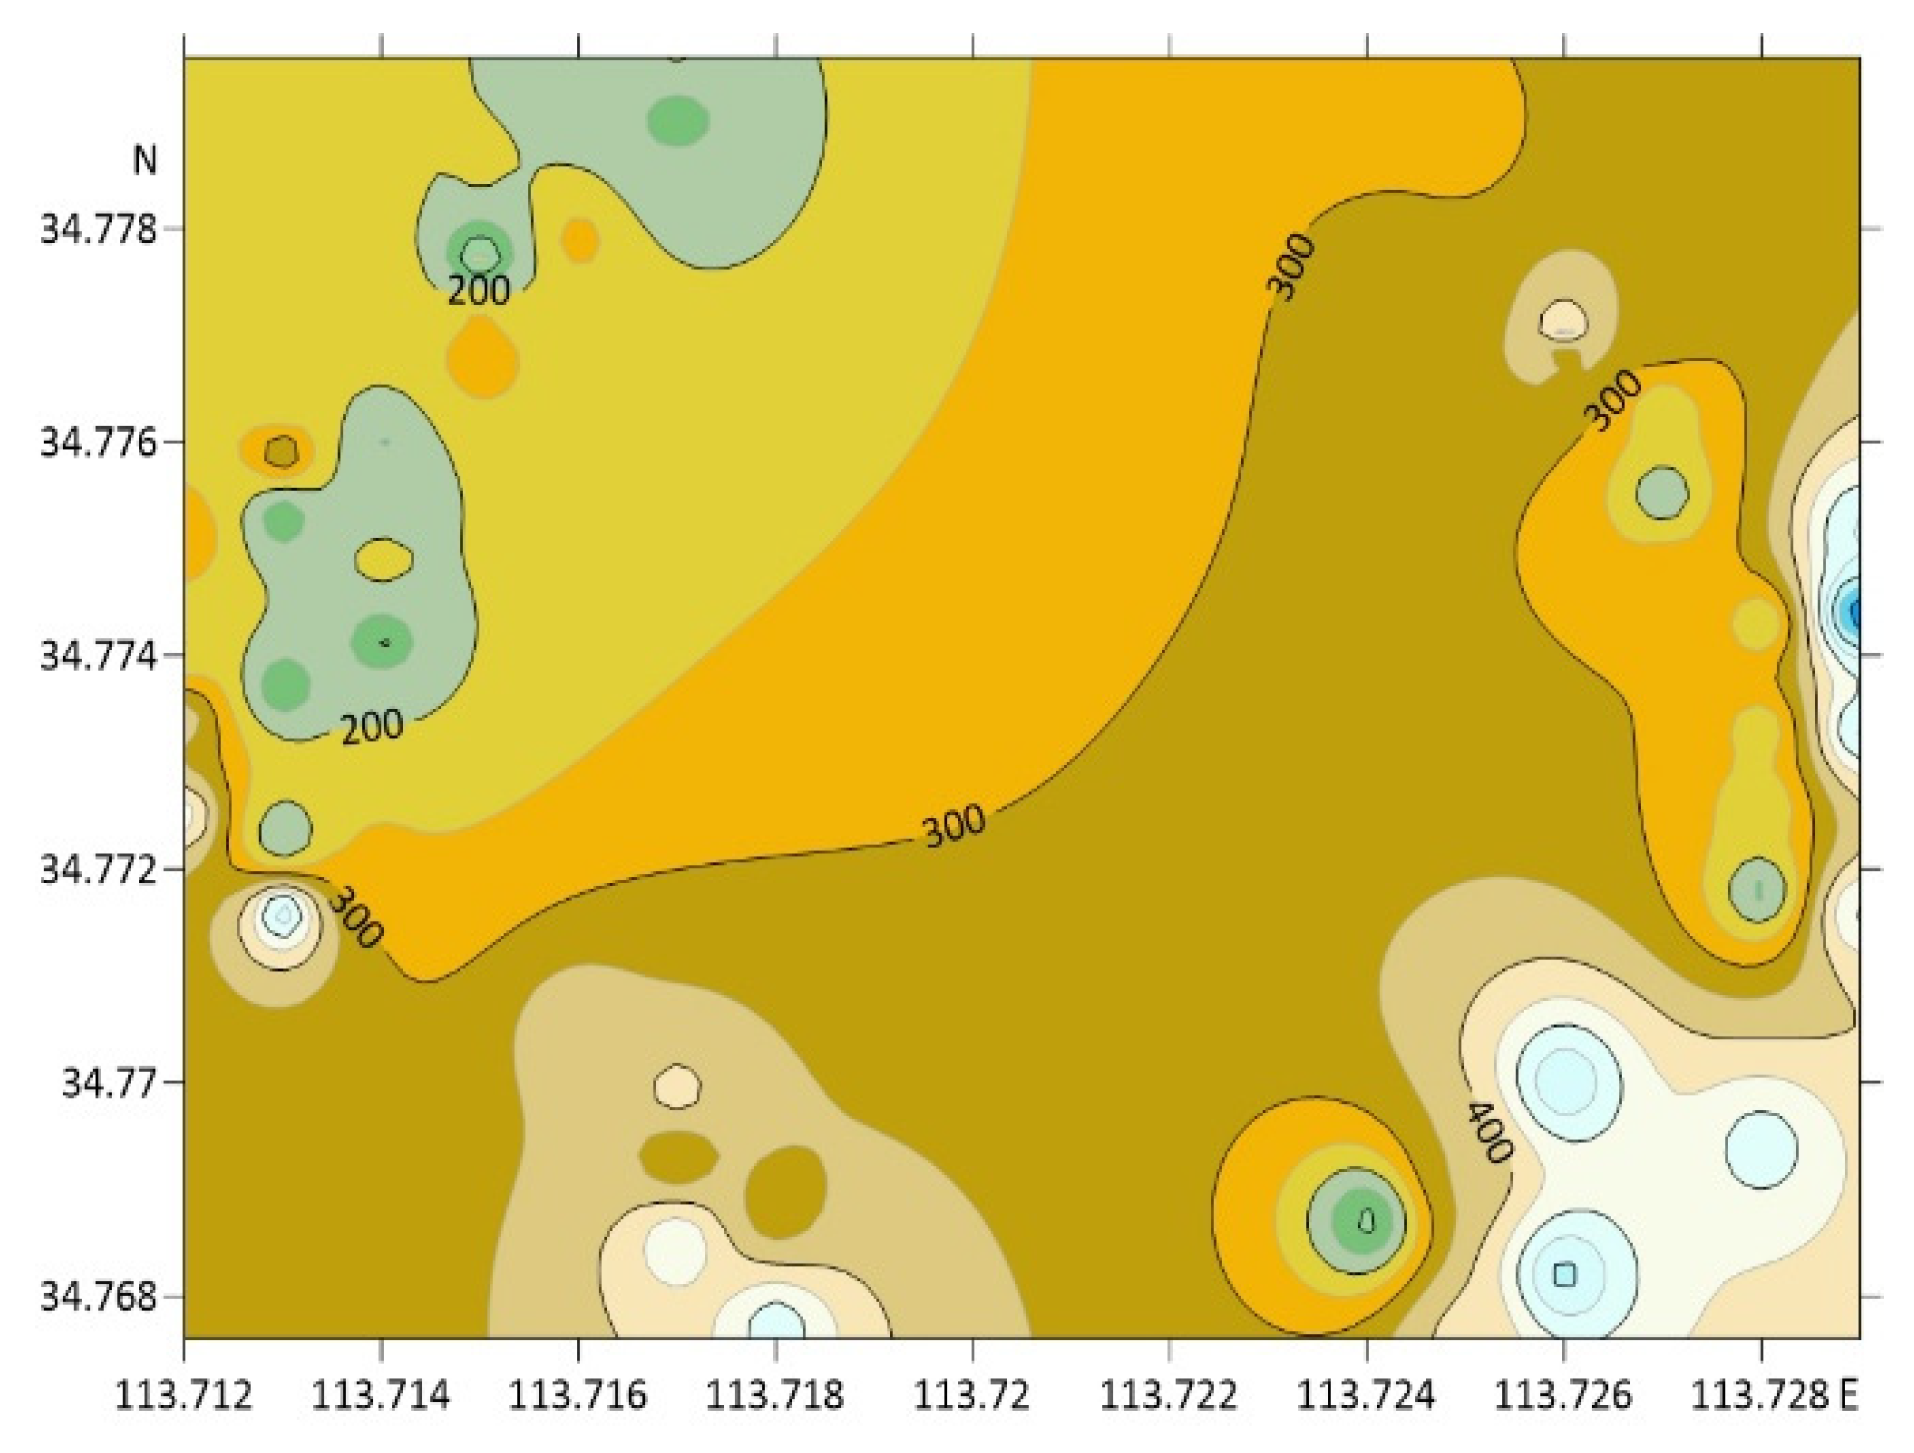
The maximum geoid undulation of the CBD cluster building load to the center was PICC Building (Table 2), which was 680 m from the center of the ground, the height of the building was 186 m, and the bottom area was 2140 m2, and the vertical displacement caused by it was 0.741 mm; the smallest geoid undulation produced by the center was Dennis 6 heaven and earth, and the vertical displacement caused by it was 0.021 mm (Figure 12 and Figure 13).
The maximum geoid inclination displacement caused by the CBD cluster building load on the center was the International Chamber of Commerce Building (Table 2). The displacement amount was −0.084 s; the smallest amount of geoid tilt to the center was Dennis 6, and the amount of geoid tilt caused was −0.031 s (Figure 14 and Figure 15).
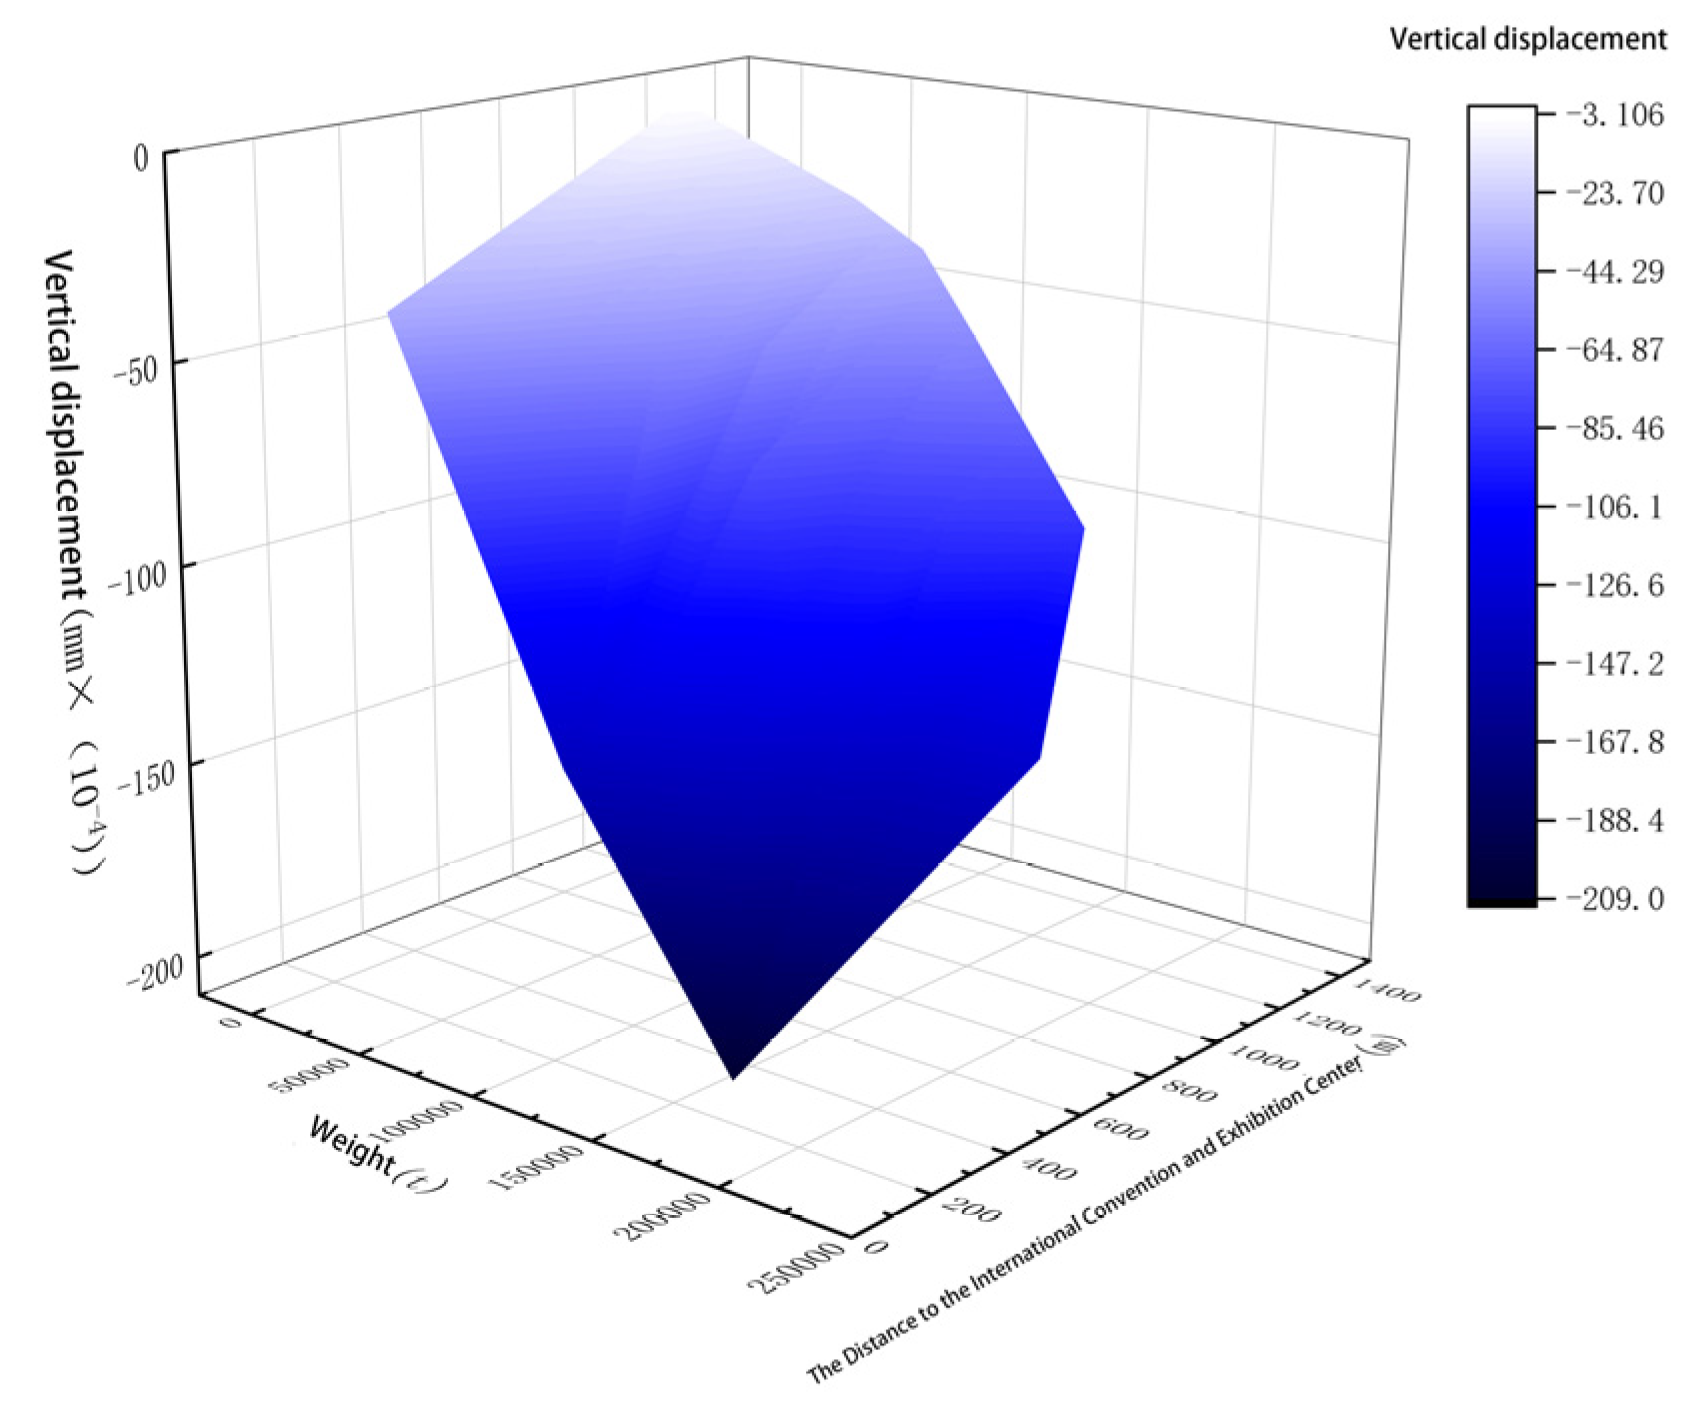
The impact of the CBD cluster building load on the displacement of the International Convention and Exhibition Center was centered on the International Convention and Exhibition Center, and the influence of each building was superimposed on each other to form a decreasing horizontal displacement belt (Table 2). For the International Convention and Exhibition Center, the cumulative horizontal displacement was 0.1027 mm, the cumulative vertical displacement was −0.3275 mm, the cumulative earth undulation was 17.217 mm, and the cumulative earth inclination was −1.8 s. Figure 6 is a three-dimensional diagram of the vertical displacement of the International Convention and Exhibition Center. In the horizontal and vertical coordinate system of the main image factors, and the weight of the building and the distance to the International Convention and Exhibition Center, the vertical displacement is the z coordinate. It can be seen that the vertical displacement was toward the International Convention and Exhibition. The center position is gradually increasing, and the direction is constantly changing.

3.3. Discussion and Verification

This paper uses the actual measured data of the CBD cluster building load in Zhengzhou to calculate the horizontal displacement, vertical displacement, geoid undulation, and geoid inclination of the International Convention and Exhibition Center. The resulting horizontal displacement was 0.1027 mm; the resulting vertical displacement was −0.33 mm; the caused geoid undulation was 17.22 mm; the inclination of the geoid was −1.87 s. Wang [32] and others used the data provided by the Shanghai Institute of Surveying and Mapping to calculate the impact of the Shanghai urban building complex on the surface of the earth and the geoid in Shanghai and its surrounding areas. The calculation results show that under the load of the Shanghai building complex, the maximum vertical displacement of the ground was −1.3269 mm, the maximum undulation of the geoid caused by the building complex was −0.25 mm, and the maximum elevation change was 1.1052 mm. Through comparative analysis, under the action of the load of the building group, the horizontal displacement, vertical displacement, undulation of the ground, and the change of the ground inclination of the ground gradually decreased with the increase of the distance to the target; at the same time, it also decreased with the building group itself. The weight increased and gradually strengthened.
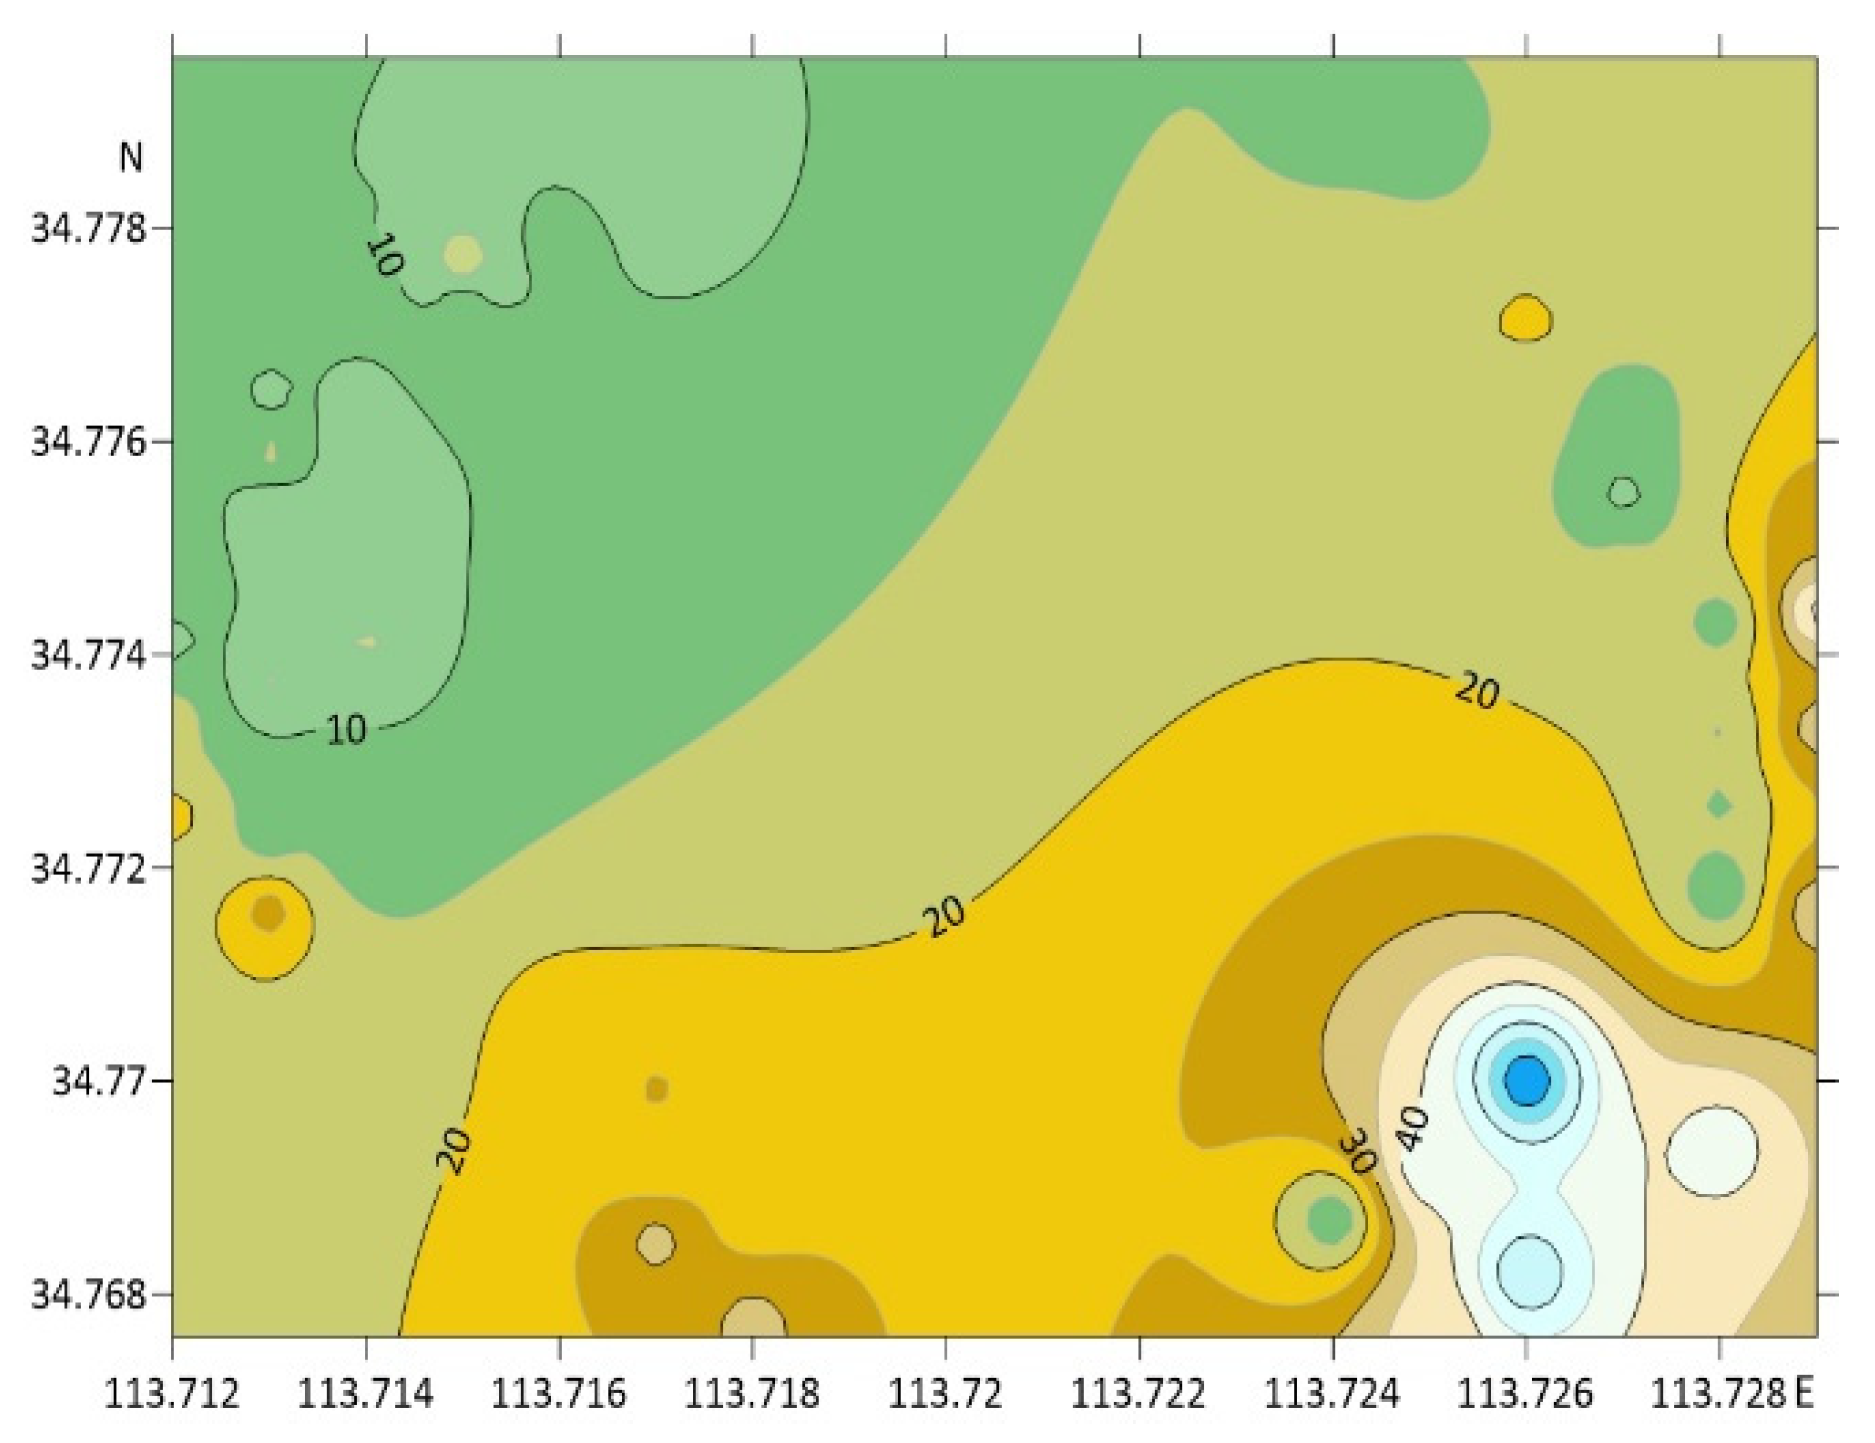
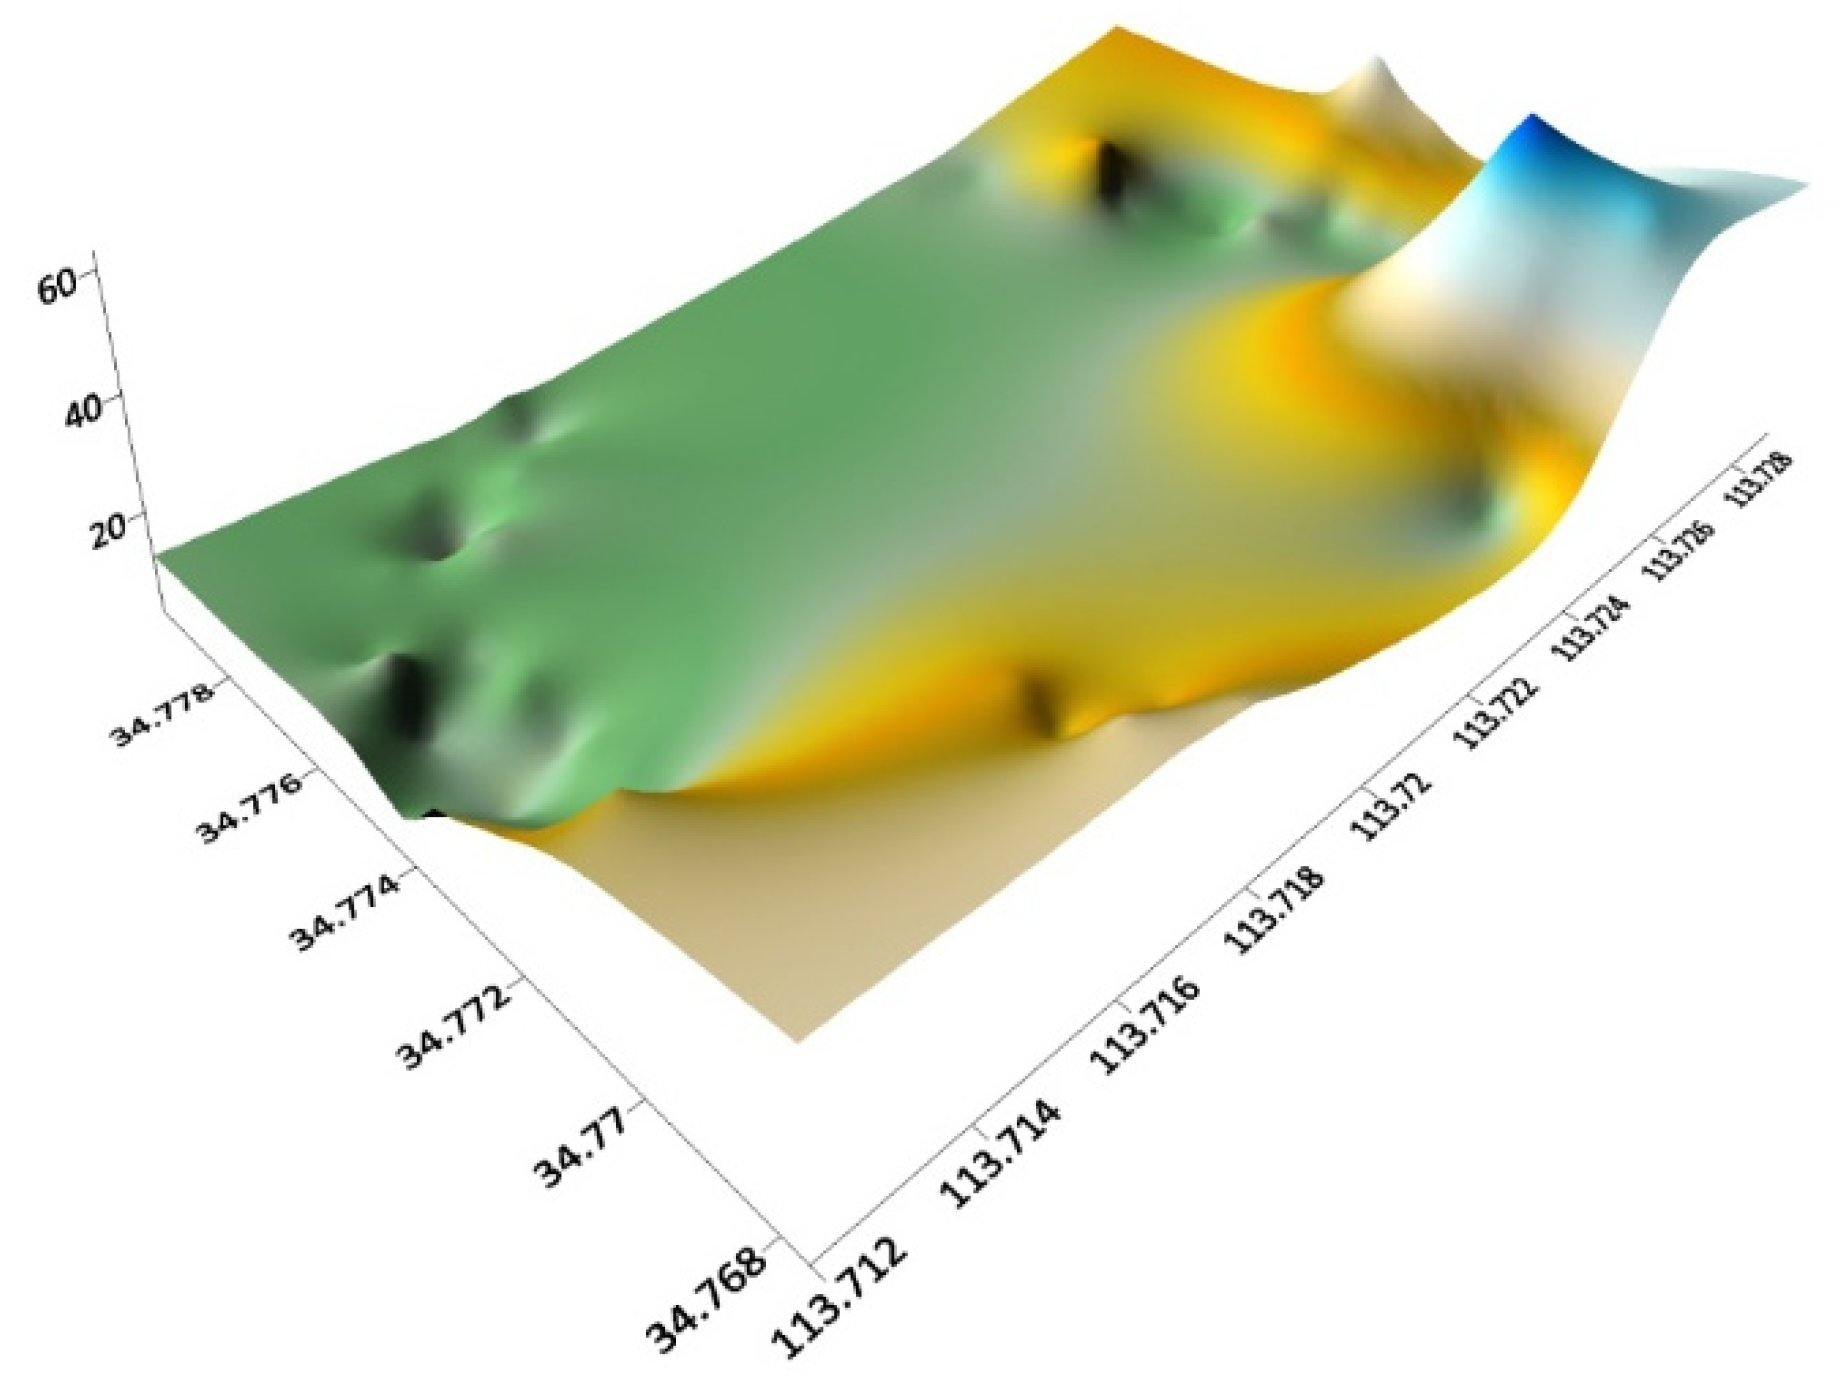
In order to verify the results calculated in this paper, they should be compared with the measured data. However, ground deformation is related to loading buildings, groundwater exploitation, urban population development, and other factors. Therefore, this paper was compared with the measured ground deformation trend in this area. Through InSAR data inversion, the land subsidence rate of the study area in 2013 was shown in Figure 16, with an average value of 9 mm/a. From 2007 to 2018, the accumulated settlement in the study area reached 150 mm in Figure 17. The overall trend of settlement. The settlement center was located in the international convention and exhibition center, which is consistent with the calculation trend in this paper.

4. Conclusions and Recommendations

Based on the load tide theory and the measured building data in Zhengzhou, the influence of Zhengzhou Millennium Plaza Minsheng Bank as an independent building on the ground deformation was calculated. The impact of the cluster load buildings around the CBD on the ground horizontal and vertical displacements of the International Convention and Exhibition Center were analyzed. The calculation results show that the horizontal displacement, vertical displacement, geoid undulation, and geoid inclination of the ground caused by the independent single building, Millennium Plaza Minsheng Bank, were all centered on the building, and the distance continues to increase. With the increase of the non-linear attenuation and diffusion to the surrounding concentric circles, the attenuation speed gradually decreased. The horizontal displacement, vertical displacement, undulation, and tilt of the ground caused by the cluster building load were related to the distance to the target building and the cluster building load, but the relationship is non-linear; the greater the distance to the target building, the smaller the influencing deformation variable; the greater the weight of the building group itself, the smaller the influencing deformation variable.
In the research process, there is still some content to be further studied: (1) The model used in this article was to calculate the building as a mass point. The distance, r, was very small, and its influence cannot be calculated. How to calculate the close distance of the building and shape variable is yet to be further explored. (2) The influence of building group load is superimposed, and the superimposed influence relationship needs to be further studied.

Author Contributions

Conceptualization, L.Y.; Methods, L.Y.; Software, J.Q. (Jianhua Qiu), J.Q. (Jihong Qu) and L.Y.; Formal analysis, L.Y.; Investigation, W.G.; Resources, W.L.; Data Management, W.G.; Writing—Manuscript preparation, L.Y.; Writer-censor-editor, L.Y.; Visualization, J.Q. (Jihong Qu). All authors have read and agreed to the published version of the manuscript.

Funding

This research received no external funding.

Institutional Review Board Statement

Not applicable.

Informed Consent Statement

Written informed consent has been obtained from the patient(s) to publish this paper.

Data Availability Statement

Not applicable.

Conflicts of Interest

The authors declare no conflict of interest.

References

  1. Dong, D.; Gross, R.S.; Dickey, J.O. Seasonal Variations of the Earth’s Gravitational Field: An Analysis of Atmospheric Pressure, Ocean Tidal, and Surface Water Excitation. Geophys. Res. Lett. 1996, 23, 725–728. [Google Scholar] [CrossRef] [Green Version]
  2. Chao, B.F.; Dehant, V.; Gross, R.S. Space Geodesy Monitors Mass Transports in Global Geophysical Fluids. Eos Trans. Am. Geophys. Union 2000, 81, 247–250. [Google Scholar] [CrossRef]
  3. Melchior, P. The Solid Tide of the Planet Earth; Science Press: Beijing, China, 1984. [Google Scholar]
  4. Dziewonski, A.M.; Anderson, D.L. Preliminary Reference Earth Model. Phys. Earth Planet. Inter. 1981, 25, 297–356. [Google Scholar] [CrossRef]
  5. Zhang, H.; Zheng, Y.; Liu, C. Love Number Contemporary Theory and New Technology Analysis. Prog. Geophys. 1999, 4, 50–58. [Google Scholar]
  6. Caputo, M. Deformation of a Layered Earth by an Axially Symmetric Surface Mass Distribution. J. Geophys. Res. Atmos. 1961, 66, 1479–1483. [Google Scholar] [CrossRef]
  7. Caputo, M. Tables for the Deformation of an Earth Model by Surface Mass Distributions. J. Geophys. Res. 1962, 67, 1611–1616. [Google Scholar] [CrossRef]
  8. Rabbel, W.; Zschau, J. Static Deformations and Gravity Changes at the Earth’s Surface Due to Atmospheric Loading. J. Geophys. 1985, 56, 81–89. [Google Scholar]
  9. Longman, I.M. On the Stability of a Spherical Gravitating Compressible Liquid Planet without Spin. Geophys. J. Int. 2007, 42, 621–635. [Google Scholar] [CrossRef] [Green Version]
  10. Longman, I.M. A Green’s Function for Determining the Deformation of the Earth under Surface Mass Loads: 1. Theory. J. Geophys. Res. 1962, 67, 845–850. [Google Scholar] [CrossRef]
  11. Farrell, W.E. Deformation of the Earth by surface loads. Rev. Geophys. Space Phys. 1972, 10, 761–797. [Google Scholar] [CrossRef]
  12. Guo, J.Y. Direct Proof of the Asymptotic Expression of the Loading Love Number. Chin. J. Geophys. 2000, 43, 549–555. [Google Scholar] [CrossRef]
  13. Xi, Q. Surface Spherical Harmonic Function and Tidal Level Expansion. Acta Seismol. Sin. 1998, 4, 441–443. [Google Scholar]
  14. Wu, X.; Zhang, C.; Zhao, D.; Song, M. Improvement of the Definite Integral Calculation Method of Generalized Spherical Harmonics. J. Surv. Sci. Technol. 2005, 22, 17–20. [Google Scholar]
  15. Mathews, P.M.; Buffett, B.A.; Shapiro, I.I. Tidal station displacements. J. Geophy. Res. 1997, 102, 20469–20477. [Google Scholar] [CrossRef]
  16. Sun, H. Green’s Function of Atmospheric Gravity. Sci. Bull. 1997, 42, 1640–1646. [Google Scholar]
  17. Le Meur, E.; Hindmarsh, R.C.A. A Comparison of Two Spectral Approaches for Computing the Earth Response to Surface Loads. Geophys. J. Int. 2000, 141, 282–298. [Google Scholar] [CrossRef] [Green Version]
  18. Le Meur, E.; Huybrechts, P. A Model Computation of the Temporal Changes of Surface Gravity and Geoidal Signal Induced by the Evolving Greenland Ice Sheet. Geophys. J. Int. 2001, 145, 835–849. [Google Scholar] [CrossRef] [Green Version]
  19. Zhang, Y.; Wu, X.; Wang, W.; Xu, H.; Liu, J. Research on the Tectonic Stress Field Changes before the Wenchuan m8.0 Earthquake Based on Gps Observations by Green’s Function Method. Acta Geomat. Sin. 2010, 39, 11–15. [Google Scholar]
  20. Shen, Y.; Yan, H.; Peng, P.; Bai, X.; Tian, D. Comparison of Green Function and Spherical Harmonic Function Methods for Surface Deformation Caused by Mass Loading. J. Wuhan Univ. 2017, 42, 1008–1014. [Google Scholar]
  21. Wang, X.; Chen, Y.; Liu, H. Calculating 3D Surface Deformation Based on Spherical Harmonic Transformation and Load Response. Sci. Technol. Eng. 2021, 21, 11963–11970. [Google Scholar]
  22. Li, W.; Wang, W.; Zhang, C.; Dong, J.; Liu, H. Effects of Regional Crustal Structure Differences on Vertical Deformation of Land Water Load in China from Grace-FO Inversion in Recent 10 Months. Geod. Geodyn. 2021, 9, 707–713. [Google Scholar]
  23. Wu, X.; Tian, S.; Wu, G. Research on the Relationship between Gravity Change, Crustal Deformation and Groundwater. Acta Seismol. 1992, 1, 653–660. [Google Scholar]
  24. Xing, C.; Zhang, Y.; Shi, S.; Du, R. The Water Storage Effect of the Three Gorges Reservoir and Its Influence on the Activity of the Fairy Mountain Fault. J. Geod. Geodyn. 2006, 26, 69–72. [Google Scholar]
  25. Akatsuka, M.; Miura, S.; Ohta, Y.; Sato, T.; Freymuller, J.T. Seasonal Variation of Vertical Crustal Deformation Possibly Related to Water Mass Storage in Southeast Alaska. In Proceedings of the AGU Fall Meeting 2009, San Francisco, CA, USA, 12–14 December 2009. G43A-0714. [Google Scholar]
  26. Gladkikh, V.; Tenzer, R.; Denys, P. Crustal Deformation due to Atmospheric Pressure Loading in New Zealand. J. Geod. Sci. 2011, 1, 271–279. [Google Scholar] [CrossRef]
  27. Sun, L.; Yao, Y.; Jiang, L.; Wei, G.; Wang, H.; Luo, J. The Influence of Water Load Changes in the Three Gorges Reservoir on Crustal Deformation. J. Yangtze River Sci. Res. Inst. 2015, 32, 46–50. [Google Scholar]
  28. Wang, L.; Chen, C.; Xian, M.A. A Water Storage Loading Model by SRTM-DEM Data and Surface Response Simulation of Gravity and Deformation in the Three Gorges Reservoir of China. Acta Geod. Cartogr. Sin. 2016, 45, 1148–1156. [Google Scholar]
  29. Vandam, T.M.; Herring, T.A. Detection of Atmospheric Pressure Loading Using Very Long Baseline Interferometry Measurements. J. Geophys. Res. Solid Earth 1994, 99, 4505–4517. [Google Scholar] [CrossRef]
  30. Vandam, T.M.; Blewitt, G.; Heflin, M.B. Atmospheric Pressure Loading Effects on Global Positioning System Coordinate Determinations. J. Geophys. Res. Solid Earth 1994, 99, 23939–23950. [Google Scholar] [CrossRef]
  31. Zhang, K.; Bian, S.; Tao, B. The Influence of the Establishment of the Three Gorges Reservoir on the Earth’s Gravitational Field and Crustal Deformation. Chin. J. Geophys. 2005, 37, 260–267. [Google Scholar]
  32. Wang, J. Geoid Undulation Caused by Building Complex Load and Its Influence on Elevation. J. Wuhan Univ. 2008, 6, 616–618. [Google Scholar]
  33. Zhang, H.; Xu, H.; Liu, X. The Basic Theory and Numerical Results of the Love Number of the Earth Tide. Prog. Geophys. 2004, 2, 372–378. [Google Scholar]
  34. Jeffreys, H. The Earth, 5th ed.; Cambridge University Press: New York, NY, USA, 1970. [Google Scholar]
  35. Wahr, M. Body Tides on an Elliptical, Rotating, Elastic and Oceanless Earth. Geophys. J. Int. 1981, 64, 677–703. [Google Scholar] [CrossRef] [Green Version]
  36. Dahlen, F.A. Elastic Dislocation Theory for a Self-Gravitating Elastic Configuration with an Initialstatic Stress Field. Geophys. J. Int. 1972, 28, 357–383. [Google Scholar] [CrossRef] [Green Version]
  37. Love, A.E.H. A Treatise on the Mathematical Theory of Elasticity; Cambridge University Press: Cambridge, UK, 1927. [Google Scholar]
  38. Zhang, C. Ground Deformation Caused by Building Load and Its Influence on the Geoid; Tongji University: Shanghai, China, 2006. [Google Scholar]
  39. Zhang, S.; Zhong, M.; Tang, S. Atmospheric Load Effect on vertical Crustal Deformation of GPS Reference Stations in China. Geomat. Inf. Sci. Wuhan Univ. 2006, 31, 1090–1093. [Google Scholar]
  40. Zhang, Y. Earth Tide Simulation Considering the Slow Anisotropy of the Upper Ground; Chinese Institute of Scientific Surveying and Geophysics: Wuhan, China, 1997. [Google Scholar]
  41. Xu, H.; Mao, W.; Zhang, Y. Theoretical Model of the Earth’s Tidal Strain. Acta Seismol. Sin. 1986, 8, 275–283. [Google Scholar]
  42. Peltier, W.R. The LAGEOS Constraint on Deep Mantle Viscosity: Results from a New Normal Mode Method for the Inversion of Viscoelastic Relaxation Spectra. J. Geophys. Res. Solid Earth 1985, 90, 9411–9421. [Google Scholar] [CrossRef]
  43. Chen, J.; Li, J. Research and Implementation of High-Precision and High-Resolution Geoid in My Country’s Mainland. J. Surv. Mapp. 2001, 30, 95–100. [Google Scholar]
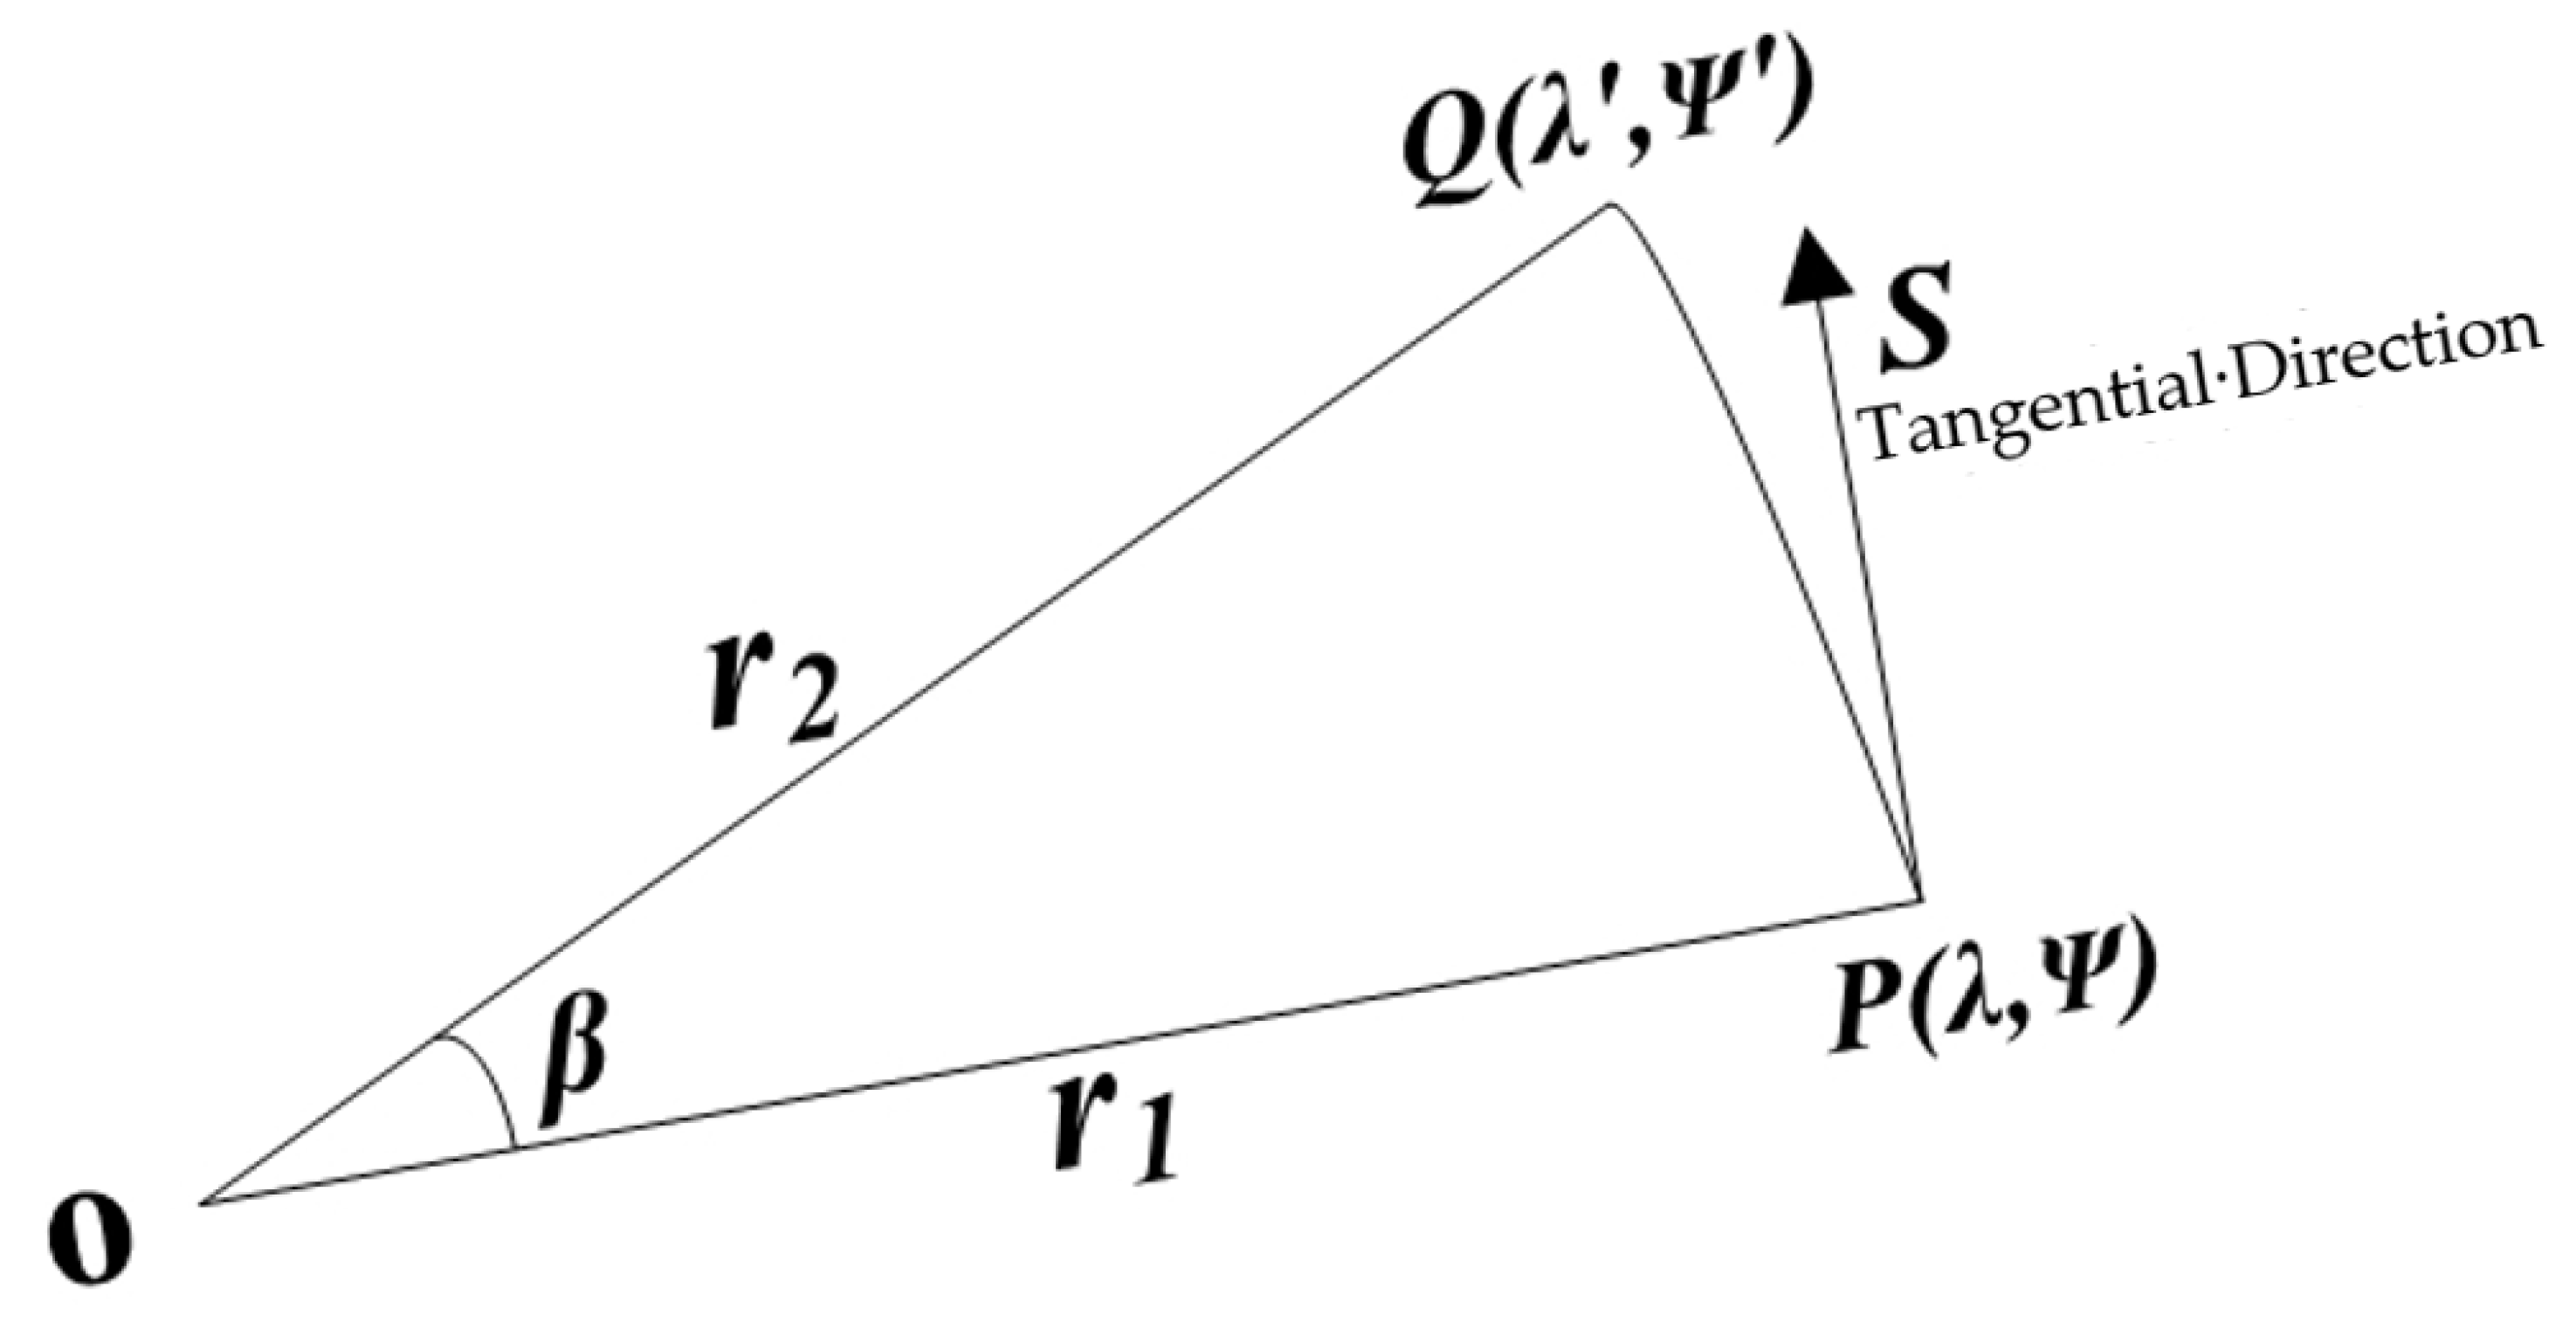
Figure 1. Schematic diagram of relation between calculation point, particle element, and geocentric.
Sustainability 14 04047 g001
Figure 2. Calculates the spherical triangle of point, particle, and North Pole.
Sustainability 14 04047 g002
Figure 3. CBD cluster load distribution diagram.
Sustainability 14 04047 g003
Figure 4. The amount and change rate of horizontal ground displacement caused by an independent single building.
Sustainability 14 04047 g004
Figure 5. The amount of vertical displacement on the ground and the rate of change of vertical displacement caused by an independent single building.
Sustainability 14 04047 g005
Figure 6. Geoid undulation and rate of geoid undulation caused by independent single building.
Sustainability 14 04047 g006
Figure 7. Ground horizontal displacement caused by cluster load.
Sustainability 14 04047 g007
Figure 8. Three-dimensional diagram of ground horizontal displacement caused by cluster load.
Sustainability 14 04047 g008
Figure 9. Three-dimensional diagram of vertical displacement caused by cluster load building.
Sustainability 14 04047 g009
Figure 10. Three-dimensional topographic map of vertical displacement caused by cluster load building.
Sustainability 14 04047 g010
Figure 11. Vertical displacement caused by cluster load building.
Sustainability 14 04047 g011
Figure 12. Three-dimensional topographic tilt undulation caused by cluster-loaded buildings (10−3 mm).
Sustainability 14 04047 g012
Figure 13. Geoid undulation caused by cluster-loaded buildings (10−3 mm).
Sustainability 14 04047 g013
Figure 14. Three-dimensional topographic tilt caused by cluster-loaded buildings (10−4 mm).
Sustainability 14 04047 g014
Figure 15. Geoid tilt caused by cluster-loaded buildings (10−4 mm).
Sustainability 14 04047 g015
Figure 16. Subsidence rate of Zhengzhou CBD in 2013 (mm/a).
Sustainability 14 04047 g016
Figure 17. Cumulative settlement of Zhengzhou CBD in 2007–2018 (mm).
Sustainability 14 04047 g017
Table 1. Ground deformation results caused by an independent single building.
Ground Distance to Minsheng Bank (m)Horizontal Displacement (mm) × 10−4Vertical Displacement (mm) × 10−4Geoid Changes (mm) × 10−3The Geoid Is Tilted (S) × 10−4
100141.6865−447.0230419.3370−87.5873
20070.8424−222.4988414.9873−116.1458
30047.2252−147.6574407.8269−171.5090
40035.4161−110.2408397.9935−223.6964
50028.3288−87.7892385.6572−271.7679
60023.6037−72.8193371.0529−314.8861
70020.2275−62.1289354.4479−352.3400
80017.6945−54.1110336.1257−383.5529
90015.7233−47.8757316.4265−408.0824
100014.1457−42.8868295.6743−425.6757
150011.5801−31.6680198.8753−350.4609
20007.0156−20.4492102.0762−275.2461
25006.2314−16.715787.8133−154.8783
30004.6164−12.982273.5504−34.5105
40003.4172−9.260363.4287−15.5991
50002.6812−7.042141.6534−14.9756
60002.1707−5.575833.2820−6.2907
70001.8103−4.540834.0216−5.6269
80001.5438−3.777526.5664−5.1875
Table 2. Superposition effect of Zhengzhou CBD buildings on Zhengzhou International Convention and Exhibition Center.
The Serial NumberBuilding NameDistance to the International Convention and Exhibition Center (m)Horizontal Displacement (×10−4 mm)Vertical Displacement (×10−4 mm)Geoid Changes (×10−3 mm)The Amount of Geoid Inclination (×10−4 s)
1Dennis 1 World56931.45023793−100.7346377494.4622581−407.0086996
2CITIC Tower50022.28609813−71.58994436318.3766515−230.0360243
3Minsheng Bank Building60931.8830502−101.9255062530.6703983−468.5733139
4Xin’ao Building53220.45825586−65.63559866305.0021309−234.4014766
5Dennis 2 World69812.7534247−40.60965778233.9544765−237.7211436
6Five Elements Garden Tower A59825.4898459−81.52411958419.1448961−363.4184917
7Five Elements Garden Tower B62923.15702903−73.97067496393.368437−358.7369287
8Dennis 3 Worlds9053.796945281−11.9819192180.32582026−106.7947076
9International Chamber of Commerce Building93427.43757742−86.48290938586.5287866−804.8882877
10Guolong Building99121.80839029−68.56679636476.5889363−696.4885789
11Five Elements Garden Block D86111.1266982−35.18269975229.4652653−289.2871798
12Five Elements Garden Block D81312.88057745−40.81024067258.5519355−307.35943
13Dennis 4 Worlds9954.520173596−14.2089918198.94288012−145.2405721
14Five Elements Garden Tower E9188.456283241−26.67152532179.7216709−242.3527261
15Weiye Caizhi Plaza9494.152928583−13.0816957689.27430762−124.5442942
16Expo Tower11009.230506099−28.95034766199.2507399−303.1017238
17Liji Upper East International100017.22282853−54.12637633377.7700455−557.6359029
18l Level I upper east international11004.736154894−14.8543676102.2351707−155.5209105
19New Mango Building110013.75283459−43.13407504296.8702299−451.6012261
20Zhongyuan Guangfa Financial Building110016.07894611−50.42963786347.081934−527.983648
21CNPC International Huijin Building12009.38582782−29.37137886198.9695094−312.995569
22Longhu Building9779.961163531−31.33876793216.4653261−311.4645876
23Oriental International (South)9916.907265602−21.7168286150.9477005−220.595447
24Oriental International (North)10006.596191806−20.72992595144.6826039−213.5696449
25Dennis 6 Worlds11000.990395935−3.10625509921.37879772−32.52158786
26Greenland Century Mansion120011.24028574−35.17459484238.2820334−374.8374355
27Greenland Summit World120010.05456805−31.4640896213.1460869−335.2965033
28Road King Building12009.850577681−30.82573584208.8217093−328.493898
29Dennis International Apartment (A)100012.43225584−39.07098983272.6923657−402.5280865
30Dennis International Apartment (B)100013.8868525−43.64236707304.597871−449.6246085
31Dennis International Apartment (C)100011.9427605−37.53264732261.9556462−386.6793437
32Dennis 7 Worlds11004.727362032−14.82678987102.045367−155.2321797
33Vancouver Building12007.944649097−24.86145101168.4180621−264.9356042
34Henan Agricultural Bank Building12009.600793554−30.04407818203.526553−320.1641772
35World Trade Building (A)10007.155134041−22.48651998156.9425898−231.6669196
36World Trade Building (B)10009.057557916−28.46528882198.6708548−293.2630653
37Mobile building25411.81174111−38.3793222887.72484668−31.95131788
38Futures Building38536.80129836−118.8447767414.8423738−229.8514987
39Xin Po Building27643.48678596−141.1473868353.3399022−139.9635576
40Cathay Pacific Fortune Center38354.55038978−176.1819911611.3389495−336.9206096
41China Grain Store31064.28028134−208.2647557596.0240243−265.4599272
42United Center Building42742.52385922−137.0691714525.6722705−323.2217623
43Wanda Futures Building44110.87449407−35.03222146137.9250956−87.60130898
44Jingfeng International Center55133.03784179−105.9075875505.8941363−402.8799715
45Future International Building 2649514.28824269−45.91093369201.9208415−144.3722277
46Future International Building 2552514.71388877−47.21970501217.2709484−164.770953
47Wang Ding International64532.16422201−102.673251555.6776147−519.8503882
48Future International Building 226738.522531917−27.1709336151.8549254−148.4534779
49People’s Insurance Building68041.25931907−131.4961481741.0651138−732.3875599
50Future International Building 2458712.53806419−40.12353748202.6188634−172.2813869
51Kunwu Building74229.30217769−93.13656382556.386559−601.2320672
52Future International Building 2362315.57058579−49.74938943262.8634769−237.4217711
53Zhengdong Financial Building82125.72409535−81.47709046518.6101605−622.5791084
54Jincheng Sunshine Century (South)70811.31098792−36.00178765209.227494−215.6517103
55Jincheng Sunshine Century (North)77415.85801396−50.33253341309.0925354−349.0362695
56Jincheng Sunshine Century (Main)74714.695301−46.69876694280.1470389−304.8253995
57Hailian Building87715.73914514−49.73139059327.6976662−421.2945106
58Zhengzhou Italy International Building94013.15189714−41.44422365281.7707075−389.2237426
59Gram Business Building96813.4870856−42.4488975292.050751−416.0573946
Total1040.10468−3315.571817,420.14634−18,903.85184
Publisher’s Note: MDPI stays neutral with regard to jurisdictional claims in published maps and institutional affiliations.