Article

Responding to Visitor Density Pre and Post COVID-19 Outbreak: The Impact of Personality Type on Perceived Crowdedness, Feeling of Being Comfortable, and Anticipated Experience

by
Humeyra Dogru-Dastan
1,
Svetlana Stepchenkova
2,* and
Andrei P. Kirilenko
2
1
Department of Tourism Management, Faculty of Business, Dokuz Eylul University, Buca 35390, Turkey
2
Department of Tourism, Hospitality and Event Management, University of Florida, Gainesville, FL 32611, USA
*
Author to whom correspondence should be addressed.
Sustainability 2022, 14(7), 3960; https://doi.org/10.3390/su14073960
Submission received: 25 February 2022 / Revised: 18 March 2022 / Accepted: 23 March 2022 / Published: 27 March 2022
(This article belongs to the Section Tourism, Culture, and Heritage)

Abstract

:
The study set out to determine whether tourists’ response to human density at destinations changed after the COVID-19 outbreak and, thus, gain insight into whether tourist flows will be sustained in the post-COVID-19 environment. An experimental design with the photo-elicitation technique embedded into an online survey was employed. The two-phase data collection allowed an examination of respondents’ reactions to the same experimental stimuli (images depicting different levels of density) before and after the outbreak. The effect of COVID-19 on the relationship between density and the outcome variables of perceptions of crowdedness, the feeling of being comfortable, and the anticipated experience was small and registered at the medium density level only. The effects of personality profiles on those relationships depend on the tourist density level. The personality profile also moderates the effect of COVID-19 on study variables, mostly at the medium-density level. Theoretical and practical implications are discussed.

1. Introduction

In 2019, the year before the COVID-19 outbreak, the World Tourism Organization reported 1.5 billion international tourist arrivals, which represented growth of 4% compared to the previous year [1]. The trajectory of increased tourist flows had been sustained for several years prior leading to tourism overcrowding in many iconic destinations (e.g., Venice and Barcelona [2]), contributing to residents’ resentment, an overload of infrastructure, degradation of the environment, and threats to local culture and heritage, all converging in worsened tourist experiences [3]. The trend of ever-increasing tourism flows, however, abruptly turned downwards following the COVID-19 outbreak, bringing another kind of disaster to the tourism industry: An almost complete shut-down [4,5]. While after the COVID-19 outbreak, there have been calls to rethink tourism as we know it and to re-organize the industry on more sustainable and responsible principles [6], the recovery of the industry has been seen as a priority by tourism organizations and industry practitioners [5].
In the past, tourism industry disruptions such as 9/11, SARS, or MERS were short-lived, as tourists and tourism providers had always demonstrated remarkable resilience [4]. After the COVID-19 crisis, however, the future of tourism is still uncertain, as the scale of the outbreak does not allow for an interpolation of the past post-crisis performance of the tourism industry to predict the recovery pathway. The unprecedented quarantine measures as well as changes in the social norms that include abandoning handshakes, wearing masks in public places, social distancing, etc., have been widespread in many countries. However, fundamentally the lack of data regarding travel-related behavior of potential tourists when the situation with COVID-19 is under control and tourists’ attitudes toward crowding at popular destinations create a spectrum of pathways ranging from “everything will change” to “nothing will change, the industry will recover as soon as COVID-19 is over” [7].
An individual’s personality is a factor in response to stress and crises [8,9]. China was the first country to lift the lockdown caused by COVID-19, and a nationwide survey of psychological distress among Chinese people conducted immediately afterward indicated a variety of psychological disorders, such as panic attacks, anxiety, and depression [10]. Tourist behavioral changes have also been recorded: Wen et al. [11] (p. 8) found that tourists “avoid visiting crowded tourist destinations, instead preferring less well-known locales”. Conversely, it was also observed that as quarantine measures were eased, large crowds of people appeared at attraction points even in the hardest-hit countries such as Spain, Italy [12], the UK [13], and the US [14]. The apparent contradiction between those observations may be attributed to the interplay between personality traits and risk perceptions [15]. Although past research in psychology and consumer behavior has incorporated the role of personal characteristics in the relationship between crowdedness and perception-based and behavioral responses [16,17], the impact of those personal traits has yet to be scrutinized in the tourism and recreation domain, especially when the risk of travel increases dramatically, as is the case with COVID-19.
This study set out to provide insight into (a) whether perceptions of crowdedness and associated states of feeling comfortable and anticipated tourist experience at a destination are affected by dramatically increased risks related to COVID-19, and (b) whether changes in perception of those states, if any, are related to the personality type of an individual. Data were collected across two periods: PRE and POST the COVID-19 outbreak in the US. For the PRE and POST periods, the study employed an experimental, repeated-measures, crossover design with the photo-elicitation technique embedded into an online survey. With the backdrop of heightened awareness about the dangers of large public gatherings, the necessity to practice social isolation, and talk about “new normal” behaviors, it was an appropriate moment to examine whether changes in crowdedness perceptions occurred among US tourists. In addition, the study tests whether perceptions of crowdedness and associated states of feeling comfortable and anticipated tourist experience at a destination are more likely to change in people of certain personality types and, thus, make those people less—or more—predisposed to fall into the “back to normal” mode of tourism that they practiced before the COVID-19 outbreak.

2. Study Background

2.1. COVID-19 Outbreak: PRE and POST Periods

The World Health Organization defines an outbreak as follows: “A disease outbreak is the occurrence of disease cases in excess of normal expectancy” [18]. The PRE temporal data collection window, 10–24 February, was before the outbreak was in full swing in the U.S. when messages from the U.S. government and President Trump were rather optimistic [19]. By 24 February, there were only somewhere between 15 [20], 35 [21], or 53 [22] COVID-19 cases reported in the U.S., with no deaths reported. The Associated Press Center at the University of Chicago reported that fewer Americans were worried about being infected with coronavirus than the number of those worried about the seasonal flu, while half of the respondents did not know or knew little of the coronavirus infection (the poll was conducted 13–16 February 2020, see [23]). Similarly, a 3–16 February Gallup poll found that 65% of U.S. adults were slightly or not at all worried about COVID-19 infection, while 77% were very or somewhat confident in the ability of the federal government to manage it [24]. On 24 February, the synthetic multi-poll interpolation by FiveThirtyEight [25] projected that 57.3% of Americans were slightly or not at all worried about the COVID-19 infection. Wearing masks was discouraged by the CDC [26], businesses, schools, and universities in the U.S. were fully operational, and air travel within the U.S. was not yet restricted.
The POST phase of data collection took place on 28–29 April, when the epidemiological situation in the U.S. had changed dramatically. The number of COVID-19 cases in the U.S. exceeded 1 million, with 50,000–60,000 deaths [20,22]. On 11 March, the WHO declared the outbreak as a pandemic, and on 13 March, a national emergency was declared [27]. On 19 March, the first “stay-at-home” order was declared in the state of California [27]. On 3 April, CDC recommended wearing masks in public [27]. In March 2020, the CDC website communicated: “The virus is thought to spread mainly from person-to-person [:] Between people who are in close contact with one another (within about 6 feet) [and] through respiratory droplets produced when an infected person coughs or sneezes”. Over the course of March, the percentage of Americans avoiding even small gatherings such as with friends and family increased from 23% (13–15 March) to 83% (27–29 March) [28]. This avoidance of social gatherings cannot be solely attributed to compulsory regulations, as reduced rates of COVID-19 cases were recorded in the states with and without the stay-at-home order. Additionally, businesses were regulated, schools and universities fully transitioned to online education, wearing masks in public places became mandatory, and air travel was curtailed in a number of routes and flights. The percentage of Americans very or somewhat worried about the coronavirus infection peaked at 75.2% in mid-April and then stabilized at approximately 70% [25].

2.2. Visitors’ Density and Perceived Crowding

In psychology and sociology, the terms density and crowding (or crowdedness) have often been used interchangeably, until research on crowding in the tourism and recreation field investigated the impact of visitor density on satisfaction with outdoor recreation activities in wilderness areas [29]. Researchers [30] drew attention to the distinction between the concepts of density and crowding: While density refers to the limitation of space, crowding refers to how the restraining aspects of limited space are perceived by the individual. In line with this distinction, the term perceived crowding/crowdedness was introduced to accentuate an individual’s subjective evaluation of human density in a particular physical environment [31]. Correspondingly, “perceived crowding combines descriptive information (density or encounter level experienced by the individual) with evaluative information (the individual’s negative evaluation of that density or encounter level)” [32] (p. 256).
The stimulus overload theory [33] posits that people feel overcrowded when they are overwhelmed by the presence of other people. Density, and, therefore, the perception of crowding, is a factor that reduces an individual’s ability to maintain control over the situation at the behavioral, cognitive, and decision levels [34]; thus, crowding is considered a case of stimulus overload. Scholars also suggest that individuals participating in the same recreational activity might have different expectations for density, which affects their perceptions of crowding [35]. Further, previous research [36] brings an environment-behavior outlook to issues of social density and crowding in a recreation environment and defines perceived crowding as a function of visitor, site, and activity characteristics, e.g., demographics or resource type [37,38]. For example, nature-oriented recreationists had different levels of tolerance for human encounters at campgrounds, on the trails, and for waiting times at rapids [39].
An increase in use levels at a destination leads to an increase in perceived crowding, especially when the space and resource limitations prevent visitors from achieving their motivational goals [40]. High encounter levels and decreased distances between visitors result in a feeling of invaded personal space that leads to negative emotions such as stress, regret, and feeling dominated [41]. They affect the perceptions of comfort, and, ultimately, result in a less-satisfying tourist experience [42,43,44]. While tourists can rarely expect to be alone at popular tourist sites, excessive crowding prevents a person from fully engaging with the environment (i.e., a place, an attraction, or an event) on emotional, physical, spiritual, and intellectual levels [45].
The relationship between crowding and tourist experience has been tested and found for all experience dimensions, that is, learning/education, entertainment/excitement, aesthetics/pleasure, and escapism [46,47,48]. Moreover, crowding-sourced limitations leading to a reduction in the quality of leisure experiences have been reported for virtually all destination types, including natural attractions, historic sites, theme parks, and museums [48,49]. Unfulfilled motivational needs due to crowding result in complaints about destinations and service providers [50,51] and lower revisit intentions and willingness to recommend. However, what has not been studied yet is whether perceptions of crowdedness would change under major disruptions that change social norms, such as the one created by the COVID-19 outbreak. Therefore, regarding this problem, the study posits three research questions:
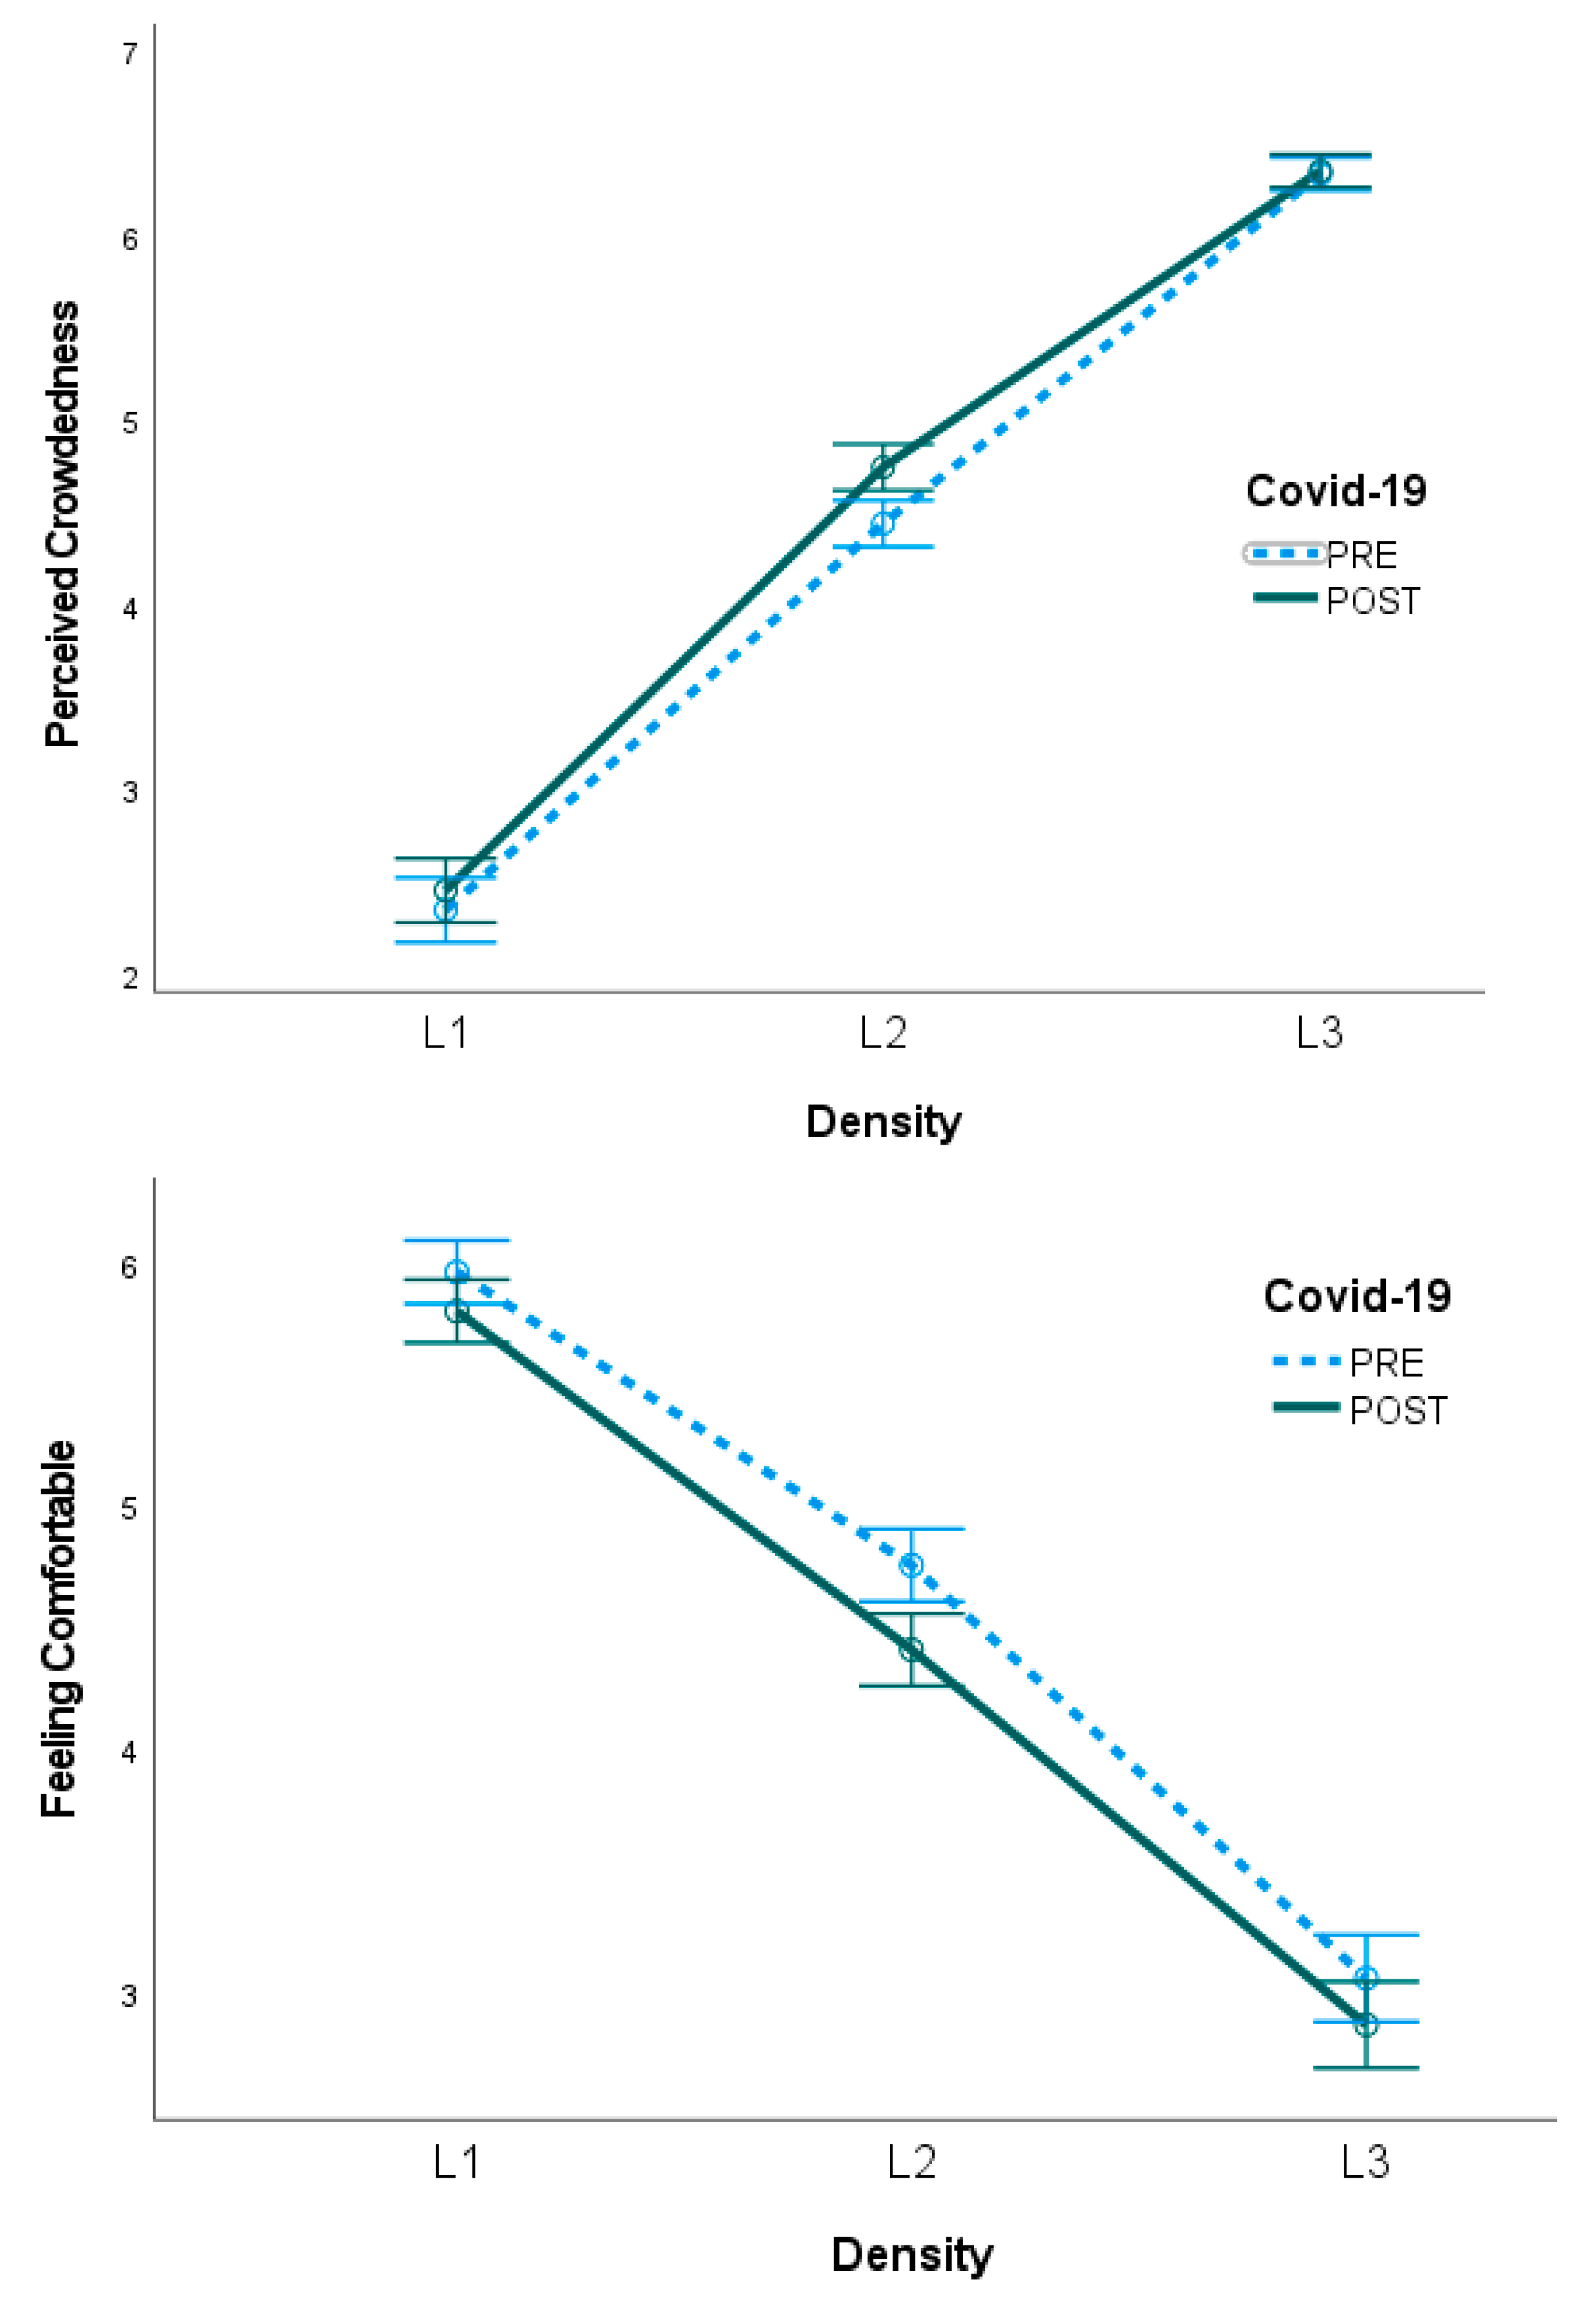
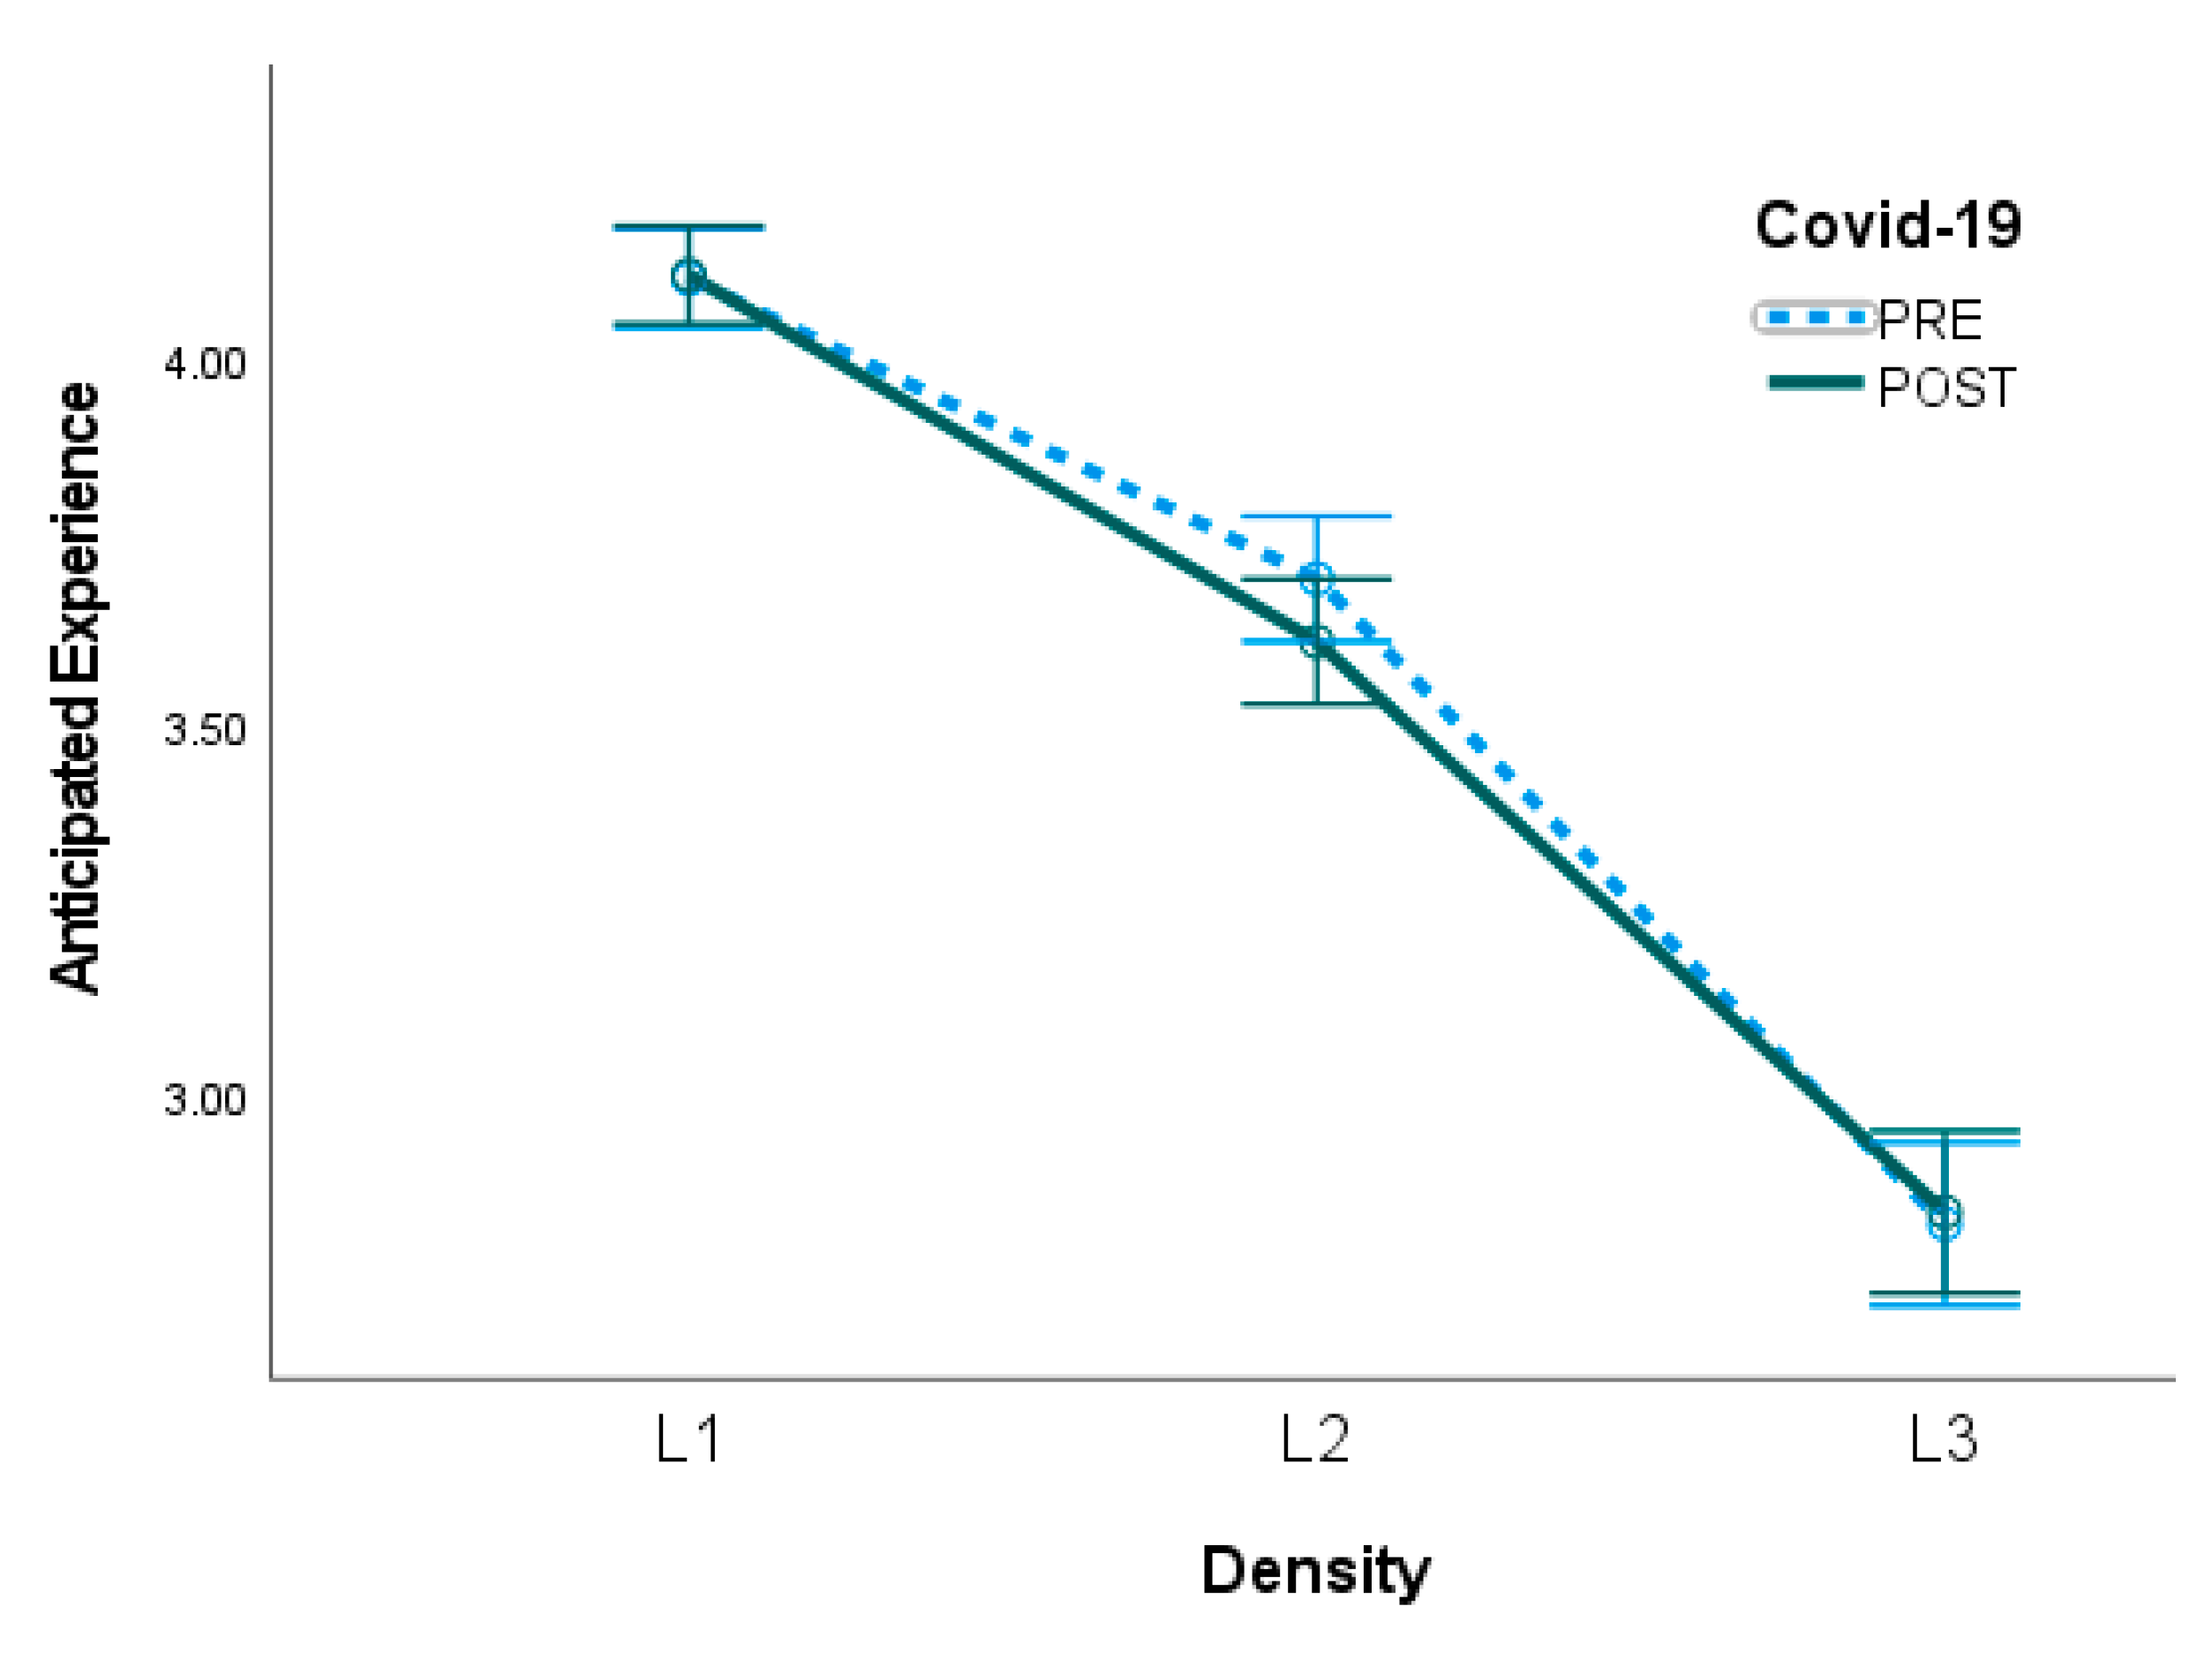
RQ1. Did the perception of crowdedness (1a), feeling of being comfortable (1b), and anticipated experience (1c) at destinations change after the COVID-19 outbreak?

2.3. Personality

Crowding research has connected the perception of crowdedness as a stimuli overload to the personality of an individual [52,53]. Human personality as a whole and its specific traits guide a variety of individual behaviors such as school attendance, gambling, confessing to crimes, blood donations, drug use, job performance [54], and even mingling patterns at social gatherings [52]. Personality types and the cognitive, affective, and behavioral patterns pertaining to them are remarkably stable across a person’s lifespan [55,56], so much so that the term “plaster hypothesis” has been coined, meaning that by the age of 30, the human personality is firmly set [57,58]. Even though people might become more emotionally stable, agreeable, and conscientious when they grow older [57,59], over short time periods, changes in personality cannot be reliably detected.
Several typologies of personality, such as Extraversion–Introversion [60], the Myers–Briggs’ Type Indicator [61], the internal–external locus of control framework [62], and the Big Five Factors (BFF) model [63], have been offered, scientifically validated, and adopted in various disciplines. Personality traits anchoring those classifications were shown to correlate and overlap to some degree; for example, Extraversion and Openness in the BFF model correlate with Extraversion and Intuition in MBTI, respectively [64]. In this study, we use the BFF model as one of the leading academic models, which has high predictive power [65] and aligns well with the tourist context.
The BFF framework is described as “a hierarchical model of personality traits with five broad factors, which represent personality at the broadest level of abstraction” [66] (p. 506); these factors are Extraversion (E-trait), Neuroticism (N-trait), Openness (O-trait), Conscientiousness (C-trait), and Agreeableness (A-trait). Each dimension, in turn, encompasses multiple personality facets [63]. Extraversion incorporates features such as gregariousness, assertiveness, activity, excitement seeking, positive emotions, and warmth. Neuroticism is linked to emotional stability, feelings of anxiety, self-doubt, and a tendency toward negative emotions. Openness includes openness to new experiences and ideas, imagination, intellect, adventurousness, and artistic interests. Agreeableness is linked to being cooperative, putting others’ needs above one’s own, and being empathetic and trustful. Finally, Conscientiousness encompasses competence, self-discipline, thoughtfulness, and dependability [63].
Each dimension is a continuum on which the strength of the respective trait for a specific individual can be placed. Various combinations of those scores are the basis for differentiating people on their personality profiles. Therefore, the BFF Extraversion dimension, for example, does not classify people as extravert–introvert opposites, unlike the Extraversion–Introversion typology [60], but rather as individuals who are high or low in the E-trait. People high in extraversion are generally characterized as outgoing, energetic, and friendly, while, in contrast, those low in extraversion are more likely to seek solitude and environments with low levels of external stimuli [60,67]. Correlations of various degrees among the BFF traits have been found; for example, the E-trait positively correlates with the O-trait and negatively correlates with the N-trait, while N- and O-traits are negatively correlated [66].
Personality has been shown to affect tourists’ motivations, predispositions for certain types of travel [68], destination selection [69], and satisfaction and complaint behavior [70,71]. The BFF model is a popular framework in tourism research [15,70,72] due to the compatibility of its dimensions with tourist types and motivations for travel such as seeking excitement, being open to new experiences, practicing risk avoidance while traveling, and being conscious and respectful of the environment and local cultures. With respect to visitors’ density, high perceived crowdedness might create a situation of increased risk for some travelers due to safety and mobility concerns attributed to increased physical proximity to other people [29]. Since risk tolerance of various personality types differs [73], in crowded environments, those high in extraversion might show more risk-taking tendencies because of their need for arousal, while those with high neuroticism scores would be less tolerant of risk because of higher levels of anxiety. In the tourism context, however, previous research [15] reported a low impact of neuroticism on perceived risks.
Following the COVID-19 outbreak, tourists’ behavior incorporated varying degrees of adoption of social distancing practices [74]. It is not known, however, whether people revert to their original evaluations of human density and behavior in tourist places when the risks associated with crowding have largely passed. In addition, empirical evidence is still being accumulated on the role of personality profiles in the relationship between tourists and various travel density scenarios. Thus, the following research questions regarding those relationships are also posited in this study:
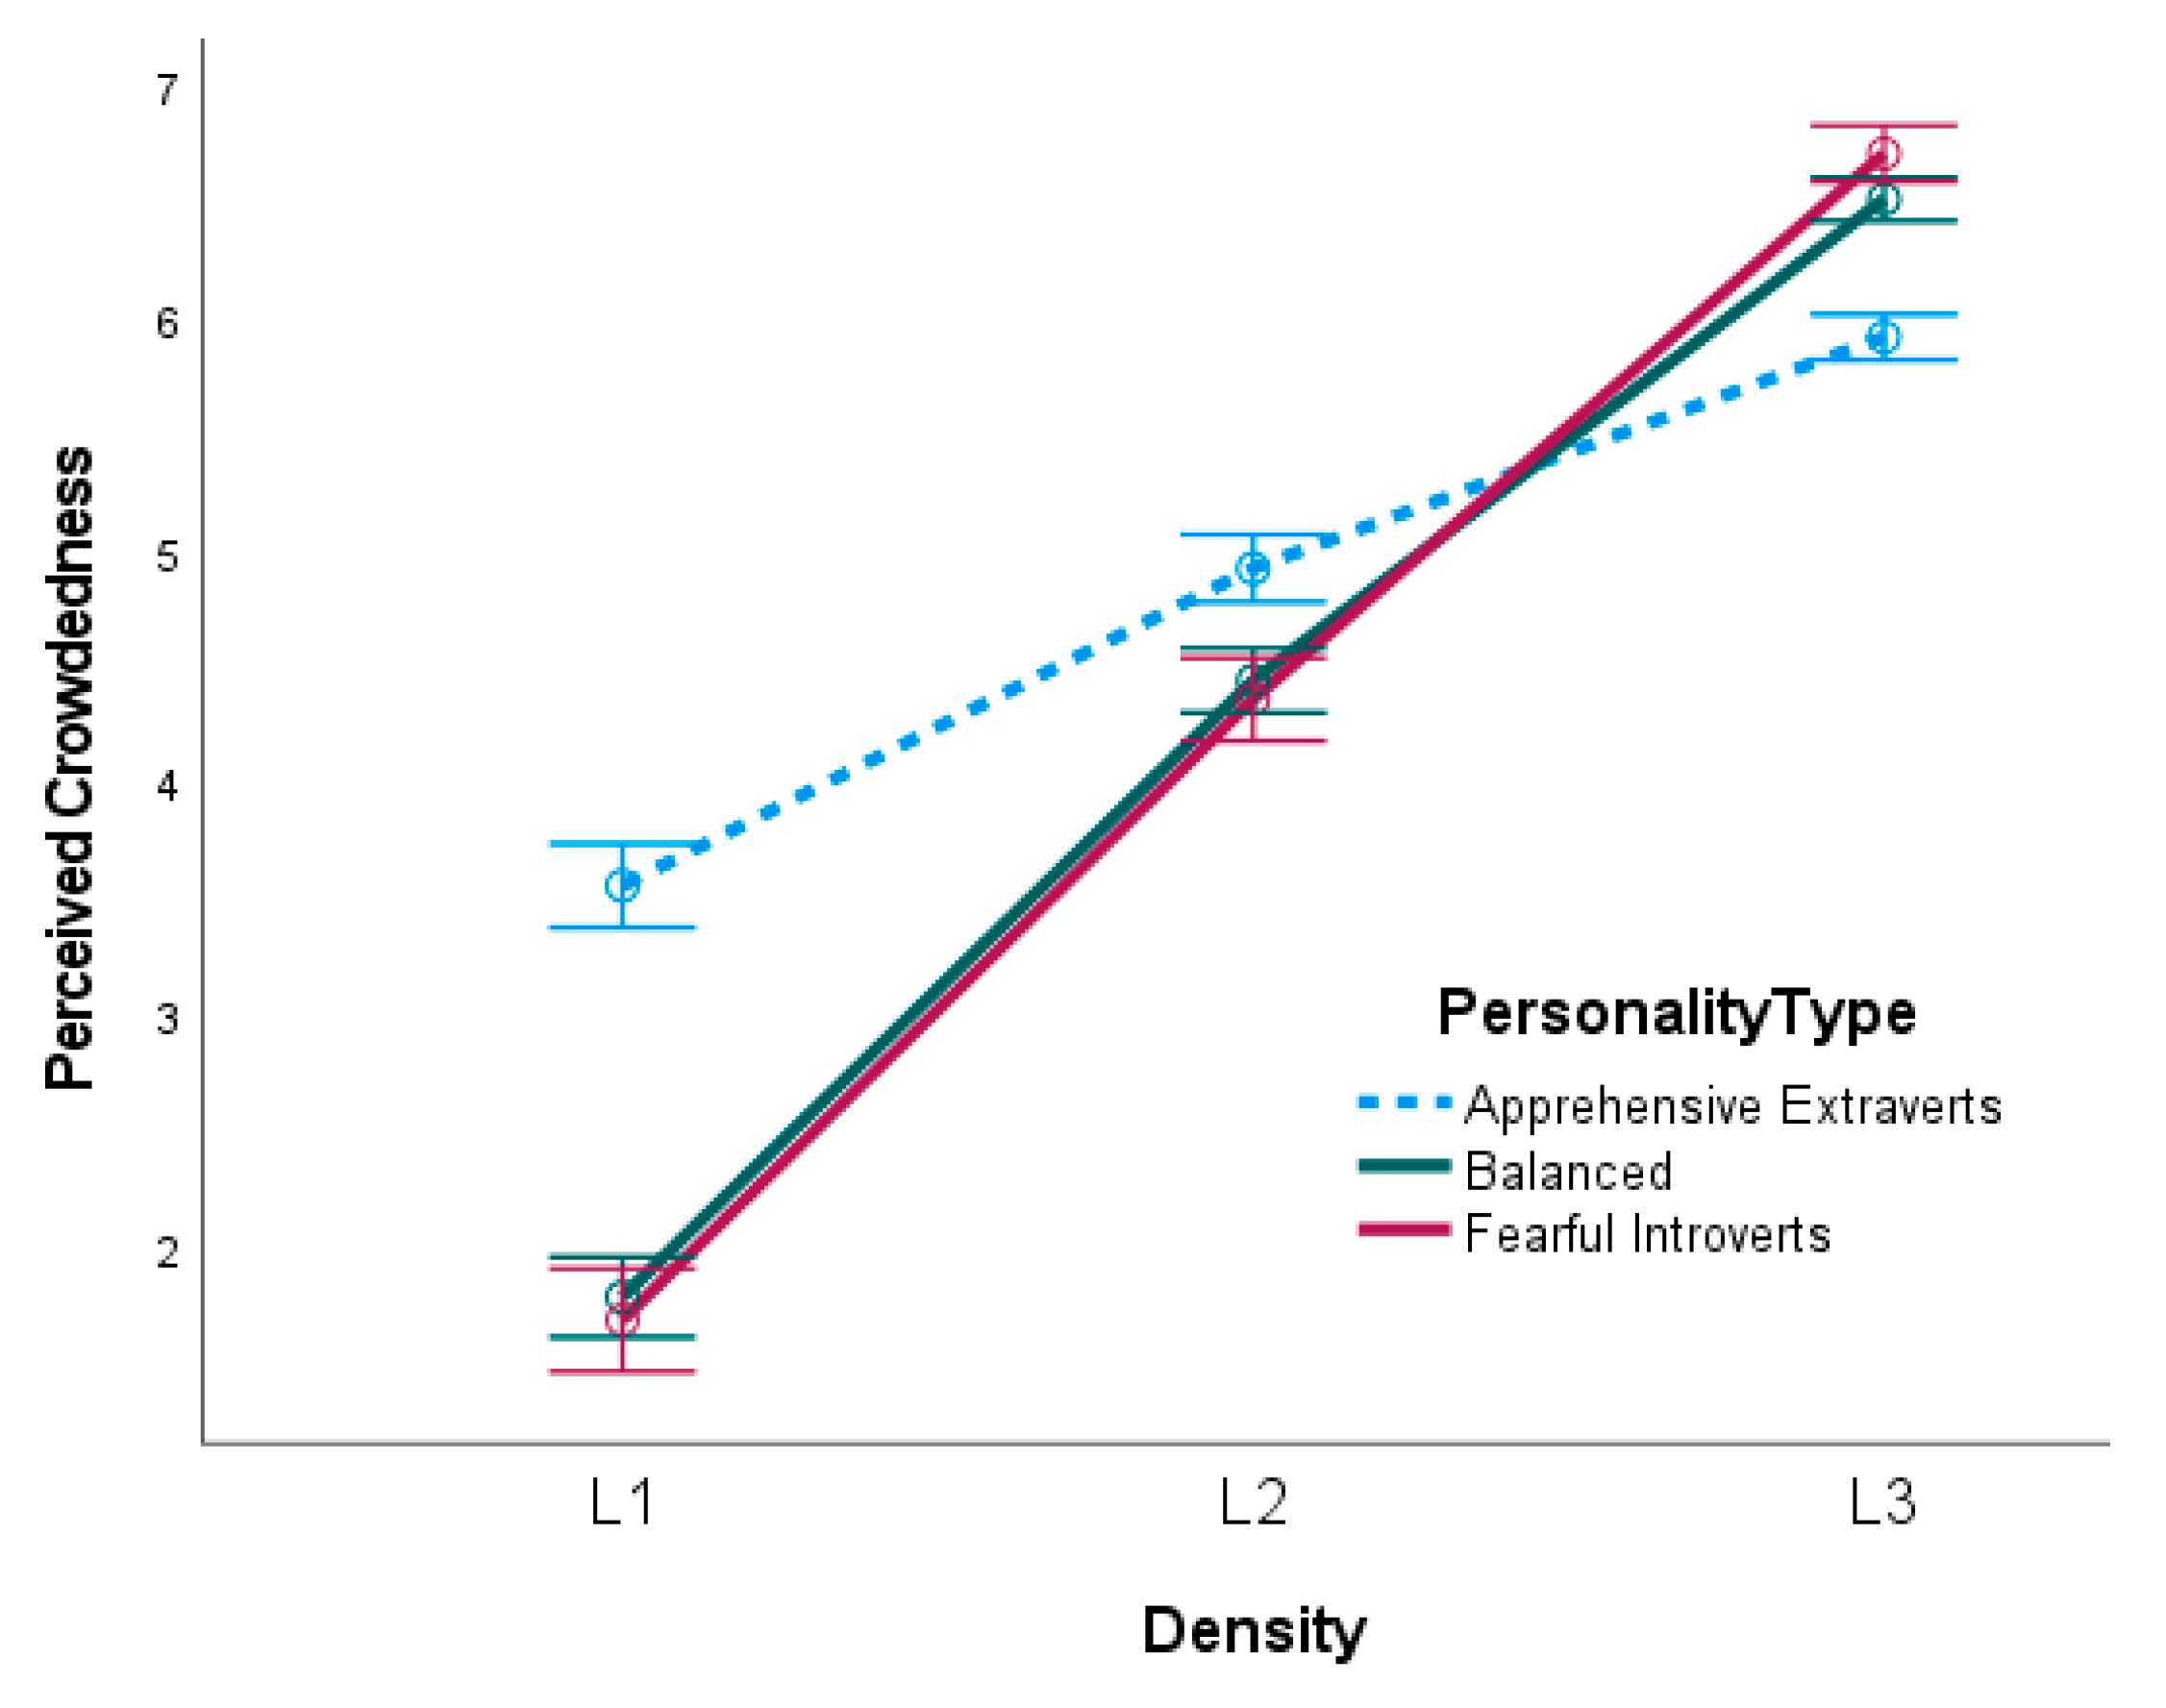
RQ2. Do people with different personality profiles differ in their perception of crowdedness (2a), the feeling of being comfortable (2b), and anticipated experience (2c) at destinations?
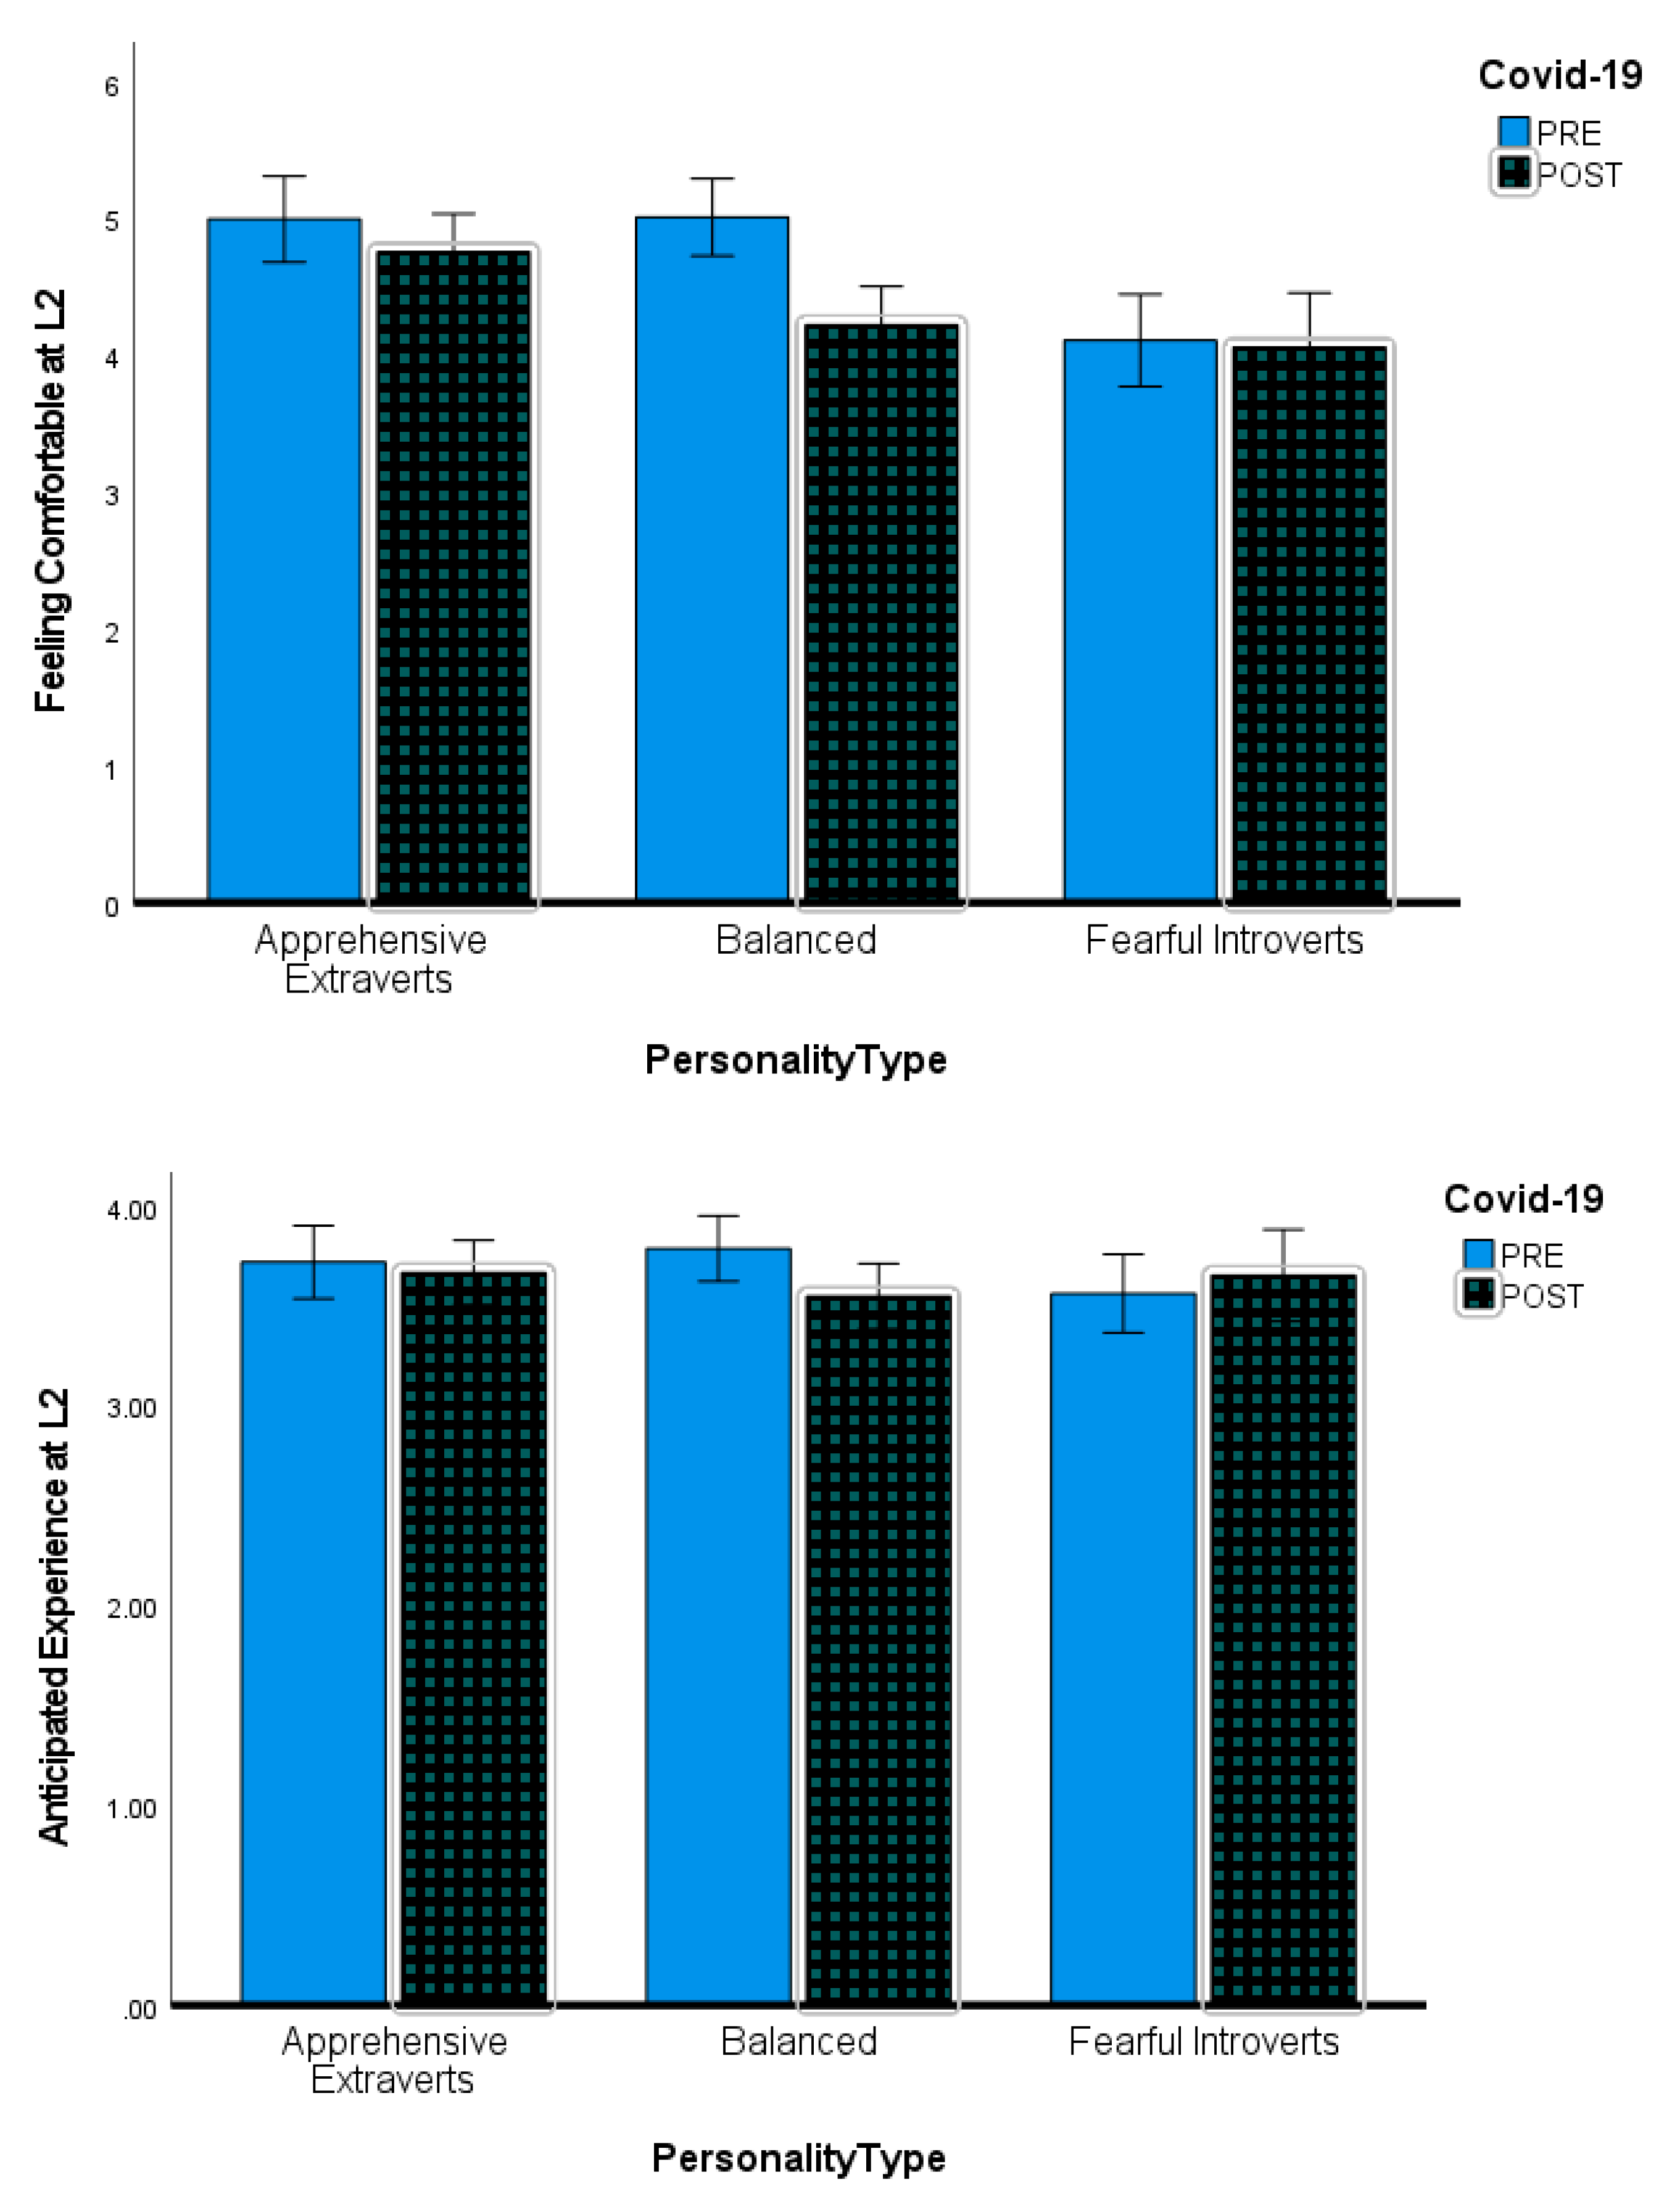
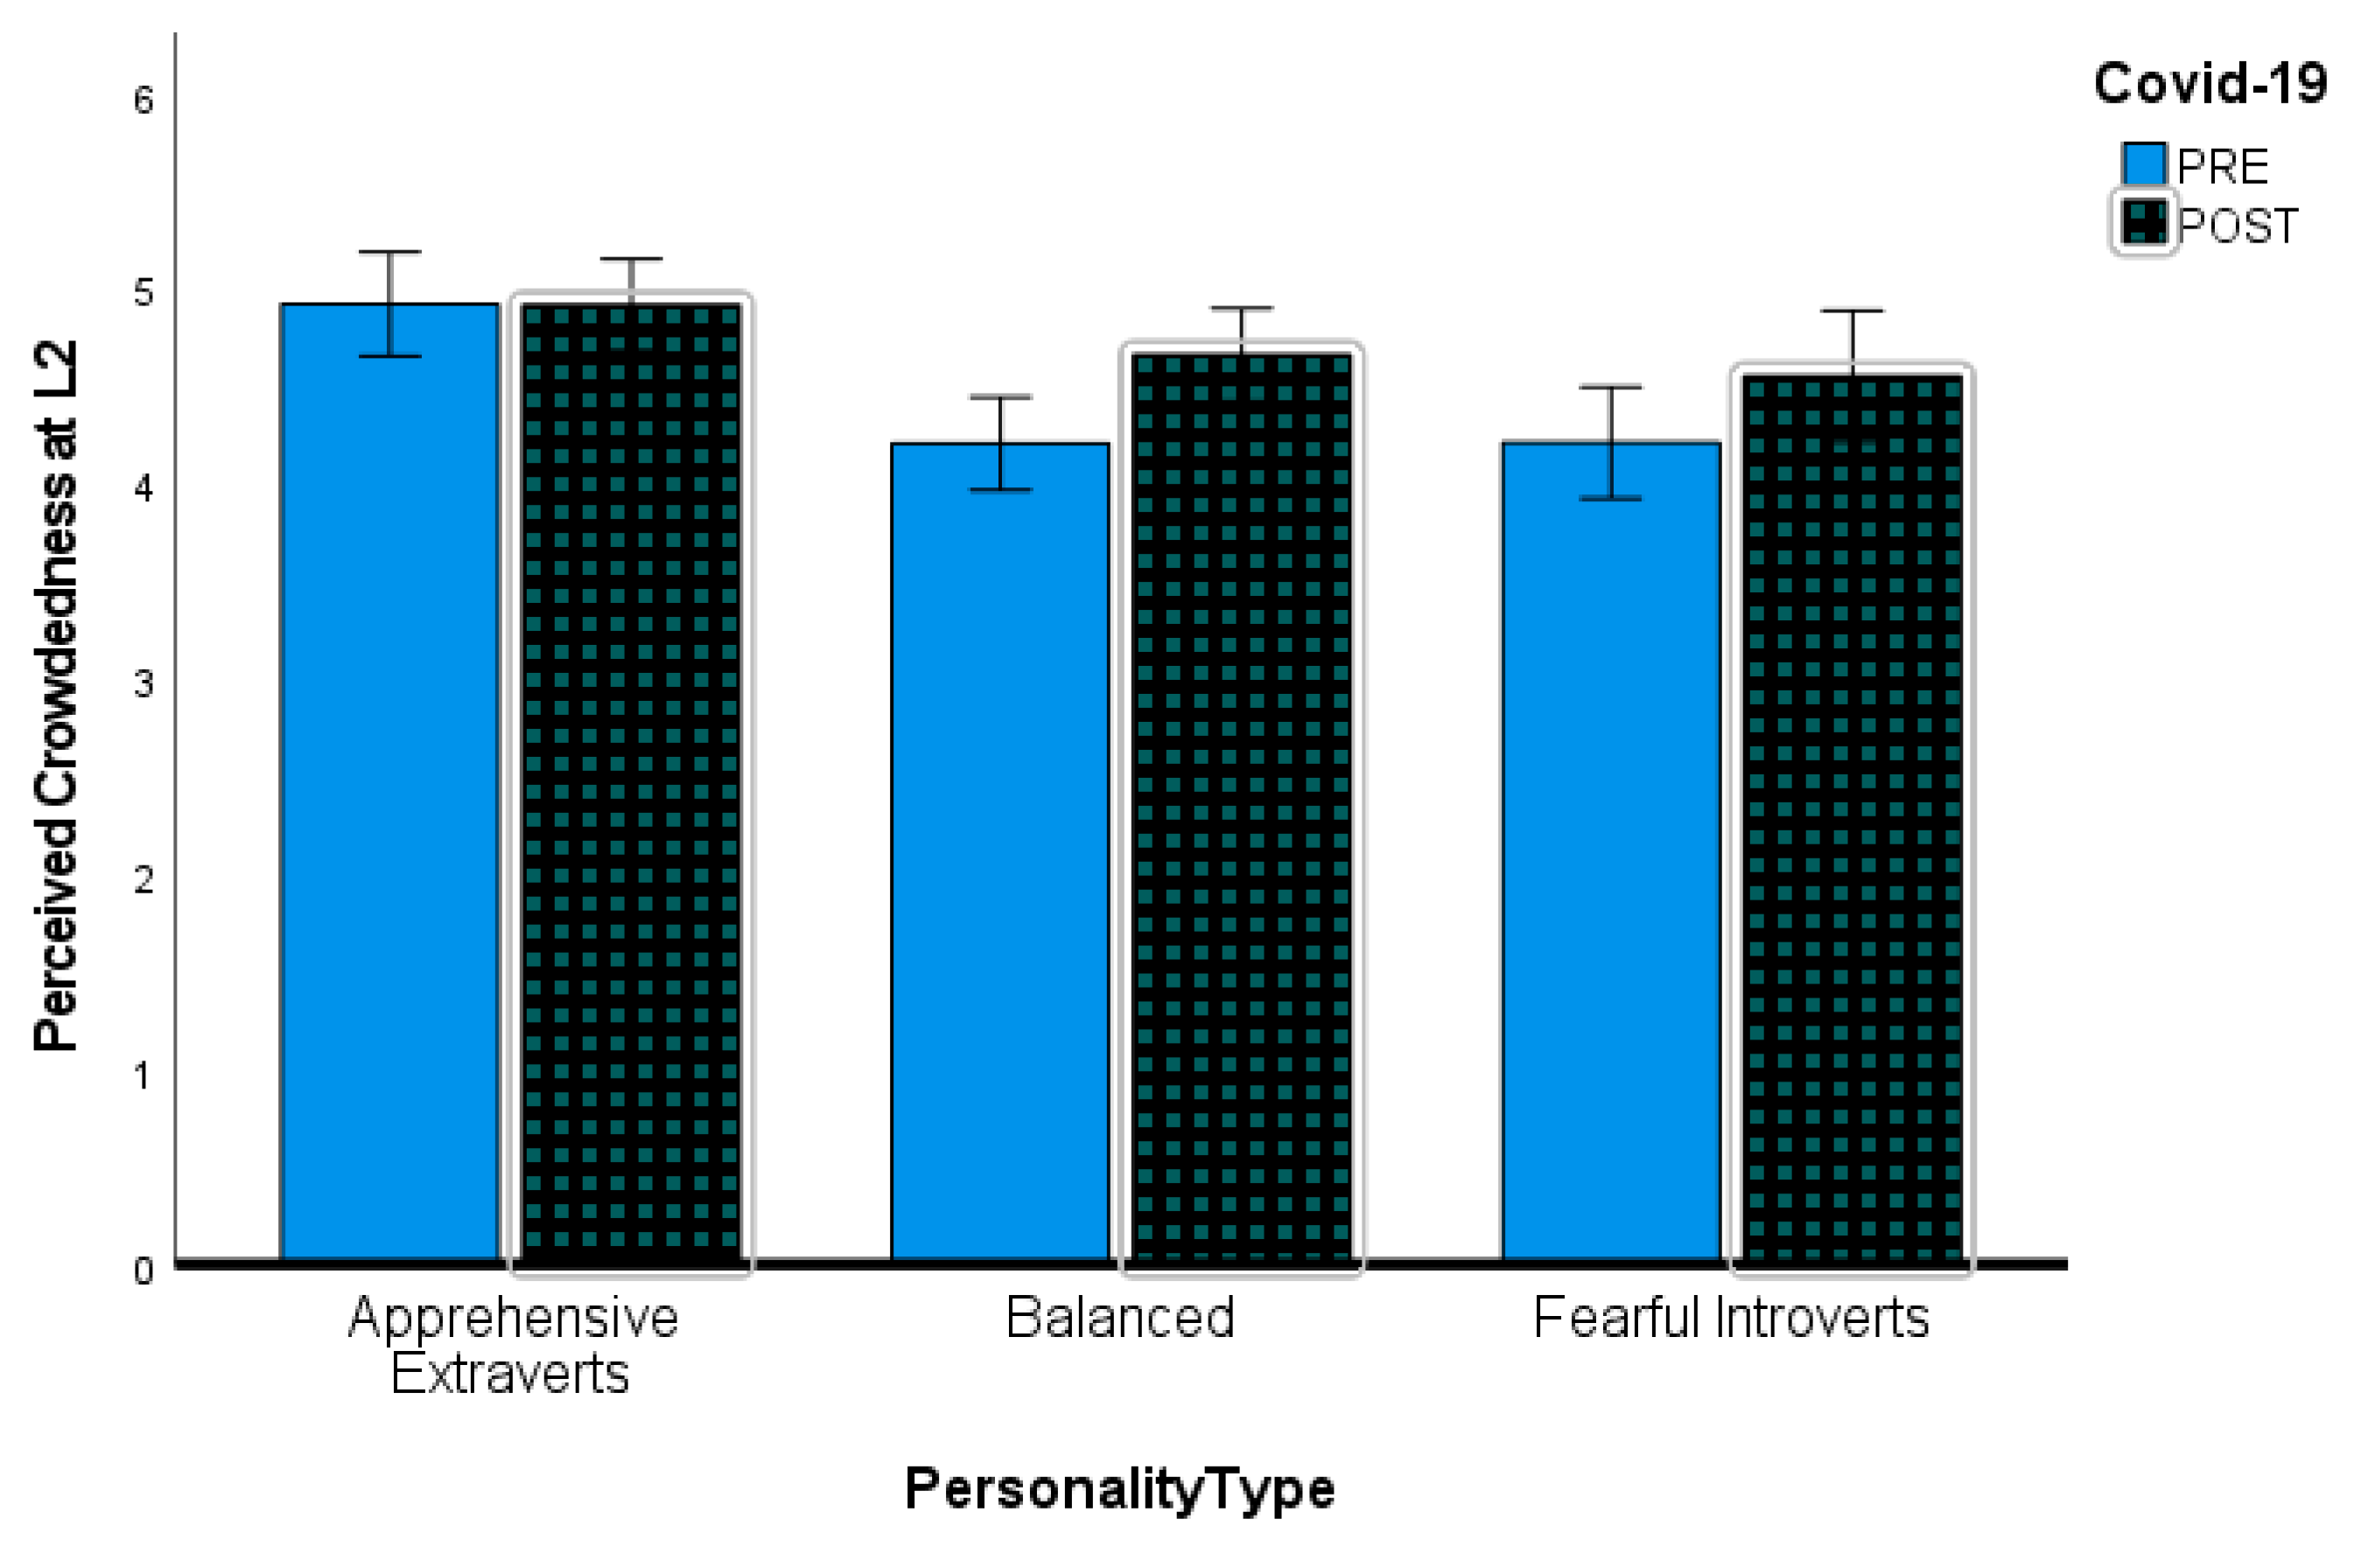
RQ3. Does the PRE–POST-COVID-19 outbreak change in perception of crowdedness (3a), feeling of being comfortable (3b), and anticipated experience (3c) at destinations depend on the personality profile of the individual?

3. Method

3.1. Overall Study Design

To examine people’s reaction to various levels of crowdedness PRE and POST COVID-19 outbreak, the study uses an experimental, repeated-measures, crossover design with the photo-elicitation technique embedded into an online survey. Photo-elicitation, in its original form, is a type of interview that uses images to evoke memories, stimulate the reflection process, and generally provide respondents with an opportunity to express their thoughts, feelings, and experiences. While viewing images, respondents make conclusions not only about manifest content of the photographs (e.g., people, animals, or landscape depicted) but can also form perceptions about the latent content of the images including crowding, the cleanliness of the environment, the safety of the place, the level of economic development, etc. [75].
The data collection was conducted in two steps: 10–24 February 2020 (PRE period), and 28–29 April 2020 (POST period). As follows from the discussion in the Introduction section, the two phases were very different regarding how COVID-19 was covered by the media and perceived in the mind of the public. The PRE period provided data on ‘normal’ reactions to the density at tourist sites: Please answer the questions related to the photos by imagining yourself as a tourist in these places. The POST period provided data for the supposedly changed reactions: Please answer the questions related to the photos by imagining yourself as a tourist in these places when travel restrictions are lifted, and COVID-19 pandemic is over.
The survey respondents were workers from the Amazon Mechanical Turk platform (MTurk). MTurk is a crowdsourcing online platform where human intelligence tasks posted by requesters are completed by anonymous workers in exchange for compensation. The platform is widely used in research, mainly for its ability to provide high-quality data [76] on large and diverse population samples quickly and at a low cost; for instance, Google Scholar reports over 500 tourism publications completed using MTurk. Under proper data quality control, the outcomes of MTurk crowdsourcing and traditional surveys are consistent [77]. Moreover, workers are reasonably representative of the general population across most psychological dimensions [78]. The requirement for recruitment was being a U.S. resident at least 18 years old. To ensure high-quality data, we also required that the workers had at least a 95% approval rate on the site and included two attention check questions to remove inattentive respondents. Finally, compensation was set at $6 per hour on average, which the community of MTurk workers recommends as the ethical compensation rate [79].
The PRE and POST samples in this study, while coming from the same population, consisted of different people. Using the two samples allowed us to see how crowding perceptions changed in the population when the subjects were fully aware of the dangers of COVID-19. It also allowed us to avoid pre-test sensitizations to the research topic, which is inherent in pre–post experiments with the same groups of subjects. The appropriateness of such an approach is further discussed in Section 5.1.

3.2. Measuring Personality Profile

To measure an individual’s BFF personality profile, we adopted a 25-item scale following previous research [72]. The scale draws the items from the International Personality Item Pool [80,81] and has reported internal reliabilities for personality factors in the range of 0.80–0.90. The scale measures Extraversion (start conversations; make friends easily; feel comfortable around people; don’t mind being the center of attention; talkative person), Neuroticism (get stressed out easily; worry about things; filled with doubts about things; panic easily; fear for the worst), Openness (get excited about new ideas; enjoy thinking about things; have a vivid imagination; enjoy hearing new ideas; enjoy looking for a deeper meaning in things), Conscientiousness (carry out my plans; pay attention to details, make plans and stick to them; always prepared; thorough in my work), and Agreeableness (believe that others have good intentions; trust what people say to me; concerned about others; respect others; sympathize with others’ feelings). Individual items were measured using a 5-point Likert scale ranging from 1 (strongly disagree) to 5 (strongly agree), with larger values representing a stronger manifestation of a trait.
For perceived crowdedness at tourist sites pictured in the photos, the single-item measure ranging from 1 (not at all crowded) to 7 (extremely crowded) was utilized [39,82]. The feeling of being comfortable in surroundings exemplified by the images was measured with a scale ranging from 1 (extremely uncomfortable) to 7 (extremely comfortable). The anticipated experience was operationalized as four variables, following previous research [83]: Learning, when tourists increase their skills and knowledge through the educational aspect of the experience; excitement, when tourists’ attention and interest is occupied by tourist site offerings; pleasure, when a destination appeals to senses; and escapism, when tourists seek leisure to escape from their daily lives [84]. To ensure a concise questionnaire, we used one item representing each dimension (1 = strongly disagree; 5 = strongly agree): the place would stimulate my curiosity to learn new things; activities in this place would keep my interest; it would be pleasant just being there; and I would completely escape from my daily routine in this place.

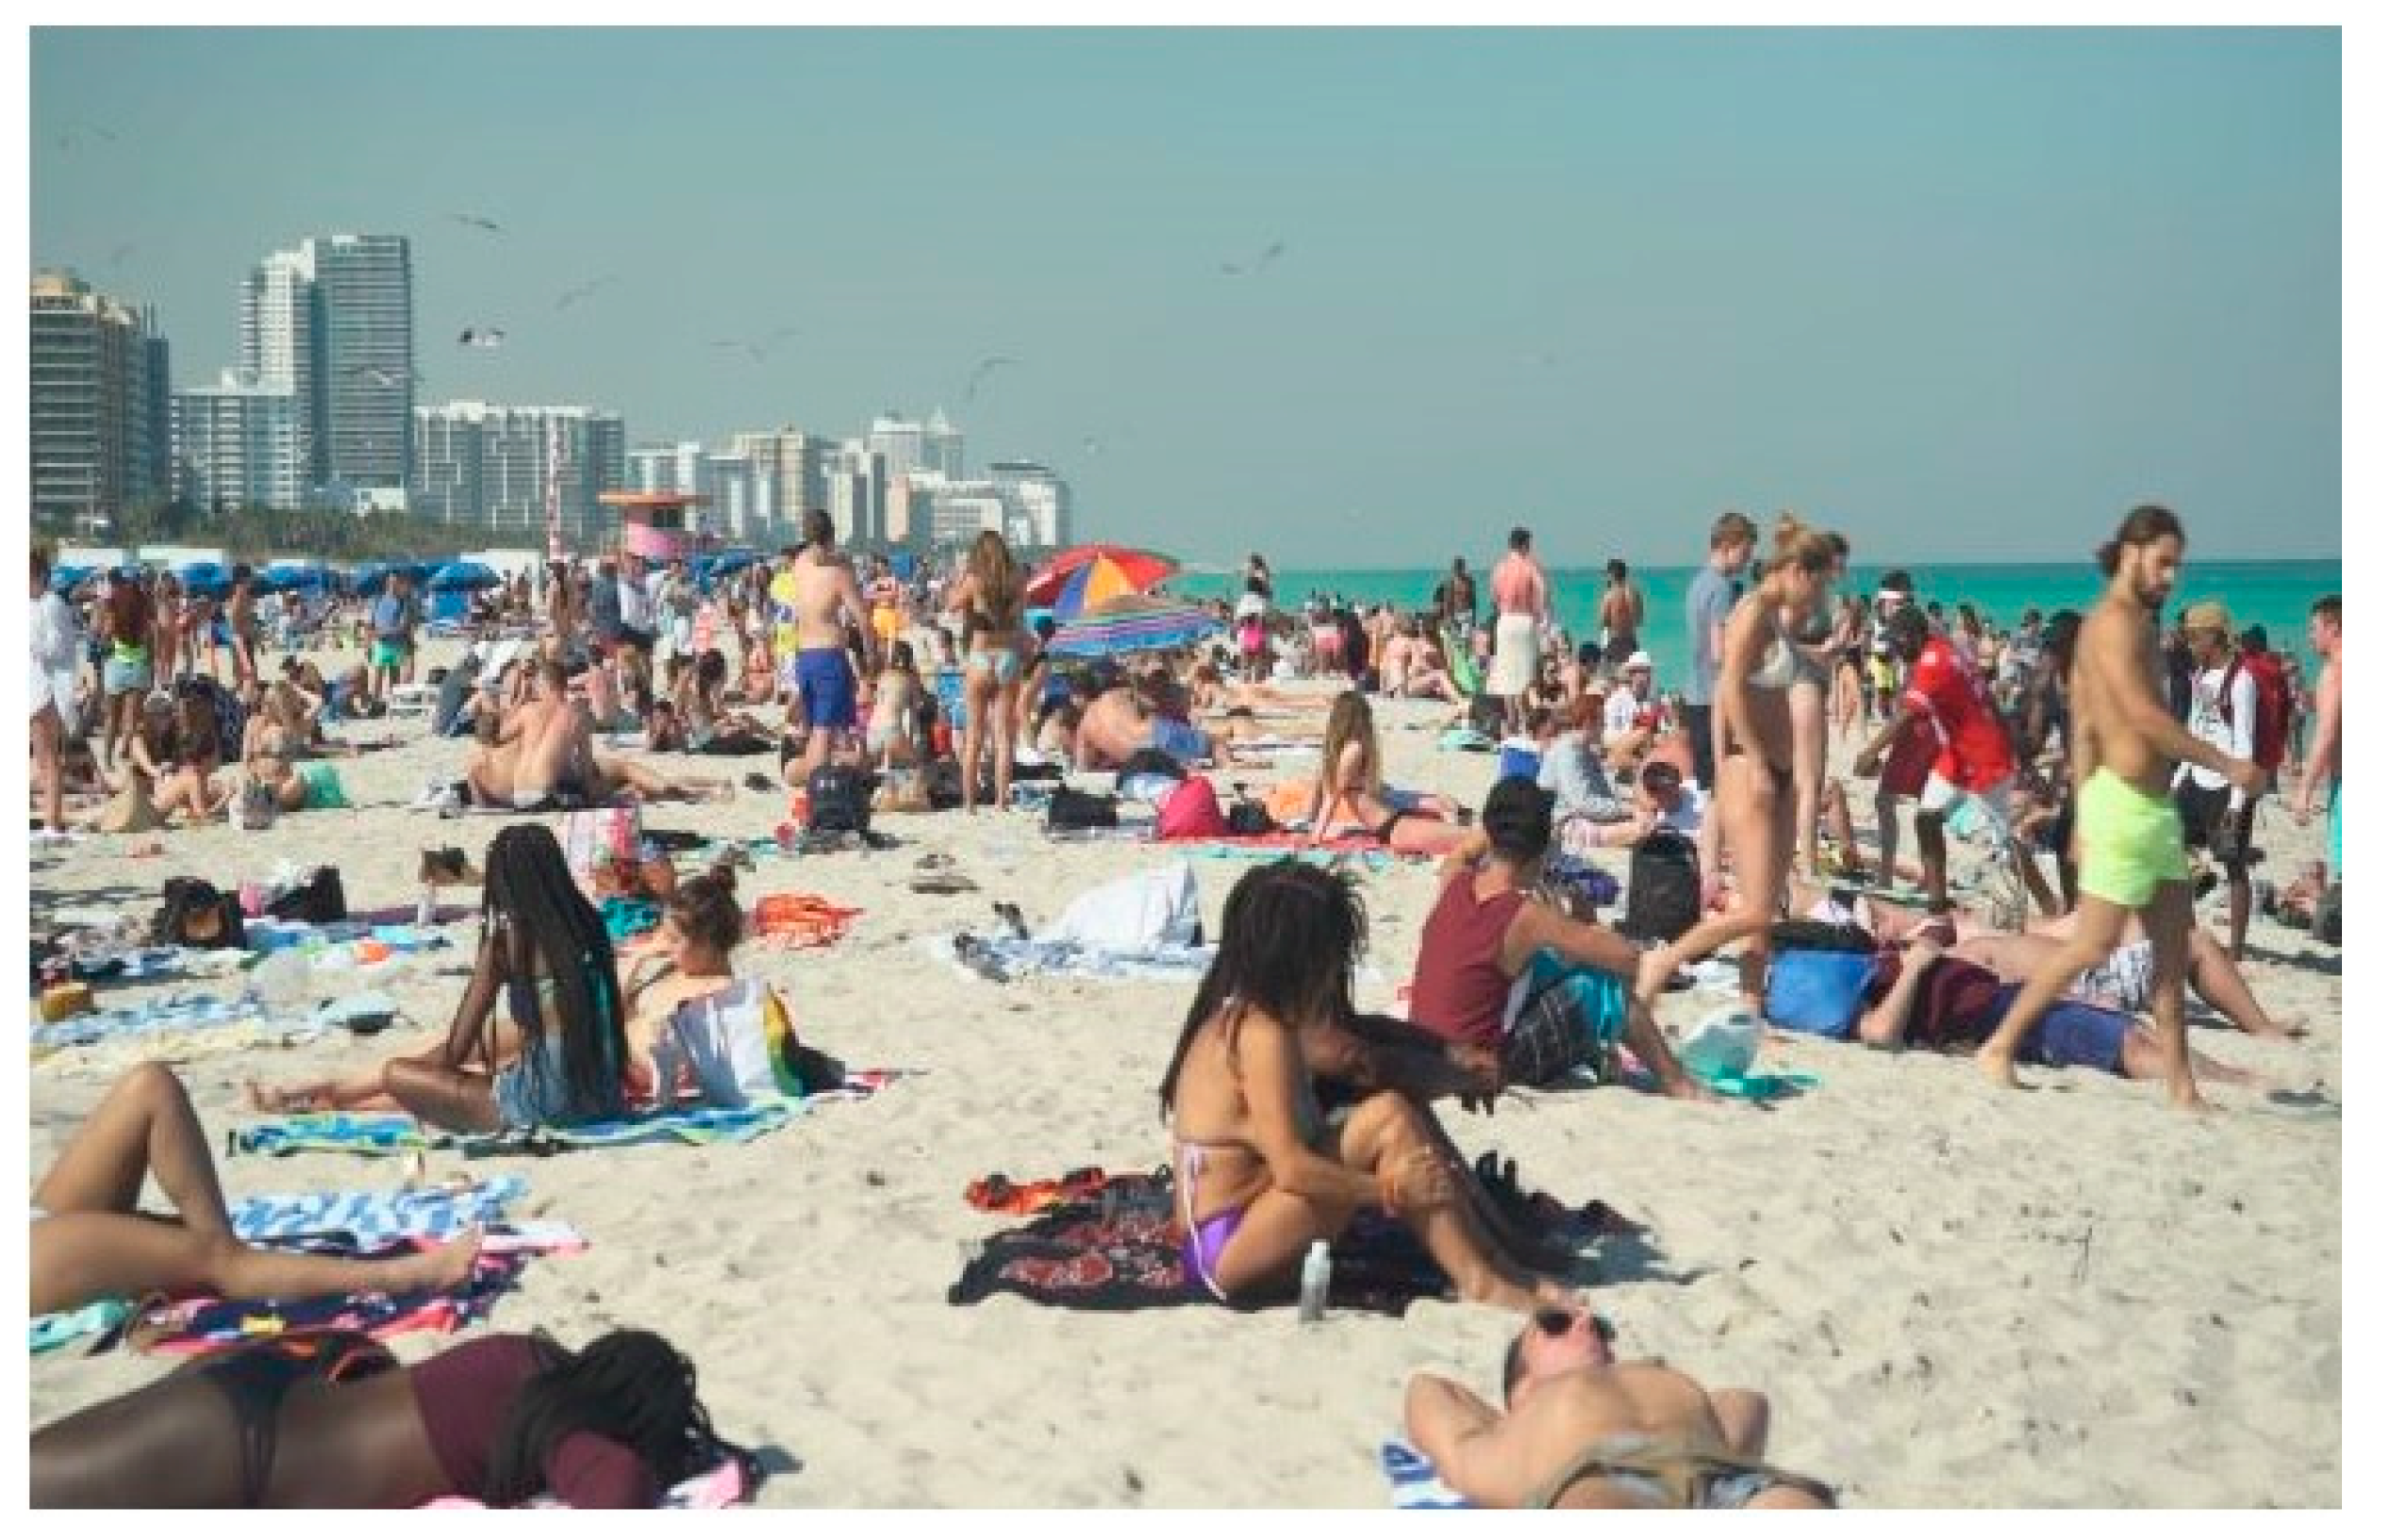
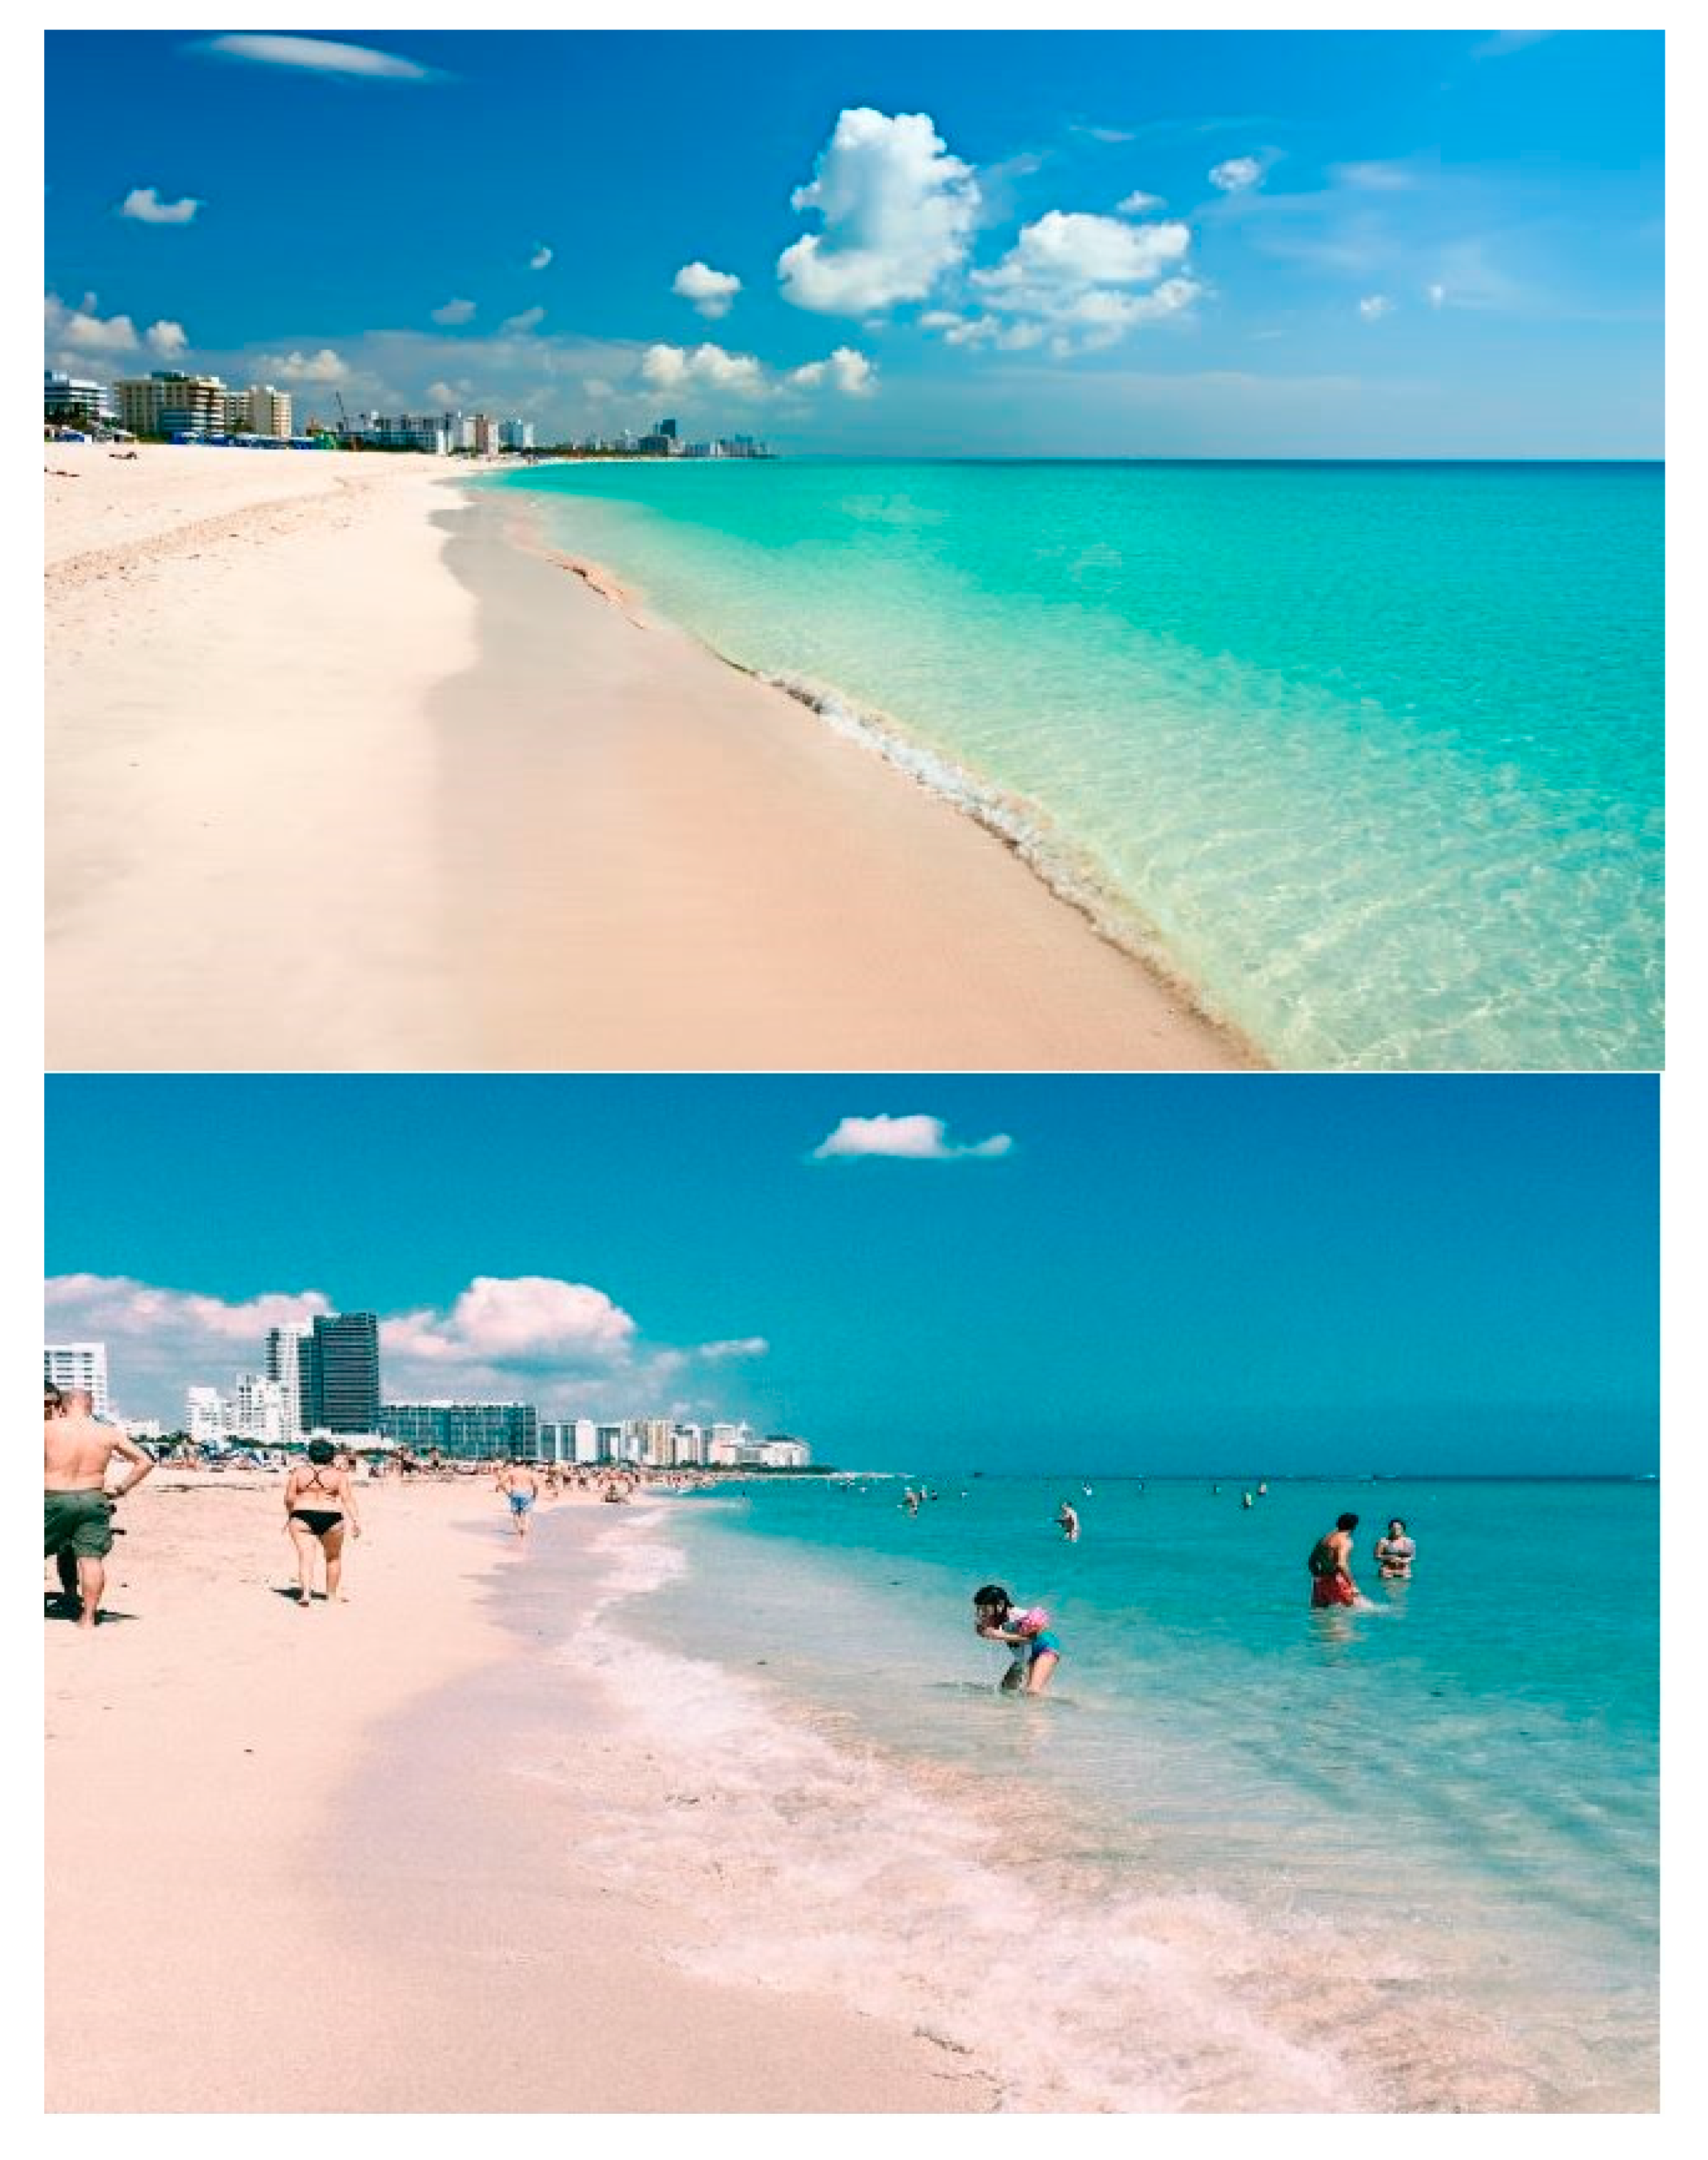
3.3. Selection of Images

We used photographs of 15 sites, with each site pictured at three different density levels. Among selected photographs, there were images of five beaches, five historic sites, and five museums. Since the perception of crowdedness is a function of both individual and site characteristics [36], using several sites was meant to ensure that the obtained results do not ‘hinge’ on one destination type and only one place but are ‘extendable’ to various sites and locations.
We also controlled for potentially confounding factors identified as image quality (assessed by researchers), image composition, and destination’s fame. Regarding image composition, each site was photographed at three density levels from the same vantage point (an example is provided in Figure 1). The density levels L1 (low density with no or just a few people, L2 (medium density), and L3 (high density) were verified by a convenience sample of 13 graduate students from two tourism and hospitality programs. The classification of photographs into three density levels was also verified by the main sample, similarly to the manipulation check in experiments (see Section 4.4). Further, since a more famous place might be evaluated as more desirable and, thus, perceived as offering a better experience even if it was more crowded, we selected attractions of the same ‘caliber’ and provided names for each location. Here is the list of sites used in the study:
  • Beaches: Miami Beach (USA), La Concha Beach (Spain), Magaluf Beach (Spain), Clearwater Beach (USA), Biscarrosse Beach (France).
  • Historic sites: The Great Wall of China (China), Angkor Wat (Cambodia), the ancient city of Ephesus (Turkey), the Colosseum of Rome (Italy), and the Taj Mahal (India).
  • Museums: Uffizi Gallery (Italy), the British Museum (UK), the Metropolitan Museum (USA), the Louvre Museum (France), the Natural History Museum (UK).

3.4. Online Survey

The survey had a permanent section and a randomized section. The permanent section included 25 BFF personality items and questions regarding demographic and travel-related characteristics; we also added a question regarding the level of urbanization of the respondents’ place of residence. For the randomized section, photographs of fifteen selected sites were organized as a collection of separate survey blocks, with each block having images of the same site at three density levels: L1, L2, and L3 (Figure 1). Each image was accompanied by questions asking respondents to evaluate it on perceived crowdedness, the feeling of being comfortable, and anticipated experiences. The randomization assignment provided by the Qualtrics built-in tool included two steps. First, two out of three destination types, e.g., beach and museum, were randomly selected. Then, for each destination type, one out of five destinations were randomly selected, e.g., Miami Beach and the British Museum. We decided to give each respondent only two blocks (with three photos in each) to make the survey manageable.

4. Results

Analyses started with data quality control. We examined the PRE and POST data following previous research [85] and removed non-U.S. residents (PRE: 3; POST: 4), those who failed quality-control questions (PRE: 59; POST: 44), and those in the first decile by the time spent taking the survey, as their time was judged as not feasible for quality responses. As a result, 218 PRE and 220 POST surveys were retained.

4.1. PRE and POST Samples Profiles

Profiles of PRE and POST samples were very similar (Table 1). In both samples, approximately 60% of respondents were male, and the majority of respondents were 25–44 years old. The largest share of respondents (PRE: 40%; POST: 47%) lived in cities with populations of over 100,000 people, while only eight percent lived in rural areas. No statistically significant differences between PRE and POST data were found in the demographic and location variables. People were slightly more educated in the POST sample, as 84% of them had associate, bachelor, or postgraduate degrees, as compared to 75% in the PRE sample: χ2 (df = 2) = 7.39, p = 0.025. Tourist roles favored the roles of family-vacationer, nature-lover, peace-and-quiet seeker, and beach-goer [86]. Nearly 70% of respondents have been to a beach, and approximately 50% have been to a historic site or a museum in the 12 months prior to the survey; these shares were similar in the PRE and POST samples. Another indication that survey respondents were engaged in tourist activities is the sizable numbers of those who reported prior visitations to the destinations they evaluated: For beach sites, it was 27% (80 out of 216), for historic sites, it was 21% (61 out of 292), and for museum sites, it was 24% (68 out of 220). We also compared the PRE and POST samples for each BFF personality item and found no differences, which was yet another piece of evidence that both samples came from the same population but at dramatically different time periods, and that these respondents can be considered tourists.

4.2. Manifest Variables of Personality Traits and Anticipated Experience

Considering that the personality make-up of an individual is stable across time and situations and that the two samples came from the same population, the PRE and POST personality data were pooled together for Principal Component Analysis (PCA) with Varimax rotation. PCA results (KMO = 0.86; total variance explained = 60%; all factor loadings greater than 0.60, and all commonalities but two were greater than 0.50, with the lowest being 0.47) indicated five factors: Neuroticism (α = 0.89), Extraversion (α = 0.86), Conscientiousness (α = 0.85), Openness (α = 0.75), and Agreeableness (α = 0.73). The item I respect others was split between two factors, Agreeableness and Conscientiousness, and, therefore, removed. Manifest variables were obtained via summated scales. To account for the individual’s response-type effect prior to cluster analysis, we applied the row-centering method [87]. Distributional characteristics of the row-centered personality traits can be considered normally distributed (Table 2).
A truly satisfying experience requires satisfaction with each individual dimension, therefore we examined four survey items signifying anticipated experience at a destination—learning, excitement, pleasure, and escapism—on their internal reliability at each density condition PRE and POST. For L1 (low density), the internal reliability measure was αPRE = 0.83 vs. αPOST = 0.77. For L2 (medium density), αPRE = 0.89 vs. αPOST = 0.87. For L3 (high density), and αPRE = 0.92 vs. αPOST = 0.93. Aggregated anticipated experience variables were created by averaging individual experience items (Table 2).

4.3. Personality Profile Clusters

The study used the two-step clustering method, which was introduced by [88] to overcome problems in cluster analysis, particularly frequent in social sciences: Handling datasets where variables with different measurement levels are present (commensurability problem) and determining the optimal number of clusters. The first pre-clustering step of the algorithm with Ward’s distance pointed to potential solutions with three, four, or five clusters. During the second step, cluster memberships for these potential solutions were assigned with the K-means algorithm. Since K-means uses a random seed, the stability of solutions was ascertained via multiple model runs. Interpretability of all three potential solutions was investigated, and the three-cluster solution was selected based on better separation of the final clusters.
The most important predictor variables were Neuroticism (F = 370.53) and Extraversion (F = 253.51); thus, the clusters were labeled with reference to these traits (Table 3). Cluster 1 had Neuroticism well above the sample average and was also high in Extraversion in relation to the sample mean total, and it was labeled Apprehensive Extraverts. This cluster also had low scores on Openness, Conscientiousness, and Agreeableness. Cluster 2 was characterized by the lowest E-trait and the highest N-trait. These respondents also reported more Openness and Conscientiousness but less Agreeableness. We labeled this cluster Fearful Introverts. Cluster 3 respondents were the lowest in the N-trait, high in the E-Trait, and, in addition, demonstrated high scores on the remaining three traits. This cluster was labeled Balanced. The three clusters did not differ on gender (p = 0.360). They did, however, differ by age (p < 0.001), with disproportionately more Fearful Introverts being in the youngest group and Balanced in the oldest group, and education (p < 0.001), with the Apprehensive Extraverts being the most educated.

4.4. Effectiveness of Experimental Manipulation of Density Levels on the Photographs

To confirm that perceptions of crowdedness were indeed increasing across three levels exemplified by the photographs as low (L1), medium (L2), and high (L3) density, we conducted a repeated-measure ANOVA, with perceived crowdedness being the dependent variable. The results showed that L1 photos were perceived as least crowded (M = 2.39), L2 photos as more crowded (M = 4.58), and L3 photos as the most crowded (M = 6.33): Wilks Λ = 0.264, F (2, 874) = 1219.75, p < 0.001, η2 = 0.736, which is a large effect [89]. Further, repeated-measure ANOVA analyses were conducted for the feeling of being comfortable and anticipated experience variables. When the density level increases, the feeling of being comfortable and the anticipated experience at a site decrease: η2= 0.61 (large effect) and η2= 0.51 (large effect), respectively (Table 4). Destination type had a negligible or no effect on perceived crowdedness: Wilks Λ = 0.984, F (4, 1744) = 3.45, p < 0.008, η2 = 0.008; the feeling of being comfortable: Wilks Λ = 0.986, F (4, 1744) = 3.08, p < 0.015, η2 = 0.007; and the anticipated experience: Wilks Λ = 0.990, F (4, 1744) = 2.17, p < 0.071, η2 = 0.005. Because of this result, destination setting as a factor was eliminated from consideration. We conclude that the results reported in this section conformed to the expectations, and we proceeded to investigate research questions 1, 2, and 3.

4.5. Research Question 1

Three repeated-measure ANOVA tests were used. The dependent variables were perceived crowdedness (1a), feeling of being comfortable (1b), and anticipated experience (1c). The within-subject factor was the density level (L1, L2, and L3). The between-subject factor was COVID-19 (PRE and POST). We have already reported the effect of the density level on each dependent variable (Table 4), so here we report the interaction effects of density level and COVID-19 factors only.
For perceived crowdedness, Wilks Λ = 0.99, F (2, 873) = 1219.75, p = 0.008, η2 = 0.011 (small effect). The significant result is due to the differences in perceptions at the L2 level: MPRE, L2 = 4.43, MPOST, L2 = 4.74, F = 11.42, p = 0.001, η2 = 0.013 (small effect). No significant differences were found at L1 or L3 density levels. For the feeling of being comfortable, the test result is not significant, p = 0.162. For anticipated experience, the test result is not significant either: p = 0.093. The results are visualized in Figure 2. The results indicate that the COVID-19 factor impacts the study variables at the level of medium density.

4.6. Research Question 2

To test whether the study variables of perceived crowdedness, the feeling of being comfortable, and the anticipated experience at a destination differ depending on the personality type of the respondents, repeated-measure ANOVA tests were used. The dependent variables were perceived crowdedness (2a), the feeling of being comfortable (2b), and anticipated experience (2c). The within-subject factor was the density level (L1, L2, and L3). The between-subject factor was personality type (Apprehensive Extraverts, Fearful Introverts, and Balanced). The results of the analyses are visualized in Figure 3.
Regarding perceived crowdedness, both main and interaction effects were significant. For the main effect of density level, Wilks Λ = 0.21, F (2, 872) = 1651.19, p < 0.001, η2 = 0.791. For the interaction effect of density level and personality type, Wilks Λ = 0.74, F (4, 1744) = 72.02, p < 0.001, η2 = 0.132. The test of the between-subjects effect for personality type was significant: F (2, 873) = 44.05, p < 0.001, η2 = 0.092. Apprehensive Extraverts had higher perceptions of crowdedness at low (MAE, L1 = 3.54, MB, L1 = 1.77, MFI, L1 = 1.67) and medium density (MAE, L2 = 4.91, MB, L2 = 4.43, MFI, L2 = 4.35) levels and lower perceptions of crowdedness at the high level of density (MAE, L3 = 5.91, MB, L3 = 6.50, MFI, L3 = 6.70) than the other two groups.
Regarding the feeling of being comfortable, both main and interaction effects were significant. For the main effect of density, Wilks Λ = 0.34, F (2, 872) = 841.50, p < 0.001, η2 = 0.659. For the interaction effect, Wilks Λ = 0.82, F (4, 1744) = 44.59, p < 0.001, η2 = 0.093. The test of the between-subjects effect for personality type was significant: F (2, 873) = 26.84, p < 0.001, η2 = 0.058. The largest difference between clusters was observed at the L3 level: MAE, L3 = 3.90, MB, L3 = 2.70, MFI, L3 = 1.94.
Regarding anticipated experience, both main and interaction effects were significant. For main effect, Wilks Λ = 0.44, F (2, 872) = 563.92, p < 0.001, η2 = 0.564. For the interaction effect, Wilks Λ = 0.83, F (4, 1742) = 42.57, p < 0.001, η2 = 0.089. The test of the between-subjects effect for personality type was also significant: F (2, 873) = 11.64, p < 0.001, η2 = 0.017. The largest difference between clusters was observed at the L3 level between Apprehensive Extraverts and Fearful Introverts: MAE, L3 = 3.30, MB, L3 = 2.71, MFI, L3 = 2.32.
The results answer Research Question 2 affirmatively: Personality profiles affect the perception of crowdedness at a destination and the associated inner states of feeling comfortable and anticipated quality of experience, and these effects depend on the density level at a destination. Apprehensive Extraverts demonstrate the smallest difference between L1 and L3 levels for each dependent variable, indicating that this is the least-sensitive group to changes in the crowding conditions at a destination.

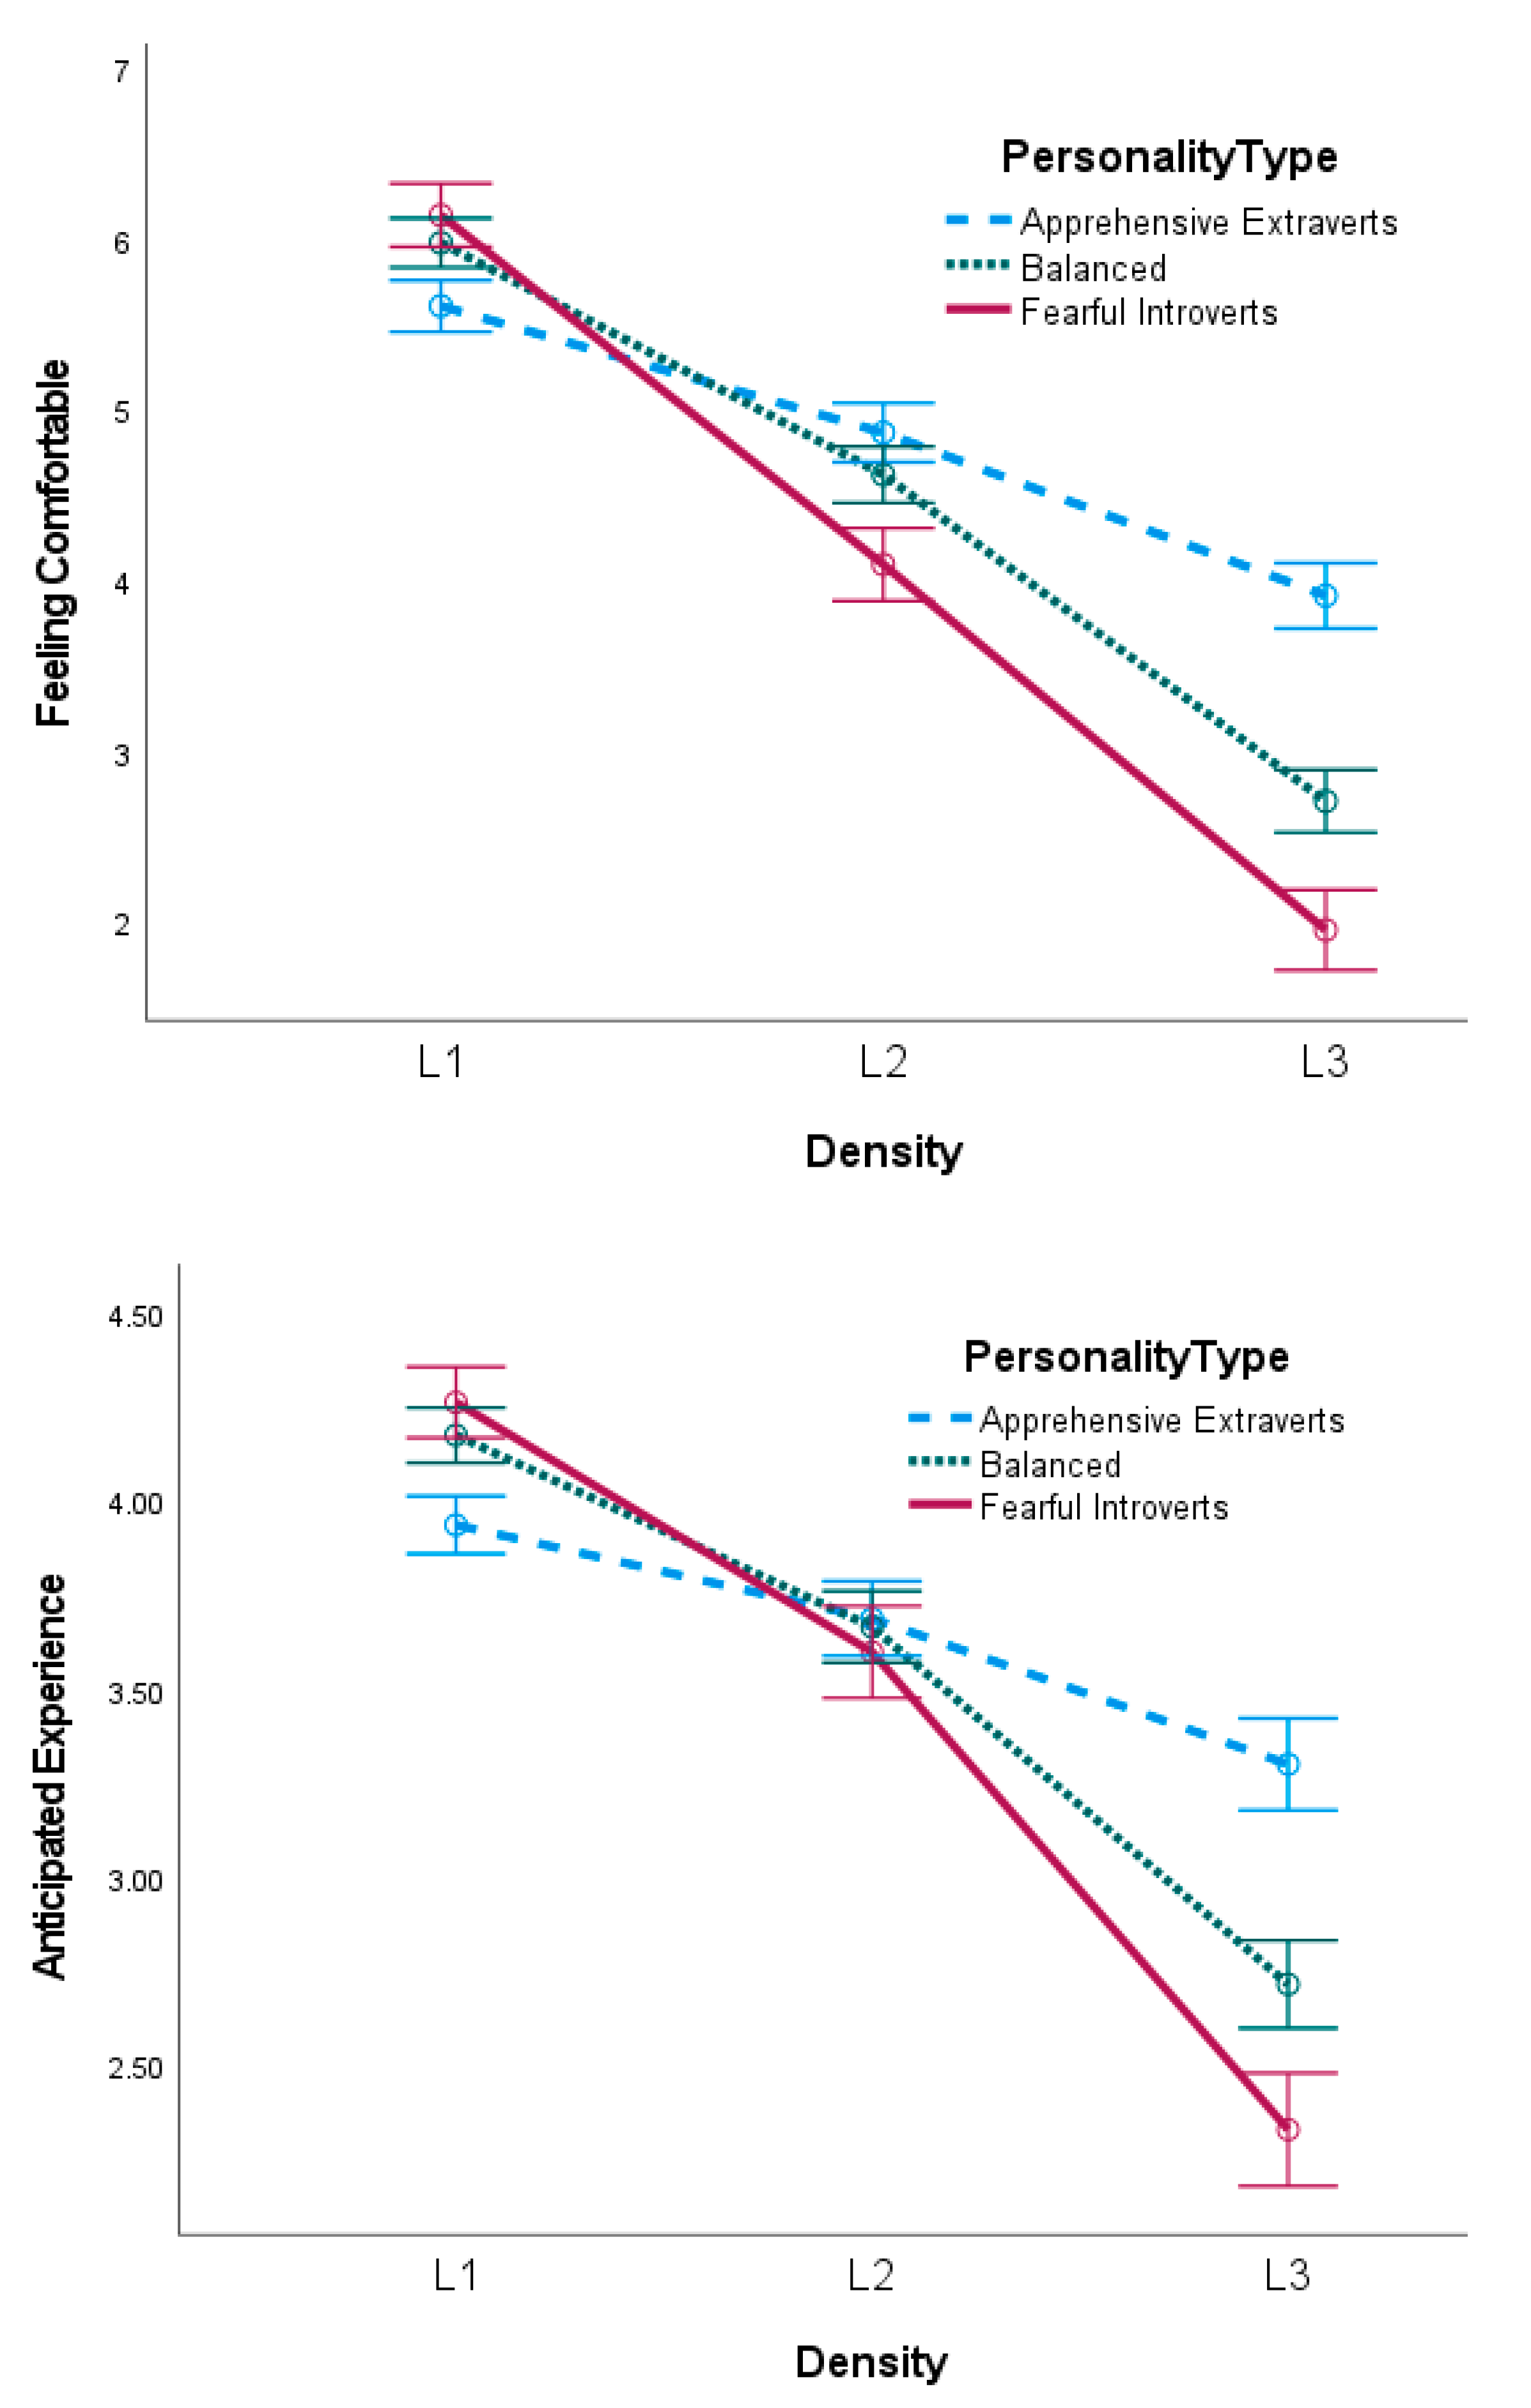
4.7. Research Question 3

To test whether changes due to COVID-19 in the perception of crowdedness, the feeling of being comfortable, and the anticipated experience are associated with personality profiles, we conducted two-way MANOVA tests at each density level. Performing three MANOVA tests (as opposed to nine ANOVA tests) also provided us with a more liberal significance level in each omnibus test after the Bonferroni correction was applied: α = 0.05/3 = 0.017 [90]. The effects of COVID-19 and personality profiles have already been reported; therefore, we focus only on the interaction effects of personality profiles and COVID-19 factors.
The multivariate test for the interaction effect was marginally statistically significant only for the medium density level L2: Wilks Λ = 0.985, F (6, 1738) = 2.22, p < 0.039, η2 = 0.008. The variable feeling of being comfortable was mainly responsible for this effect: F (2, 870) = 4.40, p < 0.013, η2 = 0.010. The PRE–POST difference was the largest for the Balanced group: MPRE = 5.01 MPOST = 4.22, F (1, 346) = 19.92, p < 001, η2 = 0.054 (small-to-medium effect). For L1 and L3 density levels, the interaction effect was not significant: p = 0.158 and p = 0.207, respectively. Figure 4 visualizes the results for the L2 level for all three variables. We conclude that personality profiles mediate the effect of COVID-19 on the study variables.

5. Discussion

The study found that perceptions of crowdedness at tourist locations and associated states of feeling comfortable and anticipated experience changed very little after the COVID-19 outbreak (Figure 2). This result might seem counterintuitive; however, in situations when there are just a few people with whom one shares destination space or, in contrast, when the space is packed, the perception of crowdedness has little room for change. The results indicate that the largest change occurs at the medium level of density, as this level is the one most open for interpretation (Figure 2). However, the effect associated with perceived crowdedness was small, even though, for two months prior to the second data collection, people had been advised by federal agencies [20], local governments, and mass media to keep physical distance between themselves and others and stay out of crowded locations. The small effect detected due to the COVID-19 outbreak is attributed almost entirely to the Balanced group (high E-, low N-, high O-, C-, and A-traits) which had the highest scores for agreeableness and conscientiousness traits, which are known to influence compliance with norms and regulations [91]. However, overall, the findings indicate that evaluations of crowding and associated internal states are rather stable in the PRE- and POST-COVID-19 outbreak periods, likely because they depend on personality type and motivational goals, which are not easily malleable [58].
The results of the study support the positioning that personality differences influence individuals’ evaluation of the physical environment because of tourists’ different privacy and distance needs [41]. More specifically, the study findings contribute to the literature by clarifying the relationship between personality type and destination density. Apprehensive Extraverts (high N-, high E-, low O-, low C-, average A- traits) were the least sensitive to increased density, as extraversion is connected to sociability, adventurousness, and excitement-seeking. Apprehensive Extraverts, however, evaluated low-density places as more crowded than the other two personality types, and the high-density places as less crowded; they were also the most comfortable group when images pictured high-density locations: MAE = 3.90 vs. MB = 2.13 and MFI = 2.67, p < 0.001. This result agrees with findings in psychology that people with high neuroticism and sufficiently extraverted are more comfortable with people around them [64]. Fearful Introverts (highest N-, lowest E-, high O-, high C-, low A- traits) were the group least tolerant of crowds as indicated by their lowest scores for feelings of being comfortable in medium- and high-density settings (Figure 3). This result indicates that tourists of this type have a higher aversion to crowds and prefer the company of a few friends over a large social gathering [92].
The results of the study made us cautiously optimistic that when the epidemic is subdued and travel restrictions are lifted, visitations are likely to return to the pre-pandemic levels. Industry research [93,94], as well as huge crowds in the US nature parks in summer 2021 and high demand for cruise vacations [95], provide evidence in support of this finding. We did, however, find that there might be segments in the population whose personality profile is less tolerant to crowdedness in the post-COVID-19 era, and the industry must meet the challenge of accommodating those visitors. For example, even as this study was conducted, Angkor Wat and the British Museum published information about peak seasons and weekdays when they were less busy. The British Museum provided sensory maps indicating which expositions were crowded, noisy, or had subdued lighting. Such maps and GPS-based mobile applications tracking real-time visitors might be especially appreciated by personality types that are low on extraversion but whose neuroticism scores are high. Future research, however, needs to expand on the role of personality by using all five BFF traits, specifically with differentiations on “compliance features” in addition to neuroticism and extraversion. It should also closely examine the role of the destination type. While the current study did not find any effect of this factor, a more comprehensive analysis that includes a variety of destinations and attraction settings is advisable to learn tourists’ perceptions of visitor density and associated internal states.

5.1. Methodological Considerations, Limitations, and Future Research

In this section, we mainly focus on the issue of the study samples, as there have been concerns about the use of M-Turks as study subjects [77,78]. We used two different samples from the same population to compare how this population’s response to density changed at the POST stage when, supposedly, the subjects were fully aware of the dangers of COVID-19. Tracking the same sample was not an option, as the first data collection was conducted when the dangers of COVID-19 were not clear to either the population or the researchers themselves. Therefore, the study is similar to public opinion surveys that track public response to a particular issue through time. The two samples were statistically the same in almost all characteristics and, as was discussed in Section 3.1, the two samples can be considered reasonably representative of the general population across most psychological dimensions [78], with a possible exception of Extraversion [96].
Concerning this fact, we cross-checked personality characteristics as they were reported by respondents with results of other studies. Extraversion was negatively correlated with the N-trait (−0.17, p < 0.001) and positively correlated with O- (0.19, p < 0.001), C- (0.19, p < 0.001), and A- (0.41, p < 0.001) traits, in agreement with previous research [66]. Agreeableness was positively associated with age, F (4, 433) = 4.41, p = 0.002 [57], and women were more associated (p = 0.037) with the A-trait [97]. For the E-trait, which was supposed to be negatively associated with age [57], we did not obtain a significant result. Considering that research on personality traits and demographic characteristics is still ongoing, we concluded that our results were, overall, compatible with previous findings. However, the fact that we did not measure the subjects’ awareness level about the dangers of COVID-19 is a limitation of the study that needs to be addressed in future research.
For analyses related to respondents’ profiles, each subject was counted once. For ANOVA and MANOVA analyses, however, each participant (who evaluated two destinations) was considered as two separate people, each evaluating photos of one destination. Such a design increases the power of statistical analysis by better populating the ANOVA and MANOVA cells [90]. The scheme was first suggested by a previous study [98]; it is called a two-period crossover design for three treatments and has roots in biomedical research [99,100]. One particular concern for the crossover designs is the possibility of the carryover effect expressed as treatment-1 affecting the outcomes of treatment-2. In our case, it would be the possibility of the evaluation of, for example, beach images affecting the evaluation of museum images. We formally tested for carryover effects following the procedure described by [99] and found none, e.g., for feeling of being comfortable, the independent-samples t-test failed to reject the null hypothesis for all three destination pairs: Beach–historic site (t = 0.22, p = 0.41), beach–museum (t = 0.54, p = 0.29), and historic site–museum (t = 0.30, p = 0.38). Non-significant results were recorded for the other two variables as well.
It is also important to note that our study dealt with only one aspect of the social environment of a person: Human density at tourist places. Multiple other characteristics of the natural and social environment such as the temperature, air quality, and being alone or with a friend affect personal experiences [101,102], possibly including perceptions of crowdedness. Another important question is the longevity or permanency of the COVID-19 effects on crowdedness perceptions. We did not instruct the participants to elaborate on any of those characteristics, and future research is necessary to determine those effects.

5.2. Conclusions

The study contributes to both crowding and personality research in the tourism context by investigating whether crises and disruptions of high magnitude change tourists’ perceptions of crowding at various levels of density at destinations, as well as perceptions of being comfortable and anticipated tourism experience. The two-phase data collection allowed an examination of respondents’ reactions to the same experimental stimuli (images depicting different levels of tourist density) before and after the COVID-19 outbreak, which makes the study also relevant to address concerns about the future of tourism in the post-COVID-19 world. The experimental design based on the photo-elicitation technique and genuine photos of locations aimed for maximum realism in the experimental conditions. The authors consider the results encouraging for the industry: The effect of COVID-19 was small and registered at the medium level of tourist density only. The study also identified personality profiles most sensitive to change in density levels: Fearful Introverts demonstrated the largest drop from low- to high-density levels in the feeling of being comfortable and anticipated tourist experience. Personality profile is also a moderator in response to COVID-19: Tourists with the Balanced personality profile demonstrated the largest change in the feeling of being comfortable and anticipated experience in the post-COVID-19 situation. Interestingly, the effect of destination type was negligible, and future research is recommended to verify this finding.

Author Contributions

Conceptualization, H.D.-D. and S.S.; methodology, A.P.K., H.D.-D. and S.S.; formal analysis, H.D.-D. and S.S.; investigation, A.P.K., H.D.-D. and S.S.; resources, S.S.; data curation, A.P.K. and S.S.; writing—original draft preparation, H.D.-D. and S.S.; writing—review and editing, S.S.; visualization, S.S.; supervision, S.S.; project administration, S.S. All authors have read and agreed to the published version of the manuscript.

Funding

The work reported in this article was supported by a grant from the Scientific and Technological Research Council of Turkey (TUBITAK) within the scope of 2214-A International Doctoral Research Fellowships Program (Project number: 1059B141801030).

Institutional Review Board Statement

The research was reviewed by the Institutional Review Board of the University of Florida, ID IRB201902896.

Informed Consent Statement

Not applicable.

Data Availability Statement

Not applicable.

Acknowledgments

The first author initiated and completed the study while being at the University of Florida, Department of Tourism, Hospitality, and Event Management.

Conflicts of Interest

The authors declare no conflict of interest.

References

  1. UNWTO. World Tourism Barometer. 2020. Available online: https://www.unwto.org/publications (accessed on 14 April 2020).
  2. Stanchev, R. The Most Affected European Destinations by Over-Tourism. Universitat De Les Illes Balears, Spain. 2018. Available online: http://hdl.handle.net/11201/148140 (accessed on 24 February 2022).
  3. McKinsey & Company. Coping with Success: Managing Overcrowding in Tourist Destinations. World Travel and Tourism Council, New York. 2017. Available online: https://www.mckinsey.com/industries/travel-transport-and-logistics/our-insights/coping-with-success-managing-overcrowding-in-tourism-destinations (accessed on 24 February 2022).
  4. Gössling, S.; Scott, D.; Hall, C.M. Pandemics, tourism and global change: A rapid assessment of COVID-19. J. Sustain. Tour. 2020, 29, 1–20. [Google Scholar] [CrossRef]
  5. UNWTO. Impact Assessment of the COVID 19 Outbreak on International Tourism. 2020. Updated May 2020. Available online: https://www.unwto.org/impact-assessment-of-the-covid-19-outbreak-on-international-tourism (accessed on 24 February 2022).
  6. Higgins-Desbiolles, F. Socialising tourism for social and ecological justice after COVID-19. Tour. Geogr. 2020, 22, 610–623. [Google Scholar] [CrossRef] [Green Version]
  7. Dolnicar, S. Webinar communication. In The Future of Tourism Research in a Post-Pandemic World; Temple University: Philadelphia, PA, USA, 20 May 2020. [Google Scholar]
  8. Flin, R.; Slaven, G. Personality and emergency command ability. Disaster Prev. Manag. 1996, 5, 40–46. [Google Scholar] [CrossRef]
  9. Kendler, K.S.; Kuhn, J.; Prescott, C.A. The interrelationship of neuroticism, sex, and stressful life events in the prediction of episodes of major depression. Am. J. Psychiatry 2004, 161, 631–636. [Google Scholar] [CrossRef] [PubMed]
  10. Qiu, J.; Shen, B.; Zhao, M.; Wang, Z.; Xie, B.; Xu, Y. A nationwide survey of psychological distress among Chinese people in the COVID-19 epidemic: Implications and policy recommendations. Gen. Psychiatry 2020, 33, e100213. [Google Scholar] [CrossRef] [Green Version]
  11. Wen, J.; Kozak, M.; Yang, S.; Liu, F. COVID-19: Potential effects on Chinese citizens’ lifestyle and travel. Tour. Rev. 2020, 76, 1660–5373. [Google Scholar] [CrossRef]
  12. People.com. 4 May 2020. Claudia Harmata. Streets in Italy and Spain Surge with People As Coronavirus Restrictions Are Eased. Available online: https://people.com/travel/streets-in-italy-and-spain-surge-with-people-as-coronavirus-restrictions-are-eased/ (accessed on 4 February 2022).
  13. BBC News. May 2020. Coronavirus: Resort Locals ‘Shocked and Angry’ at Beach Crowds. Available online: https://www.bbc.com/news/uk-england-52754039 (accessed on 4 February 2022).
  14. The NYT. After Crowding at Lake of the Ozarks, Missouri Officials Urge Quarantine. 26 May 2020. Available online: https://www.nytimes.com/2020/05/26/us/lake-of-the-ozarks-coronavirus.html (accessed on 4 February 2022).
  15. Huang, L.; Gursoy, D.; Xu, H. Impact of personality traits and involvement on prior knowledge. Ann. Tour. Res. 2014, 48, 42–57. [Google Scholar] [CrossRef]
  16. Harrell, G.D.; Hutt, M.D. Buyer Behavior under Conditions of Crowding: An Initial Framework. Adv. Consum. Res. 1976, 3, 36–39. [Google Scholar]
  17. Mehta, R.; Sharma, N.K.; Swami, S. The impact of perceived crowding on consumers’ store patronage intentions: Role of optimal stimulation level and shopping motivation. J. Mark. Manag. 2013, 29, 812–835. [Google Scholar] [CrossRef]
  18. WHO (n.d.). Desease Outbreaks. Available online: https://www.who.int/teams/environment-climate-change-and-health/emergencies/disease-outbreaks (accessed on 24 February 2022).
  19. Mangan, D. Trump Dismissed Coronavirus Pandemic Worry in January—Now Claims He Long Warned about it. CNBC. 17 March 2020. Available online: https://www.cnbc.com/2020/03/17/trump-dissed-coronavirus-pandemic-worry-now-claims-he-warned-about-it.html (accessed on 24 February 2022).
  20. CDC. 2020. Coronavirus Disease 2019 (COVID-19). Centers for Decease Control and Prevention. Available online: https://www.cdc.gov/coronavirus/2019-ncov/cases-updates/cases-in-us.html (accessed on 24 February 2022).
  21. WHO 2020. Coronavirus disease 2019 (COVID-19) Situation Report #35. Available online: https://www.who.int/docs/default-source/coronaviruse/situation-reports/20200224-sitrep-35-covid-19.pdf (accessed on 24 February 2022).
  22. Worldometers. 2020. COVID-19 Coronavirus Pandemic. Available online: https://www.worldometers.info/coronavirus/ (accessed on 24 February 2022).
  23. AP-NORC. Few Americans Worry about Coronavirus Infection. The Associated Press-NORC Center for Public Affairs Research. Available online: http://www.apnorc.org/Pages/Few-Americans-Worry-about-Coronavirus-Infection-.aspx (accessed on 24 February 2022).
  24. Maccarthy, J. High Confidence in Government to Handle Coronavirus. Gallup News. 20 February 2020. Available online: https://news.gallup.com/poll/286277/high-confidence-government-handle-coronavirus.aspx (accessed on 24 February 2022).
  25. Bycoffe, A.; Groskopf, C.; Mehta, D. How Americans View The Coronavirus Crisis And Trump’s Response. FiveThirtyEight. 22 May 2020. Available online: http://projects.fivethirtyeight.com/coronavirus-polls/ (accessed on 24 February 2022).
  26. [email protected]. COVID-19: Should I Wear a Mask? 27 February 2020. Available online: https://twitter.com/cdcgov/status/1233134710638825473 (accessed on 4 February 2022).
  27. Science News Staff. 2020. This COVID-19 Pandemic Timeline Shows How Fast the Coronavirus Took over Our Lives. Science News. 11 December 2020. Available online: https://www.sciencenews.org/article/coronavirus-covid19-pandemic-timeline-events (accessed on 24 February 2022).
  28. Gallup. Gallup’s Data Brief on COVID-19. March 2020. Available online: https://news.gallup.com/opinion/gallup/305741/gallup-data-brief-covid.aspx (accessed on 24 February 2022).
  29. Shelby, B. Crowding models for backcountry recreation. Land. Econ. 1980, 56, 43–55. [Google Scholar] [CrossRef]
  30. Stokols, D. A social psychological model of human crowding phenomena. J. Am. Inst. Plan. 1972, 38, 72–83. [Google Scholar] [CrossRef]
  31. Shelby, B.; Heberlein, T.A. A conceptual framework for carrying capacity determination. Leis. Sci. 1984, 6, 433–451. [Google Scholar] [CrossRef]
  32. Vaske, J.J.; Donnelly, M.P. Generalizing the encounter--norm—Crowding relationship. Leis. Sci. 2002, 24, 255–269. [Google Scholar] [CrossRef]
  33. Milgram, S. The experience of living in cities: A psychological analysis. In Psychology and the Problems of Society; Korten, F.F., Cook, S.W., Lacey, J.I., Eds.; American Psychological Association: Washington, DC, USA, 1970; pp. 152–173. [Google Scholar]
  34. Averill, J.R. Personal control over aversive stimuli and its relationship to stress. Psychol. Bull. 1973, 80, 286. [Google Scholar] [CrossRef]
  35. Schreyer, R.; Roggenbuck, J.W. The influence of experience expectations on crowding perceptions and social-psychological carrying capacities. Leis. Sci. 1978, 1, 373–394. [Google Scholar] [CrossRef]
  36. Westover, T.N. Perceived crowding in recreational settings: An environment-behavior model. Environ. Behav. 1989, 21, 258–276. [Google Scholar] [CrossRef]
  37. Vaske, J.J.; Donnely, M.P.; Heberlein, T.A. Perceptions of crowding and resource quality by early and more recent visitors. Leis. Sci. 1980, 3, 367–381. [Google Scholar] [CrossRef]
  38. Vaske, J.J.; Shelby, B.B.; Graefe, A.R.; Heberlein, T.A. Backcountry encounter norms: Theory, method and empirical evidence. J. Leis. Res. 1986, 18, 137–153. [Google Scholar] [CrossRef]
  39. Shelby, B.; Vaske, J.J.; Heberlein, T.A. Comparative analysis of crowding in multiple locations: Results from fifteen years of research. Leis. Sci. 1989, 11, 269–291. [Google Scholar] [CrossRef]
  40. Hall, T.; Shelby, B. Temporal and spatial displacement: Evidence from a high-use reservoir and alternate sites. J. Leis. Res. 2000, 32, 435–456. [Google Scholar] [CrossRef]
  41. Hwang, J.; Yoon, S.Y.; Bendle, L.J. Desired privacy and the impact of crowding on customer emotions and approach-avoidance responses. Int. J. Contemp. Hosp. Manag. 2012, 24, 224–250. [Google Scholar] [CrossRef]
  42. Morgan, D.J.; Lok, L. Assessment of a comfort indicator for natural tourist attractions: The case of visitors to Hanging Rock, Victoria. J. Sustain. Tour. 2000, 8, 393–409. [Google Scholar] [CrossRef]
  43. Popp, M. Positive and negative urban tourist crowding: Florence, Italy. Tour. Geogr. 2012, 14, 50–72. [Google Scholar] [CrossRef]
  44. Zehrer, A.; Raich, F. The impact of perceived crowding on customer satisfaction. J. Hosp. Tour. Manag. 2016, 29, 88–98. [Google Scholar] [CrossRef]
  45. Cutler, S.Q.; Carmichael, B.A. The dimensions of the tourist experience. In The Tourism and Leisure Experience; Channel View Publications: Bristol, UK, 2010; pp. 3–26. [Google Scholar]
  46. Hosany, S.; Witham, M. Dimensions of cruisers’ experiences, satisfaction, and intention to recommend. J. Travel Res. 2010, 49, 351–364. [Google Scholar] [CrossRef]
  47. Jung, T.; tom Dieck, M.C.; Lee, H.; Chung, N. Effects of virtual reality and augmented reality on visitor experiences in museum. In Information and Communication Technologies in Tourism; Springer: Cham, Switzerland, 2016; pp. 621–635. [Google Scholar]
  48. Luque-Gil, A.M.; Gómez-Moreno, M.L.; Peláez-Fernández, M.A. Starting to enjoy nature in Mediterranean mountains: Crowding perception and satisfaction. Tour. Manag. Perspect. 2018, 25, 93–103. [Google Scholar] [CrossRef]
  49. D’Antonio, A.; Monz, C.; Newman, P.; Lawson, S.; Taff, D. The effects of local ecological knowledge, minimum-impact knowledge, and prior experience on visitor perceptions of the ecological impacts of backcountry recreation. Environ. Manag. 2012, 50, 542–554. [Google Scholar] [CrossRef]
  50. Brown, A.; Kappes, J.; Marks, J. Mitigating theme park crowding with incentives and information on mobile devices. J. Travel Res. 2013, 52, 426–436. [Google Scholar] [CrossRef]
  51. Shi, B.; Zhao, J.; Chen, P.J. Exploring urban tourism crowding in Shanghai via crowdsourcing geospatial data. Curr. Issues Tour. 2017, 20, 1186–1209. [Google Scholar] [CrossRef]
  52. Cabrera-Quiros, L.; Gedik, E.; Hung, H. Multimodal self-assessed personality estimation during crowded mingle scenarios using wearables devices and cameras. IEEE Trans. Affect. Comput. 2019, 13, 46–59. [Google Scholar] [CrossRef]
  53. Miller, S.; Nardini, K.M. Individual differences in the perception of crowding. Environ. Psychol. Nonverbal Behav. 1977, 2, 3–13. [Google Scholar] [CrossRef]
  54. Landers, R.N.; Lounsbury, J.W. An investigation of Big Five and narrow personality traits in relation to Internet usage. Comput. Hum. Behav. 2006, 22, 283–293. [Google Scholar] [CrossRef]
  55. Ardelt, M. Still stable after all these years? Personality stability theory revisited. Soc. Psychol. Q. 2000, 63, 392–405. [Google Scholar] [CrossRef]
  56. McCrae, R.R.; Costa, P.T. Self-concept and the stability of personality: Cross-sectional comparisons of self-reports and ratings. J. Personal. Soc. Psychol. 1982, 43, 1282. [Google Scholar] [CrossRef]
  57. Donnellan, M.B.; Lucas, R.E. Age differences in the Big Five across the life span: Evidence from two national samples. Psychol. Aging 2008, 23, 558. [Google Scholar] [CrossRef] [Green Version]
  58. Srivastava, S.; John, O.P.; Gosling, S.D.; Potter, J. Development of personality in early and middle adulthood: Set like plaster or persistent change? J. Personal. Soc. Psychol. 2003, 84, 1041. [Google Scholar] [CrossRef] [Green Version]
  59. Terracciano, A.; Costa, P.T., Jr.; McCrae, R.R. Personality plasticity after age 30. Personal. Soc. Psychol. Bull. 2006, 32, 999–1009. [Google Scholar] [CrossRef] [Green Version]
  60. Eysenck, H.J. The Structure of Human Personality, Psychology Revivals; Routledge: New York, NY, USA, 2013. [Google Scholar]
  61. Myers, I.B. The Myers-Briggs Type Indicator: Manual; Consulting Psychologists Press: Palo Alto, CA, USA, 1962. [Google Scholar]
  62. Rotter, J.B. Generalized expectancies for internal versus external control of reinforcement. Psychol. Monogr. Gen. Appl. 1966, 80, 1–28. [Google Scholar] [CrossRef] [Green Version]
  63. Goldberg, L.R. An alternative “description of personality”: The big-five factor structure. J. Personal. Soc. Psychol. 1990, 59, 1216. [Google Scholar] [CrossRef]
  64. Furnham, A.; Mouttafi, J.; Crump, J. The Relationship between the Revised NEO-Personality Inventory and the Myers-Briggs Type Indicator. Soc. Behav. Personal. 2003, 31, 577–584. [Google Scholar] [CrossRef]
  65. Nießen, D.; Danner, D.; Spengler, M.; Lechner, C.M. Big Five Personality Traits Predict Successful Transitions From School to Vocational Education and Training: A Large-Scale Study. Front. Psychol. 2020, 11, 1827. [Google Scholar] [CrossRef]
  66. Gosling, S.D.; Rentfrow, P.J.; Swann, W.B., Jr. A very brief measure of the Big-Five personality domains. J. Res. Personal. 2003, 37, 504–528. [Google Scholar] [CrossRef]
  67. Goldberg, L.R. The structure of phenotypic personality traits. Am. Psychol. 1993, 48, 26. [Google Scholar] [CrossRef]
  68. Kvasova, O. The Big Five personality traits as antecedents of eco-friendly tourist behavior. Personal. Individ. Differ. 2015, 83, 111–116. [Google Scholar] [CrossRef]
  69. Lepp, A.; Gibson, H. Sensation seeking and tourism: Tourist role, perception of risk and destination choice. Tour. Manag. 2008, 29, 740–750. [Google Scholar] [CrossRef]
  70. Jani, D. Relating travel personality to Big Five Factors of personality. Tour. Int. Interdiscip. J. 2014, 62, 347–359. [Google Scholar]
  71. Schneider, P.P.; Vogt, C.A. Applying the 3M model of personality and motivation to adventure travelers. J. Travel Res. 2012, 51, 704–716. [Google Scholar] [CrossRef]
  72. Yoo, K.H.; Gretzel, U. Influence of personality on travel-related consumer-generated media creation. Comput. Hum. Behav. 2011, 27, 609–621. [Google Scholar] [CrossRef]
  73. Zuckerman, M.; Kuhlman, D.M. Personality and risk-taking: Common bisocial factors. J. Personal. 2000, 68, 999–1029. [Google Scholar] [CrossRef] [PubMed]
  74. Abdelrahman, M. Personality traits, risk perception, and protective behaviors of Arab residents of Qatar during the COVID-19 pandemic. Int. J. Ment. Health Addict. 2020, 20, 237–248. [Google Scholar] [CrossRef] [PubMed]
  75. Kim, H.; Stepchenkova, S. Effect of tourist photographs on attitudes towards destination: Manifest and latent content. Tour. Manag. 2015, 49, 29–41. [Google Scholar] [CrossRef]
  76. Berinsky, A.J.; Huber, G.A.; Lenz, G.S. Evaluating online labor markets for experimental research: Amazon. com’s Mechanical Turk. Political Anal. 2012, 20, 351–368. [Google Scholar] [CrossRef] [Green Version]
  77. Paolacci, G.; Chandler, J.; Ipeirotis, P.G. Running experiments on amazon mechanical turk. Judgm. Decis. Mak. 2010, 5, 411–419. [Google Scholar]
  78. McCredie, M.N.; Morey, L.C. Who are the Turkers? A characterization of MTurk workers using the personality assessment inventory. Assessment 2019, 26, 759–766. [Google Scholar] [CrossRef]
  79. We Are Dynamo, 2014. Guidelines for Academic Requesters, Version 1.1. Available online: http://www.wearedynamo.org/Guidelines_for_Academic_Requesters.pdf (accessed on 14 April 2020).
  80. IPIP. International Personality Item Pool: A Scientific Collaboratory for the Development of Advanced Measures of Personality Traits and Other Individual Differences. 2008. Available online: http://ipip.ori.org/ (accessed on 22 June 2021).
  81. Goldberg, L.R. A broad-bandwidth, public domain, personality inventory measuring the lower-level facets of several five-factor models. Personal. Psychol. Eur. 1999, 7, 7–28. [Google Scholar]
  82. Heberlein, T.A.; Vaske, J.J. Crowding and Visitor Conflict on the Bois Brule River; (report WISC WRC 77–04); University of Wisconsin Water Resources Center: Madison, WI, USA, 1977. [Google Scholar]
  83. Pine, B.J.; Gilmore, J.H. Welcome to the experience economy. Harv. Bus. Rev. 1998, 76, 97–105. [Google Scholar]
  84. Oh, H.; Fiore, A.M.; Jeoung, M. Measuring Experience Economy Concepts: Tourism Applications. J. Travel Res. 2007, 46, 119–132. [Google Scholar] [CrossRef]
  85. Smith, S.M.; Roster, C.A.; Golden, L.L.; Albaum, G.S. A multi-group analysis of online survey respondent data quality: Comparing a regular USA consumer panel to MTurk samples. J. Bus. Res. 2016, 69, 3139–3148. [Google Scholar] [CrossRef]
  86. Hernández, J.M.; Kirilenko, A.P.; Stepchenkova, S. Network approach to tourist segmentation via user generated content. Ann. Tour. Res. 2018, 73, 35–47. [Google Scholar] [CrossRef]
  87. Hair, J.F.; Black, W.C.; Babin, B.J.; Anderson, R.E.; Tatham, R. Multivariate Data Analysis; Pearson: Upper Saddle River, NJ, USA, 2006. [Google Scholar]
  88. Chiu, T.; Fang, D.; Chen, J.; Wang, Y.; Jeris, C. A robust and scalable clustering algorithm for mixed type attributes in large database environment. In KDD’01; ACM Press: New York, NY, USA, 2011; pp. 263–268. [Google Scholar]
  89. Cohen, J. Statistical Power Analysis for the Behavioral Sciences; Routledge Academic: New York, NY, USA, 1988. [Google Scholar]
  90. Tabachnick, B.G.; Fidell, L.S.; Ullman, J.B. Using Multivariate Statistics; Pearson: Boston, MA, USA, 2007. [Google Scholar]
  91. DeYoung, C.G.; Peterson, J.B.; Higgins, D.M. Higher-order factors of the Big Five predict conformity: Are there neuroses of health? Personal. Individ. Differ. 2002, 33, 533–552. [Google Scholar] [CrossRef]
  92. Wrench, J.S.; Brogan, S.M.; McCroskey, J.C.; Jowi, D. Social communication apprehension: The intersection of communication apprehension and social phobia. Hum. Commun. 2008, 11, 409–429. [Google Scholar]
  93. Elliott, C. Life after Coronavirus: Ready to Travel as Soon as It’s Safe? So Is Everyone Else. May 2020. Available online: https://www.usatoday.com/story/travel/advice/2020/05/01/coronavirus-why-everyonewant-travel-soon/3058753001/ (accessed on 14 May 2020).
  94. Skyscanner. Weekly Travel Insights—14 May. 2020. Updated May 2020. Available online: https://www.partners.skyscanner.net/news-case-studies/future-booking-factors (accessed on 24 February 2022).
  95. Pohle, A. The Cruise Trips Most in Demand Don’t Embark until 2022 and Beyond. Wall Street Journal. Available online: https://www.wsj.com/articles/cruise-ships-2022-covid-delta-carnival-11629403417 (accessed on 20 August 2021).
  96. Burnham, M.J.; Le, Y.K.; Piedmont, R.L. Who is Mturk? Personal characteristics and sample consistency of these online workers. Ment. Health Relig. Cult. 2018, 21, 934–944. [Google Scholar] [CrossRef]
  97. Kawamoto, T.; Oshio, A.; Abe, S.; Tsubota, Y.; Hirashima, T.; Ito, H.; Tani, I. Age and Gender Differences of Big Five Personality Traits in a Cross-Sectional Japanese Sample. Jpn. J. Dev. Psychol. 2015, 26, 107–122. [Google Scholar]
  98. Koch, G.C.; Amara, K.A.; Brown, B.W., Jr.; Colton, T.; Gillings, D.B. A two-period crossover design for the comparison of two active treatments and placebo. Stat. Med. 1983, 8, 487–504. [Google Scholar] [CrossRef]
  99. Reed, J.F., III. Higher Order C (t, p, s) Crossover Designs. J. Mod. Appl. Stat. Methods 2011, 10, 27. [Google Scholar] [CrossRef] [Green Version]
  100. Wellek, S.; Blettner, M. On the proper use of the crossover design in clinical trials: Part 18 of a series on evaluation of scientific publications. Dtsch. Ärzteblatt Int. 2012, 109, 276. [Google Scholar]
  101. Hipp, J.A.; Ogunseitan, O.A. Effect of environmental conditions on perceived psychological restorativeness of coastal parks. J. Environ. Psychol. 2011, 31, 421–429. [Google Scholar] [CrossRef] [Green Version]
  102. Greenwood, A.; Gatersleben, B. Let’s go outside! Environmental restoration amongst adolescents and the impact of friends and phones. J. Environ. Psychol. 2016, 48, 131–139. [Google Scholar] [CrossRef]
Figure 1. Three density levels, low (L1), medium (L2), and high (L3) at a beach destination, top to bottom.
Sustainability 14 03960 g001aSustainability 14 03960 g001b
Figure 2. Effect of COVID-19 on perceived crowdedness, feeling of being comfortable, and anticipated experience at a destination.
Sustainability 14 03960 g002aSustainability 14 03960 g002b
Figure 3. Effect of personality profile on perceived crowdedness, feeling of being comfortable, and anticipated experience at a destination.
Sustainability 14 03960 g003aSustainability 14 03960 g003b
Figure 4. PRE–POST change in perception of crowdedness, feeling of being comfortable, and anticipated experience for different personality profiles at the medium density level.
Sustainability 14 03960 g004aSustainability 14 03960 g004b
Table 1. Respondents’characteristics.
Respondents’ CharacteristicsPRE: n = 218POST: n = 220
Freq%Freq%
GENDER
Male12557.612657.3
Female9242.49442.7
Other10.0
AGE
18–24198.7115.0
25–349242.210648.2
35–445324.35926.8
45–542913.32210.0
55–64167.3177.7
65 and above94.152.3
EDUCATION
High school or below5525.23515.9
Bachelor or associate degree12959.215670.9
Postgraduate or professional degree3415.62913.2
LOCATION
Village or rural area188.3198.6
City suburb5324.34922.3
Smaller city or town (pop. over 1000)6027.54922.3
Large or medium size city (pop. over 100,000)8739.910346.8
TOURIST ROLE a
Family Vacationer8237.610648.2
Nature Lover7433.97132.3
Peace and Quiet Seeker6630.34520.5
Beach Goer5927.16127.7
a Roles selected by more than 20% of respondents in each sample are shown. Multiple selections were allowed.
Table 2. Descriptive statistics of study variables.
Variables aPRE, n = 218POST, n = 220
MeanSDSkewKurtMeanSDSkewKurt
Extraversion−0.480.83−0.570.14−0.360.74−0.710.17
Neuroticism−0.400.97−0.21−0.01−0.501.01−0.33−0.42
Openness0.390.470.04−0.280.320.52−0.261.01
Conscientiousness0.380.580.211.070.460.520.400.48
Agreeableness0.100.51−0.561.570.080.51−0.450.77
L1
Perceived crowdedness2.341.851.13−0.162.441.870.95−0.55
Being comfortable5.961.32−1.803.775.801.45−1.251.10
Anticipated experience4.100.72−1.453.564.110.70−1.001.85
L2
Perceived crowdedness4.431.37−0.28−0.324.741.31−0.42−0.19
Being comfortable4.751.48−0.42−0.344.401.69−0.30−0.79
Anticipated experience3.700.89−0.970.983.610.92−0.790.32
L3
Perceived crowdedness6.330.90−1.482.816.341.00−1.693.21
Being comfortable3.051.890.50−1.062.861.920.64−0.98
Anticipated experience2.821.15−0.07−1.182.841.20−0.14−1.24
a Personality variables are row-centered. PRE–POST comparisons are not significant at 0.017 level (Bonferroni correction). Perceived crowdedness and Feeling of being comfortable: 1 to 7. Anticipated experience: 1 to 5.
Table 3. Personality profile clusters.
Personality TraitsMeanCluster 1Cluster 2Cluster 3
Total SampleApprehensive ExtravertsFearful Introverts BalancedANOVA:
n = 438n = 159n = 105n = 174F2, 435
Neuroticism−0.450.050.38−1.41370.53
Extraversion−0.42−0.11−1.45−0.08253.51
Openness0.35−0.050.670.54138.71
Conscientiousness0.420.100.570.6351.89
Agreeableness0.090.01−0.170.3241.18
Bold font indicates the trait(s) largely responsible for profiling the cluster.
Table 4. The effect of density level: Manipulation check.
Study VariableRepeated-Measure ANOVA
Perceived CrowdednessWilks ΛFp-valuePartial η2 (a)
Density Level0.261219.75<0.0010.736
L1: M = 2.39; L2: M = 4.58; L3: M = 6.33
Feeling of Being ComfortableWilks ΛFp-valuePartial η2
Density Level0.39673.36<0.0010.606
L1: M = 5.88; L2: M = 4.58; L3: M = 2.95
Anticipated ExperienceWilks ΛFp-valuePartial η2
Density Level0.50443.12<0.0010.503
L1: M = 4.12; L2: M = 3.65; L3: M = 2.83
(a) Effect size: small η2 = 0.01; medium η2 = 0.06; large η2 = 0.14 [89]. Density Level: L1 (low), L2 (medium), L3 (high). Between and within dfs in all tests are 2 and 874.
Publisher’s Note: MDPI stays neutral with regard to jurisdictional claims in published maps and institutional affiliations.

