Article

Peer Effect in Merger and Acquisition Activities and Its Impact on Corporate Sustainable Development: Evidence from China

School of Management, Zhejiang University, Hangzhou 310058, China
*
Author to whom correspondence should be addressed.
Sustainability 2022, 14(7), 3891; https://doi.org/10.3390/su14073891
Submission received: 13 February 2022 / Revised: 18 March 2022 / Accepted: 22 March 2022 / Published: 25 March 2022
(This article belongs to the Special Issue Contemporary Issues in Applied Economics and Sustainability)

Abstract

:
The research aims to investigate the existence of peer effect in mergers and acquisitions and study its impact on corporate sustainable development. It first constructs a peer effect testing model to examine whether there is peer effect in mergers and acquisitions, based on quarterly data in China between 2005 and 2019. Then, two econometric models are proposed separately to explore the impact of economic policy uncertainty on the merger and acquisition peer effect, as well as how the peer effect affects corporate sustainability. The key findings show that (i) firms tend to imitate their peers’ merger and acquisition behaviors, which means that the peer effect does exist in mergers and acquisitions; (ii) economic policy uncertainty could strengthen the peer effect in mergers and acquisitions; (iii) the peer effect has a negative impact on corporate sustainable development, and the impact is more significant within a relatively short period. Therefore, this study enriches the research of behavior science in mergers and acquisitions, improves the accuracy of peer effect testing and enables both firms and policymakers to mitigate irrational imitation in merger and acquisition deals, thus achieving their sustainable development goals.

1. Introduction

Peer effect, in which decision makers imitate the behaviors of their peers, has been widely recognized as a phenomenon that arises when firms make operational decisions such as financing, investment and innovation. By following each other’s behavior, firms can obtain more information, gain valuable experience and reduce risks, especially when they are faced with a complicated and unpredictable external economic environment [1,2,3]. However, peer effect could have adverse consequences for business at times and needs to be taken seriously [4,5,6]. In the case of merger and acquisition (M&A) activities, there seemingly should not be a peer effect, since they often involve greater complexity and heterogeneity than regular investments; however, a few scholars have noticed that M&As may also be affected by peers [7,8,9]. To this end, it is vital to better understand the existence and potential impact of peer effect, because M&A is one of the most important means for corporate restructuring and strategic development. If firms’ M&A decisions are indeed affected by their peers, it may have a significant but ambiguous or even negative impact on firms’ value or sustainable development [10,11,12].
Meanwhile, the world is undergoing profound changes, and the world economy is unstable and clouded by various risks, including new virus variants, unanchored inflation expectations, and financial stress [13]. The monthly global economic policy uncertainty (EPU) index developed by scholars from Northwestern University, Stanford University and University of Chicago has surged from 53.23 to 238.71 during the first two decades in the 21st century. In addition, as the world’s second largest economy, the stable development of China’s capital market and enterprises is of great importance. On the one hand, the EPU index of China has increased significantly from 9.07 to 755.26 within the last 20 years, indicating that the economic policy uncertainty of China is growing quickly and exceeding the world average. Consequently, firms may tend to imitate others for the sake of obtaining more information and reducing risks. On the other hand, M&A activities in China have risen sharply from 2000 to 2019, with an average annual growth rate of 14.7%. Against this background, the existence and impact of imitation behaviors among firms in M&As has received greater attention and demands for further research.
At present, the majority of studies related to peer effect concentrate on the imitation of peer firms in activities such as financing, regular investments and innovation [14,15,16]. Little research on M&A peer effect has been conducted, most of which focuses on examining the existence of M&A peer effect [7,8]. There is little attention paid to the analysis of the mechanism and impact of M&A peer effect, and thus scholars have little insight into which factors will have impacts on the M&A peer effect, not to mention how the M&A peer effect will affect the development of firms, particularly their sustainable development.
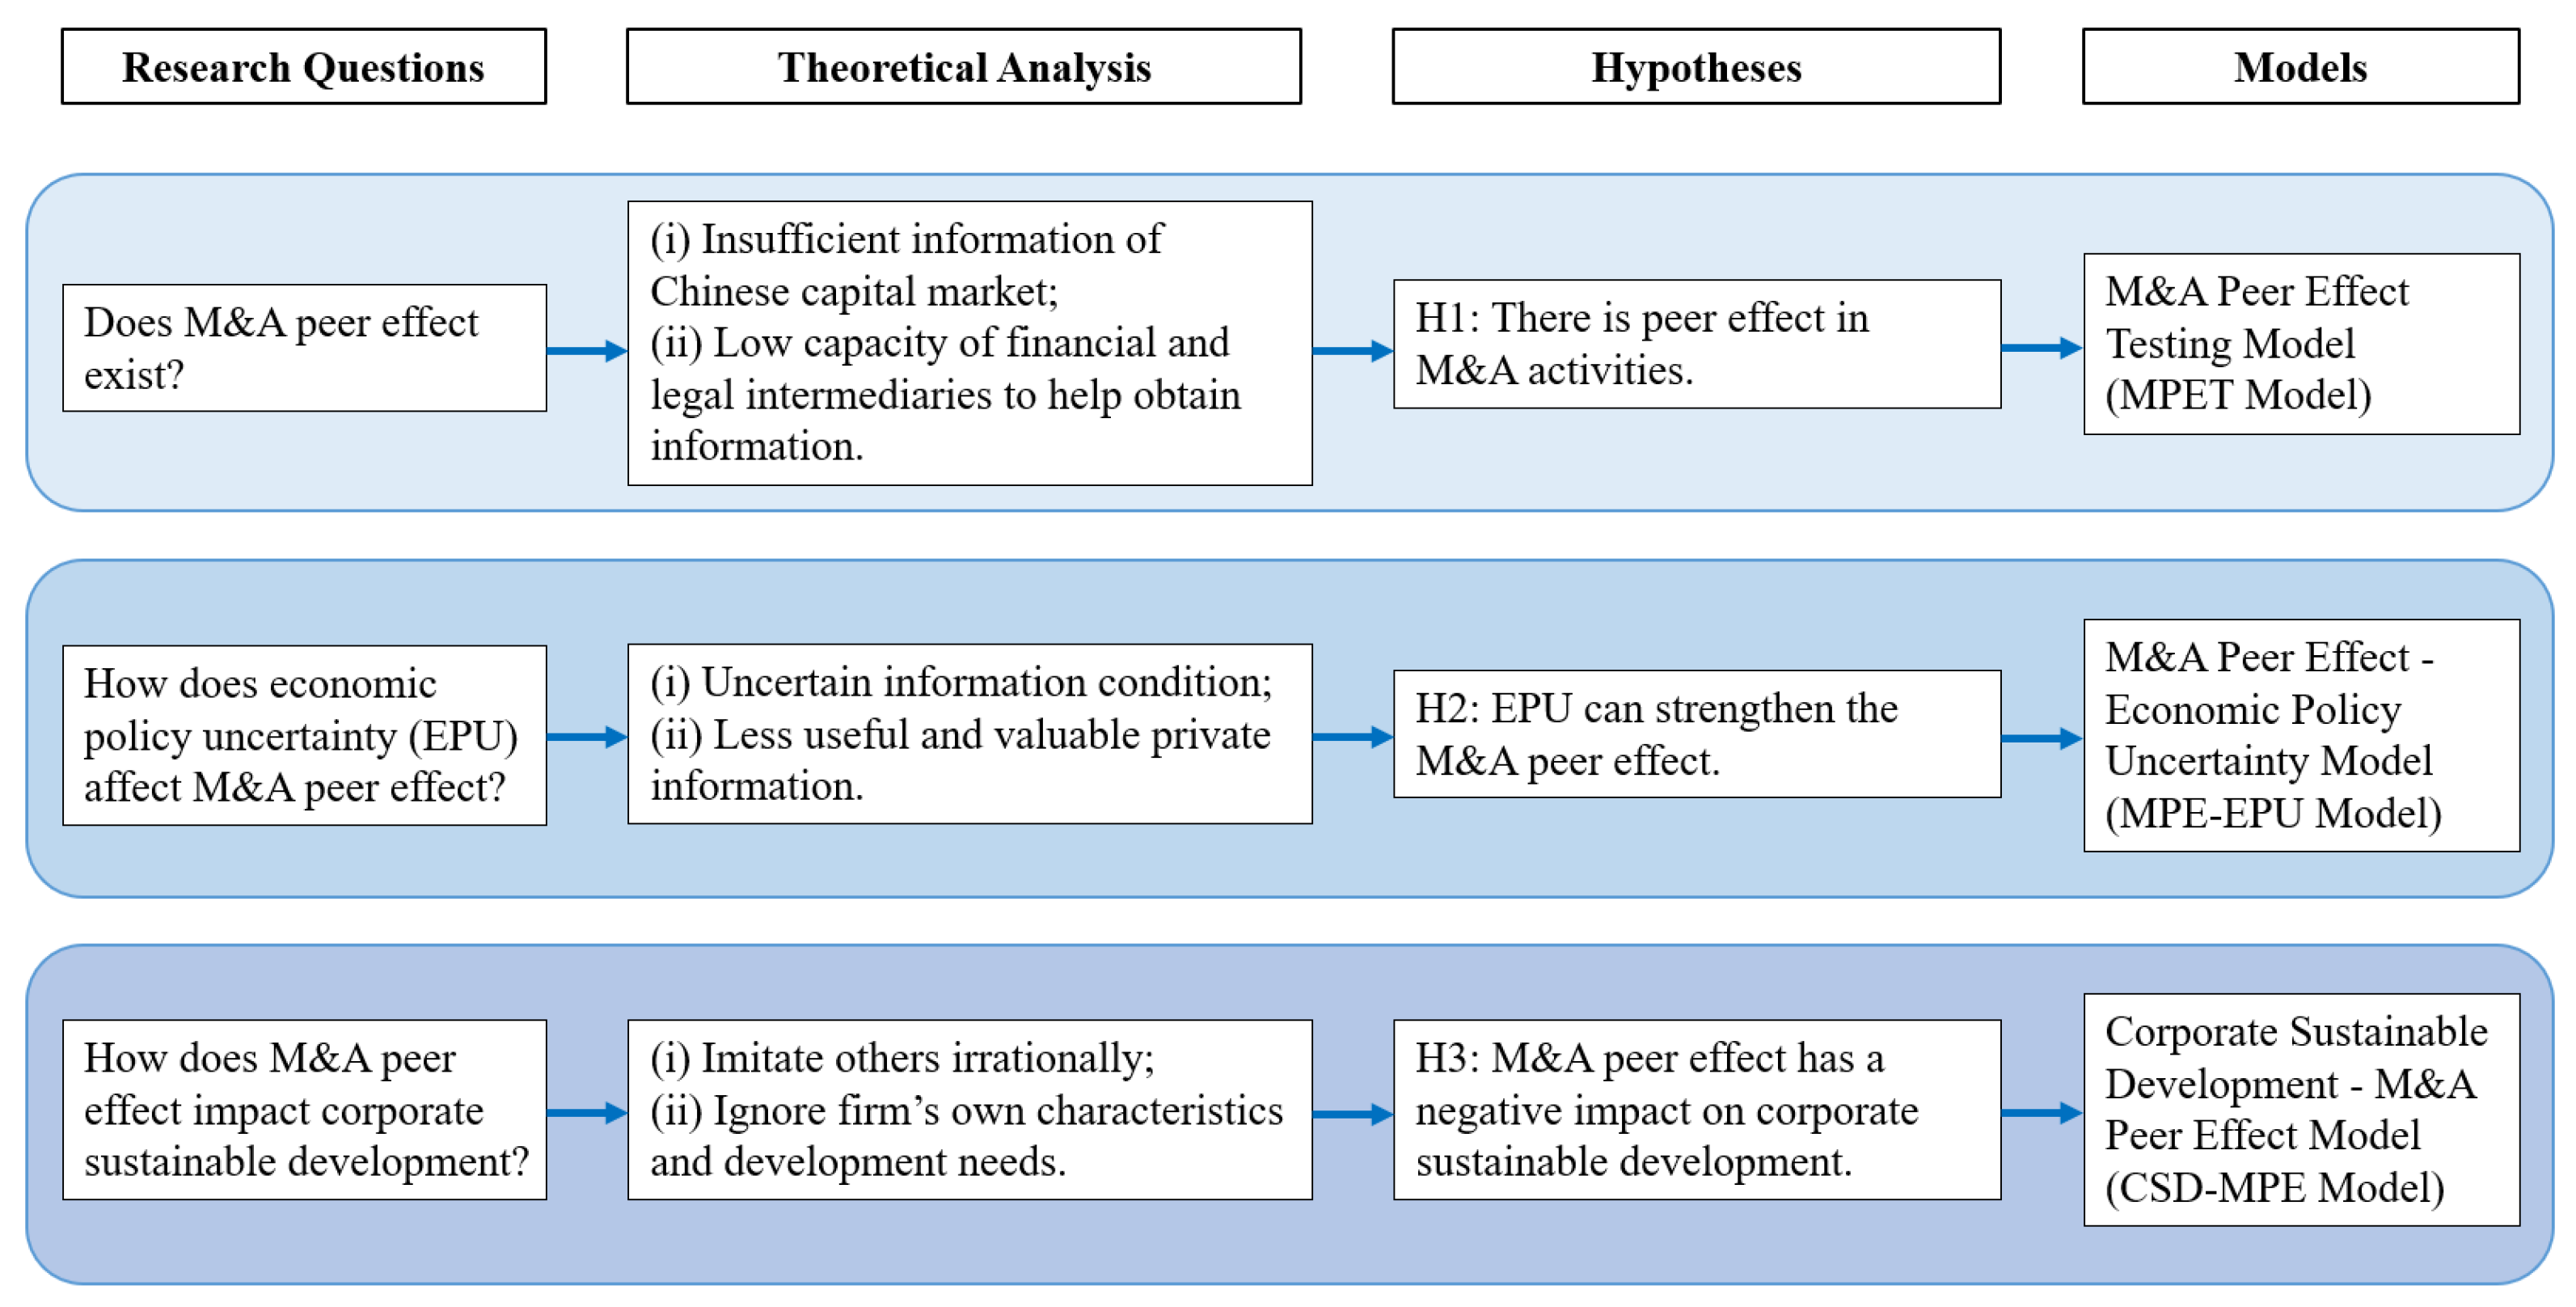
This research explores the existence, moderating factors and consequences of peer effect in M&A activities through the employment of three models. First, it constructs an M&A peer effect testing model to examine whether peers’ M&A activities would affect the firm’s M&A decisions. The findings show that peer firms’ M&A number and value will increase the firm’s M&A possibilities, number and value in the same industry, i.e., there is peer effect in M&As. The results of further moderating effect model suggest that the economic policy uncertainty could strengthen the overall peer effect in M&A activities. More importantly, the study builds a CSD-MPE model to investigate the impact of M&A peer effect on corporate sustainable development. The results show that M&A peer effect can negatively affect corporate sustainable development, which is more significant within a shorter period (e.g., one quarter after the M&A).
The study enriches the understanding of peer effect in M&A activities, and the main contributions are as follows: First, the study examines the existence of M&A peer effect based on 79,207 firm-quarter observations related to M&A in China from 1 January 2005 to 31 December 2019. Compared to the annual data used in earlier literature, the quarterly data in this paper helps capture the peer effect more accurately and offers a more solid conclusion. Second, the research investigates the impact of economic policy uncertainty on M&A peer effect by building a moderating effect model. This fills the mechanism research gap of previous work on M&A peer effect. Third, this study explores the correlation between M&A peer effect and corporate sustainable development for the first time, based on a novel measurement of M&A peer effect, by calculating the degree of deviation of a firm’s M&A number or value from its peer averages.
It is noteworthy that this paper offers three important implications. Theoretically, this paper establishes a systematic framework of M&A peer effect for the first time by analyzing its existence, moderating factors and impact on corporate sustainable development. This will enrich the theoretical research of behavior science in M&A activities as well as corporate sustainable development. Methodologically, this research improves the testing model of M&A peer effect at a quarterly rather than annual frequency, which could reflect information in a timelier fashion and provide more details of the peer effect. Practically, this research also provides an important reference for firms and policymakers to better understand the M&A peer effect and reduce irrational imitation in M&As, thus achieving sustainable development goals.
The remainder of this paper is organized as follows. Section 2 reviews the relevant literature and develops three hypotheses. Section 3 introduces the data selection and the three models. Section 4 analyzes the empirical results and tests the robustness. Section 5 summarizes the theoretical, methodological and practical implications of this paper. Section 6 concludes the paper.

2. Literature Review and Hypotheses Development

2.1. Literature Review

2.1.1. Peer Effect and M&A

The studies of peer effect originate from scholars’ discussion of the imitation among decision makers [17,18,19]. A growing body of literature has found that this imitation (peer effect) exists in firms’ regular operating behaviors, such as financing, investment and innovation. For instance, in terms of financing, Lu et al. [20] explored the peer effect in capital structure, which was measured by leverage ratio, suggesting that a firm’s capital structure is affected by its peers and that the peer effect is stronger in industries with a higher degree of competition and uncertainty. Huang and Zhao [4] studied the imitation in dividend distribution based on Chinese listed companies, finding that firms might imitate others irrationally when they make dividend distribution policies, which has a significantly negative impact on firms’ value. In terms of investment, Hu [5] tested the relationship between a firm’s investment peer effect degree and its Tobin’s Q, suggesting that the peer effect in investment might benefit a firm’s value at first, but the impact would become negative when the degree of peer effect reached a certain level. Zhang and Jiang [21] examined the peer effect in firms’ investment and discussed the influence of manager power on this peer effect using a moderating effect model, arguing that manager power could restrain the peer effect in investment activities, especially when the firms are not state-owned. In terms of innovation, Liu and Wang [22] looked at the peer effect in firms’ innovation activities in China by testing whether the firm’s research and development (R&D) expenditure is affected by its peers. Machokoto et al. [16] used the same method and confirmed that there was also peer effect in firms’ innovation in the US. Feng and Wang [23] studied the social network peer effect in innovation activities, finding that the firm’s innovation was positively affected by its peer firms’ innovation in the social network, and the peer effect was stronger in areas with a poor institutional environment. It is worth noting that the impact of peer effect on corporate development is still ambiguous, i.e., peer effect can be beneficial or detrimental to firms. Nevertheless, for now, there is little research focused on this specific topic.
Compared with the research on peer effect in firms’ regular financing, investment and innovation, there are few studies on peer effect in M&A activities, mainly because M&A is always seen as a heterogeneous activity that should not be imitated. However, Wan et al. [7] examined whether the average number of M&As initiated by a firm’s peers in the previous year would positively affect the firm’s M&A decisions this year, pointing out that M&A peer effect existed in China. They also explored the influence of M&A experience and industry competition on the M&A peer effect using a moderating effect model. Su [8] also constructed an annual frequency model to examine the relationship between a firm’s and peer firms’ M&A decisions. The study claimed that there was M&A peer effect in the same region, and firms with low centrality tended to imitate the M&A activities of firms with high centrality.

2.1.2. M&A and Corporate Sustainable Development

M&A is a popular topic in the area of corporate finance and management. Hence the M&A related literature is abundant within various focuses: underlying motives, methods, financing sources, stock pricing effects, etc. [11] For example, Ismail and Krause [24] investigated the determinants of the payment method in M&A activities based on a dataset of M&As initiated by listed US companies from 1985 to 2004 and found that the correlation of returns between the target and acquirer was an important determinant, which was unreported previously. Bena and Li [25] believed that M&A was more likely to take place between firms with overlapping innovation activities, while Lee [26] pointed out that M&A activities could be driven by technology-seeking motives as well as market-seeking motives by developing a general equilibrium model of exporting, greenfield foreign direct investment (FDI) and M&A. Gu and Reed [27] analyzed the characteristics of M&A financing resources using a sample of M&As completed during 1997 and 2014 in China. They argued that foreign ownership restrictions could inhibit Chinese firms’ equity-financed overseas M&As, but there was no evidence that state-owned firms would rely more on cash financing, as assumed. Paudyal et al. [28] examined the stock returns of cross-border M&A and the effect of economic policy uncertainty (EPU) on this, suggesting that on the announcement of the M&A, targets based in countries with a larger increase in EPU are associated with lower stock returns, while acquirers experience the opposite.
When it comes to the relationship of M&A and corporate sustainable development, some scholars have tested the impact of corporate sustainability factors on M&A performance [29,30]. However, there is little literature examining M&A’s impact on corporate sustainable development with a direct indicator, for example, the corporate sustainable growth rate. Some researchers tend to explore this question by studying firms’ long-term performance after M&A activities. For instance, Fatemi et al. [10] pointed out that Japanese firms did not experience any significant wealth effects from their M&As during 2000 and 2014, while they checked the abnormal returns earned by acquiring shareholders over the sixty months following the M&As. Mamun et al. [12] explored the operating performance of M&As assisted by the Federal Deposit Insurance Corporation and measured the operating performance by return on assets (ROA) and cost-income ratio one and two years after the M&As.
To summarize, even though there are many studies about peer effect, M&A and corporate sustainable development, the interrelationship of these three topics is under-explored. In the limited research on M&A peer effect, scholars tend to examine the existence of the M&A peer effect by testing the impact of peer firms’ M&A activities initiated in the last year on the firm’s M&As in this year, in which case the information might already be out of date. In addition, only a few studies have investigated how the peer effect is affected by environmental factors; the importance of EPU has been ignored. Moreover, scholars have little insight into how the M&A peer effect will impact the development of firms, particularly their sustainable development.
This study differs from the existing literature in following three ways. First, this paper examines the existence of peer effect in M&A activities at quarterly rather than annual frequency, which helps to capture the M&A peer effect more accurately. Second, the research further tests the impact of environmental factors on M&A peer effect by constructing a moderating effect model that includes economic policy uncertainty (EPU). This could fill the mechanism research gap of previous work. Third, based on the core concept of peer effect, this study proposes an innovative way to measure the M&A peer effect degree and uses it to explore the correlation between M&A peer effect and corporate sustainable development.

2.2. Research Hypotheses

On the basis of the previous literature, the study analyzes the theoretical mechanism for the existence and moderating factors of the M&A peer effect, as well as its impact on corporate sustainable development. Moreover, three hypotheses are proposed accordingly.
Generally, for a firm to determine its best course of action, it looks at two major sources of information: one is the firm’s own private information, and the other is the previous behavior of its peers [18]. When the manager of a firm fully represents the interests of the shareholders, and the market’s information is complete, the peers’ previous behavior may be useful but not significant for the manager’s decision. However, the firm’s own private information is often limited in practice, which makes the information from peers’ behavior more important than it should be. When it comes to the M&A activities in China, due to the brief history of China’s capital market, insufficient information is a more common issue. On the other hand, the capacity of financial and legal intermediaries to help obtain information is far from meeting the demand for the firm to conduct M&As. Therefore, it is much easier for the firm to observe peer firms’ M&A behaviors than to gather private information, which leads to the firm’s imitation of M&A activities. Consequently, the first theoretical hypothesis is proposed as follows:
H1: 
There is peer effect in M&A activities.
Furthermore, the degree of peer effect is related to how limited the information is. The less information a firm can obtain, the more likely it is to imitate its peers for maintaining the same condition with other firms. As a result, economic policy uncertainty (EPU) is an important moderating factor for peer effect, as it can magnify peer effect by decreasing firms’ capacity to acquire information [3]. That is to say, as EPU increases, the information condition of the whole market will become worse, and the firm could obtain less information that is useful and valuable to its M&A decision. This may push it to seek information from peers and be more likely to imitate them. Thus, the second theoretical hypothesis of this paper is as follows:
H2: 
Economic policy uncertainty (EPU) can strengthen the M&A peer effect.
When it comes to the consequences of peer effect, especially how it affects corporate sustainable development, no definitive conclusion has been reached by scholars. Some researchers believe that the firm could obtain adequate information and experience from its peer firms’ previous behavior; therefore, the peer effect is beneficial to the firm [31,32]. In contrast, some have argued that paying more attention to peer firms’ behavior result in the firm ignoring its own private information and imitating others irrationally [4,6]. Unlike regular investment activities, the complexity and systematic nature of M&A projects calls for extra caution. However, the M&A peer effect may cause irrational M&A activities, which means the firm might initiate an M&A deal beyond its own development needs or without adequate preparation, etc. This could be detrimental to the firm’s value and sustainable development. Based on the analysis above, the last theoretical hypothesis is as follows:
H3: 
M&A peer effect has a negative impact on corporate sustainable development.
Hence, the research framework of this paper is presented in Figure 1 below.

3. Data and Methodology

Section 3 introduces the data selection and the methodology of the M&A peer effect testing model (MPET model), moderating effect model (MPE-EPU model) and CSD-MPE model.

3.1. Sample and Data Collection

In China, M&A activities have grown rapidly in the 21st century, with a significant increase in both the quantity and quality of M&A data. Therefore, this research studies M&A peer effect from the perspective of acquirers, and the dataset used in the research contains the merger dates, transaction values, firm names, IDs, industries and other firm characteristic data of all the M&A events in China from 2005 to 2019. The data were extracted from the China Stock Market & Accounting Research (CSMAR) database and selected according to the following rules [7,33,34]: (i) the acquirer was a publicly listed firm in China’s A-share market; (ii) the M&A deal was announced between 1 January 2005 and 31 December 2019 and the M&A transaction was completed; (iii) the M&A deal value disclosed in the CSMAR database was more than RMB 1 million; (iv) affiliate transactions were excluded; (v) firm-specific characteristic data, such as leverage ratio, total assets, revenue growth rate, etc., were available in the CSMAR database for the acquirer.
The final sample consisted of 7238 mergers and 79,207 firm-quarter observations. Furthermore, all the continuous variables were winsorized at the upper and lower 1%.

3.2. Constructing M&A Peer Effect Models

3.2.1. Examining Peer Effect in M&A Activities: MPET Model

Many studies suggest that peer effect can be examined by testing the relationship of peers’ decisions and the same decision that a firm makes [20,35,36]. They generally build a regression model in which the dependent variable corresponds to the behavior of the firm (e.g., investment size, R&D size, etc.) and the explanatory variable corresponds to the same behavior of its peers in the prior period (i.e., the previous investment size, R&D size, etc.). If the coefficient estimate of the explanatory variable is significantly positive, the firm’s behavior is considered to have been influenced by its peer firms, and the peer effect exists. In converse conditions, the peer effect does not exist. This study applies this core idea in M&A analysis and constructs an M&A peer effect testing model (MPET model) to examine whether a firm’s M&A decision could be influenced by its peer firms’ previous M&A behavior. The MPET model is as follows:
Y i , p , t = α + β Y ¯ i , p , t 1 + γ X i + λ μ p + σ ϑ t + ε i , p , t
where i, p and t represent firm, industry and time (quarter), respectively. The dependent variable Y i , p , t represents the M&A decisions of firm i in industry p at time t. The independent variable Y ¯ i , p , t 1 represents peer firms’ M&A decisions, which are made at time t − 1 by other firms in the same industry p. Therefore, the coefficient β reflects the influence of the peers’ previous M&A decisions on the firm’s M&A decisions at present. The vector X i contains firm-specific characteristics as control variables. μ p and ϑ t represent industry and time fixed effects, and ε i , p , t is the firm-specific error term assumed to be correlated with the firm and heteroskedastic.
To reflect the firm’s M&A decisions completely, the MPET model employs three variables to calculate Y i , p , t , respectively [7,8,9]: M&A possibility (MPi,t), M&A number (MNi,t) and M&A value (MVi,t). The MPi,t is a discrete variable and represents the possibility of one firm deciding to acquire another. If firm i acquires another at time t, MPi,t would be 1; if firm i does not have any M&A activity at time t, MPi,t would be 0. The MNi,t is also a discrete variable used to measure the number of M&As that firm i initiates at time t. MVi,t is a continuous variable used to measure the value of M&As that firm i initiates at time t.
In addition, the MPET model uses two explanatory variables to measure peer firms’ M&A activities Y ¯ i , p , t 1 : peer M&A number (PMN−i,p,t−1) and peer M&A value (PMV−i,p,t−1). PMN−i,p,t−1 is calculated by the average number of M&As initiated by firm i’s peer firms in the same industry p at time t−1, while PMV−i,p,t−1 is calculated by the average value (natural logarithm value) of M&As initiated by firm i’s peer firms in the same industry p at time t−1. It should be noted that this paper focuses on peer effect in the same industry by defining peer firms as those manufacturing firms with the same three-digit Standard Industrial Classification (SIC) Code and non-manufacturing firms with the same one-digit SIC code. In addition, the research uses the one-period (quarter) lagged value of PMN and PMV as explanatory variables, which can alleviate concerns of endogenous issues and better reflect the peer effect.
Moreover, this study takes some firm-specific control variables into consideration to help improve the goodness of fit of the MPET model. Please note that the continuous control variables are also used as their one-period (quarter) lagged values in the research to alleviate concerns of endogenous issues (see Appendix A).

3.2.2. Exploring EPU’s Moderating Effect Mechanism: MPE-EPU Model

One of the widely believed explanations for firms’ imitation is to obtain more information and to learn from their peers [37,38]; this motivation may be stronger when the external environment becomes uncertain [3]. Based on this theory, the study tries to explore the influence of economic policy uncertainty (EPU) on M&A peer effect (MPE) by constructing a moderating effect model (MPE-EPU model). The MPE-EPU model is expressed as follows:
Y i , p , t = α + β 1 Y ¯ i , p , t 1 + β 2 E P U t 1 + β 3 Y ¯ i , p , t 1 × E P U t 1 + γ X i + λ μ p + σ ϑ t + ε i , p , t
where Y i , p , t is calculated by MPi,t, MNi,t and MVi,t, respectively, and Y ¯ i , p , t 1 is calculated by PMN−i,p,t−1 and PMV−i,p,t−1, respectively. E P U t 1 is the degree of economic policy uncertainty at time t−1, and the research follows Baker et al. [39] for its calculation, in consideration of newspaper articles containing key terms about policy uncertainty, uncertainty about future changes in the tax code, and dispersion in economic forecasts of the consumer price index (CPI) and government spending. The higher the EPU, the larger the external uncertainty, and the more difficult it is for a firm to obtain adequate information by itself. The coefficient β 3 of Y ¯ i , p , t 1 × E P U t 1 reflects the moderating effect of EPU on MPE. The vector X i contains firm-specific characteristics as control variables (see Appendix A), and this model uses one-period (quarter) lagged value of the continuous control variables to tackle endogenous problems.

3.3. Constructing an Analysis Model of M&A Peer Effect on Corporate Sustainable Development

3.3.1. Defining Corporate Sustainable Development

This research emphasizes the importance of a firm’s sustainable development and defines sustainable growth rate (SGRi,t) as an indicator to measure the corporate sustainable development (CSD), in other words, the intrinsic growth capacity of a firm with its current operating efficiency and financial policy. SGR is derived by Higgins [40], who assumes that firms can use retained earnings and issue new debt to finance growth opportunities [41]. The SGR data in this study are extracted from the CSMAR database. Meanwhile, considering the possible endogenous problems, the study uses ΔSGRi,t−1,t+1 and ΔSGRi,t−1,t+4 to measure the variation of firm i’s sustainable development ability during period [t−1,t+1] and [t−1,t+4], to reflect the change of SGR one quarter and one year after the firm’s M&A decisions.

3.3.2. Measuring M&A Peer Effect Degree

It is believed that the degree of deviation from the peer averages is an effective way to reflect the impact of M&A peer effect on a firm [42,43,44]. More precisely, the closer a firm is to the peer averages, the more it is influenced by its peer firms; the more it deviates from the peer averages, the less it is influenced by its peer firms. Therefore, this study uses two methods to measure the M&A peer effect that the firm experiences:
P E N i , p , t = | ( M N i , t / P M N i , p , t 1 ) 1 |
P E V i , p , t = ln ( 1 + | ( M V i , t / P M V i , p , t 1 ) 1 | )
where P E N i , p , t is the M&A peer effect degree of firm i in industry p at time t, calculated by M&A number, while P E V i , p , t is the M&A peer effect degree of firm i in industry p at time t, calculated by M&A value. In addition, P E N i , p , t and P E V i , p , t are designed to be negative, in order to make sure that the larger these two indicators are, the smaller the M&A difference between firm and peer firms, and the stronger the M&A peer effect.

3.3.3. Building the CSD-MPE Model

The research employs ordinary least squares (OLS) regression analysis to investigate the relationship between corporate sustainable development (CSD) and M&A peer effect (MPE). This CSD-MPE model can be expressed as
Δ S G R i , p , t = α + β P E i , p , t + γ X i + λ μ p + σ ϑ t + ε i , p , t
where the dependent variable Δ S G R i , p , t is the change of sustainable growth rate of firm i in industry p at time t, which is calculated by ΔSGRi,t−1,t+1 and ΔSGRi,t−1,t+4, respectively. The independent variable P E i , p , t represents the M&A peer effect degree that peer firms in industry p have on firm i’s M&A decisions at time t, which is calculated by PENi,p,t and PEVi,p,t, respectively. The vector X i represents control variables, which are consistent with the MPET model (see Appendix A).

4. Empirical Results and Discussions

4.1. Descriptive Statistics

Table 1 summarizes the descriptive statistics for this study. It should be noted that the sample number is different for these empirical models due to the difference of calculation. The basic statistics of these models’ dependent and independent variables are reported in panel A/B/C separately, and the descriptive statistics of control variables are reported with the complete dataset.
Panel A reports the main variables used to examine whether there is peer effect in M&A activities. The average M&A possibility (MP) of each listed Chinese company between 2005 and 2019 is 0.051, with a standard deviation of 0.221. The volatility of the M&A value is larger than that of the number, both for firms (MV is 3.996 and MN is 0.250) and peer firms (PMV is 5.480 and PMN is 0.035). Panel B and C are different for the measurements of corporate sustainable growth rate (SGR). It is found that the observations of Panel C are less than Panel B since some samples are excluded for the lack of ΔSGRi,t−1,t+4. The mean and maximum value of ΔSGR in Panel B (Panel C) are −0.004 and 0.273 (−0.006 and 0.338), respectively, which indicates that although there exists positive ΔSGR, most companies’ SGR decreases. The mean value of PEN and PEV in Panel B (Panel C) is −1.960 and −0.780 (−1.961 and −0.780), respectively, suggesting that the M&A peer effect calculated by the M&A value is stronger than that calculated by the M&A number. As for the control variables, the overall characteristics of the remaining firm-specific control variables are generally consistent with the current economic conditions in China.

4.2. Peer Effect in M&A Activities and EPU’s Moderating Effect

4.2.1. Peer Effect in M&A Activities

Table 2 demonstrates the results of multiple regressions of the M&A peer effect testing model (MPET model). As mentioned before, the model is used to investigate the impact of peer firms’ M&A number and value on firm’s M&A decisions, which are measured by the M&A possibility (MPi,t), M&A number (MNi,t) and M&A value (MVi,t). The results are shown in columns (1) and (4), columns (2) and (5), and columns (3) and (6), respectively.
All the coefficients of PMN−i,p,t−1 and PMV−i,p,t−1 in columns (1) through (6) are significant statistically. This indicates that the peer effect in M&A activities does exist, and peer firms’ M&A number and value will significantly impact the firm’s M&A possibility, number and value, regardless of whether there are control variables involved. In addition, the use of control variables helps to improve the goodness of fit of the model. It can be seen that adjusted R2 in columns (4) through (6) are higher than those in columns (1) through (3), while the coefficients of PMN−i,p,t−1 and PMV−i,p,t−1 decline slightly.
Furthermore, in the case of a better fit, the coefficient of PMN−i,p,t−1 is 0.086 with statistical significance, which means that a one-unit increase of peer firms’ M&A number at time t−1 will lead to an increase of 0.086 in the firm’s M&A possibility. The significantly positive coefficient of PMN−i,p,t−1 shown in column (5) indicates that a one-unit increase of the peer firms’ M&A number at time t−1 could also make the firm’s M&A number increase by 0.089. In addition, the coefficient of PMV−i,p,t−1 is 0.009 at a significance level of 1%, suggesting that a one-unit increase of peer firms’ M&A value at time t−1 could make the firm’s M&A value increase by 0.009. Namely, the more active the peer firms’ M&As are, the more active the firm’s M&As are, and vice versa. This is probably because peer firms’ M&As may send out a positive signal that the overall business environment (including economic environment, policy environment, etc.) is becoming friendly to M&A activities. It may prompt the firm to imitate others and conduct M&As as well. Moreover, sometimes it is inevitable for firms to emulate the strategies and decisions of their rivals in order to keep their position or reputation in the market, even though this may result in some negative effects.
In summary, the results of the MPET model show that the peer effect exists in the M&A activities of listed Chinese companies. Although the phenomenon has been studied by a few researchers, this paper offers a more solid conclusion based on a larger number of variables and a higher frequency of data. On the one hand, in previous studies, the industry M&A peer effect was only tested by assessing the correlation between the firm’s M&A possibility and its peer firms’ M&A number (i.e., MP and PMN) [7]. This paper, however, utilizes three sets of variables (i.e., MP-PMN, MN-PMN and MV-PMV) to examine the M&A peer effect, which could provide a more comprehensive picture of this phenomenon. On the other hand, almost all scholars have studied the M&A peer effect based on annual data [7,8], assuming that peer firms’ M&A behavior in last year would affect the firm’s M&A decision in the current year; in this case, the information might already be out of date. This paper improves the testing model by using quarterly data instead, in order to capture the peer effect on M&A activities more accurately.

4.2.2. EPU’s Moderating Effect on M&A Peer Effect

Since the existence of peer effect in M&A activities has been proven above, this research will use the MPE-EPU model to explore how the M&A peer effect (MPE) is affected by economic policy uncertainty (EPU). The results of the regression are shown in Table 3.
It can be noticed that the coefficients of PMN−i,p,t−1 and PMV−i,p,t−1 in columns (1) through (6) are still significantly positive when the regression adds EPU as a moderating variable. This means that peer firms’ M&A number and value will significantly increase firm’s M&A possibility, number and value, with the consideration of the external economic policy environment. In addition, the coefficient estimates of EPUt−1 are significantly negative in columns (1) through (3), and negative but insignificant in columns (4) through (6). This means that, on the one hand, when the economic development and policy environment uncertainty increases, the firm will be more cautious about its M&A decisions, thus reducing the M&A number and value. On the other hand, the negative impact of economic policy uncertainty on the M&A is not determinant, because whether or not to initiate an M&A deal is a complicated and comprehensive decision, which depends more on a firm’s strategy, resources, financial condition, etc.
More importantly, the coefficients of PMN−i,p,t−1 × EPUt−1 and PMV−i,p,t−1 × EPUt−1 reflect the moderating effect of EPU on M&A peer effect. The coefficients’ significance of these two variables are different, which indicates that there is a different moderating effect of economic policy uncertainty on peer M&A number and peer M&A value. Specifically, all the coefficient estimates of PMN−i,p,t−1 × EPUt−1 are statistically significant in columns (1), (2), (4) and (5), suggesting that the economic policy uncertainty of China could strengthen the impact of peer firms’ M&A number by enhancing the firm’s M&A possibility and M&A number. In other words, firms are more likely to be influenced by their peers’ M&A activities in the same industry during periods of higher economic policy uncertainty. As for the reasons, it is mainly because the higher the EPU, the harder it is for firms to obtain sufficient information to decide whether to initiate an M&A deal independently. In order to reduce risks, firms prefer to take peers’ M&A activities as an important information resource and tend to imitate peers’ behavior.
However, the insignificant positive coefficient estimates in columns (3) and (6) indicate that even though the economic policy uncertainty could strengthen the impact of peer firms’ M&A value by enhancing the firm’s M&A value, the moderating effect is not strong enough. This means that the impact of EPU on the relationship of peer firms’ and the firm’s M&A value is not as strong as that on M&A number. This is also because of M&A’s high heterogeneity, i.e., a firm might prefer to imitate its peers to initiate an M&A deal in an uncertain economic policy environment, but the sizes of the M&As are still more closely related to the firm’s unique characteristics.
It is worth mentioning that, although some scholars have recognized EPU’s moderating effect on imitation in firms’ regular investment and innovation [3,7], this paper studies EPU’s moderating mechanism of the M&A peer effect for the first time. The results in this research are valuable because they confirm that the information environment (which is measured by EPU) is significant not only for the peer effect in firms’ regular decisions (e.g., regular investment and innovation), but also for the peer effect in firms’ major and complicated decisions (e.g., M&A). In addition, the finding that EPU does not strengthen PMV’s impact on MV differs from previous studies, which examined the peer effect in firms’ regular decisions. This is another important contribution of this paper, which suggests that even though EPU could strengthen the peer effect both in M&A and firms’ regular decisions, there are still differences that need to be taken into consideration in the future.

4.3. The Impact of M&A Peer Effect on Corporate Sustainable Development

This paper constructs a CSD-MPE model to study how M&A peer effect (MPE) affects corporate sustainable development (CSD), and uses the change of sustainable growth rate to measure the variation of corporate sustainability.
As shown in Table 4, first, when the change of sustainable growth rate is ΔSGRi,t−1,t+1, the coefficient estimate of M&A peer effect degree calculated by the M&A number (PENi,p,t) in column (1) is −0.0001 at a significance level of 10%, and that of M&A peer effect degree calculated by M&A value (PEVi,p,t) in column (2) is −0.0013 at a significance level of 5%. These results suggest that M&A peer effect has a significantly negative impact on corporate sustainable development, both in terms of M&A number and value. This is partly supported by previous research that suggests the peer effect is detrimental to firms’ value. For instance, Huang and Zhao [4] put forward a similar idea when they studied how the corporate value changed when the firm imitated its peer firms’ dividend policy, and they indicated that by ignoring the differences between the firm itself and its peers, it might set dividend policies that do not meet its own characteristics, ultimately reducing its corporate value. A plausible explanation is that M&A peer effect may cause irrational M&A activities, which means the firm may initiate an M&A deal beyond its own development needs or without adequate preparation. This will negatively impact the sustainable development of firms after M&A. It is obvious that the complexity and systematic nature of M&A projects calls for extra caution; even a well-planned and well-discussed M&A might encounter many difficulties and problems, not to mention irrational deals.
Second, when the change of sustainable growth rate is ΔSGRi,t−1,t+4, the coefficient estimate of M&A peer effect degree calculated by M&A number (PENi,p,t) in column (3) is still −0.0001 but is insignificant statistically, and that of M&A peer effect degree calculated by M&A value (PEVi,p,t) in column (4) is −0.0017 at a significance level of 5%. The results in Table 4 illustrate that the negative impact of M&A peer effect is more significant within a shorter period (e.g., one quarter after the M&A), since the longer the period is, the more factors there are to possibly affect the corporate sustainable growth rate, and thus the influence of the peer effect will be weakened.
Third, the impact of M&A peer effect degree calculated by the M&A value is stronger than that calculated by M&A number. This is because the M&A value contains more unique information about each firm. Therefore, the M&A peer effect degree calculated by the M&A value is more closely related to corporate sustainable development.
Overall, the findings above suggest that firms may jeopardize their own sustainable development when imitating others in M&A activities, and the negative influence varies with time as well as the measurement of peer effect degree. This brings a new perspective on understanding imitation in M&A activities and its impact, which is important both theoretically and practically.

4.4. Robustness Test

4.4.1. Alternative Measures of Peer Firms’ M&A Activities

In order to test the robustness of the results on whether there is a peer effect in China’s M&A market and EPU’s moderating effect on it, this study remeasured peer firms’ M&A activities by the ratio of peer firms that initiated M&As at time t−1 (PR−i,p,t−1). The results in Table 5 indicate that the baseline findings are robust to the alternative measure of peer firms’ M&A activities with PR−i,p,t−1.
More precisely, all the coefficients of PR−i,p,t−1 in columns (1) through (6) above are significantly positive, suggesting that the larger the PR−i,p,t−1 (i.e., the more peers take part in M&As), the greater the M&A peer effect (i.e., the greater the impact it has on a firm’s M&A decisions). Columns (2), (4) and (6) present EPU’s impact on the M&A peer effect. The coefficients of PR−i,p,t−1 × EPUt−1 are 0.0391, 0.0476 and 0.7607 at a significance level of 5%. This means that when the external economic policy uncertainty increases, firms tend to become increasingly dependent on their peers and attempt to obtain more information from them in order to diminish uncertainty. That is to say, economic policy uncertainty could motivate the firm to imitate peers’ M&A behavior.

4.4.2. Controlling for Industry-Level Factors

It is argued that firms might make the same decisions because they are facing the same conditions, rather than trying to imitate one another [45,46]. As firm-specific characteristics were already controlled in the baseline regression, for robustness, this study further controlled related industry-level factors to eliminate the effect of industrial characteristics (which represents the same conditions firms are facing).
Table 6 below shows the results of the examination of M&A peer effect. On the one hand, with industry-level factors controlled, the coefficient estimates of PMN−i,p,t−1 and PMV−i,p,t−1 in columns (1), (3) and (5) are also significantly positive but smaller than those in Table 3 (which doesn’t control the industry-level factors). This means that even when considering the influence of industry factors, the M&A peer effect exists. Meanwhile, the industrial characteristics also affect firms’ M&A decisions; therefore, the addition of these characteristics will reduce the M&A peer effect to a certain extent. On the other hand, the coefficients of PMN−i,p,t−1 × EPUt−1 are positive at a significance level of 5% in columns (2) and (4), while the coefficient of PMV−i,p,t−1 × EPUt−1 is insignificantly positive in column (6). This is also consistent with the results in Table 3. Therefore, the baseline findings of the existence of M&A peer effect and EPU’s moderating effect are robust to a stricter controlling regression.
Table 7 shows the correlation between the M&A peer effect and corporate sustainable development. It is found that the coefficient estimates in Table 7 are almost the same as those in Table 4 (which doesn’t control for the industry-level factors). This also provides robust evidence for the baseline findings of the negative impact of M&A peer effect on corporate sustainable development. It indicates that the industry-level factors have a limited influence on specific corporate sustainability. This is because a firm’s sustainable growth rate depends more on its own strategies, resources and operating conditions, etc., and all of these may adjust to its industrial environment but are not necessarily determined by it.

4.4.3. Adjusting Industry Classification Standards

Although the industry classification standards in this study are generally adopted [20,47,48], the paper adjusts the standards by applying a three-digit SIC code to all industries for the robustness test. After the adjustment, the industry number of the research increased from 47 to 65. The peer firms’ M&A variables were recalculated accordingly.
With the new classification of industries, it can be seen in Table 8 that most of the coefficient estimates are significantly positive. This means that peer firms’ M&A activities have a significant positive impact on the firm’s M&A decisions, which is consistent with the baseline regression. However, it is found that the coefficients are less significant and smaller than those in Table 3. In addition, EPU’s positive moderating effect remains almost the same as the results in Table 3, indicating that even when the peer groups in the same industry become smaller, an uncertain economic policy environment can still strengthen the M&A peer effect.
As shown in Table 9, the M&A peer effect degree still has a negative impact on corporate sustainable growth rate with the new classification of industries. All of the results are consistent with the baseline findings in Table 4, which prove the robustness of the models.

5. Implications

5.1. Theoretical Implications

This study analyzes the peer effect in M&A activities and its impact on corporate sustainable development. The findings show that the peer effect in M&A activities does exist, can be strengthened when the economic policy uncertainty increases, and has a negative influence on firms’ sustainability.
Peer effect has become an increasingly common phenomenon, based on the fact that it can be seen not only in firms’ regular decisions (e.g., regular investment and innovation) [4,5,16,20,21,22,23] but also in firms’ major decisions, such as mergers and acquisitions [7,8]. This paper provides evidence that there is a significantly positive correlation between a firm’s M&A decisions and its peers’ previous M&A activities in the same industry. This means that the previous behavior of peers would become one of the most important sources of information for the firm, especially when firm’s private information is limited due to its low capacity of information collection or the imperfect market [18].
The results of the paper reveal that the external uncertainty could strengthen the M&A peer effect. The examination of the moderating effect of economic policy uncertainty on the M&A peer effect in this study suggests that firms are more likely to imitate their peers to initiate an M&A deal in an uncertain economic policy environment. This is because the higher the uncertain economic policy environment, the harder it is for firms to obtain sufficient information to make decisions independently. In order to reduce risks, firms tend to rely on their peers’ previous behavior [3]. This imitation may help them to maintain the same condition as others. Thus, improving the information environment (i.e., diminishing the economic policy uncertainty) and enhancing the capacity of firms to acquire and manage information are effective ways to reduce the peer effect in M&A activities.
Furthermore, firms should pay more attention to the M&A peer effect and be more cautious with their imitation in M&A deals, because the M&A peer effect has a significantly negative impact on their sustainability. Some previous studies on the peer effect in firms’ regular decisions have concluded that the peer effect is beneficial for firms, since it can help them to obtain more information and experience from peers [31,32], while others argue that it is detrimental because firms might imitate their peers without taking into account their own characteristics [4,6]. The findings of this paper indicate that the complexity and systematic nature of M&A projects calls for extra caution; even a well-planned and well-discussed M&A might come across many difficulties and problems, not to mention irrational deals as a result of imitating peers. That is to say, although firms might attempt to imitate peers’ M&A behaviors as a way of obtaining more information, reducing risks, maintaining their competence or reputation, etc., the resulting M&A peer effect will unfortunately undermine their sustainable development.

5.2. Methodological Implications

This study constructs three models to examine the research hypotheses.
First, it builds the M&A peer effect testing model (MPET model) to investigate the peer effect in M&A activities. With this model, the accuracy of peer effect testing for M&As is improved, which is important for the research on this topic. Specifically, unlike previous research, the MPET model examines the existence of the peer effect in M&A activities at a quarterly rather than annual frequency, which could reflect the information in a timelier fashion and provide more details about the influence of peer firms’ M&A previous behavior on the firm’s M&A decision.
Second, the M&A peer effect-economic policy uncertainty model (MPE-EPU model) is constructed to explore EPU’s moderating effect on M&A peer effect. Although the moderating effect of EPU is widely recognized in the research of peer effect in firms’ investment and innovation [3,7], the moderating effect of EPU is tested in the M&A peer effect for the first time.
Third, the paper proposes the corporate sustainability development-M&A peer effect model (CSD-MPE model) to study how M&A peer effect impacts corporate sustainable development. It is worth noting that the research innovatively measures the M&A peer effect degree by the deviation between the firm’s M&A number/value and its peers’ average M&A number/value. The combined measures of number and value allow exploration of the M&A peer effect from different perspectives, thus facilitating more comprehensive and integrated analysis and conclusions.

5.3. Practical Implications

The economic policy uncertainty index of China has surged from 9.07 to 755.26 from 2000 to 2019, which is much faster than the world average (53.23 to 238.71). At the same time, M&A activities in China have risen sharply, with an average annual growth rate of 14.7%. This means that the imitation (including irrational imitation) in M&A activities could have increased as well, which should be taken into account. Hence, the findings of this study offer great practical value to Chinese firms and policymakers, especially when the world is undergoing unprecedented changes.
As for firms, given the negative impact that M&A peer effect could have on corporate sustainable development, firms should be more cautious when engaging in M&A activities and should give careful consideration to the timing, target and purpose of M&As. Meanwhile, by leveraging technologies such as big data and artificial intelligence, companies can improve the way they acquire, process, and manage information. This will help them become less dependent on peers’ information and make better decisions.
As for policymakers, based on the findings that economic policy uncertainty could strengthen the M&A peer effect, they should find a way to diminish economic policy uncertainty. Aiming to achieve this goal, policymakers should try to enhance the continuity of policies and improve transparency in information disclosure and sharing. Additionally, it is important for policymakers to strengthen investor education, accelerate the establishment and improvement of the vocational education system, and provide better guidance and advisory support, so as to help firms reduce irrational imitation in M&A activities.

6. Conclusions and Future Work

This study enriches the research on the M&A peer effect by employing a comprehensive M&A dataset for China between 1 January 2005 and 31 December 2019, to investigate the existence of the peer effect in M&As and study its impact on corporate sustainable development. The analysis began with constructing an MPET model with quarterly data to examine whether there is peer effect in M&A activities. Then, the MPE-EPU model was built to evaluate the moderating effect of economic policy uncertainty on M&A peer effect. Finally, the research proposed the CSD-MPE model to explore the correlation between M&A peer effect and corporate sustainable development. The findings of this paper offer theoretical, methodological and practical implications, especially within the context of China’s M&A market.
It was found that the M&A peer effect does exist in listed Chinese companies. Firms tend to imitate their industry peers’ M&A behaviors, which means that peer firms’ M&A number and value will increase the firm’s M&A possibility, number and value. The economic policy uncertainty has a significantly positive moderating effect on the M&A peer effect. In other words, the increase of external uncertainty could strengthen a firm’s tendency to imitate its peers in M&A deals. Furthermore, M&A peer effect has a negative influence on corporate sustainable development, using both the M&A peer effect and M&A number or value. And the negative impact calculated by M&A value is significantly stronger than that which calculated by M&A frequency, it is most likely because the M&A value contains more unique information for each firm. Also, the negative impact of M&A peer effect is more significant within a shorter period after the M&A (e.g., after one quarter), since the longer the period, the more factors will affect the corporate sustainable development, thus the influence of the peer effect will be weakened.
The theoretical contributions of this research are mainly based on its innovative investigation of the M&A peer effect in a more systematic way by conducting theoretical analysis, proposing an innovative way to measure the M&A peer effect, examining its existence, studying EPU’s impact on the peer effect and the peer effect’s influence on corporate sustainable development. All of these could fill the research gap of behavior science studies on M&A activities as well as corporate sustainability. Methodologically, the study improves the accuracy of the testing model of M&A peer effect based on quarterly data, which captures the peer effect more accurately and offers a more solid conclusion compared to the annual data used in earlier literature. Moreover, the findings provide further practical support for both Chinese firms and policymakers to mitigate irrational imitation in M&A activities, thus achieving the corporate sustainable development goals.
Although the study has contributed to explore the peer effect in M&A activities and its impact on corporate sustainable development, it is subject to certain limitations worth noting. First, the empirical results are only based on the data of acquiring firms and may not be able to reflect the peer effect and its impact on acquirees. Therefore, in order to improve the completeness of the findings, it is necessary to investigate M&A peer effect from the perspective of acquirees. Second, it is believed that competition pressure and managers’ desire to maintain their reputation will also increase firms’ tendency to imitate their peers. These variables can be further used to complete the moderating mechanisms of M&A peer effect. Third, the indicators to reflect corporate sustainable development are limited in this paper. Future research can attempt to measure the corporate sustainability through risk management, market position maintenance, etc., to refine the CSD-MPE model. Last, this paper pays more attention to the M&A peer effect’s influence on the firm itself, while its influence on other stakeholders (e.g., industry, M&A market, etc.) is worth studying as well. Hence the research can be further improved by broadening the research objects.

Author Contributions

Conceptualization, Y.G. and J.L.; methodology, Y.G.; software, Y.G.; validation, J.L. and S.B.; formal analysis, Y.G. and J.L.; investigation, Y.G.; resources, Y.G., J.L. and S.B.; data curation, Y.G. and J.L.; writing—original draft preparation, Y.G.; writing—review and editing, J.L.; supervision, S.B.; project administration, S.B.; funding acquisition, Y.G., J.L. and S.B. All authors have read and agreed to the published version of the manuscript.

Funding

This research was funded by Zhejiang Federation of Humanities and Social Sciences, grant number 16JDGH084. This research was funded by Zhejiang University’s Big Data+ Plan.

Institutional Review Board Statement

Not applicable.

Informed Consent Statement

Not applicable.

Data Availability Statement

Data available on request.

Acknowledgments

The authors thank Sardar Muhammad Usman and Man Luo for English editing. The authors also thank the editors and anonymous referees for their kind review and helpful comments.

Conflicts of Interest

The authors declare no conflict of interest.

Appendix A

Table A1. Variable description.
NameSymbolDescription
M&A possibilityMPi,t1 if firm i acquires another at time t; 0 if not
M&A numberMNi,tM&A number that firm i initiates at time t
M&A valueMVi,tM&A value that firm i initiates at time t
Change of sustainable growth rate in a quarterΔSGRi,t−1,t+1(sustainable growth rate of firm i at time t+1 − sustainable growth rate of firm i at time t−1)/sustainable growth rate of firm i at time t−1
Change of sustainable growth rate in a yearΔSGRi,t−1,t+4(sustainable growth rate of firm i at time t+4 − sustainable growth rate of firm i at time t−1)/sustainable growth rate of firm i at time t−1
Average M&A number of peer firmsPMN−i,p,t−1average M&A number of firm i’s peer firms in the same industry p at time t−1
Average M&A value of peer firmsPMV−i,p,t−1natural logarithm value of average M&A value of firm i’s peer firms in the same industry p at time t−1
Peer effect degree calculated by M&A numberPENi,p,t | ( M N i , t / P M N i , p , t 1 ) 1 |
Peer effect degree calculated by M&A valuePEVi,p,t ln ( 1 + | ( M N i , t / P M N i , p , t 1 ) 1 | )
Economic policy uncertaintyEPUt−1the economic policy uncertainty index published by Baker et al. [39]
Leverage ratioLeveragei,t−1total liabilities of firm i at time t−1/total assets of firm i at time t−1
Total assetsSizei,t−1natural logarithm value of total assets of firm i at time t−1
Revenue growth rateGrowthi,t−1(revenue of firm i at time t−1 − revenue of firm i at time t−2)/revenue of firm i at time t−2
Operating cash flowOCFi,t−1net operating cash flow of firm i at time t−1/total assets of firm i at time t−1
Return on assetsROAi,t−1net profit of firm i at time t−1/total assets of firm i at time t−1
Cash ratioCRi,t−1net currency assets of firm i at time t−1/total assets of firm i at time t−1
Permanent assets ratioPARi,t−1net permanent assets of firm i at time t−1/total assets of firm i at time t−1
Intangible assets ratioIARi,t−1net intangible assets of firm i at time t−1/total assets of firm i at time t−1
Tobin’s QTobinQi,t−1market value of firm i at time t−1/total assets of firm i at time t−1
Nature of propertyPropertyi,t1 if firm i is state-owned at time t; 0 if not
Double dutyDuali,t1 if the chairman and president of firm i are the same person at time t; 0 if not
Board sizeBoardi,tnumber of directors on board of firm i at time t
Independent directors ratioIDRi,tnumber of independent directors of firm i at time t/number of directors on board of firm i at time t
List ageLAi,t1 + years that firm i has been listed at time t
Largest shareholding ratioLSHi,tshares of the largest shareholder of firm i at time t/total shares of firm i at time t
Executive shareholding ratioESHi,tshares of executives have of firm i at time t/total shares of firm i at time t
Institutional shareholding ratioISHi,tshares of institutional shareholders of firm i at time t/total shares of firm i at time t
Overconfident degree of managersOverconfidencei,tTop1 director’s compensation of firm i at time t/total directors’ compensation of firm i at time t

References

  1. Banerjee, A.V. A simple model of herd behavior. Q. J. Econ. 1992, 107, 797–817. [Google Scholar] [CrossRef] [Green Version]
  2. Zhang, J.; Liu, P. Rational herding in microloan markets. Manag. Sci. 2012, 58, 892–912. [Google Scholar] [CrossRef] [Green Version]
  3. Im, H.J.; Liu, J.; Park, Y.J. Policy uncertainty and peer effects: Evidence from corporate investment in China. Int. Rev. Financ. Anal. 2021, 77, 101834. [Google Scholar] [CrossRef]
  4. Huang, L.; Zhao, Z. Executive background, dividend herding behavior and firm value. J. Fuzhou Univ. Philos. Soc. Sci. Ed. 2019, 33, 45–53. [Google Scholar]
  5. Hu, Y. Investment herding behavior and firm value: Empirical analysis based on industrial policy perspective. Financ. Account. Int. Commer. 2014, 28, 61–64. [Google Scholar] [CrossRef]
  6. Ye, L.; Li, X. Managerial investment herding behavior, industrial policy and corporate value: An empirical test based on A-share listed companies in China. J. Jiangxi Univ. Financ. Econ. 2012, 14, 24–32. [Google Scholar]
  7. Wan, L.; Liang, C.; Rao, J. Industry peer effect in M&A decisions of China’s listed companies. Nankai Bus. Rev. 2016, 19, 40–50. [Google Scholar]
  8. Su, C. Peer effects of M&A behaviors in interlocking directorate networks. E. China Econ. Manag. 2017, 31, 143–150. [Google Scholar]
  9. Zhang, X.; Yao, H.; Du, X. The peer effect of serial mergers and acquisitions and the internal control of enterprise. J. Northeast. Univ. Soc. Sci. 2021, 23, 22–31. [Google Scholar]
  10. Fatemi, A.M.; Fooladi, I.; Garehkoolchian, N. Gains from mergers and acquisitions in Japan. Glob. Financ. J. 2017, 32, 166–178. [Google Scholar] [CrossRef]
  11. Hossain, M.S. Merger & acquisitions (M&As) as an important strategic vehicle in business: Thematic areas, research avenues & possible suggestions. J. Econ. Bus. 2021, 116, 106004. [Google Scholar]
  12. Mamun, A.; Tannous, G.; Zhang, S. Do regulatory bank mergers improve operating performance? Int. Rev. Econ. Financ. 2021, 73, 152–174. [Google Scholar] [CrossRef]
  13. World Bank. Global Economic Prospects. A Word Bank Group Flagship Report; The World Bank Group: Washington, DC, USA, 2022. [Google Scholar]
  14. Park, K.; Yang, I.; Yang, T. The peer-firm effect on firm’s investment decisions. North Am. J. Econ. Financ. 2017, 40, 178–199. [Google Scholar] [CrossRef]
  15. Yan, Q.; Zhu, H. Peer influence on dividend policy: Evidence from the Chinese stock market. Econ. Lett. 2020, 192, 109229. [Google Scholar] [CrossRef]
  16. Machokoto, M.; Gyimah, D.; Ntim, C.G. Do peer firms influence innovation? Br. Account. Rev. 2021, 53, 100988. [Google Scholar] [CrossRef]
  17. Scharfstein, D.; Stein, J. Herd behavior and investment. Am. Econ. Rev. 1990, 80, 465–479. [Google Scholar]
  18. Bikhchandani, S.; Hirshleifer, D.; Welch, I. A theory of fads, fashion, custom, and cultural change as informational cascades. J. Political Econ. 1992, 100, 992–1026. [Google Scholar] [CrossRef]
  19. Lieberman, M.B.; Asaba, S. Why do firms imitate each other? Acad. Manag. Rev. 2006, 31, 366–385. [Google Scholar] [CrossRef] [Green Version]
  20. Lu, R.; Wang, C.; Deng, M. “Peer effect” in capital structure of China’s listed firms. Bus. Manag. J. 2017, 39, 181–194. [Google Scholar]
  21. Zhang, D.; Jiang, X. Managerial power, nature of property and peer effect in corporate investment. J. Zhongnan Univ. Econ. Law. 2016, 59, 82–90. [Google Scholar]
  22. Liu, J.; Wang, K. Peer effect on corporate R&D: Evidence from China. Econ. Theory Bus. Manag. 2018, 37, 21–32. [Google Scholar]
  23. Feng, G.; Wang, J. The peer effect of corporate innovation in social network. Chin. J. Manag. 2019, 16, 1809–1819. [Google Scholar]
  24. Ismail, A.; Krause, A. Determinants of the method of payment in mergers and acquisitions. Q. Rev. Econ. Financ. 2010, 50, 471–484. [Google Scholar] [CrossRef]
  25. Bena, J.; Li, K. Corporate innovation and mergers and acquisitions. J. Financ. 2014, 69, 1923–1960. [Google Scholar] [CrossRef]
  26. Lee, D. Cross-border mergers and acquisitions with heterogeneous firms: Technology vs. market motives. North Am. J. Econ. Financ. 2017, 42, 20–37. [Google Scholar] [CrossRef]
  27. Gu, L.; Reed, W.R. Does financing of Chinese mergers and acquisitions have “Chinese Characteristics”? Econ. Lett. 2016, 139, 11–14. [Google Scholar] [CrossRef] [Green Version]
  28. Paudyal, K.; Thapa, C.; Koirala, S.; Aldhawyan, S. Economic policy uncertainty and cross-border mergers and acquisitions. J. Financ. Stab. 2021, 56, 100926. [Google Scholar] [CrossRef]
  29. Caiazza, S.; Galloppo, G.; Paimanova, V. The role of sustainability performance after merger and acquisition deals in short and long-term. J. Clean Prod. 2021, 314, 127982. [Google Scholar] [CrossRef]
  30. Doukas, J.A.; Zhang, R. Managerial ability, corporate social culture, and M&As. J. Corp. Financ. 2021, 68, 101942. [Google Scholar]
  31. Buchner, A.; Mohamed, A.; Schwienbacher, A. Herd behaviour in buyout investment. J. Corp. Financ. 2020, 60, 101503. [Google Scholar] [CrossRef]
  32. Tian, X.; Song, Y.; Luo, C.; Zhou, X.; Lev, B. Herding behavior in supplier innovation crowdfunding: Evidence from Kickstarter. Int. J. Prod. Econ. 2021, 239, 108184. [Google Scholar] [CrossRef]
  33. Schmidt, B. Cost and benefits of friendly boards during mergers and acquisitions. J. Financ. Econ. 2015, 117, 424–447. [Google Scholar] [CrossRef]
  34. Cui, H.; Leung, S.C. The long-run performance of acquiring firms in mergers and acquisitions: Does managerial ability matter? J. Contemp. Account. Econ. 2020, 16, 100185. [Google Scholar] [CrossRef]
  35. Kaustia, M.; Rantala, V. Social learning and corporate peer effects. J. Financ. Econ. 2015, 117, 653–669. [Google Scholar] [CrossRef]
  36. Xiao, R.; Ma, C.M.; Song, G.; Chang, H. Does peer influence improve firms’ innovative investment? Evidence from China. Energy Rep. 2022, 8, 1143–1150. [Google Scholar] [CrossRef]
  37. Seo, H. Peer effects in corporate disclosure decisions. J. Account. Econ. 2021, 71, 101364. [Google Scholar] [CrossRef]
  38. Vo, H.; Trinh, Q.; Le, M.; Nguyen, T. Does economic policy uncertainty affect investment sensitivity to peer stock prices? Econ. Anal. Policy. 2021, 72, 685–699. [Google Scholar] [CrossRef]
  39. Baker, S.R.; Bloom, N.; Davis, S.J. Measuring Economic Policy Uncertainty. Q. J. Econ. 2016, 131, 1593–1636. [Google Scholar] [CrossRef]
  40. Higgins, R. How much growth rate can a firm afford? Financ. Manag. 1997, 6, 7–16. [Google Scholar] [CrossRef]
  41. Chen, H.; Gupta, M.C.; Lee, A.C.; Lee, C. Sustainable growth rate, optimal growth rate, and optimal payout ratio: A joint optimization approach. J. Bank Financ. 2013, 37, 1205–1222. [Google Scholar] [CrossRef]
  42. Christie, W.G.; Huang, R.D. Following the pied piper: Do individual returns herd around the market? Financ. Anal. J. 1995, 51, 31–37. [Google Scholar] [CrossRef]
  43. Jiang, X.; Zhang, D. Official incentive, industrial policy implementation and overcapacity: An analysis based on the peer effect of corporate investment. Mod. Financ. Econ. -J. Tianjin Univ. Financ. Econ. 2018, 38, 88–102. [Google Scholar]
  44. Ukpong, I.; Tan, H.; Yarovaya, L. Determinants of industry herding in the US stock market. Financ. Res. Lett. 2021, 43, 101953. [Google Scholar] [CrossRef]
  45. Mitchell, M.L.; Mulherin, J.H. The impact of industry shocks on takeover and restructuring activity. J. Financ. Econ. 1996, 41, 193–229. [Google Scholar] [CrossRef]
  46. Cao, Y.; Fang, Z. Frontier theory of M&A wave motivation: Industry shock theory. Foreign Econ. Manag. 2003, 25, 21–24. [Google Scholar]
  47. Chen, S.; Lu, C. Intercorporate executive linkages and M&A premium decision: An empirical study based on inter-organizational imitation theory. Manag. World 2013, 29, 144–156. [Google Scholar]
  48. Cai, Y. Impact of economic policy uncertainty on peer effect of R&D investment in state-owned listed companies. China Circ. Econ. 2020, 35, 87–90. [Google Scholar]
Figure 1. Research framework of this study.
Sustainability 14 03891 g001
Table 1. Descriptive statistics.
MeanS.D.MinMax
Panel A (Obs: 79,207)
MP0.0510.22101
MN0.0560.25005
MV0.9253.996024.257
PMN0.0500.03500.167
PMV13.4435.480018.778
Panel B (Obs: 68,276)
ΔSGRi,t−1,t+1−0.0040.079−0.3230.273
PEN−1.9604.429−31−1
PEV−0.7800.463−3.956−0.638
Panel C (Obs: 68,231)
ΔSGRi,t−1,t+4−0.0060.088−0.3980.338
PEN−1.9614.430−31−1
PEV−0.7800.463−3.956−0.638
Firm-specific Control Variables (Obs: 79,207)
Leverage0.4380.2110.0510.922
Size22.1071.32619.80526.443
Growth0.1810.393−0.5862.226
OCF0.0200.061−0.1540.201
ROA0.0400.044−0.0790.203
CR0.1700.1250.0120.626
PAR0.2410.1720.0030.736
IAR0.0440.04700.287
TobinQ1.9901.2240.8927.894
Property0.4640.49901
Dual0.2310.42101
Board8.8611.840515
IDR0.3710.0520.3000.571
LA10.2876.361130
LSH0.3580.1490.0930.741
ESH0.0840.15800.633
ISH0.4110.2550.0020.907
Overconfidence0.2540.1040.1030.637
Note: Data are extracted from the China Stock Market & Accounting Research (CSMAR) database. S.D.: standard deviation. Obs: objects. Table 1 reports the descriptive statistics of the complete dataset in different models. However, some variables are used by their one-period (quarter) lagged value to tackle endogenous problems in the regression analysis, which means some samples would be excluded if they did not meet the requirement. In addition, all the variables are defined in the Appendix A.
Table 2. Peer effect in M&A activities.
MPi,tMNi,tMVi,tMPi,tMNi,tMVi,t
(1)(2)(3)(4)(5)(6)
PMN−i,p,t−10.142 ***0.157 *** 0.086 **0.089 **
(2.952)(2.945) (2.285)(2.162)
PMV−i,p,t−1 0.012 *** 0.009 ***
(3.834) (2.888)
Firm-specific ControlsNNNYYY
Industry FEYYYYYY
Quarter-year FEYYYYYY
Observations74,15974,15974,15974,15974,15974,159
Adj. R20.0470.0600.0490.0510.0640.053
Note: t-statistics are presented in parentheses; ** and *** denote statistical significance at the 5% and 1% levels, respectively. FE: fixed effect.
Table 3. EPU’s moderating effect on M&A peer effect.
MPi,tMNi,tMVi,tMPi,tMNi,tMVi,t
(1)(2)(3)(4)(5)(6)
PMN−i,p,t−10.1445 ***0.1593 *** 0.0868 **0.0892 **
(3.0307)(3.0150) (2.3185)(2.1946)
PMV−i,p,t−1 0.0121 *** 0.0095 ***
(3.8651) (2.9079)
EPUt−1−0.0015 **−0.0014 **−0.0208 *−0.0005−0.0004−0.0047
(−2.4484)(−2.1211)(−1.8785)(−0.7115)(−0.5029)(−0.3454)
PMN−i,p,t−1 × EPUt−10.0305 *0.0363 ** 0.0320 **0.0380 **
(1.9739)(2.1240) (2.1377)(2.2807)
PMV−i,p,t−1 × EPUt−1 0.0005 0.0014
(0.1967) (0.5875)
Firm-specificControlsNNNYYY
Industry FEYYYYYY
Quarter-year FEYYYYYY
Observations74,15974,15974,15974,15974,15974,159
Adj. R20.0470.0600.0490.0510.0640.053
Note: t-statistics are presented in parentheses; *, ** and *** denote statistical significance at the 10%, 5% and 1% levels, respectively. FE: fixed effect.
Table 4. M&A peer effect on corporate sustainable development.
ΔSGRi,t−1,t+1ΔSGRi,t−1,t+4
(1)(2)(3)(4)
PENi,p,t−0.0001 * −0.0001
(−1.8238) (−1.2686)
PEVi,p,t −0.0013 ** −0.0017 **
(−2.1498) (−2.6718)
Firm-specific ControlsYYYY
Industry FEYYYY
Quarter-year FEYYYY
Observations59,11959,11959,08759,087
Adj. R20.3400.3400.3080.308
Note: t-statistics are presented in parentheses; * and ** denote statistical significance at the 10% and 5% levels, respectively. FE: fixed effect.
Table 5. Peer effect in M&A activities and EPU’s moderating effect: alternative measures of peer firms’ M&A activities.
MPi,tMNi,tMVi,t
(1)(2)(3)(4)(5)(6)
PR−i,p,t−10.1072 ***0.1079 ***0.1095 **0.1100 **1.8976 **1.9074 ***
(2.7283)(2.7722)(2.5356)(2.5752)(2.6588)(2.6965)
EPUt−1 −0.0006 −0.0004 −0.0083
(−0.7398) (−0.5396) (−0.6241)
PR−i,p,t−1 × EPUt−1 0.0391 ** 0.0476 ** 0.7607 **
(2.1648) (2.3587) (2.3401)
Firm-specific ControlsYYYYYY
Industry FEYYYYYY
Quarter-year FEYYYYYY
Observations74,15974,15974,15974,15974,15974,159
Adj. R20.0510.0510.0640.0640.0530.053
Note: t-statistics are presented in parentheses; ** and *** denote statistical significance at the 5% and 1% levels, respectively. FE: fixed effect.
Table 6. Peer effect in M&A activities and EPU’s moderating effect: controlling for industry-level factors.
MPi,tMNi,tMVi,t
(1)(2)(3)(4)(5)(6)
PMN−i,p,t−10.0765 **0.0771 **0.0796 *0.0801 *
(2.0627)(2.1006)(1.9764)(2.0139)
PMV−i,p,t−1 0.0082 **0.0084 ***
(2.6752)(2.7004)
EPUt−1 −0.0004 −0.0002 −0.0024
(−0.5232) (−0.3203) (−0.1797)
PMN−i,p,t−1 × EPUt−1 0.0329 ** 0.0390 **
(2.2292) (2.3501)
PMV−i,p,t−1 × EPUt−1 0.0016
(0.6785)
Industry-level ControlsYYYYYY
Firm-specific ControlsYYYYYY
Industry FEYYYYYY
Quarter-year FEYYYYYY
Observations74,00674,00674,00674,00674,00674,006
Adj. R20.0510.0510.0640.0640.0530.053
Note: t-statistics are presented in parentheses; *, ** and *** denote statistical significance at the 10%, 5% and 1% levels, respectively. FE: fixed effect.
Table 7. M&A peer effect on corporate sustainable development: controlling for industry-level factors.
ΔSGRi,t−1,t+1ΔSGRi,t−1,t+4
(1)(2)(3)(4)
PENi,p,t−0.0001 * −0.0001
(−1.8560) (−1.2859)
PEVi,p,t −0.0013 ** −0.0017 ***
(−2.1738) (−2.7074)
Industry-level ControlsYYYY
Firm-specific ControlsYYYY
Industry FEYYYY
Quarter-year FEYYYY
Observations59,10759,10759,07559,075
Adj. R20.3410.3410.3090.309
Note: t-statistics are presented in parentheses; *, ** and *** denote statistical significance at the 10%, 5% and 1% levels, respectively. FE: fixed effect.
Table 8. Peer effect in M&A activities and EPU’s moderating effect: reclassifying industries.
MPi,tMNi,tMVi,t
(1)(2)(3)(4)(5)(6)
PMN−i,p,t−10.0555 *0.0558 *0.05750.0577
(1.6868)(1.7029)(1.6372)(1.6536)
PMV−i,p,t−1 0.0064 **0.0066 **
(2.3673)(2.4027)
EPUt−1 −0.0006 −0.0004 −0.0057
(−0.7792) (−0.5443) (−0.4276)
PMN−i,p,t−1 × EPUt−1 0.0322 ** 0.0386 **
(2.3713) (2.4631)
PMV−i,p,t−1 × EPUt−1 0.0017
(1.0872)
Firm-specific ControlsYYYYYY
Industry FEYYYYYY
Quarter-year FEYYYYYY
Observations73,81373,81373,81373,81373,81373,813
Adj. R20.0510.0510.0640.0640.0530.053
Note: t-statistics are presented in parentheses; * and ** denote statistical significance at the 10% and 5% levels, respectively. FE: fixed effect.
Table 9. M&A peer effect on corporate sustainable development: reclassifying industries.
ΔSGRi,t−1,t+1ΔSGRi,t−1,t+4
(1)(2)(3)(4)
PENi,p,t−0.0001 * −0.0001
(−1.7159) (−1.0744)
PEVi,p,t −0.0012 * −0.0018 ***
(−1.9116) (−2.7184)
Firm-specific ControlsYYYY
Industry FEYYYY
Quarter-year FEYYYY
Observations53,35853,35853,32753,327
Adj. R20.3400.3400.3080.308
Note: t-statistics are presented in parentheses; * and *** denote statistical significance at the 10% and 1% levels, respectively. FE: fixed effect.
Publisher’s Note: MDPI stays neutral with regard to jurisdictional claims in published maps and institutional affiliations.

