Article

Citizen Science and the Sustainable Development Goals: Building Social and Technical Capacity through Data Collection in the Upper Blue Nile Basin, Ethiopia

1
Department of Civil and Environmental Engineering, University of Connecticut, Storrs, CT 06268, USA
2
Department of Civil Engineering, California State University, Sacramento, CA 95819, USA
3
Department of Hydraulic and Water Resource Engineering, Institute of Technology, University of Gondar, Gondar P.O. Box 196, Ethiopia
4
Faculty of Civil and Water Resources Engineering, Institute of Technology, Bahir Dar University, Bahir Dar P.O. Box 26, Ethiopia
5
School of Public Health, College of Medicine and Health Sciences, Bahir Dar University, Bahir Dar P.O. Box 79, Ethiopia
6
Department of Sociology, Human Rights Institute, University of Connecticut, Storrs, CT 06268, USA
7
Department of Biological and Environmental Engineering, Cornell University, Ithaca, NY 14853, USA
*
Author to whom correspondence should be addressed.
Sustainability 2022, 14(6), 3647; https://doi.org/10.3390/su14063647
Submission received: 31 December 2021 / Revised: 16 March 2022 / Accepted: 16 March 2022 / Published: 20 March 2022

Abstract

:
Engaging youth and women in data-scarce, least developed countries (LDCs) is gaining attention in the Sustainable Development Goal (SDG) arena, as is using citizen science as a multi-faceted mechanism for data collection, engendering personal empowerment and agency. Involving these populations in citizen science is a powerful synergy that simultaneously addresses the Leave-No-One-Behind promise in the United Nations’ 2030 Agenda, yet most citizen science takes place in the Global North, and attention to LDCs is needed. This article highlights a four-year, four-location, hydrology-focused, interdisciplinary citizen science initiative (CSI) in the Upper Blue Nile Basin, Ethiopia. Through a systematic evaluation, we explore scientific applications of the hydrologic data, as well as the social dimensions in the CSI, towards building a social and technical capacity that supports the SDGs at the local and international scale. In the CSI, Ethiopian high school students received training from local university faculty and graduate students, collecting river stage and groundwater level measurements, and farmers conducted soil resistivity measurements using a novel sensor technology developed for the study area. We found the datasets to be ample for use to locally validate regional groundwater models and seasonal forecasts on soil moisture and streamflow. We conducted written interviews with the students, which revealed their ability to perceive benefits of engagement in the CSI, as well as recognize their increased individual technical capacity. An analysis of the hydrological data demonstrates the readiness of the datasets to be used for evaluating water-related interventions that facilitate the SDGs, broadly, by building synergies between individuals and institutions. As such, we map how both the hydrologic data and experiences of the citizen scientists support the SDGs at the Goal and Target-level, while forging new social and technical pathways.

1. Introduction

Knowledge of water quantity, quality, and availability is directly linked to advancing human rights, reducing poverty, and ensuring sustainable development [1,2,3,4,5]. Chronic underinvestment in collecting hydrologic data, especially in LDCs, has led to a major deficit in datasets that would otherwise aid agricultural practices and economic development more broadly [6]. Lack of hydrologic data is considered a cross-cutting issue in the 17 SDGs, ratified by United Nation member states in 2015 [7].
The SDGs are the product of an immense global political effort to eradicate poverty; at their core, they can be considered scientific and social interventions that depend on building the social and technical capacity of both the individual and the system [8]. The SDGs are data-dependent and are evaluated through 169 targets and 231 unique indicators [9]. The success of the 169 targets depends on high-quality, accessible data collected at the international, national, and local scale [10,11]. Traditionally, national organizations have the primary responsibility for collecting official data to be used towards SDG monitoring, which is costly and time-consuming. Alternative data collection approaches, such as citizen science, have been identified as valuable supplementary tools [12,13], particularly for data-scarce regions [14].
Actionable hydrologic data must be timely, have a high-resolution, and be long-term [15,16]; however, there are major spatial and temporal data gaps [17]. Hydrologic data scarcity limits both SDG implementation and economic development, especially for countries whose economy is dependent on rainfed agriculture. The continental variations reported by the Open Data Inventory in data coverage and accessibility identifies that Africa has the lowest scores for environmental statistics globally—this is a paradoxical intercontinental challenge [18], given that Africa is already experiencing the effects of change in rainfall patterns due to climate change [19,20,21,22,23]. For rainfed-dependent agricultural countries like Ethiopia, future climatic uncertainty will compound the effects of current rainfall vulnerability, which will affect their economy [24]. Thus, every effort should be made to collect baseline hydrologic information that will aid in the unique challenge of simultaneous development and adaptation efforts.
The data scarcity within Ethiopia poses immediate issues for regional and national water authorities for evidence-based planning [25]. In a recent study, the International Water Management Institute (IWMI) concluded that hydrological monitoring in Ethiopia is at its weakest state since monitoring was strengthened in the 1960s under the Master Development Plan, when, under the World Bank, high-end infrastructure was set up to monitor inflows for sub-basins in Lake Tana [26]. In 2021, Gebrehiwot et al. [27] conducted an extensive inventory across all Ethiopian federal agencies, regarding the monitoring and assessment of water resources, and identified that streamflow is one of the more monitored hydrologic variables, while soil moisture and groundwater have no organized monitoring system established. Soil moisture and groundwater are instrumental early warning systems for drought and flood onset [28], both of which pose as significant challenges to Ethiopia’s food and water security. To address the myriad of issues brought to light in their key informant interviews and interagency policy analysis, one of their suggestions, as a way forward, was the integration of localized citizen science into a public and institutional national platform.
Citizen science is typically evaluated in terms of data quality, and within the SDG framework, its potential has been primarily mapped in terms of how project data contributes to monitoring specific indicators [29]. However, it is well-documented that citizen science has benefits and impacts that go beyond data collection; it can simultaneously capture valuable data and, in the process, create social connections and build technical capacity at the local level. Evaluating the potential of citizen science, in terms of growing social and technical capacity, involves social dimensions that support the SDGs and are yet to be systematically explored in detail, as done in this study.
This study critically evaluates the social and individual dimensions of our Citizen Science Initiative (CSI), which are components left unanalyzed in past literature [30]. The CSI involves eleven high school students who collected soil moisture, river stage, and groundwater depth on a weekly basis, as well as farmers who collected soil resistivity values in the Upper Blue Nile Basin, Ethiopia. The CSI engages youth in active hydrological data collection in partnership with rural schools and the local university, Bahir Dar University (BDU). Students engaged in college-readiness activities and were surveyed to understand their motivation to join and their experience in data collection. The CSI is part of the National Science Foundation-funded Partnerships for International Research and Education (NSF PIRE) Water & Food Security interdisciplinary project based in Ethiopia, which aims to collect hydrological data as an under-utilized resource for making progress towards the SDGs in low-income, data-poor regions [31]. Using hydrologic observation methods, i.e., river gaging, groundwater depth, as well as soil moisture measurements, interview data from citizen science participants, and ethnographic observations, we demonstrate, in this paper, the usability of the data to the scientific community, assess the citizen scientist experience, map the thematic and target-specific contributions of the CSI in the SDG context, and discuss the challenges and limitations of this study.

2. Materials and Methods

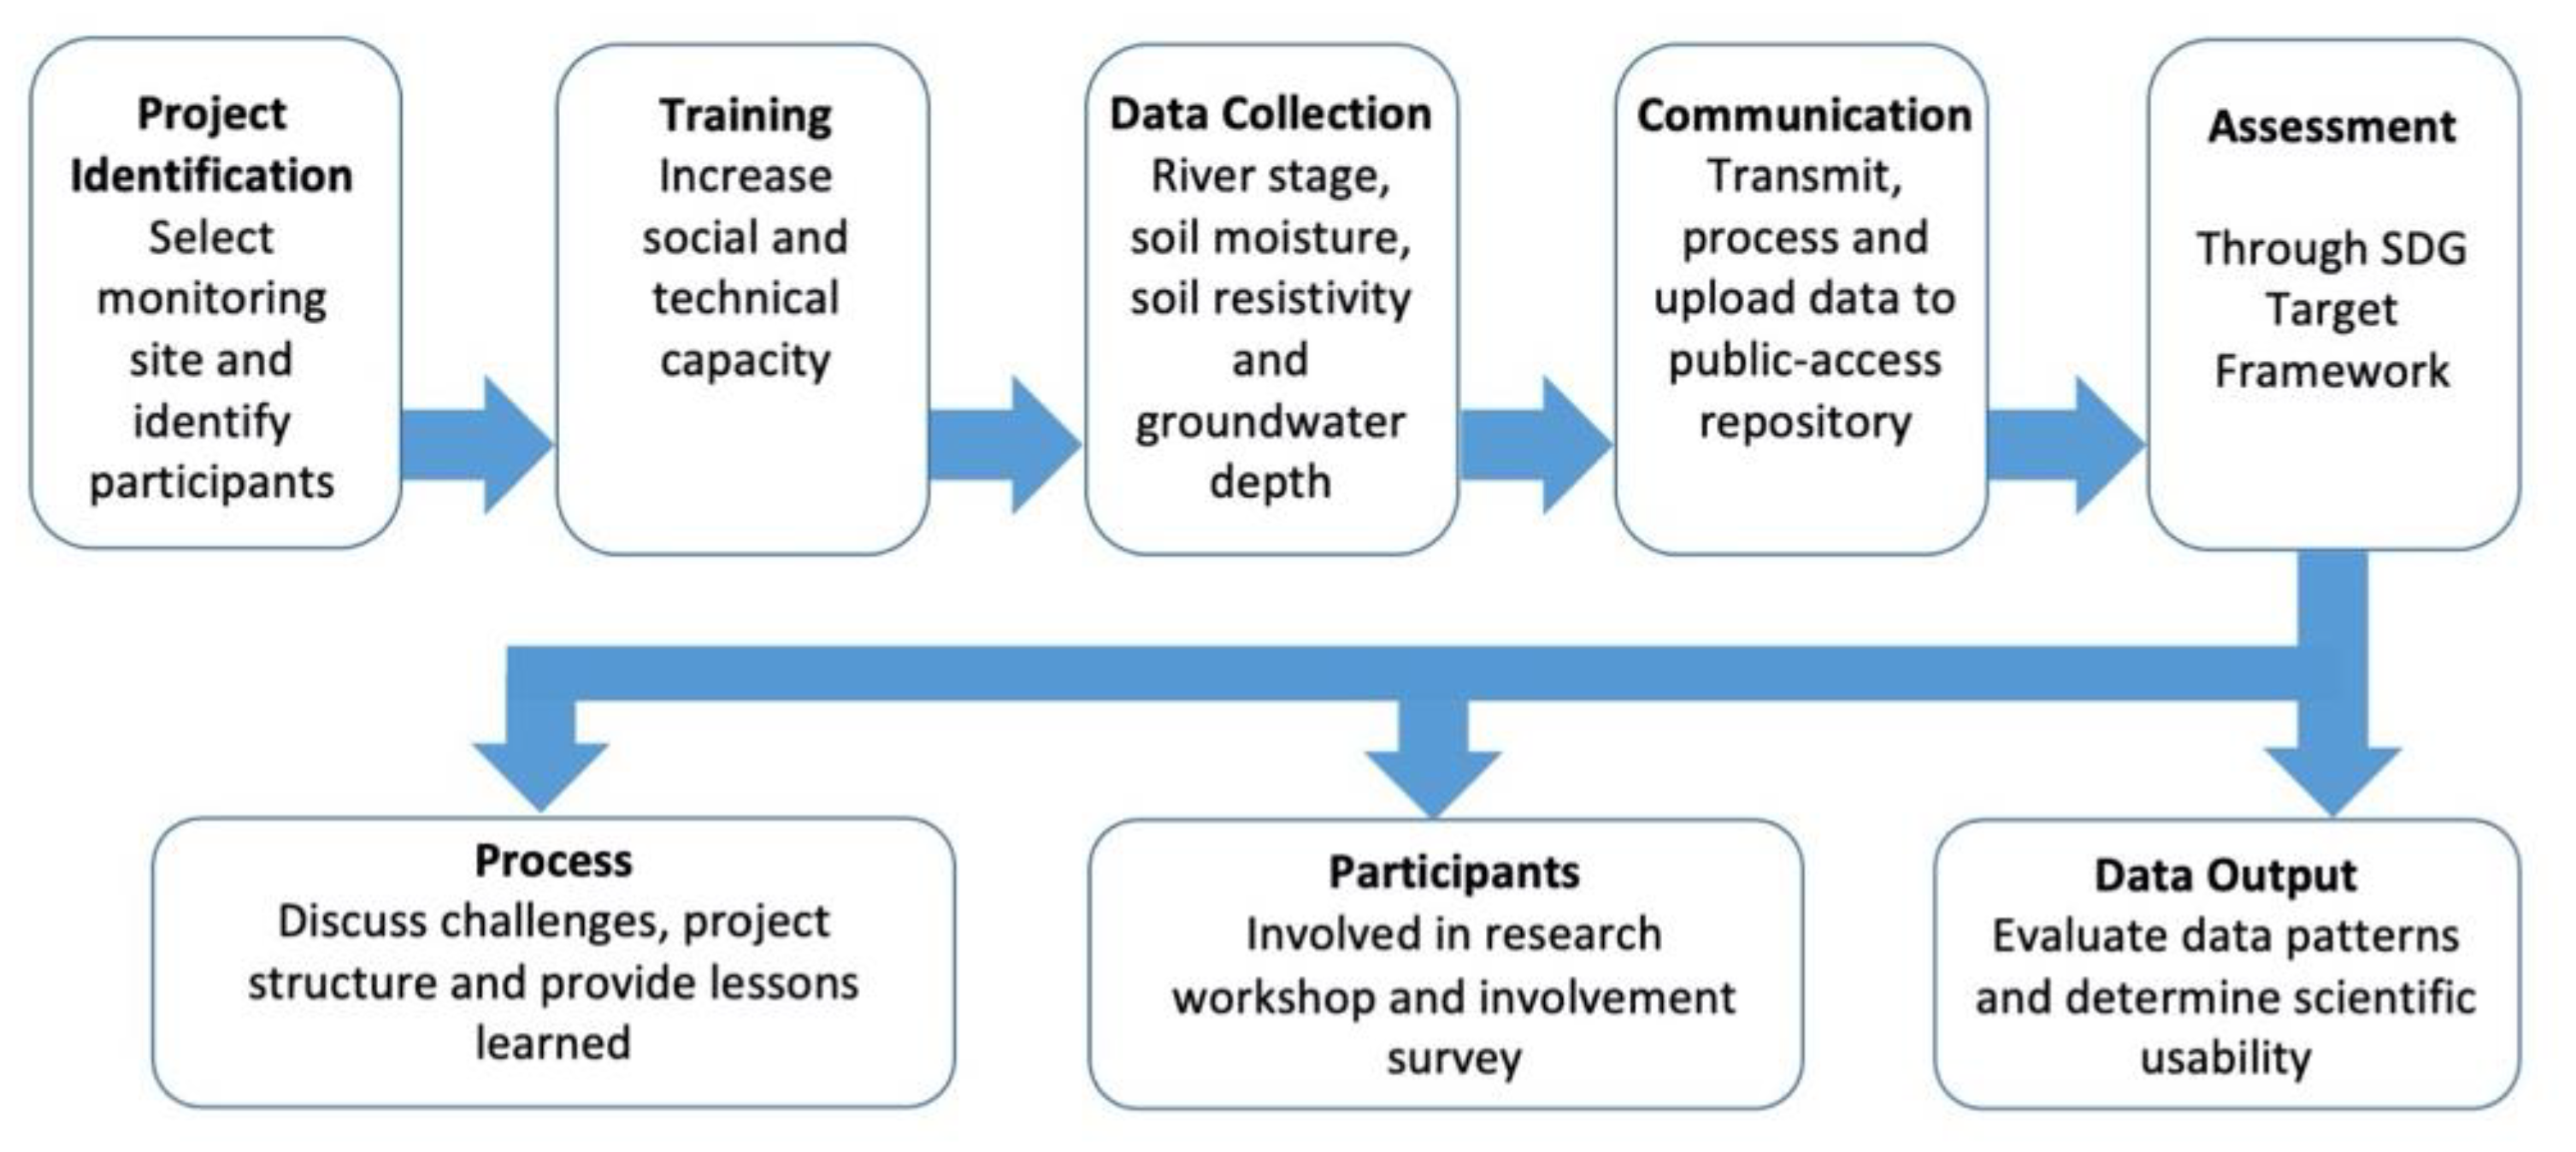
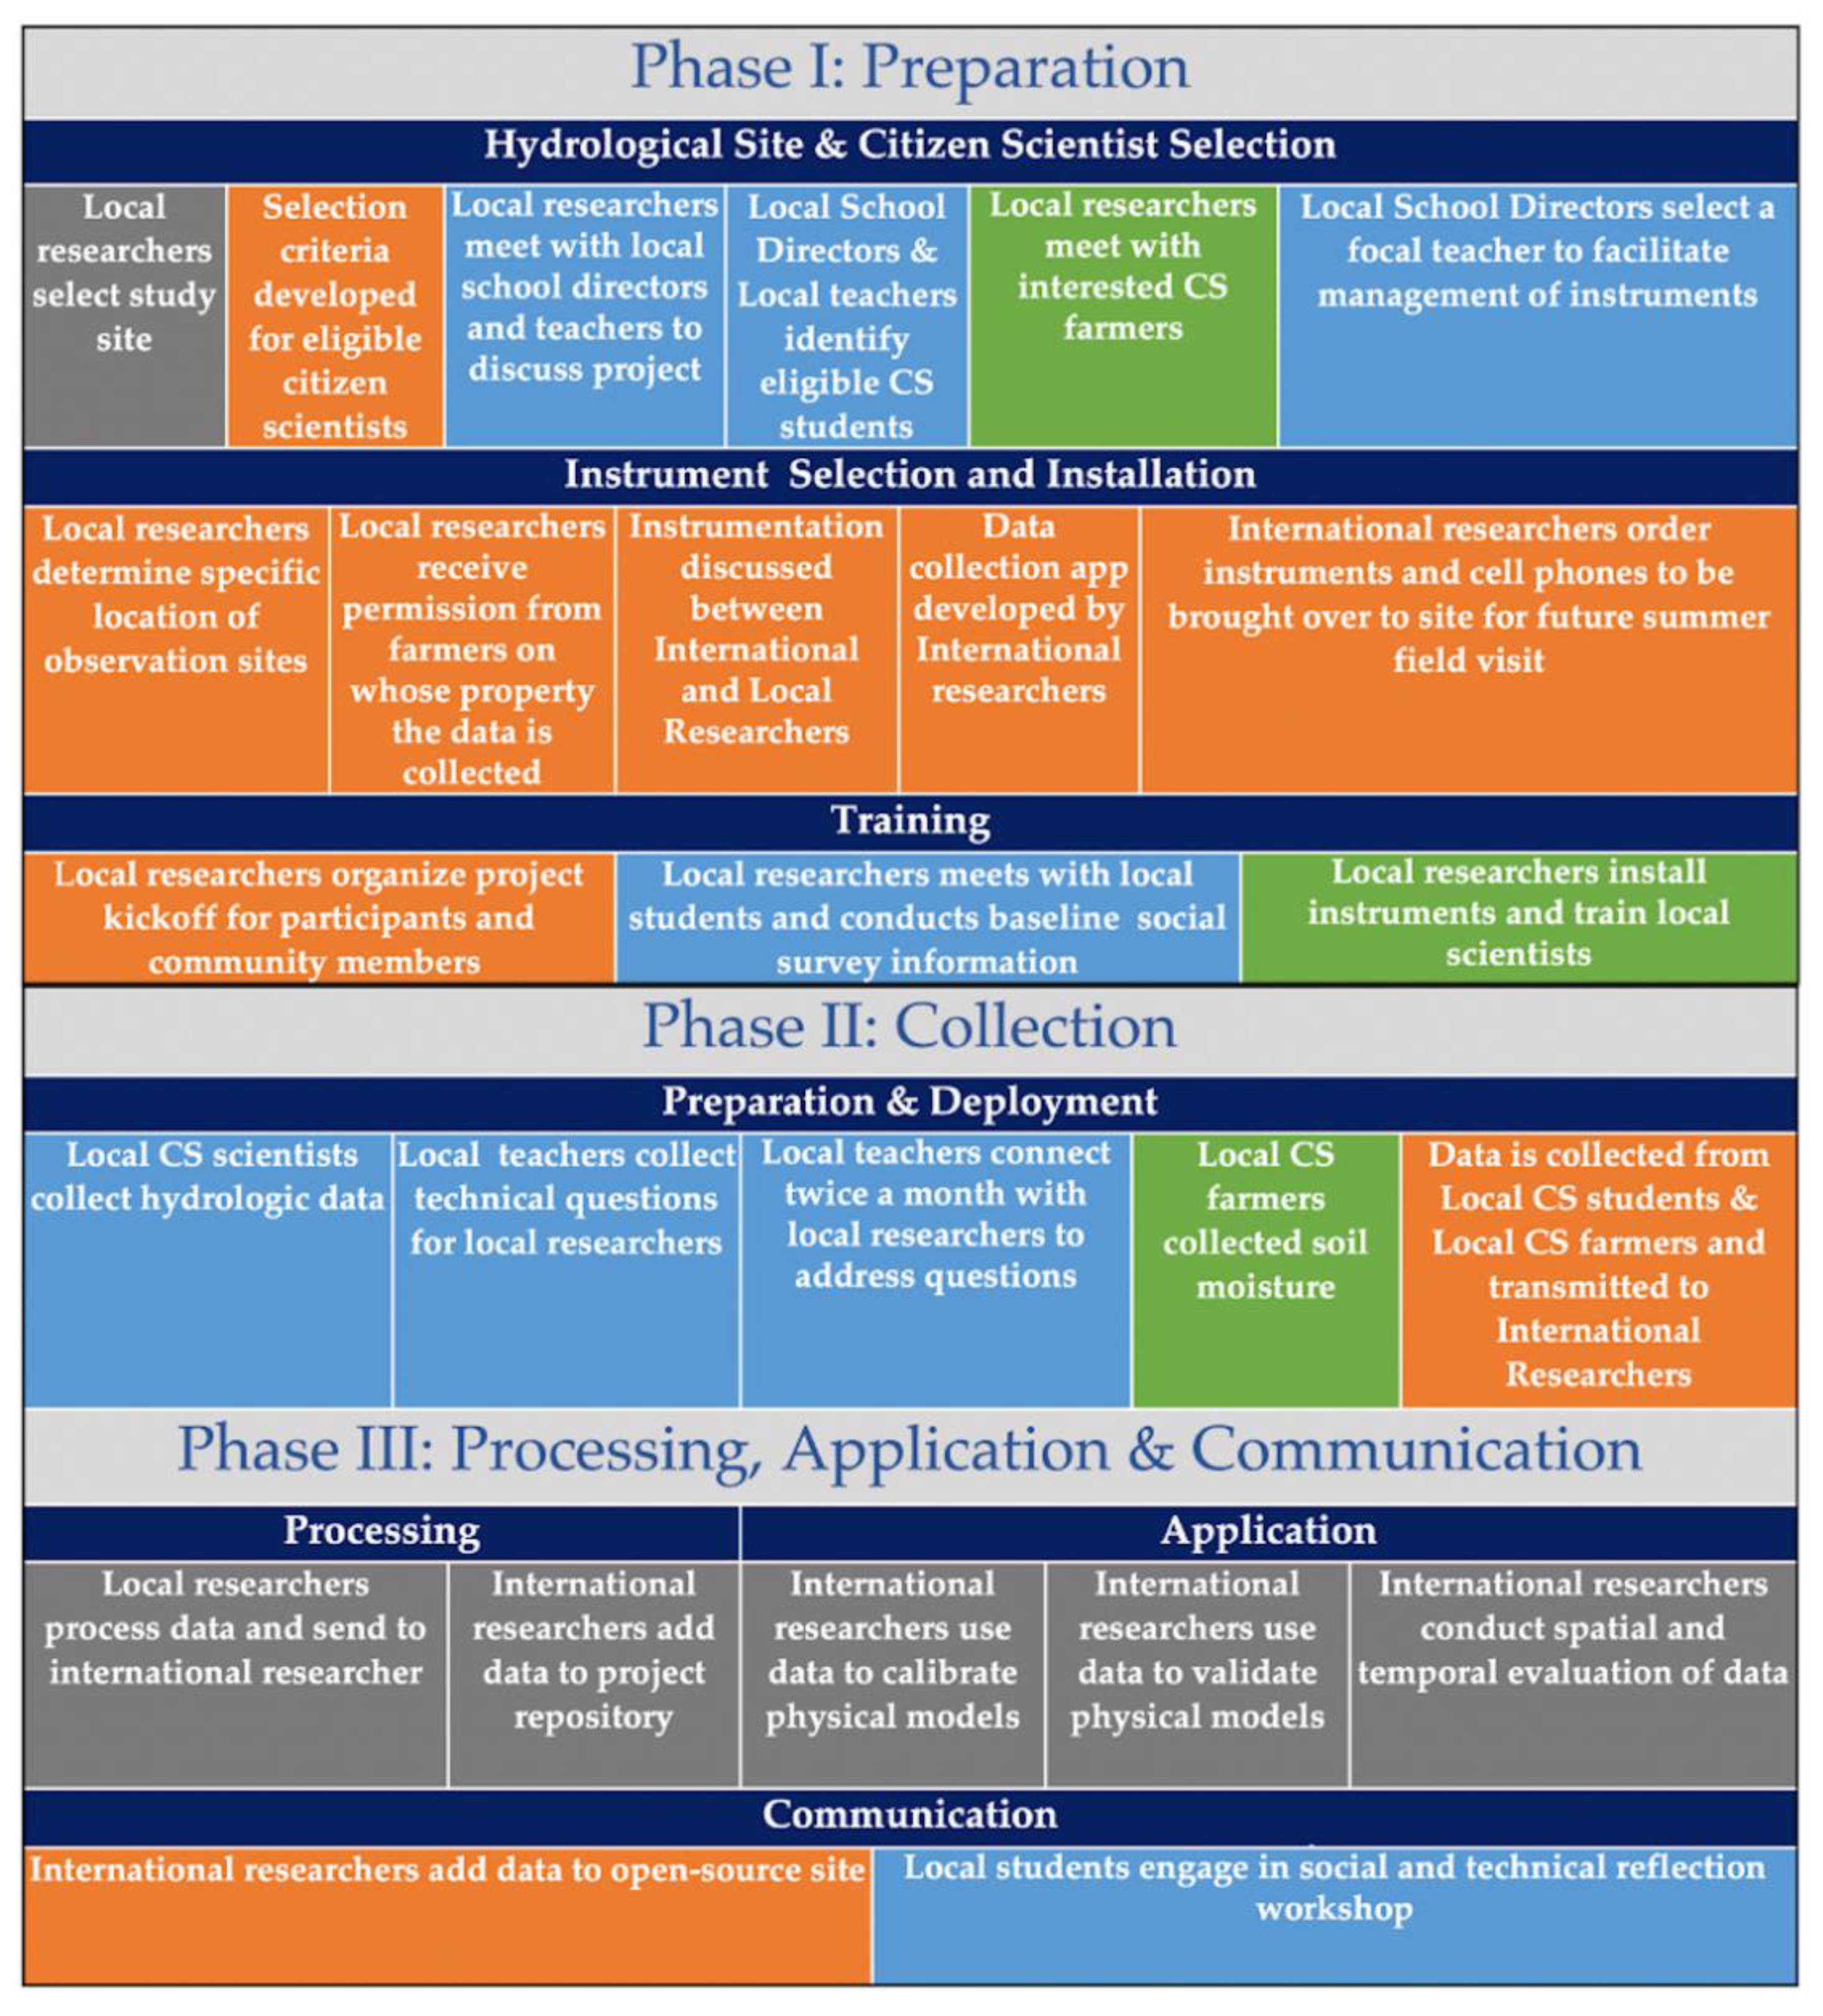
2.1. Overview of Citizen Science Initiative Design

The CSI was guided by the principle of achieving timely, quality, hydrologic data, which balanced the need for consistent data collection, while not being a time burden for the citizen scientists. These principles drove the process shown in Figure 1 that led us to our desired outcomes: valuable data and engaged citizen scientists.
A longstanding obstacle to using citizen science data for monitoring in national frameworks, and scientific endeavors in general, is related to questions of data quality [32,33], which is an issue that can be addressed, among other strategies, by having ample design and thorough training [34,35], which has been a data quality strategy demonstrated across hundreds of citizen science projects [36].
The most intuitive form of data quality validation is comparing citizen science datasets with those collected from scientists themselves or other established sources. These methods cannot always be applied, especially in LDCs; thus, we provide considerable explanation of our methodology in this paper, for describing our process as a robust procedure, as a form of data quality in the citizen science literature.
Our assessment covers an analysis of the data in terms of scientific applicability and the self-reported experience in the program of the high school student citizen scientists. We utilize the framework put forth by Jorden et al. [37], which evaluates the outcomes at the individual and programmatic levels, and we uniquely add how these outcomes align with respective SDG Goals and Targets. Each phase relied heavily on the open pathways of communication between international universities, citizen scientists, and BDU, which required significant initial investment and was a precursor to successful outcomes.
Choosing the specific locations shown in Figure 2 within the Amhara region, and the specific selection process for the study sites that followed, was carried out by BDU faculty. The CSI benefited from leveraging their established community connections and previous citizen science experience [38].

2.2. Citizen Science Initiative Process

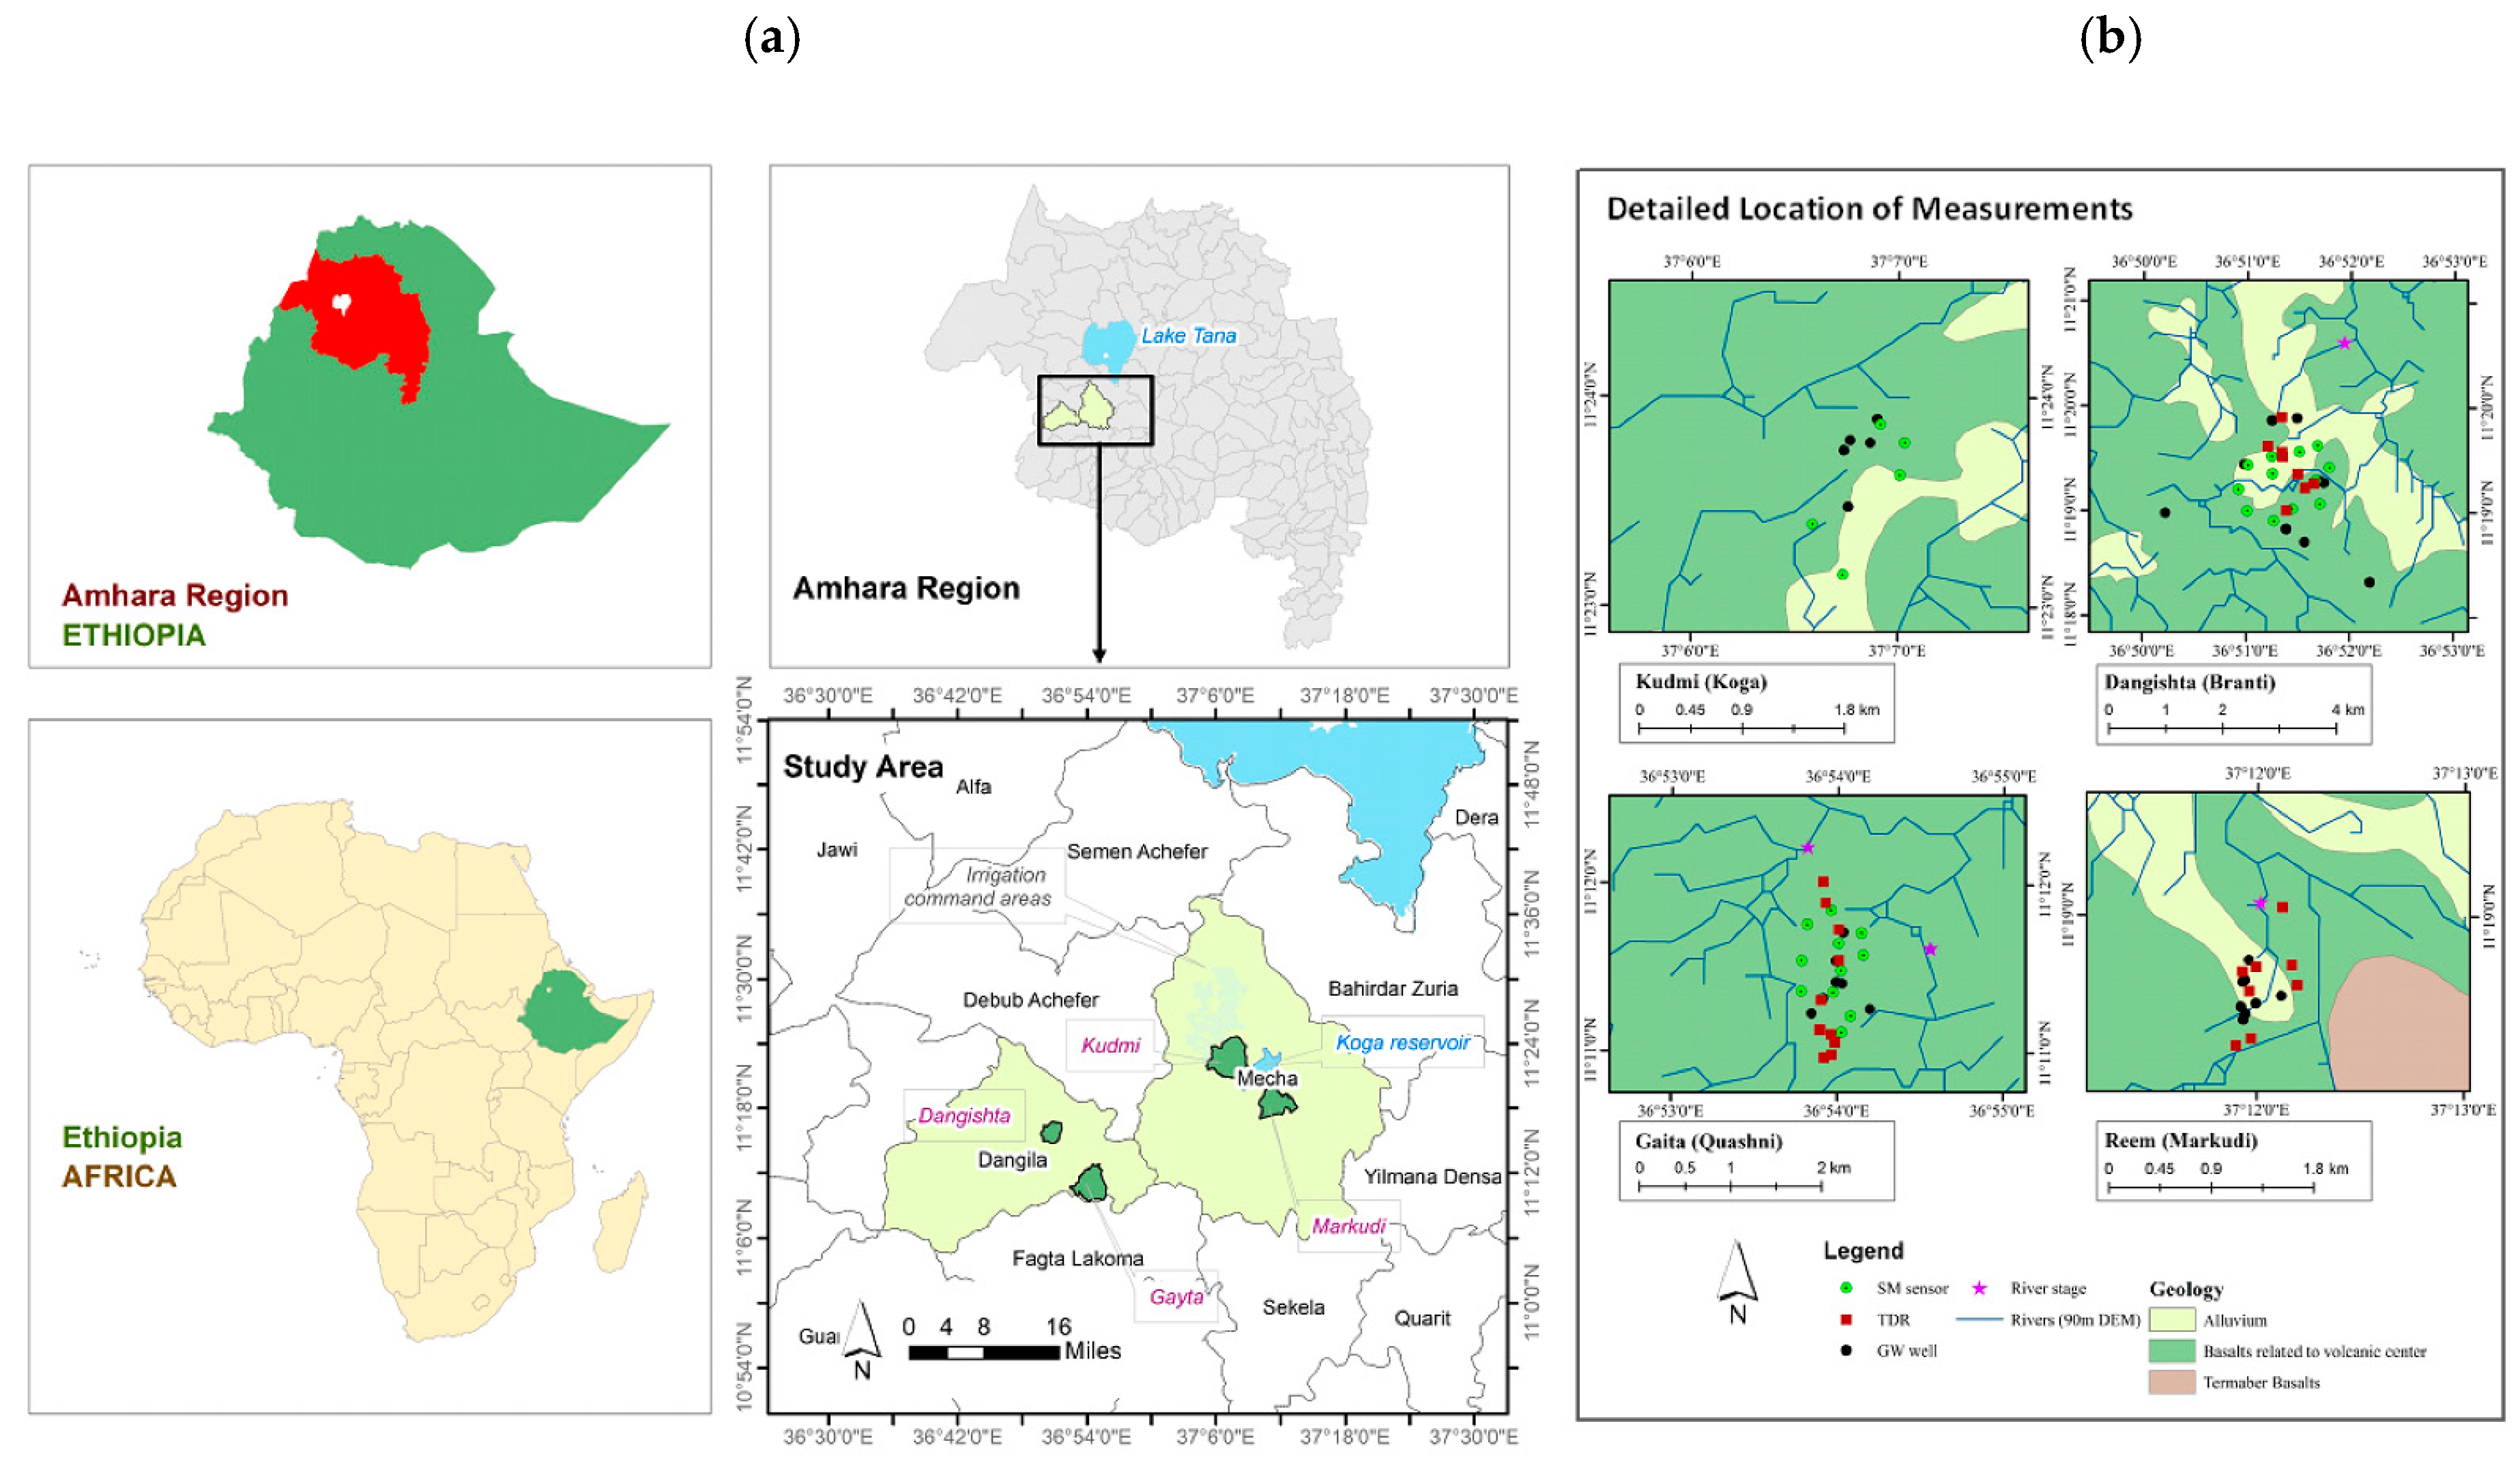
2.2.1. Selection of Data Collection Sites and Citizen Scientists

The data collection took place in the Amhara Region in the Upper Blue Nile Basin and covers ~170,000 km2 and, according to the recent 2017 census, has a population of ~21 million. Administratively, this area is divided into two zones, called provinces, and 104 districts, known as woredas. Farming includes a mix between crop production and livestock rearing at the household level, and it contributes to the main economic activity of subsistence agriculture. Due to the temporal and spatial variations in rainfall and the differing soil types, various crops can be produced, mainly including cereals, pulses, oil seeds, and horticulture crops. The intense vulnerability of crop production dependence on rainfall translates to only 62% of daily caloric needs being met, assuming a 2100 kCal baseline [39]. Practically, this translates to approximately 8 million people not meeting minimum daily caloric requirements.
Soil erosion and degradation harms the productivity immensely and is caused by torrential rains, increasing population pressure, grazing, and the extreme variations in topography. Annual average rainfall in this region amounts to 1194 mm and has a recorded standard deviation of 124 mm, with dry and wet years alternating [40]. A study conducted by the International Water Management Institute in 2004 concluded that only 5000 km2 of this area is considered to have viable potential for irrigation [41]. As of 2017, there has been no extensive study on the groundwater resource potential in Ethiopia, although there is an indicated substantial groundwater storage. The groundwater that is accessed is used for domestic use, however, and not irrigation [42].
Within this region, BDU faculty travelled to the four study areas to identify proposed locations for hydro-climatological data, i.e., rivers, fields, and wells that were an appropriate proximity to the high schools to avoid students being time-burdened by travelling to the sites. After the initial hydro-climatological site selection, the research team met with the director of the high school to discuss the significance and details of the CSI. At the end of the visit, the team requested that the director provide suggestions for students who met the criteria outlined in Table 1.
As part of the criteria, special attention was given to ensuring a gender-balance in student selection. Gender inequalities represented a serious challenge in the region. There is some improvement in schooling for girls and young women, so we were able to create a more equitable intervention for the school children. In these communities, the farming households are generally led by men, and we were not able to overcome this barrier to women’s participation. Overcoming gender inequalities is an important goal of the SDGs and part of best practices in research and development more broadly. Therefore, we sought to contribute to this effort through our intervention as well.
Farmers and their fields were identified and evaluated by BDU faculty for optimal locations to collect hydrologic measurements for the duration of the study. After initial conversations held by BDU, in total, there were six farmers, who were men, engaged for collecting soil moisture, and one farmer was engaged for collecting stream flow data in the Quashni location.

2.2.2. Citizen Science Training

Once the school director selected the students, a focal teacher was assigned who supervised the collection of the measurements and handled the instruments detailed in Section 2.2.3. The high schoolers were paired with a BDU engineering hydrology graduate student and were accompanied to their assigned watershed, where they received the training shown in Figure 3.
Farmers were trained by BDU and University of Connecticut graduate students to collect soil resistivity data, using low-cost sensors developed specifically for the CSI (see Section 2.2.4). After initial training, the pathway of communication was established by the graduate students to ensure that students could relay questions to them directly or to the focal teacher, should any issues arise. In the first month, the graduate students visited their students to oversee the collection process, two to three times per week, to monitor that the values were taken appropriately and to address questions by the students, teachers, and farmers.
Seven students collected data for the CSI duration, as they were in 9th grade during the beginning, and two students left the study after two years once they passed a national exam and were enrolled in preparatory studies, resulting in them attending schools outside of the permitted proximity to the collection site. Two new students joined in their place and underwent the same training.

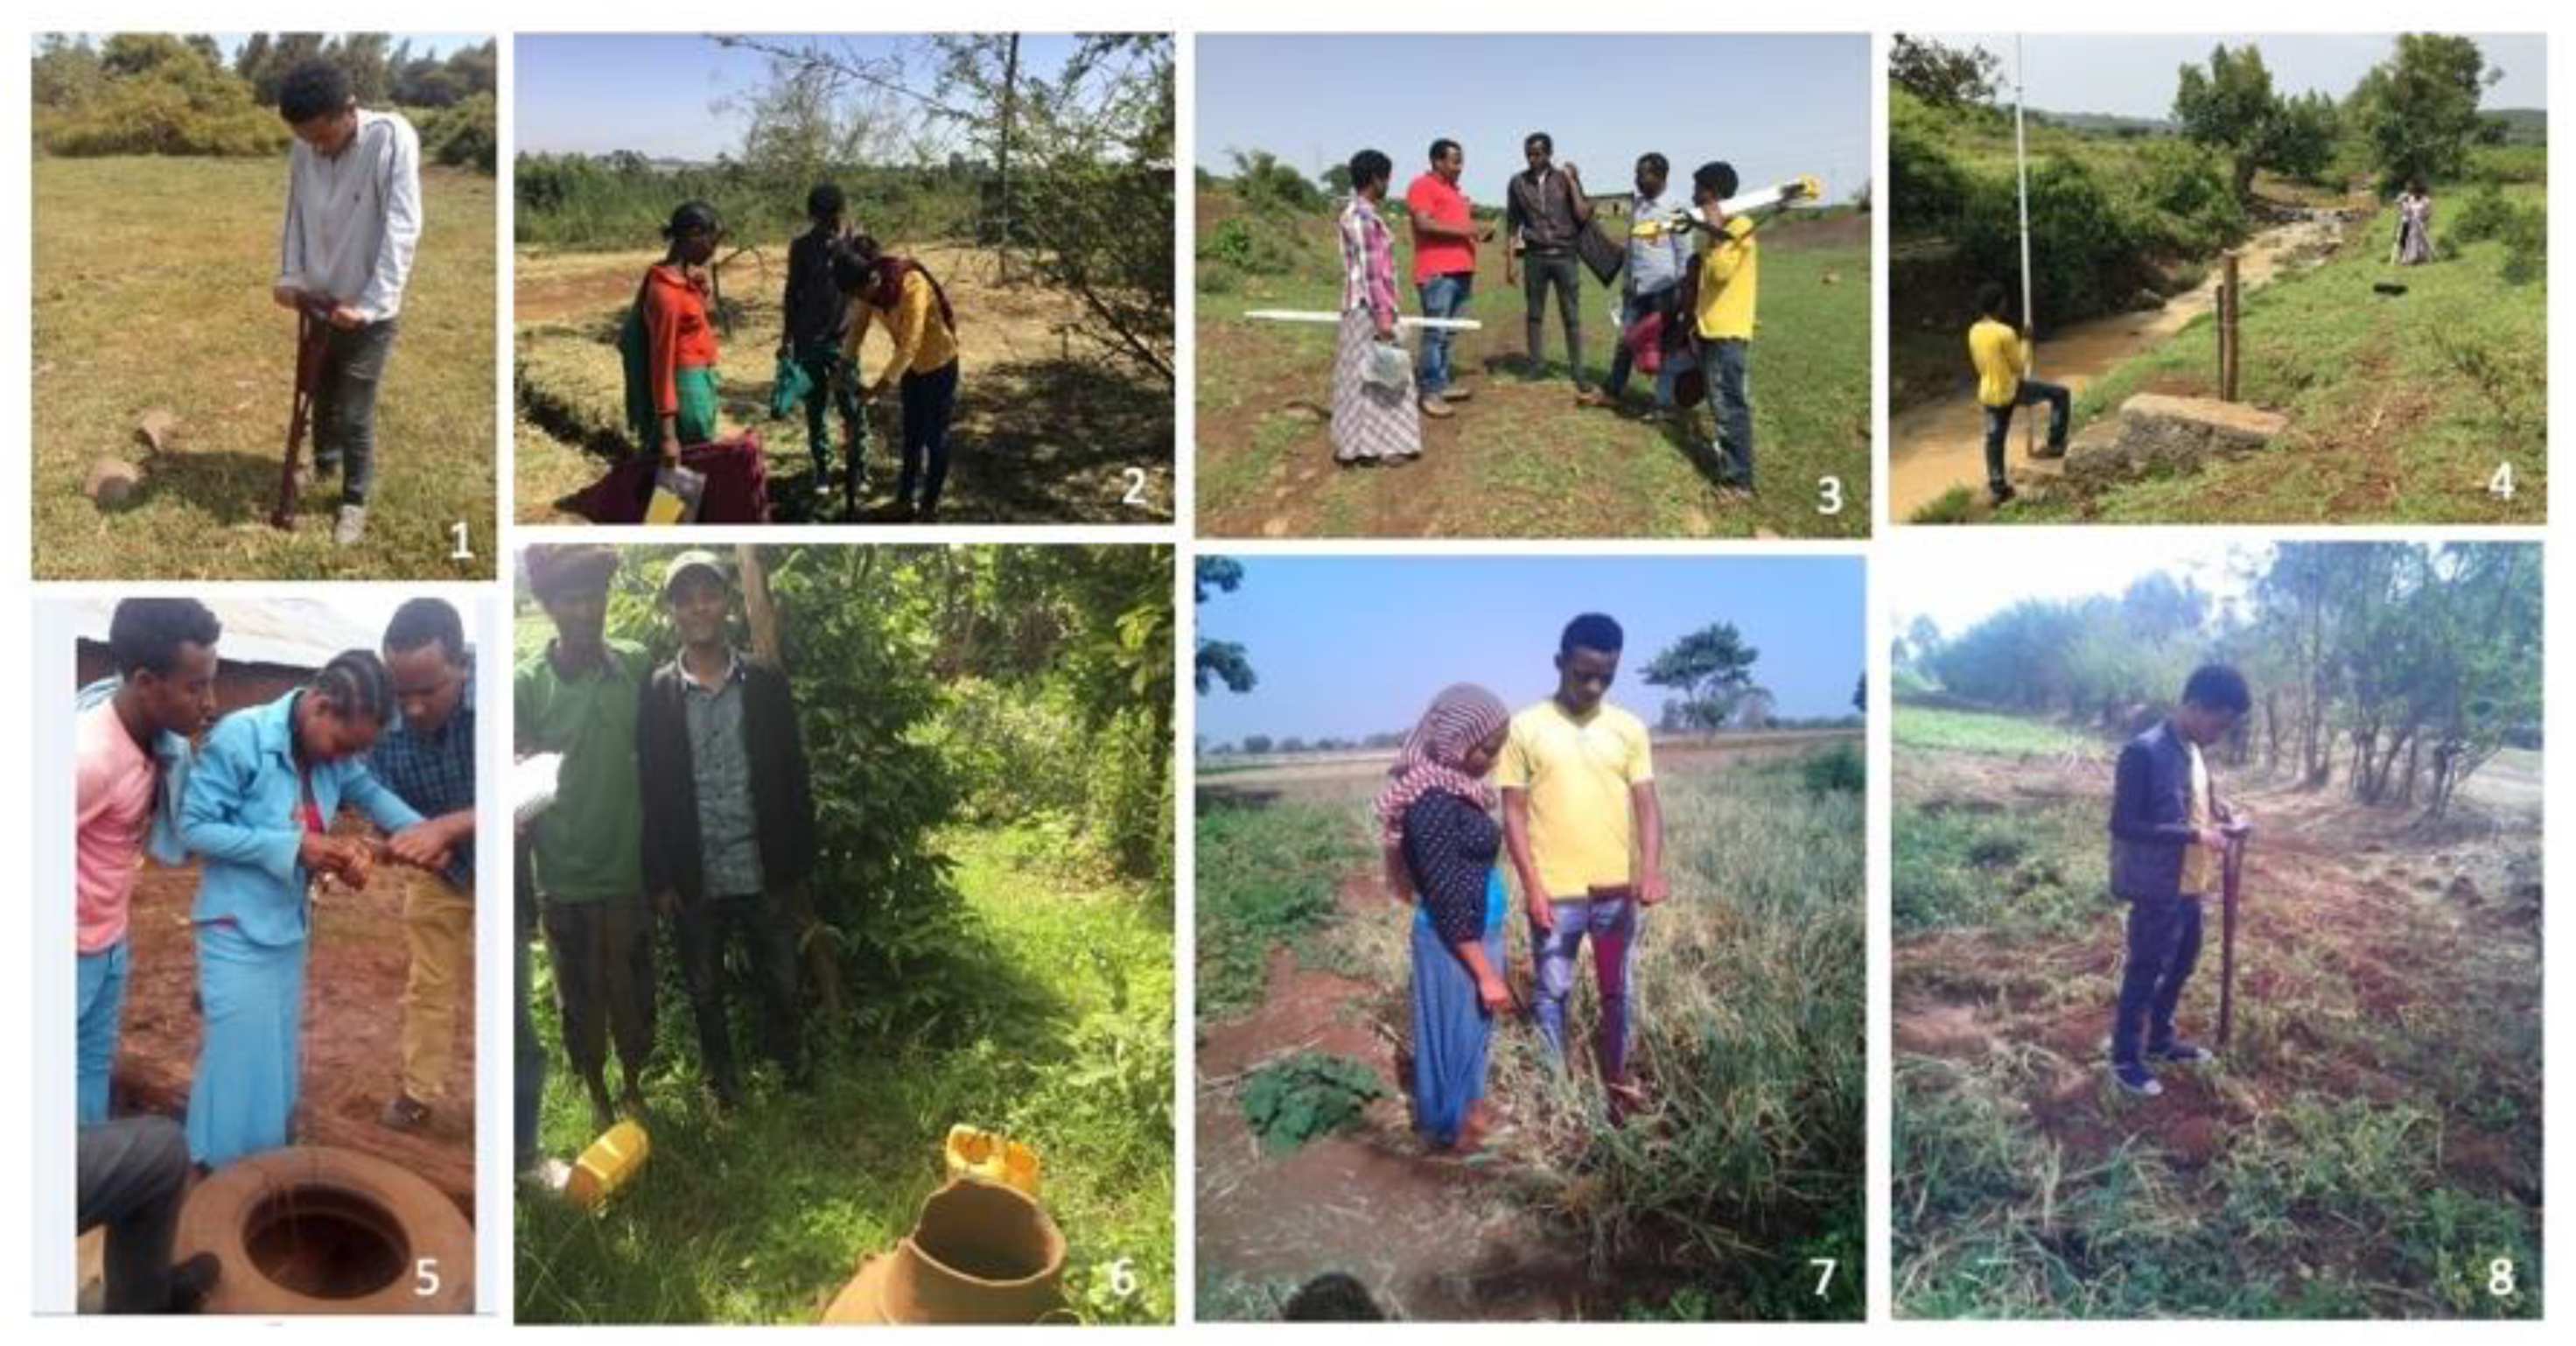
2.2.3. Data Collection

Soil moisture, soil resistivity, groundwater depth, and river stage were the variables selected to be collected since they supported the crop and groundwater models developed to yield the seasonal forecast of the NSF PIRE project. The river stage is defined as the height of the water’s surface above a gage datum at the given river location, as determined by the BDU faculty before citizen scientist training. High school students collected daily measurements of river stage, at 6:00 a.m. during school days, and weekly measurements of well depth and soil moisture, at 10:00 a.m. on the weekends, using equipment provided by researchers. Temporal consistency was emphasized, as river stage and the other variables can vary by the hour. Students collected the data on pen and paper using a form created by the graduate students. Farmers measured soil resistivity from a flat thin mm-sized sensor every four days. The soil resistivity data was stored electronically on the device and downloaded by the graduate students. The data from each site was collected at the end of each month by BDU graduate students and shared by e-mail every one to three months, depending on various factors, such as internet connectivity or political unrest.
Data collection by the high school students has been nearly continuous since August 2017, with specific months omitted due to logistics identified in the footnotes of Table 2. Each site used the same instrument, and the participants received the same training. The instrument for river stage was the Dewalt DW096PK 26X Auto Optical Level Kit Tripod; for soil moisture, the instrument was the FieldScout TDR 300 Soil Moisture Meter; for depth to groundwater table (GWT), the Model 102M Mini Water Level Meter P4/N2/80ft was used; for soil resistivity, a sensor was used that was developed specifically for our sites.
In Koga, no river stage data was collected, since it is an irrigated site with no natural rivers present. Our analysis includes Markudi, Koga, and Quashni, as these demonstrated hydrological patterns more strongly than Branti.

2.2.4. Developing a Soil Moisture Measuring Solution

Soil moisture monitoring in LDCs needs to balance easy maintenance and low-cost while maintaining measurement accuracy. Since the cost of technologies in Ethiopia can be inhibitive, the team designed a sensor that is cost-effective, travels well, and can be easily maintained by the farmers [44]. Over the four sites, a total of 84 sensors were deployed at 10 mm and 40 mm depths, and their efficacy and value is explored in Section 3.1.1.

2.2.5. Social Scientific Analysis and Interview Methods

We began the CSI with a plan describing the people likely to be involved and their responsibilities, but rather than assuming a priori that this plan was fully carried out, we evaluated the social network of the citizen science initiative by interviewing participants. Interviews were conducted over email in English. In interviews, we probed to identify the actors who were involved, the mode and scale of their relationship with other actors, and the specific steps that they took. The actors identified in the process included: local researchers (including faculty and graduate students), international researchers, local citizen scientist farmers, local citizen scientist students, local school directors, and local school teachers.
We analyzed this data to gain both a broad view of the social network and more targeted details about capacity type built into the connection, the scale, and the alignment with the SDG targets. To do this, we classified each step as either social or technical capacity, at either the local or global scale. We labeled a step technical capacity building if the connection yielded new technical knowledge (e.g., training, devices) for the actor. We labeled a step social capacity building when it included social discourse between actors unrelated to technical training that was related to the CSI. We evaluated the scale of the connection between actors as local or global, which leverages existing SDG concepts and vernacular. For example, discussions between the local high school director and a local researcher would yield a Local-Local-Social connection, designated as Local-Social, whereas a discussion between a local citizen scientist farmer and an international researcher for instrument training yields a Local-International-Technical connection, designated as International-Technical. Once we classified the connections through this analysis, we evaluated each connection to identify any relevant SDG goals and target alignments, based on connection type, scale, and capacity. Evaluating the CSI in this manner, as seen in Figure 4, allowed us to gain a more systematic evaluation of the network. The current typologies in the citizen science literature differentiate, primarily, by project type, goal, and level of participation, but they have not been thoroughly evaluated in terms of actors involved [45], the scale of the connection, and, ultimately, the SDG.
Regarding the interview, the questions and procedure were approved through the Institutional Review Board and were developed to explore how participating in the scientific project may influence the high school students’ subjectivities, relationships, and/or trajectories. We assessed individual outcomes by interviews conducted with the nine students near the beginning of their involvement, followed by interviews after around three years of participation.
The first interview of the nine participants was conducted by the members of the network based at BDU. The participants—students from three high schools in the area—were asked about their perceptions towards citizen science, prior experiences, and broader perceptions of environmental issues. No citizen scientists had direct prior experience, except for one student who had experience as a data collector focusing on malaria. The students ranged from 17 to 20 years old; three were women, and six were men.
The second interview took place at the Impact Day workshop and was delivered in students’ native language in written format. The local researchers were present to address questions and clarify interview details. The responses were collected and translated to English, where they were evaluated for thematic similarities and differences across the students’ answers.

2.2.6. Assessment of Outcomes

The final step of the CSI was an assessment of outcomes evaluated through the SDG framework. As stated previously, one main objective of citizen science is high-quality data. Thus, we analyzed the scientific applicability of the hydrologic data collected by the students and farmers, which we will cover in more detail in the technical analysis (Section 3.1), but we also wanted to assess the individual perspectives of the high school students to understand their perception of their participation in the CSI (discussed in Section 3.2).
Special attention was given towards capturing the CSI experience by the citizen scientists, an important element considering that Ethiopia’s Ten Year Plan, and the United Nations, for the SDGs, have identified that investments in engaging youth are vital [46,47], and we wanted to give a platform to their encountered experience with the scientific process. Lastly, as a performance measure, we evaluate the entire process in terms of the individual and programmatic-level outcomes, and we offer our lessons learned to progress the citizen science literature for low-income countries in the SDG context.

3. Results

A recent comprehensive literature review identified that citizen science has benefits that extend past the contribution of indicator-specific data to the SDGs, including its potential to indicate areas for growth in the SDG framework [31]. Our analysis is an exploration of areas for growth, within the existing framework, by mapping the outcomes of the CSI, which is assessed in two dimensions: namely, from their technical contribution and from a social standpoint.

3.1. Technical Results: Hydrological Datasets

3.1.1. Evaluation of the Novel Soil Moisture Sensors for Farm-Level Monitoring

The seasonal box plot in Figure 5 shows the trend of soil moisture and soil resistivity variation on the annual scale. The data was normalized for ease of interpretation, given that soil moisture units were in percentages (%), while soil resistivity was in ohms (Ω).
The y-axis in Figure 5 indicates a component-wise scaling method to unit variances, centered at the mean of each dataset, with unit 1 after data normalization. Both soil resistivity and soil moisture data are collected within a three-year period (2018–2020) to reflect the seasonal periodicity. Missing values in the dataset, caused by weather limitations for the farmers, were addressed using a linear interpolation technique in the data preprocessing. The variation of soil resistivity and soil moisture trends correlate as anticipated. The increase in soil moisture associates with lower resistivity readings, and lower soil moisture readings associate with higher resistivity. The boxplot, on a seasonal basis, narrates the average values in each season among the three-year data, specifying relatively high soil moisture in spring and summer and low moisture in fall and winter, which might be related with local climate, weather variation, and the arrangement of agriculture activities.

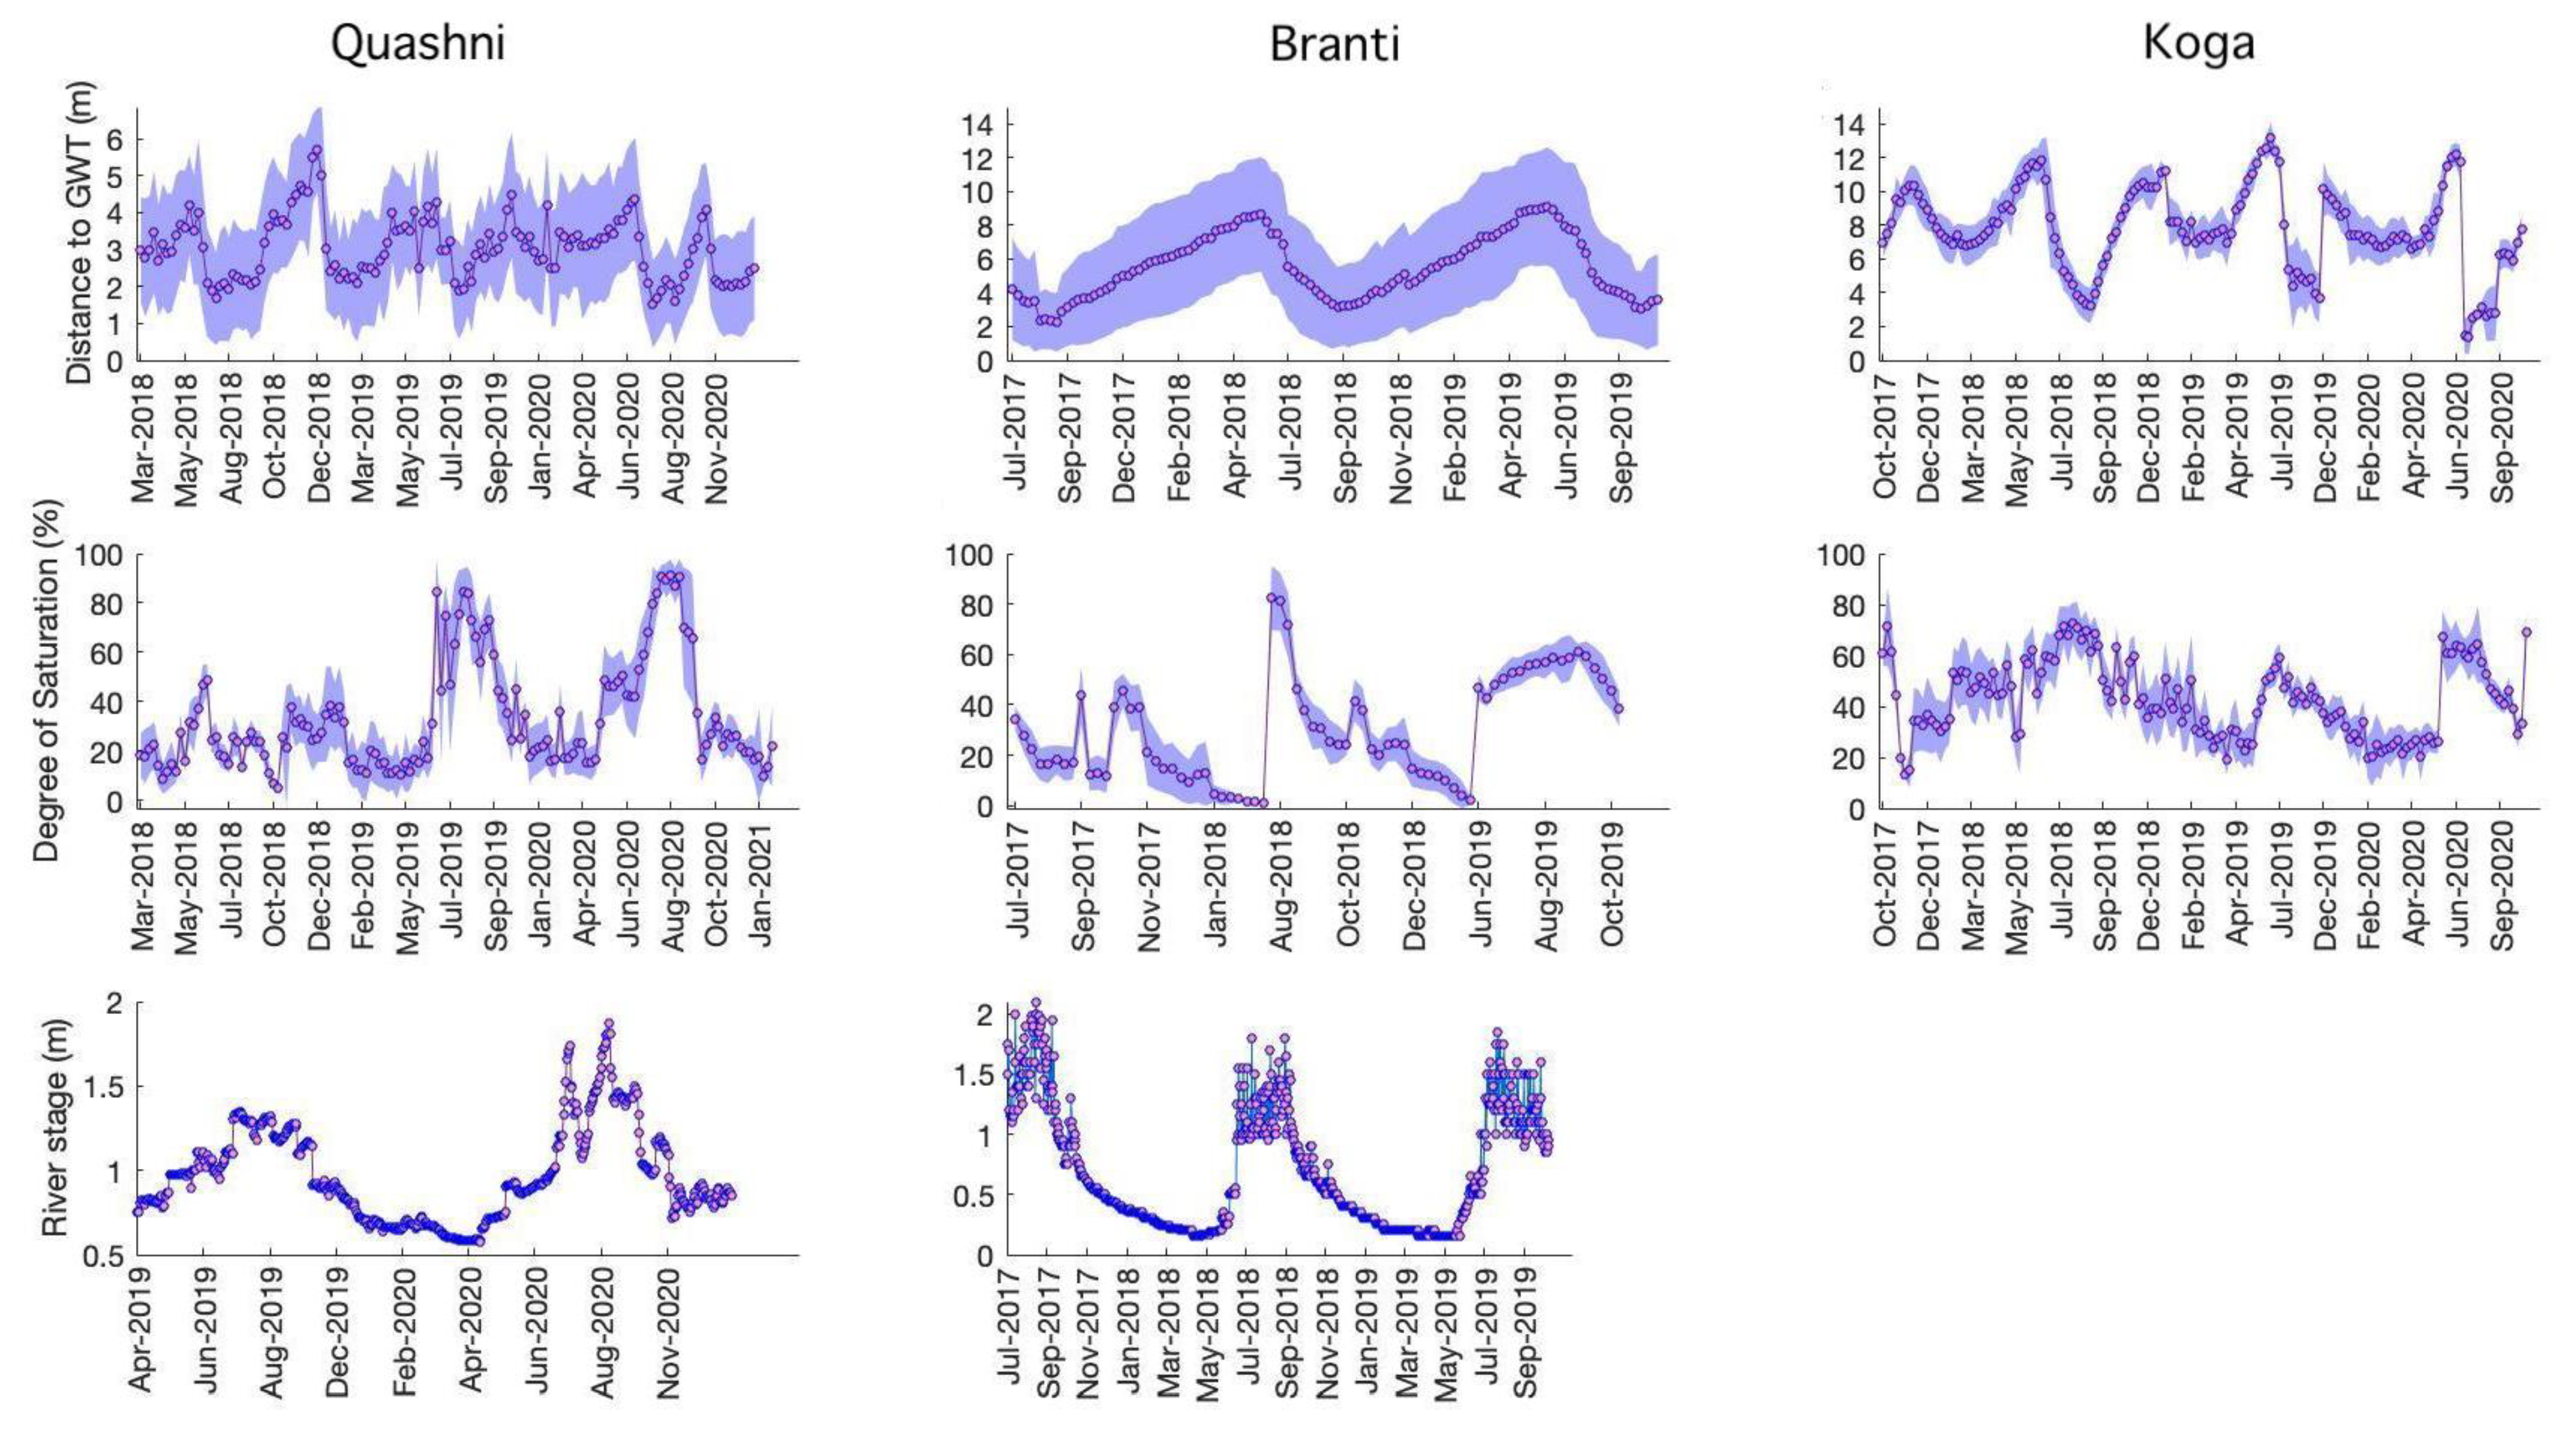
3.1.2. Assessing Hydrological Characteristics

The data reveals the underlying hydrological characteristics for each site; seasonal fluctuations, as governed by the June, July, August, September (JJAS) precipitation in all sites, as well as the dry season irrigation for Koga and Quashni areas, are visible in the groundwater table (GWT, in m), soil saturation (%), and river stage (m) estimates. In addition to the spatial mean of data collected at all sites from one location (marked by purple dots), the figure also shows spatial variability captured at all sites (marked by the shaded area, which is equivalent to ± 1   SD of the collected estimates). Overall, the figure highlights less fluctuations in Branti, where irrigation is not applied. The spatial variability for Quashni and Branti is relatively higher for the GWT estimates, as compared to Koga. This may be attributed to the large number of site locations, sparsely covering a larger topographic region, in Quashni and Branti. The different variables, collected and monitored in the three sites under the CSI, are summarized in Figure 6.

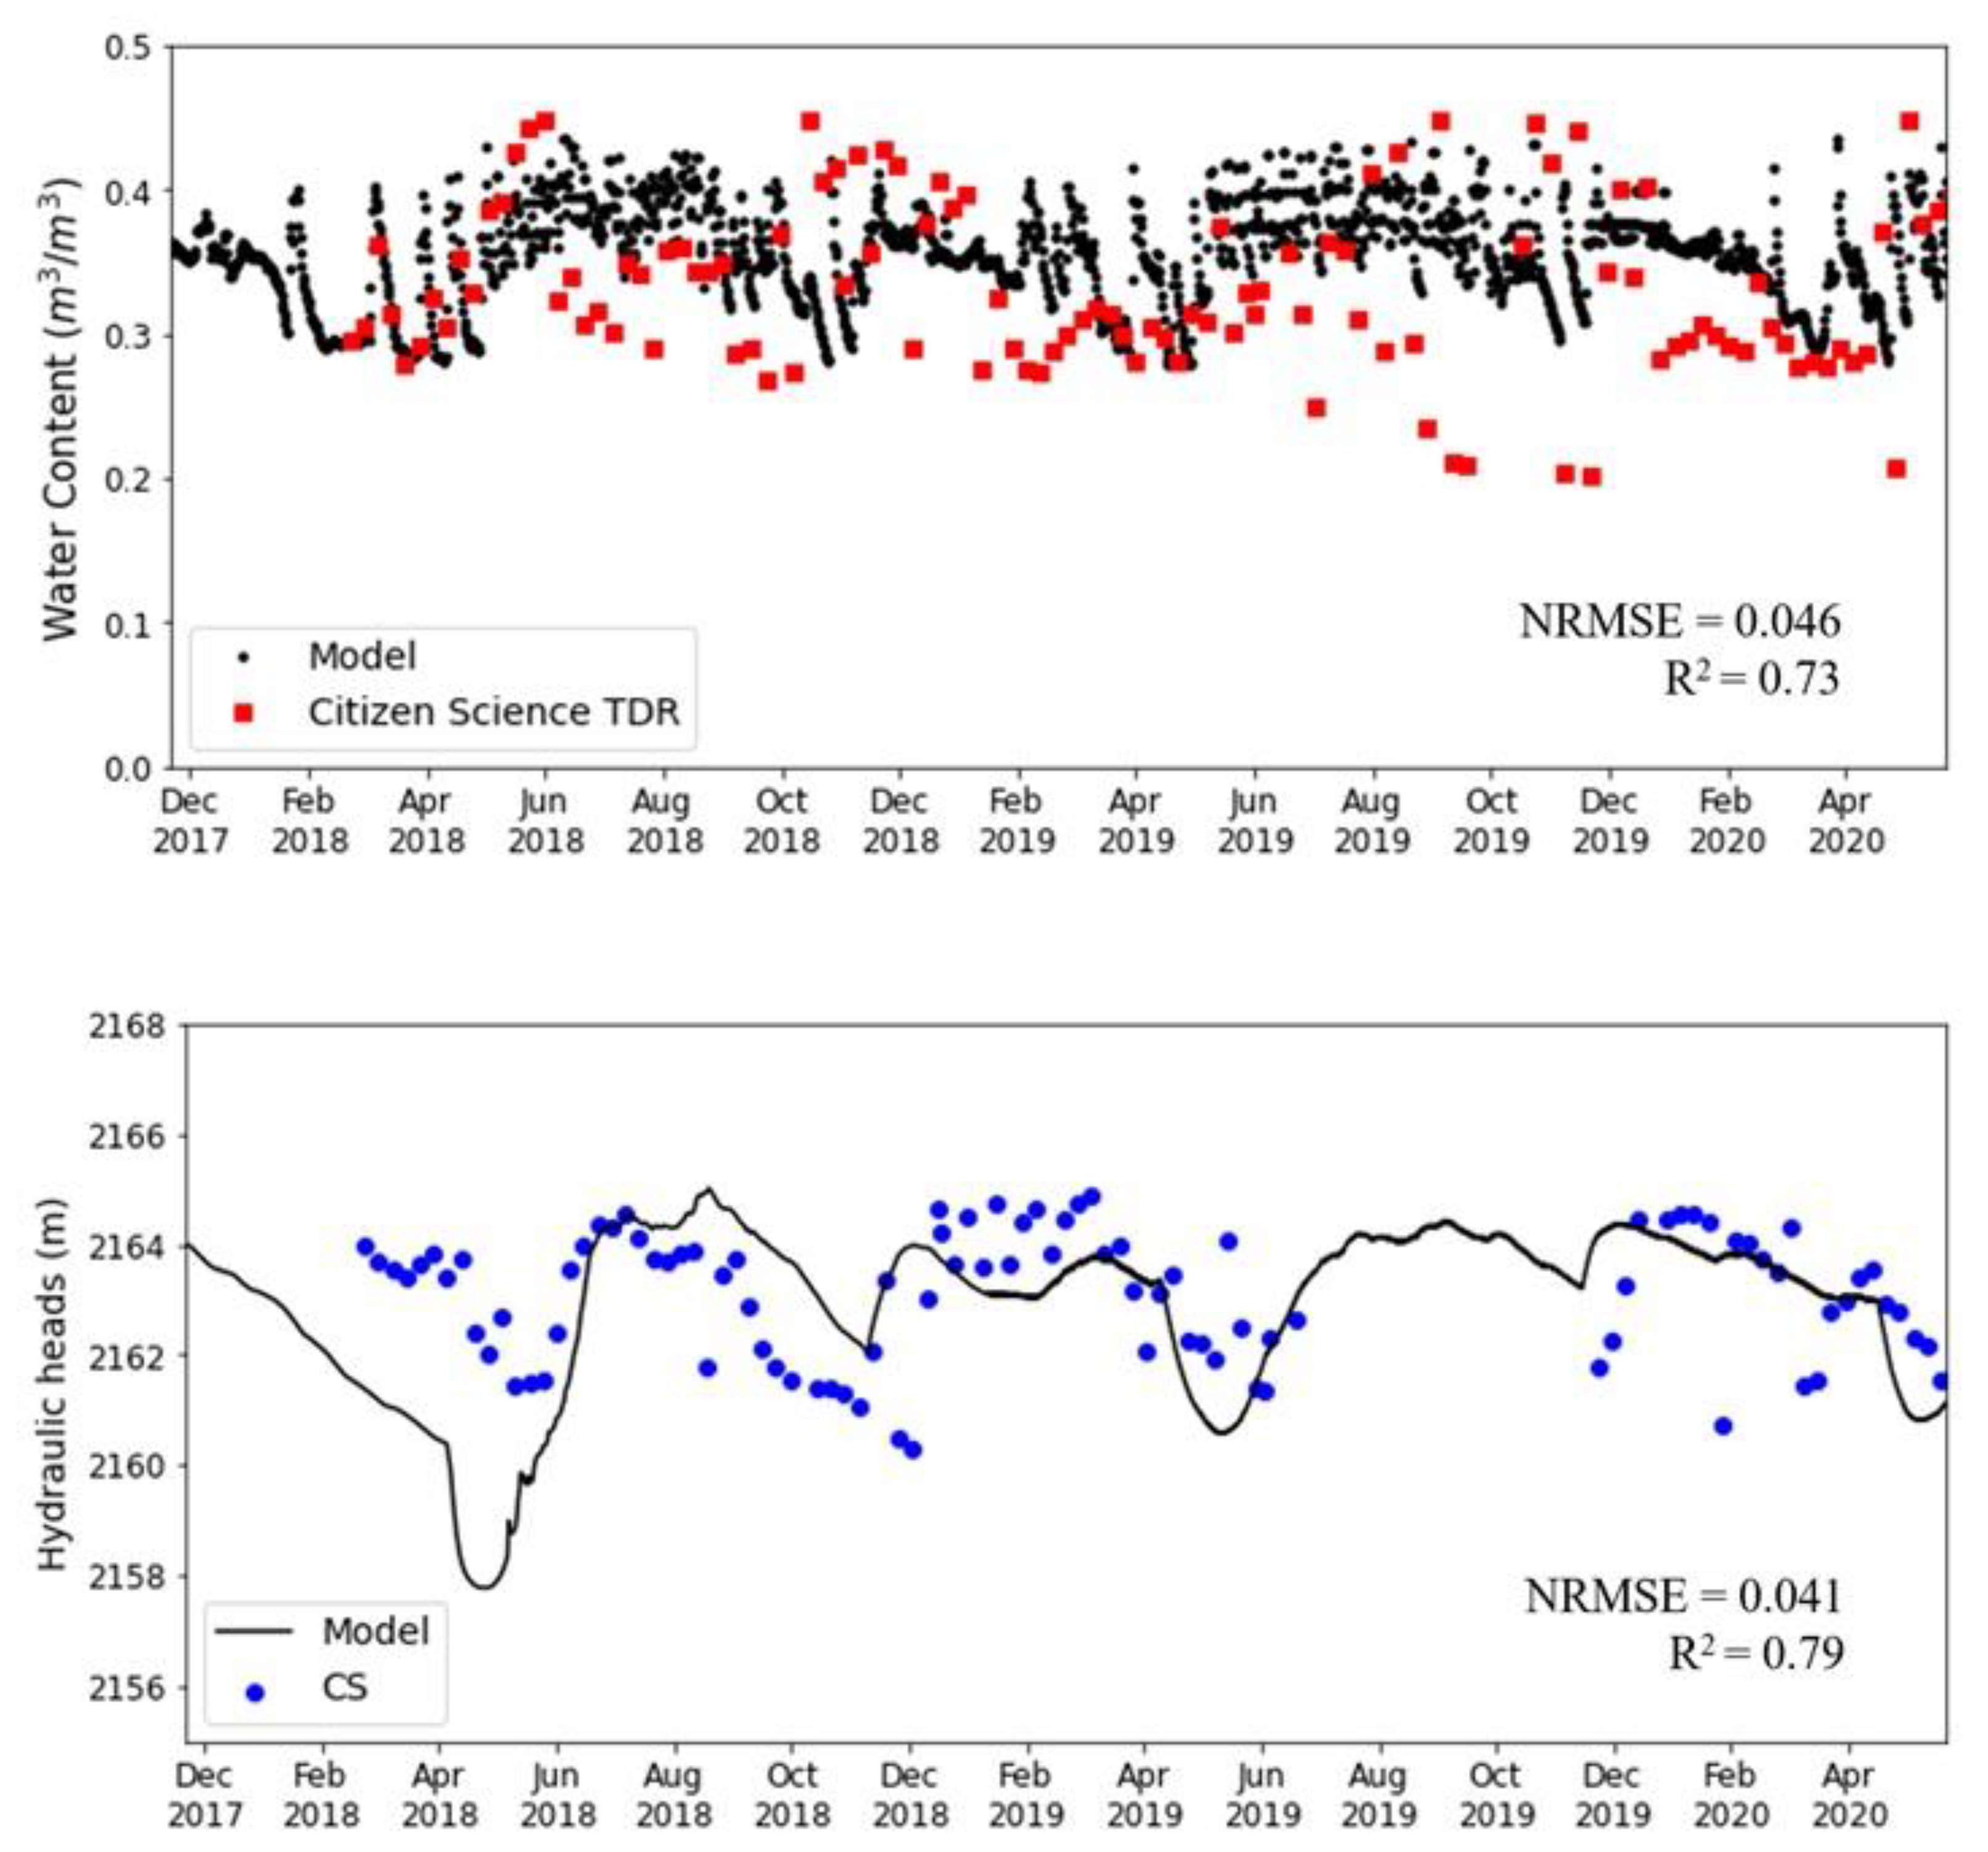
3.1.3. Application of CSI in Evaluating Physical Models

One of the major uses of the CSI data was evaluating the physical models used to develop forecasts, as part of the NSF PIRE project. As part of the NSF PIRE project research, we calibrated a hydrological model using CREST, a set of groundwater models using Modflow-NWT, and a crop model using DSSAT. The CSI data includes extensive monitoring of groundwater wells, as well as soil moisture, so we used the data to calibrate local groundwater models (using both GWT and soil moisture data), as well as validate the regional groundwater models (using GWT only). Procedures and results on such evaluations are available, in detail, in at Khadim et al. [48]. In Figure 7, we show how the CSI data (distance to GWT and soil moisture) was recently used to calibrate the local groundwater model at Quashni. The NRMSE values obtained in both cases were below 0.05. Except for some extremely dry values in 2019, the models were consistent with observations. It is noteworthy that the CSI data exhibits more variability, which could be a representation of locally significant effects beyond the scope of physical models, due to the limited spatial resolution (100 m for the Quashni model shown in Figure 7). Nevertheless, the CSI data has proven to be helpful to understand and justify model behaviors in data-scarce areas that have otherwise no means of validation.

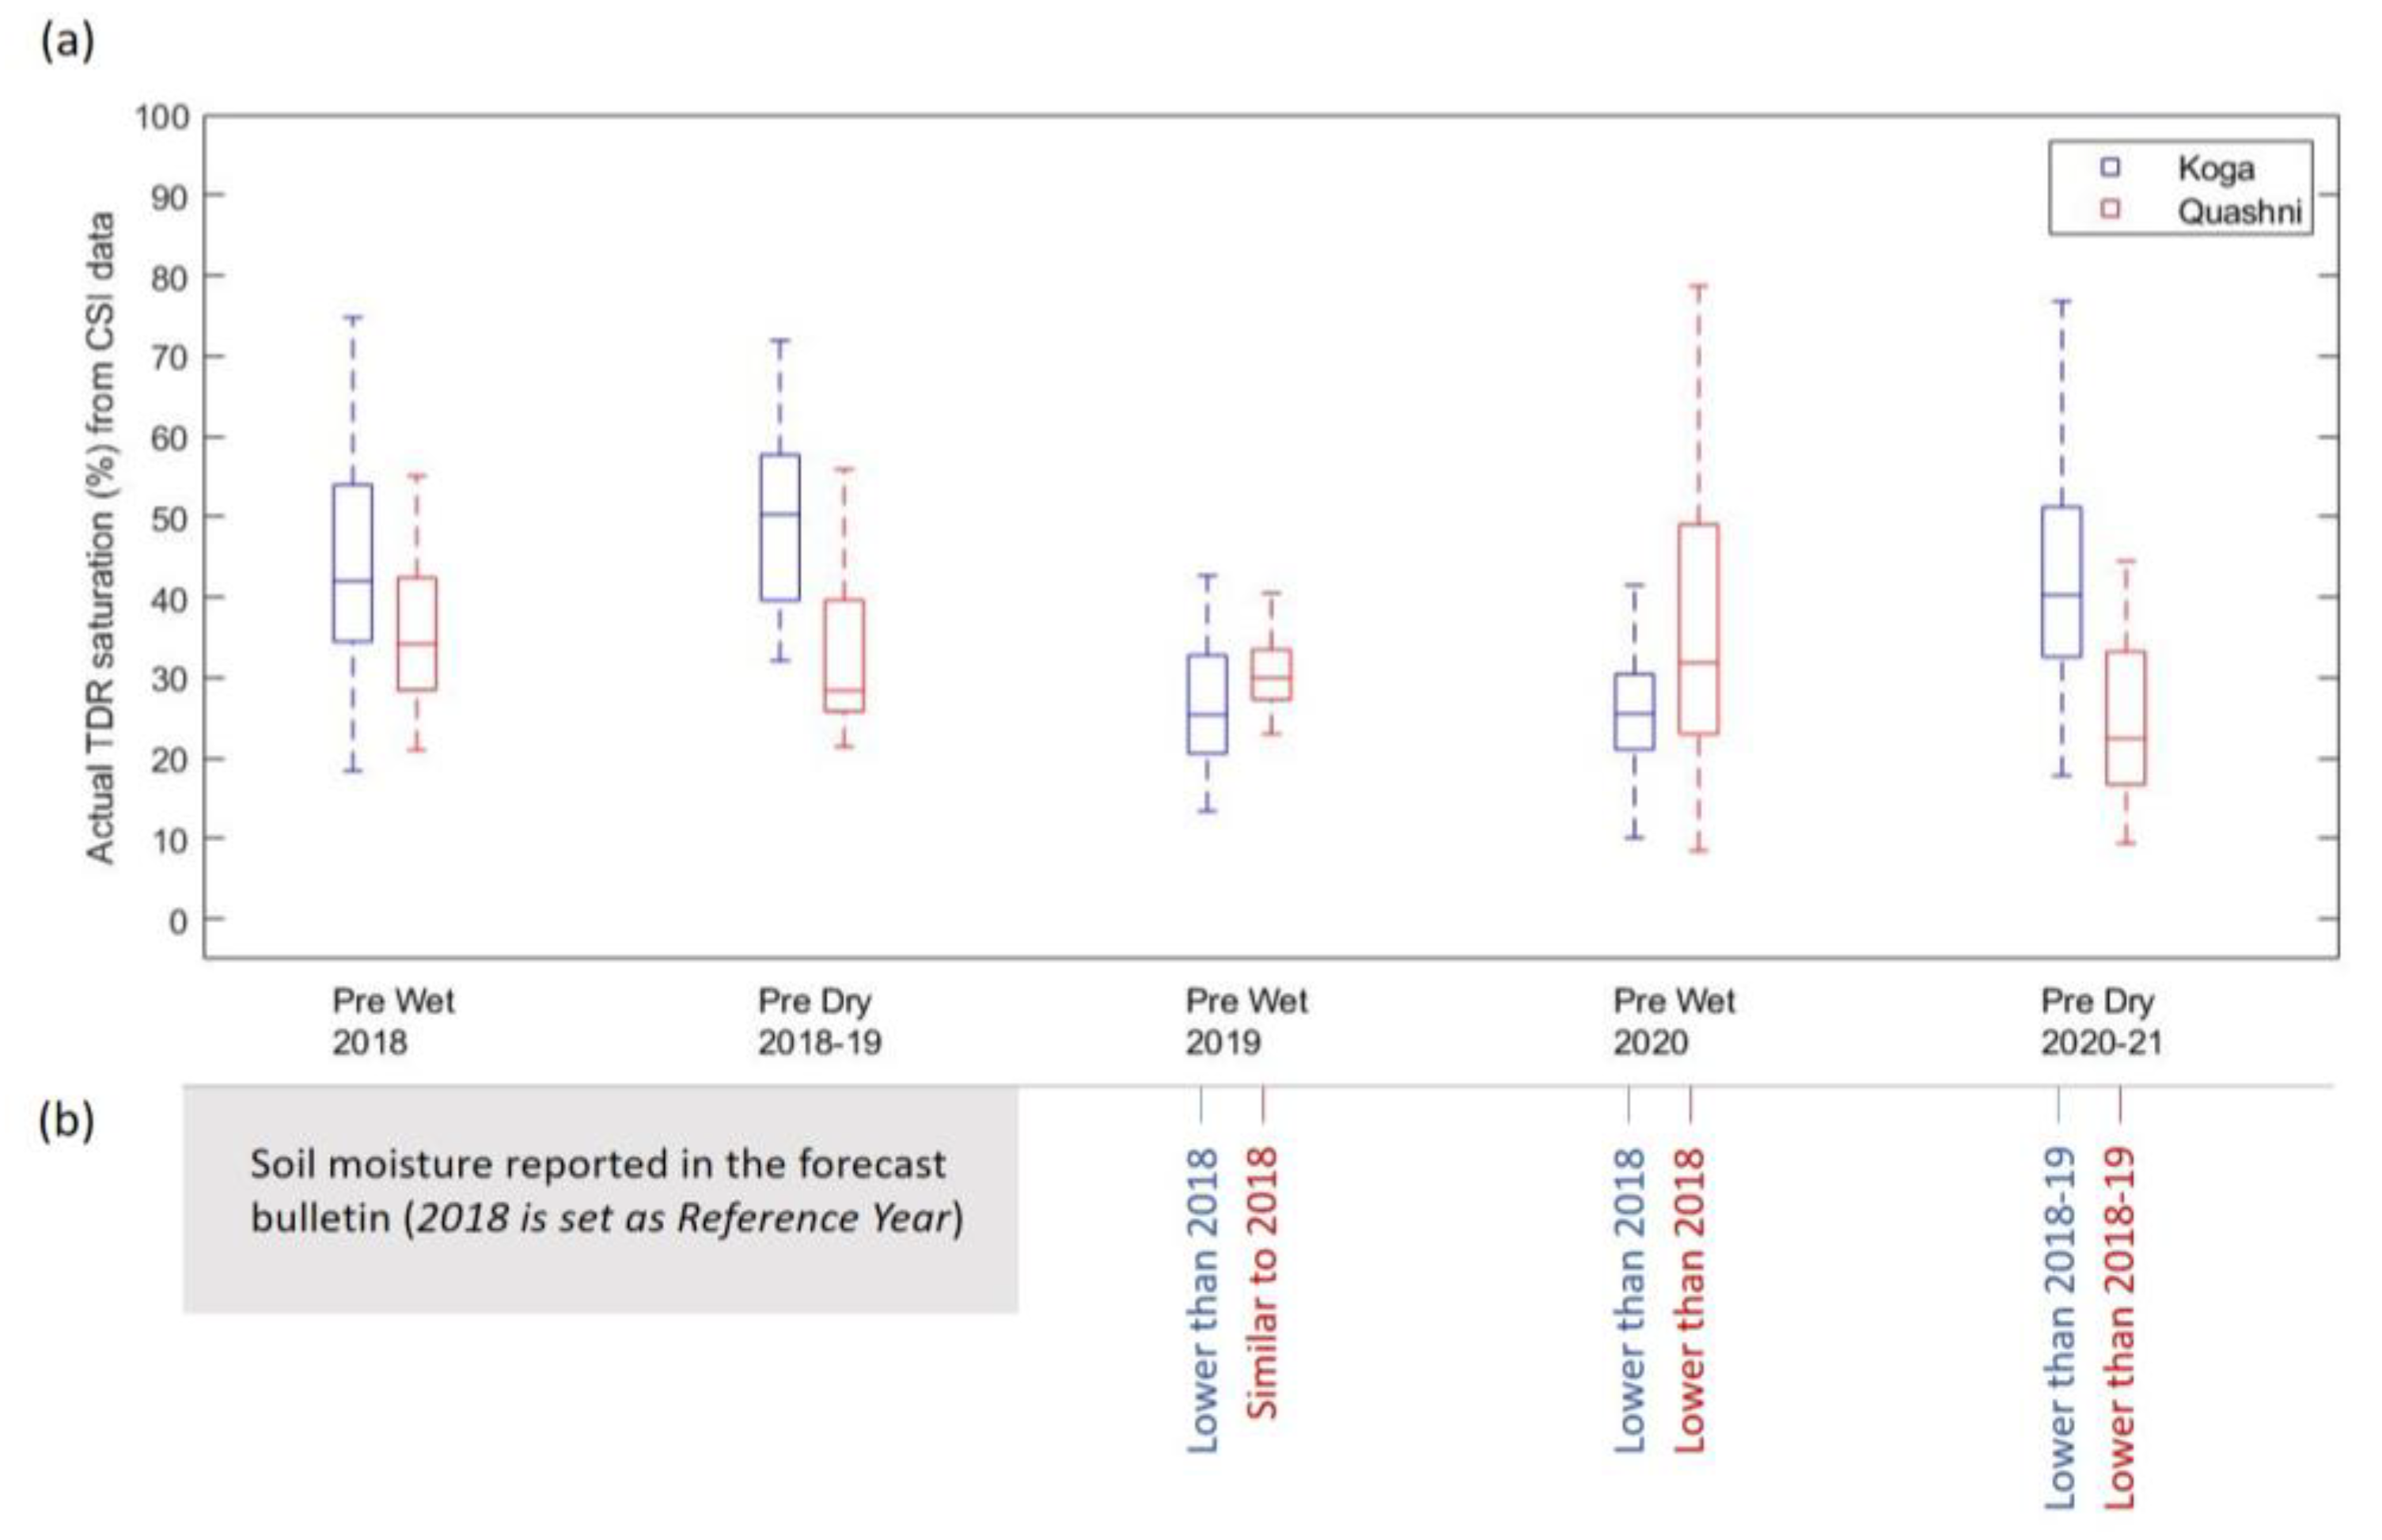
3.1.4. Comparing Citizen Science Data to the Seasonal Forecast

We used the CSI data to rationalize the seasonal forecasts at Koga and Quashni (due to data limitations, the other sites could not be tested). As part of the NSF PIRE project, we provide seasonal forecasts, in the form of forecast bulletins, ahead of each dry and wet season. Figure 8 shows the summary of soil moisture values measured through the CSI for different pre-dry (e.g., the month of October, preceding the dry season) and pre-wet (20 April to 10 May, a ten-day spell selected before the JJAS precipitation onset) seasons. The pre-season spells were chosen during the actual forecast bulletin dissemination, typically as Ethiopian farmers considered the initial soil wetness information in their key crop-related decision-making (e.g., when to irrigate, when to plant seeds, etc.) The seasonal forecasts started in the wet season of 2019, where soil moisture was reported, as compared to last year (2018). In Koga for the 2019 pre wet season, soil moisture was predicted to be lower than that of 2018, whereas in Quashni, it was predicted to be similar. The information agrees with actual soil moisture values collected afterwards as part of the CSI (Figure 8).
We could not test the dry season forecast of 2019–2020, because the CSI was halted during that time, as the original CSI was completed in August 2019, and it was extended again in November 2019. For the wet season forecast of 2020, preseason soil moisture was predicted to be lower than 2018 at both sites. Actual CSI values revealed strong agreement for Koga, but for Quashni, the distribution of actual soil moisture values was found to be relatively higher.
However, the mean CSI soil moisture data for the pre-wet season 2020 was still slightly lower than the reference soil moisture (pre-wet season 2018). For the dry season forecast of 2020–2021, preseason soil moisture at both sites was projected to be lower than 2018–2019, and as we can see, this was affirmed by actual CSI data. Overall, five of the six tested cases (pre-wet 2019 for two sites, pre-wet 2020 for two sites, and pre-dry 2020–2021 for two sites) suggest strong agreement of the physical model-based forecast information with actual CSI data (83% accurate).

3.1.5. Knowledge and Science Contributions of the Data

Administrative and capacity issues in Ethiopia have hindered hydrologic data collection at resolutions required for regional planning. Due to capacity constraints, monitoring has taken place for watersheds with an area greater than 1000 km2, while those smaller than 100 km2 have largely been ignored [26]. Our study area was approximately 50 km2, an area size that is historically not captured, but it offered valuable information for stakeholders and researchers due to the fine resolution.
Current agricultural management approaches that use remote sensing are limited by the lack of local information, which yields granular information. The usability of data at this local scale extends beyond the scope of the two demonstrated applications in Section 3.1; fine resolution data can calibrate other algorithms, such as those used in agricultural management, including remote sensing, that are used to estimate crop growth and yield, irrigation, and crop losses, which fundamentally address the food security element of SDG 2: Zero Hunger [49].
Further applications of the citizen science dataset by local stakeholders include local dam officials using river stage for oversight. Since Ethiopia lacks official monitoring for soil moisture and groundwater depth, the spatio-temporal trends captured by the citizen scientists offers an array of newly realizable paths for uptake; adoption of this data may facilitate changes in local irrigation strategies. For example, soil moisture sensors could serve as a live feedback system that could indicate the amount of irrigation needed for crops based on reported soil moisture of plots. This would be an innovative solution to the issue of rainfall patterns being unpredictable and varying, even from plot to plot, and would optimize irrigation efficacy by minimizing superfluous discharge to crops.
Direct applicability of the citizen science data for local stakeholders includes building a baseline of in situ data, which is necessary for forecasting, model development, and a knowledge base that data-scarce LDCs need. Possessing the baseline of various communities would allow the local stakeholders to analyze the social water cycle and the evolutionary trends of water demands and stress in the future [50].

3.1.6. Aligning the Technical Outcome to the SDGs

Beyond hydrologic data supporting the bedrock of all the Goals, we find the data supports the SDGs at the Goal and Target-levels. The hydrologic data collected supports the Agenda and Goals fundamentally, since economic development and human rights depend on proper water management, which cannot be achieved without sufficient monitoring and assessment. This fundamental undercurrent has been recognized, and, to fast track the SDGs within the Decade of Action (2020–2030) the integration of water-related interventions as a mechanism for multiplier-effects across Goals, beyond only the water-specific goals, is being explored [51]. Specifically, the data thematically falls under the category of Goal 6, which is to ‘Ensure Availability and Sustainable Management of Water Sanitation for All’ and addresses several Targets.
At the Target-level, our citizen science data thematically addresses Target 6.4, ‘By 2030, substantially increase water-use efficiency across all sectors and ensure sustainable withdrawals and supply of freshwater to address water scarcity and substantially reduce the number of people suffering from water scarcity’ and Target 6.a, ‘By 2030, expand international cooperation and capacity-building support to developing countries in water and sanitation-related activities and programs, including water harvesting, desalination, water efficiency, wastewater treatment, recycling and reuse technologies’. We include these two targets because, if the data were adopted and used for evidence-based policy by water agencies, the potential of citizen science for the intention of these targets would be realized. The full realization, however, does not depend only on their uptake by water agencies; the potential of citizen science’s contribution is limited by what is established as the measurable definition of success, the SDG Indicator.
For example, our citizen science initiative directly addresses Target 6b, ‘Support and strengthen the participation of local communities in improving water and sanitation management’, yet the full impact of this citizen science data ceases at the indicator level. This is due to the fact that measurable success of Target 6b is solely defined by Indicator 6.b.1, which is, ‘Proportion of local administrative units with established and operational policies and procedures for participation of local communities in water and sanitation management’. Here, it is obvious that the impact of citizen science is not fully realized, due to a disconnect between the Goal and the single Indicator, whereby success is measured.
The disconnect between the measurable citizen science contribution to the SDG is not a reflection of the lack of value of the citizen science data but, rather, a reflection of a bottle-necking effect in the SDG Goal-Target-Indicator framework. At the Indicator level, Fraisl et al. [29] offers a framework whereby citizen science can contribute data towards the SDGs. However, recent developments highlight citizen science receiving merit for contributing at the Target level as well. The case of our hydrologic citizen science data being fundamentally omitted from counting towards a specific Indicator is not a problem in Target 6 only. The idea of citizen science being instrumental towards identifying SDG framework gaps has been recently studied across other Goals and Targets [31].
This analysis highlights the bottlenecking-effect of the Target-Indicator framework that has rendered these specific citizen science hydrologic datasets unmeasurable and, therefore, unseen towards contributing to the SDGs.

3.2. Social Scientific Analysis: Evaluating the Indiviual, Programmatic and Community-Level Outcomes towards the SDGs

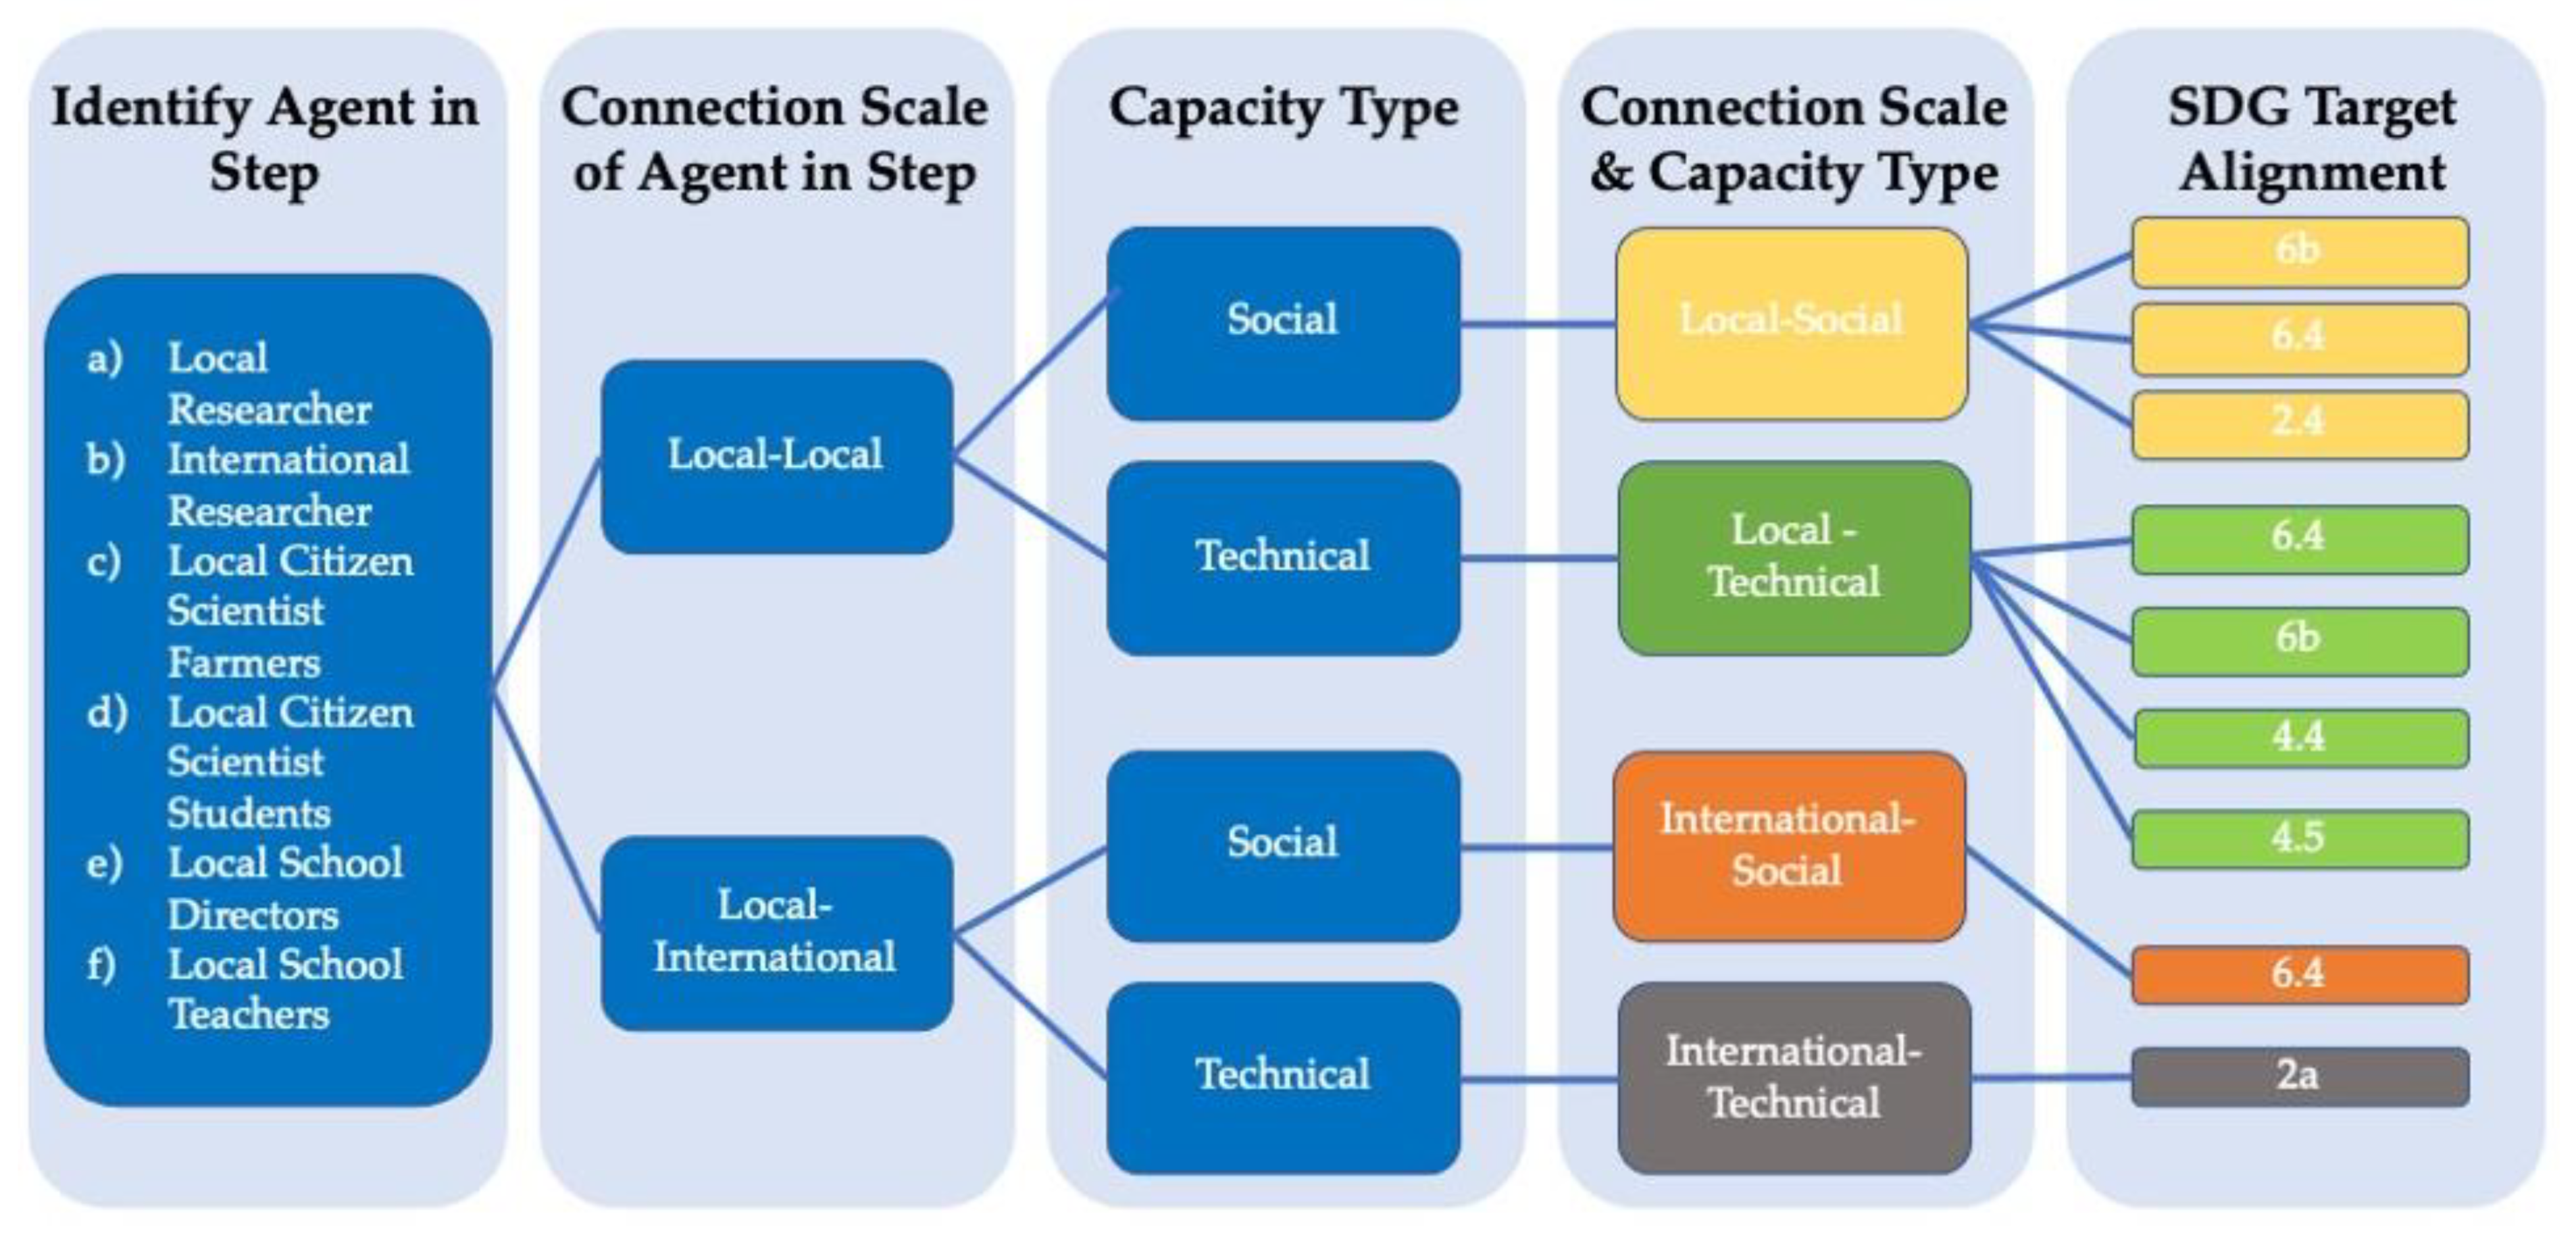
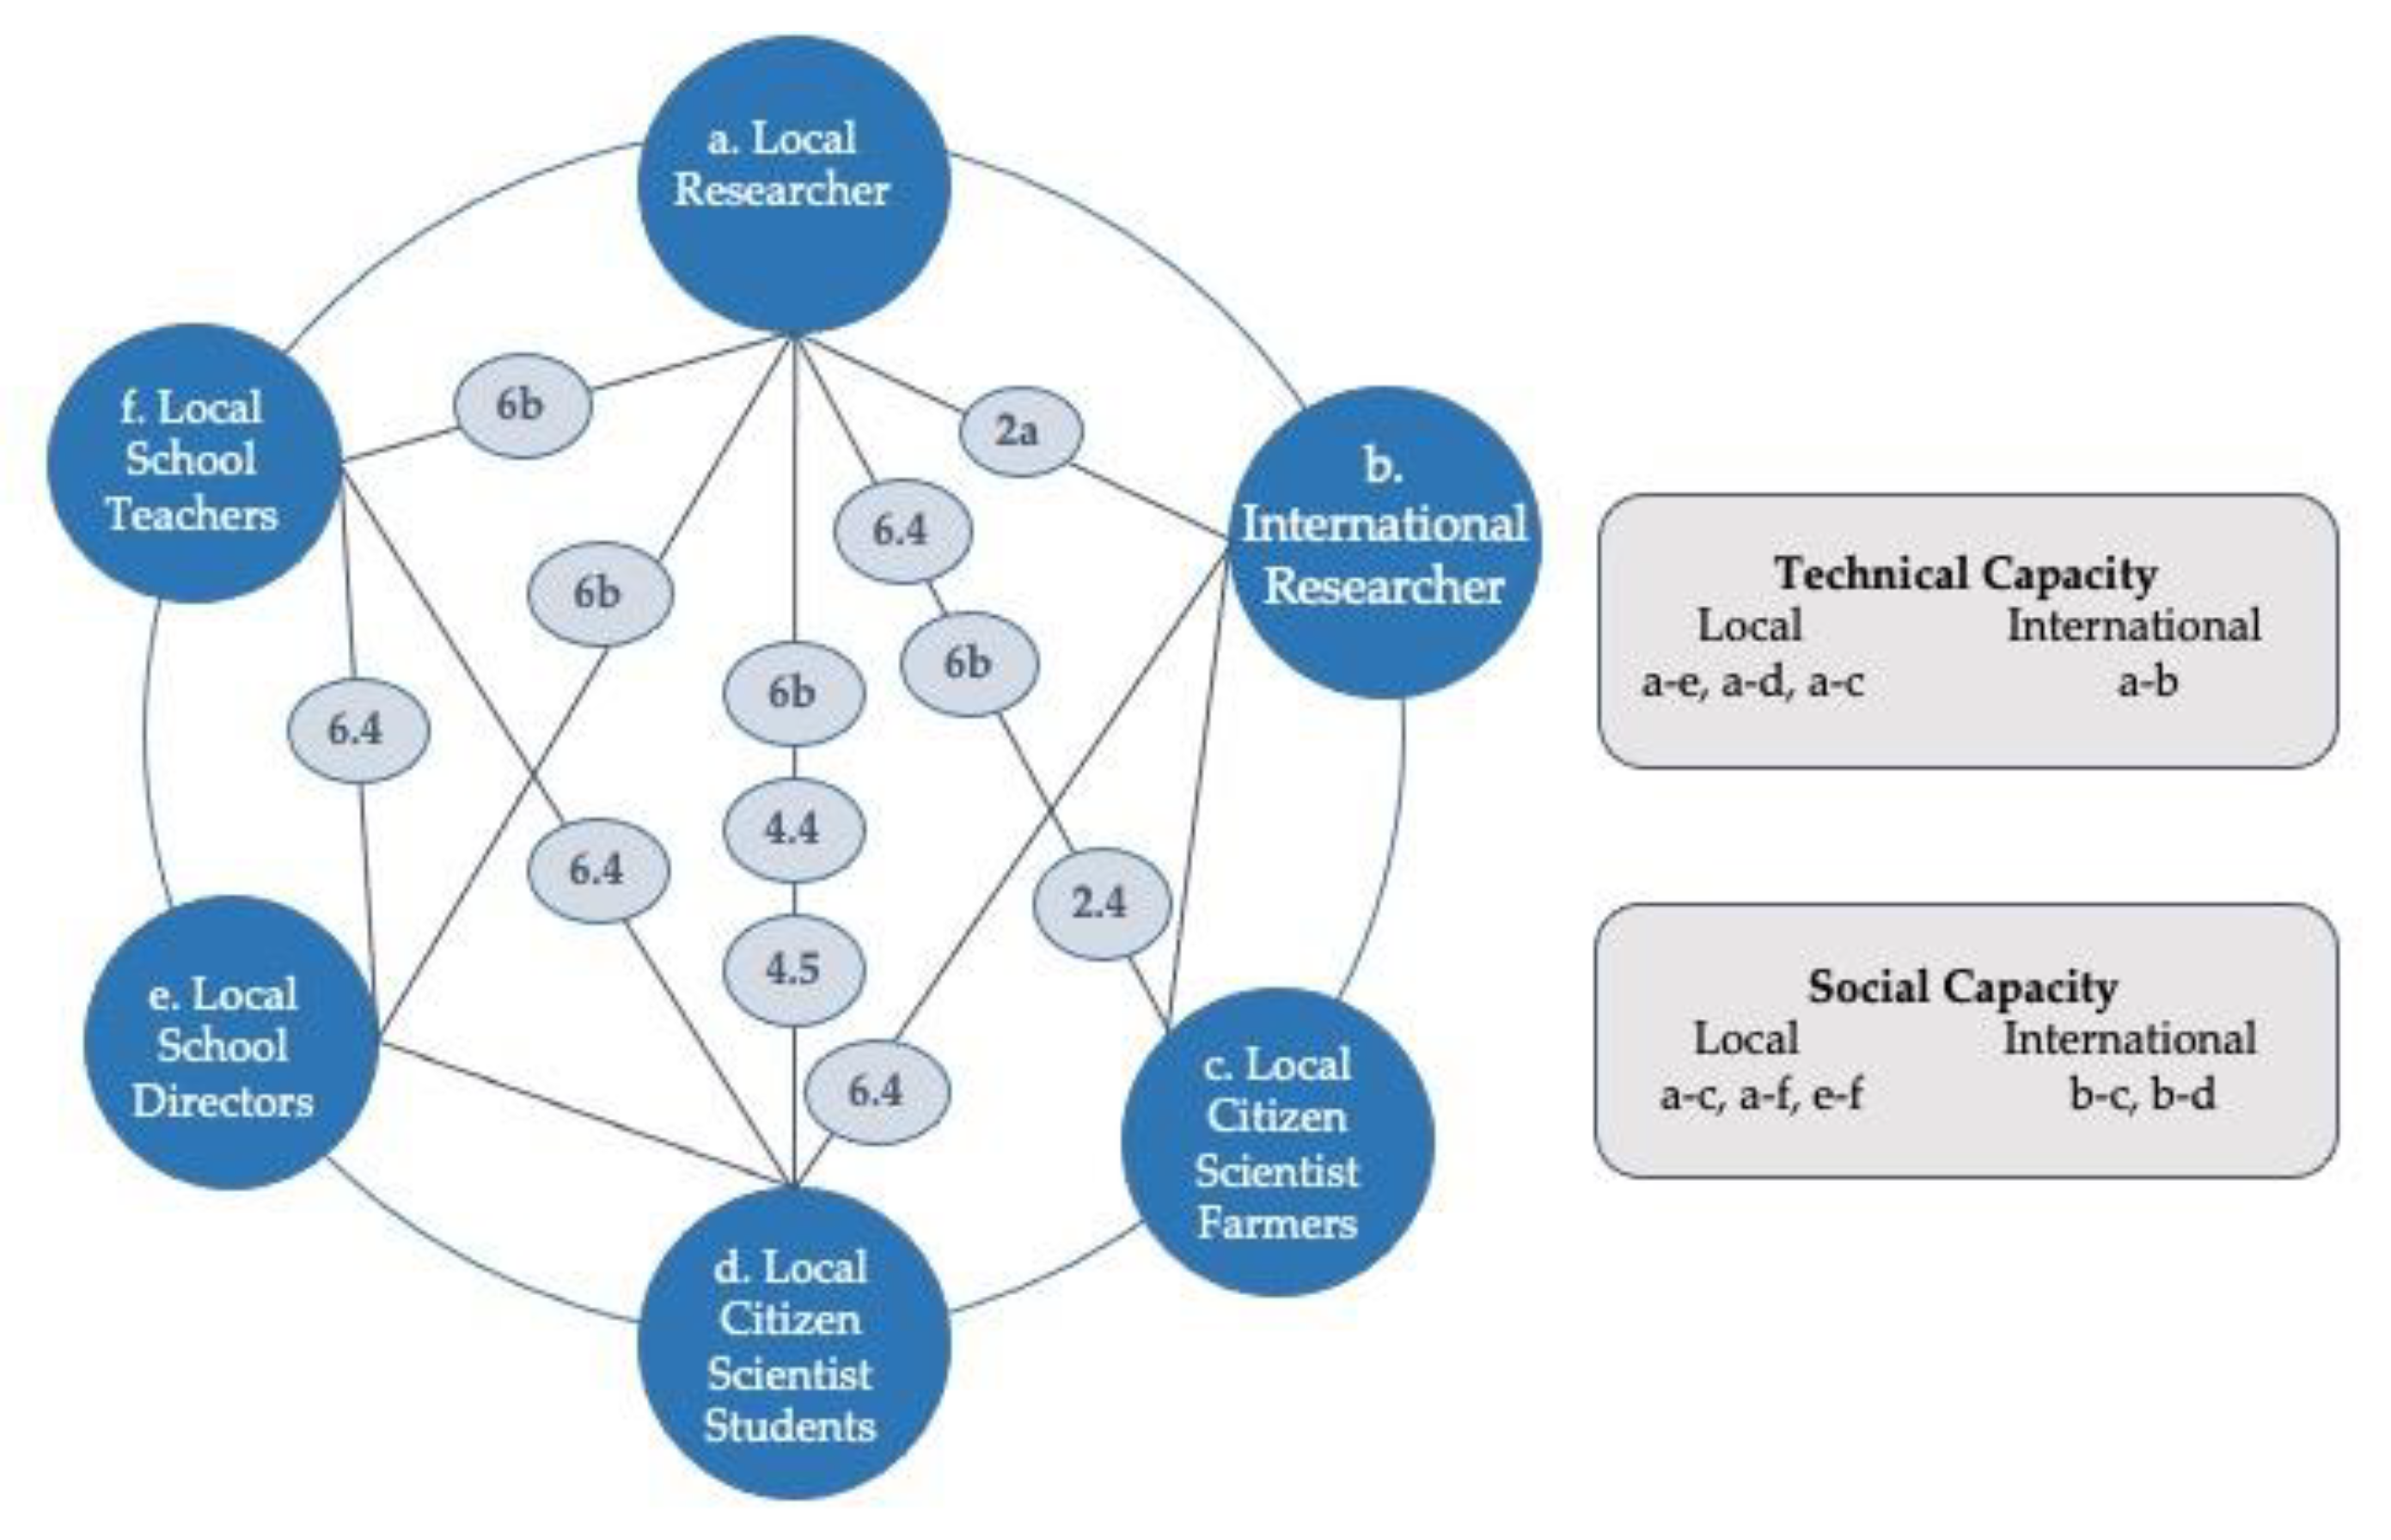
3.2.1. The Social Network and the SDGs

In this section, we explore the individual experiences of the high school citizen scientists. Knowing that, when citizen science is driven solely by the data output the scientists need [52,53,54,55,56], the potential for individual transformation among the citizen scientists themselves is limited, we directed substantial attention to the individual capacity-building of the participants.
The CSI linked individuals from several different institutions, fields, and socio-economic backgrounds to create a robust social network, an outcome that aligned with key SDGs. In this section, we analyze the connections formed according to the type of technical and social capacity that they fostered. We focus on two dimensions of capacity-building: (1) collective capacities rooted in connection with another individual or institution (university or high school); (2) individual capacity, benefits that stem from involvement in the CSI activities, shown schematically in Figure 9. Technical capacity refers to an increase or acquisition in technical skills that can be achieved via mentorship or training of an actor, and social capacity refers to connections fostered, unrelated to technical training, between individuals from the same or different background.
For reference during the analysis, the Targets addressed in this analysis are included, with their full description, in Appendix A.
We find evidence for substantial growth in both the technical and social capacities of participants in ways that supported 8 out of the 17 Sustainable Development Goals at the goal level; eight targets aligned with the SDGs via the collective capacity, and eight aligned via the individual capacity. The experiences of the high school students serve as a good example of how these connections unfold and link into the SDGs (see Figure 9, d). Through their participation in the CSI, the technical and social capacities work towards the following SDG Targets:
  • Target 4.7, ‘by 2030, ensure that all learners acquire the knowledge and skills needed to promote sustainable development, including, among others, through education for sustainable development and sustainable lifestyles, human rights, gender equality, promotion of a culture of peace and non-violence, global citizenship and appreciation of cultural diversity and of culture’s contribution to sustainable development’, by acquiring technical skills that aid in hydrologic data collection and environmental discussion, working with individuals from other cultures and learning about the formal research scientific process,
  • Target 4.5, ‘by 2030, eliminate gender disparities in education and ensure equal access to all levels of education and vocational training for the vulnerable, including persons with disabilities, indigenous peoples and children in vulnerable situations’, for the women citizen scientists who engaged despite their reported difficulties,
  • Target 4.4, ‘by 2030, substantially increase the number of youth and adults who have relevant skills, including technical and vocational skills, for employment, decent jobs and entrepreneurship’, by working in this multi-year CSI in a data-scarce region and demographic that is otherwise unseen and unheard, and,
  • Target 1.5, ‘By 2030, build the resilience of the poor and those in vulnerable situations and reduce their exposure and vulnerability to climate-related extreme events and other economic, social and environmental shocks and disasters’, by increasing their social network of the high school students to their teachers, graduate students, higher education faculty, increasing self-efficacy and being included in knowledge sharing with their peers and field professionals.
These goals involve the high school students as individuals who directly received these benefits from their firsthand experiences. They also formed connections with actors from the local university and those from a U.S. university; as such, it contributed to building their social and technical capacity for Target 6.a, ‘By 2030, expand international cooperation and capacity-building support to developing countries in water- and sanitation-related activities and programmes, including water harvesting, desalination, water efficiency, wastewater treatment, recycling and reuse technologies’. This type of analysis supports the trend in development projects shifting from infrastructure to investments in education, training, and capacity building [57] and offers a visualization of how social infrastructure can progress SDG Targets.

3.2.2. Program Analysis and the SDGs

The extensive individual and institutional connections required significant administrative work. Administrative issues are one of the major challenges for citizen science [58], so we describe, in detail, the individual steps of the process. We divided the administrative structure of the initiative into three phases (preparation, collection, and processing), and described the steps in each phase, which were color-coded to show the agents engaged (see Figure 10).
The diagram also helps us assess the level of participation and agency among different actors in the network. While the CSI was top-down [59], in that it was designed by researchers, we were highly responsive to the engagement and participation of the citizen scientists. Out of the 27 primary steps identified, the citizen scientists accounted for more than 75%. Researchers engaged, primarily, in the processing and application of the data for the use of the seasonal forecast, but the information was also interpreted and analyzed by the students themselves at a workshop called Impact Day, which was hosted by members of the network based in the local university, Bahir Dar University. At Impact Day, BDU graduate students worked with the citizen science high schoolers, teaching them how to process the data, and thus, equipping them later with the knowledge of the analysis themselves.

3.2.3. Individual Outcome and the SDGs

All students reported that they are interested in citizen science and participating in water resource research that can empower the community and individual to improve their well-being. Regarding their training, all students reported that they learned new scientific methods to apply science, and they are fully confident with citizen science findings on water resource research compared to those generated by professional scientists.
In terms of broader perceptions on environmental issues, most saw a direct link between the environment and their well-being. All students perceived that agricultural productivity would be affected if the quality of the environment were to deteriorate. Only seven out of nine students perceived that the environment can contribute to the quality of life and well-being, and they also perceived that they would be personally affected if the quality of the environment deteriorated. (The remaining two students reported that they do not know how the environment contributes to the quality of life and well-being).
After between two and three years of data collection, when the high school students attended Impact Day (the event at the local university), they were, again, interviewed about their experiences but with additional questions meant to assess the benefits and barriers they encountered during their citizen science experience.
The citizen scientists’ responses to questions regarding the benefits and barriers of their participation showed striking similarities. One exception to the general homogeneity was in their motivations for joining. Their reported motivation included gaining experience, enhancing community social interaction, building connections and knowledge from university teachers, accepting the selection committee’s invitation, solving common problems together, and expecting that the initiative will benefit both their future job and the community. The variance of answers regarding motivation offers insight into what motivates these youths to consider engaging in citizen science to be worth their time. We should also note that students were compensated for their time since their participation; citizen science involvement may be comparable to a hobby in the Global North [60], but in this context, it is a contender for their scarce time, which is otherwise most often spent in familial duties.
Regarding the process of data collection, students reported that they enjoyed working with the scientific community, being trained with hydrologic measurement tools, the financial compensation, being a part of the CSI in general, and understanding the nature and meaning of the data. When asked about if there were any parts of the data collection process that they did not like, several students reported difficulties of visiting sites in the wet season, and some had issues with dogs near their collection sites.
Other reported barriers included questions from the community about the purpose of the data collection and collecting daily measurements in adverse weather conditions. We asked about their parents’, neighbors’, friends’, and others’ reactions to collecting data and the students shared the following statements or questions they received from their social network, “this is a good opportunity for your future career”, “what is the advantage of collecting data here? What is the possible outcome for the community?”, “tell me about the advantages and disadvantages of the data being collected”, “what is the project’s importance to the community?” and other themes, including questions about the continuity of the CSI and compensation. Overall, one student summarizes that the reactions in their social network was variable, “it depends on the people, some were encouraging, and others were discouraging”.
The students’ responses show the perceived value of joining citizen science, as well as their self-reported increase in skills and experiences that are considered growth in technical and social capacities. The survey helped our team to understand, from the students themselves, their reported motivation, benefits, and challenges of being involved.
The responses and assets gained by the students contributes, at the Goal-level, to Goal 9, ‘Build resilient infrastructure, promote inclusive and sustainable industrialization and foster innovation’, Goal 13, ‘Take urgent action to combat climate change and its impacts’, and Goal 17, ‘Strengthen the means of implementation and revitalize the global partnership for sustainable development’ and, specifically, for Target 17.18, ‘By 2020, enhance capacity-building support to developing countries, including for least developed countries and small island developing States, to increase significantly the availability of high-quality, timely and reliable data disaggregated by income, gender, age, race, ethnicity, migratory status, disability, geographic location and other characteristics relevant in national contexts’, Target 13.b, ‘Promote mechanisms for raising capacity for effective climate change-related planning and management in least developed countries and small island developing States, including focusing on women, youth and local and marginalized communities’, Target 13.3, ‘Improve education, awareness-raising and human and institutional capacity on climate change mitigation, adaptation, impact reduction and early warning’, and Target 9.5, ‘Enhance scientific research, upgrade the technological capabilities of industrial sectors in all countries, in particular developing countries, including, by 2030, encouraging innovation and substantially increasing the number of research and development workers per 1 million people and development workers per 1 million people and public and private research and development spending’. The major limitation for their individual benefits counting towards the progress of the SDGs is the invariable fact that increasing social and technical capacity, by measuring increases in knowledge, is difficult and doesn’t contribute towards a specific Indicator.

4. Study Challenges

Engaging individuals in citizen science, who are compensated for their time and effort, has the potential to create or intensify existing social power structures in the local community. In the CSI, individuals involved received both monetary compensation and exclusive participation with university faculty that other high school students did not receive. Additionally, the local farmers expressed interest in having their own son or daughter to be hired as students, instead of the students selected according to the selection criteria (i.e., academic potential, gender, attitude, proximity to the monitoring sites). This potential conflict was resolved, locally, between senior farmers and the ones interested in having their son or daughter participate. Senior farmers in the area are well-known in the community by their hard work, local conflict settlement, and farming practices, and they have their own power to facilitate farmer cooperation. Extension agencies utilize them to symbolize new agricultural technological practices and adoptions offered by the government and non-governmental organizations (NGOs) at the community level. As a result, any query posed by local farmers is first addressed by senior farmers, using their social structure and indigenous expertise to provide solutions. Thus, after a discussion between faculty and senior local farmers about the citizen science student selection mechanism and payment, the entire community came into agreement regarding the student selection process.
Despite our best effort to utilize resilient equipment, it was still reported that monitoring devices were damaged due to tillage and interference by children. Scalability could also be an issue, given that the CSI took place at the Kebele level, which is a small region, and the intensive level of engagement would pose challenges for training and data management.

5. Conclusions

Citizen science, as a form of data collection for SDG monitoring and as a tool for local engagement in activities that facilitate the acceleration of the 17 SDGs, is gaining increasing attention as the Decade of Action progresses towards the 2030 benchmark. Through a technical and social scientific analysis of the CSI, we show the pathways towards increasing social and technical capacity at the local, individual, collective, and international-level. Social infrastructure was strengthened at these scales in the process of students and farmers collecting river stage, groundwater depth, and soil moisture values across four sites within the Upper Blue Nile Water Basin, Ethiopia. The robust training and program design allowed for these hydrologic datasets to be used by researchers to validate wet season hydrological forecasts, used in rainfed crop yield forecasting, and calibrate a regional groundwater model, which has direct applicability for irrigation decisions taken by local water managers. This highlights the efficacy of well-trained citizen scientists and shows the potential of crowdsourced datasets to be used in the SDG framework beyond supplementing data collected by custodian agencies.
While intensive in-person training was beneficial, it is not always possible. The high school students in this study engaged in a longitudinal mentorship with local researchers, whereby the students were able to identify their increased technical capacity and highlight the barriers gained during their involvement in data collection. Their feedback was collected via a social interview, and it highlights how the structure of the CSI has the potential to address the SDGs, at the Target-level, by cultivating connections that increase social and technical capacity at a local level. Highlighting their voices and experiences is essential, as the sustainable development policy continues to place a concerted effort on educational and youth investment.
This interface can be explored to evaluate the longitudinal societal changes caused by increased citizen participation in environmental problems and the response communities to environmental shocks, such as flooding and droughts. This type of evaluation is common in the socio-ecological system (SES) resilience literature, which goes into extensive detail to evaluate changes in an individual and how this person’s actions affect the surrounding environment.
Upcoming research may consider incorporating elements from the SES literature into the design and evaluation of the social dimensions of citizen science. To do this, the citizen science design should consider the skills or knowledge they wish to expose to an individual, as well as the socio-institutional connections to be strengthened. Practically, this can be done by determining Indicators, administering social surveys, and conducting an extensive social network analysis in conjunction with a data analysis.

Author Contributions

Conceptualization, G.R. and E.A.; Data curation, B.G.S., D.G.E., M.A. (Muludel Aseres) and W.A.; Formal analysis, G.R., Z.D., F.K.K. and X.W.; Funding acquisition, E.A., E.H. and A.B.; Methodology, E.H. and E.A.; Project administration, Z.D., F.K.K., M.M., M.A. (Muluken Azage) and S.T.; Resources, W.Z. and B.L.; Supervision, E.A.; Visualization, G.R. and F.K.K.; Writing—original draft, G.R.; Writing—review & editing, Z.D., E.H., A.B. and E.A. All authors have read and agreed to the published version of the manuscript.

Funding

This research is based upon work supported by the National Science Foundation under Grant Number 1545874. Additional support was provided by the Department of Civil and Environmental Engineering at the University of Connecticut in the form of internal funds.

Institutional Review Board Statement

This study was approved by the Institutional Review Board of the University of Connecticut (Protocol #H15-238).

Informed Consent Statement

Not applicable.

Data Availability Statement

The publicly archived datasets generated during study can be accessed at: https://doi.org/10.4211/hs.316f8ea825aa4915b6c649d36825b1cc (accessed on 12 December 2021).

Acknowledgments

This research is based upon work supported partly by the National Science Foundation under Grant Number 1545874 and in part by the Department of Civil and Environmental Engineering. The authors would like to thank the supporting agency including Bahir Dar University, and especially Seifu Tilahun, and Mamaru Moges for managing the CSI and data collection, especially through the difficulties caused by the COVID-19 pandemic. A special thanks go to the student and farmer citizen scientists; the CSI would not have been possible without their faithful data collection and participation. We want to acknowledge every NSF PIRE researcher who contributed towards the seasonal forecast bulletin development, and Teshome Yami and Yang Hong at the Hydrometeorology and Remote Sensing Lab at University of Oklahoma for developing the E-Ping App for citizen science data collection.

Conflicts of Interest

The authors declare no conflict of interest. The funders had no role in the design of the study; in the collection, analyses, or interpretation of data; in the writing of the manuscript, or in the decision to publish the results.

Appendix A. Reference of SDG Targets from Analysis

Sustainable Development GoalTarget
Goal 1. End poverty in all its forms everywhere1.5 By 2030, build the resilience of the poor and those in vulnerable situations and reduce their exposure and vulnerability to climate-related extreme events and other economic, social and environmental shocks and disasters
Goal 2. End hunger, achieve food security and improved nutrition and promote sustainable agriculture2.4 By 2030, ensure sustainable food production systems and implement resilient agricultural practices that increase productivity and production, that help maintain ecosystems, that strengthen capacity for adaptation to climate change, extreme weather, drought, flooding and other disasters and that progressively improve land and soil quality
2.a Increase investment, including through enhanced international cooperation, in rural infrastructure, agricultural research and extension services, technology development and plant and livestock gene banks in order to enhance agricultural productive capacity in developing countries, in particular least developed countries
Goal 4. Ensure inclusive and equitable quality education and promote lifelong learning opportunities for all4.4 By 2030, substantially increase the number of youth and adults who have relevant skills, including technical and vocational skills, for employment, decent jobs and entrepreneurship
4.5 By 2030, eliminate gender disparities in education and ensure equal access to all levels of education and vocational training for the vulnerable, including persons with disabilities, indigenous peoples and children in vulnerable situations
4.7 By 2030, ensure that all learners acquire the knowledge and skills needed to promote sustainable development, including, among others, through education for sustainable development and sustainable lifestyles, human rights, gender equality, promotion of a culture of peace and non-violence, global citizenship and appreciation of cultural diversity and of culture’s contribution to sustainable development
Goal 5. Achieve gender equality and empower all women and girls5.b Enhance the use of enabling technology, in particular information and communications technology, to promote the empowerment of women
Goal 6. Ensure availability and sustainable management of water and sanitation for all6.4 By 2030, substantially increase water-use efficiency across all sectors and ensure sustainable withdrawals and supply of freshwater to address water scarcity and substantially reduce the number of people suffering from water scarcity
6.a By 2030, expand international cooperation and capacity-building support to developing countries in water- and sanitation-related activities and programmes, including water harvesting, desalination, water efficiency, wastewater treatment, recycling and reuse technologies
6.b Support and strengthen the participation of local communities in improving water and sanitation management
Goal 9. Build resilient infrastructure, promote inclusive and sustainable industrialization and foster innovation9.5 Enhance scientific research, upgrade the technological capabilities of industrial sectors in all countries, in particular developing countries, including, by 2030, encouraging innovation and substantially increasing the number of research and development workers per 1 million people and development workers per 1 million people and public and private research and development spending
Goal 13. Take urgent action to combat climate change and its impacts13.3 Improve education, awareness-raising and human and institutional capacity on climate change mitigation, adaptation, impact reduction and early warning
13.b Promote mechanisms for raising capacity for effective climate change-related planning and management in least developed countries and small island developing States, including focusing on women, youth and local and marginalized communities
Goal 17. Strengthen the means of implementation and revitalize the global partnership for sustainable development17.18 By 2020, enhance capacity-building support to developing countries, including for least developed countries and small island developing States, to increase significantly the availability of high-quality, timely and reliable data disaggregated by income, gender, age, race, ethnicity, migratory status, disability, geographic location and other characteristics relevant in national contexts

References

  1. SDG 6 Synthesis Report 2018 on Water and Sanitation; UN-WATER PUBLICATIONS: New York, NY, USA, 2018; Available online: https://sustainabledevelopment.un.org/content/documents/19901SDG6_SR2018_web_3.pdf (accessed on 13 October 2021).
  2. Hanjra, M.A.; Ferede, T.; Gutta, D.G. Reducing Poverty in Sub-Saharan Africa through Investments in Water and Other Priorities. Agric. Water Manag. 2009, 96, 1062–1070. [Google Scholar] [CrossRef]
  3. Namara, R.E.; Hanjra, M.A.; Castillo, G.E.; Ravnborg, H.M.; Smith, L.; van Koppen, B. Agricultural Water Management and Poverty Linkages. Agric. Water Manag. 2010, 97, 520–527. [Google Scholar] [CrossRef]
  4. Hagos, F.; Jayasinghe, G.; Awulachew, S.B.; Loulseged, M.; Yilma, A.D. Agricultural Water Management and Poverty in Ethiopia. Agric. Econ. 2012, 43, 99–111. [Google Scholar] [CrossRef] [Green Version]
  5. Forouzani, M.; Karami, E. Agricultural Water Poverty Index and Sustainability. Agron. Sustain. Dev. 2010, 31, 415–431. [Google Scholar] [CrossRef] [Green Version]
  6. Young, M.D.; Esau, C. Investing in Water for a Green Economy: Services, Infrastructure, Policies and Management. In Investing in Water for a Green Economy: Services, Infrastructure, Policies and Management, 1st ed.; Routledge: London, UK, 2013; pp. 1–272. [Google Scholar] [CrossRef]
  7. Transforming Our World: The 2030 Agenda for Sustainable Development (A/RES/70/1); United Nations General Assembly: New York, NY, USA, 2015; Available online: https://sustainabledevelopment.un.org/post2015/transformingourworld/publication (accessed on 12 December 2021).
  8. Leal Filho, W.; Tripathi, S.K.; Andrade Guerra, J.B.S.O.D.; Giné-Garriga, R.; Orlovic Lovren, V.; Willats, J. Using the Sustainable Development Goals towards a Better Understanding of Sustainability Challenges. Int. J. Sustain. Dev. World Ecol. 2019, 26, 179–190. [Google Scholar] [CrossRef]
  9. IAEG Revised List of Global Sustainable Development Goal Indicators. In Report of the Inter-Agency and Expert Group on Sustainable Development Goal Indicators (E/CN.3/2017/2)—Annex III; United Nations Economic and Social Council, Statistical Commission: New York, NY, USA, 2017; pp. 1–26.
  10. Ajates, R.; Hager, G.; Georgiadis, P.; Coulson, S.; Woods, M.; Hemment, D. Local Action with Global Impact: The Case of the Grow Observatory and the Sustainable Development Goals. Sustainability 2020, 12, 518. [Google Scholar] [CrossRef]
  11. Espey, J.; Swanson, E.; Badiee, S.; Christensen, Z.; Fischer, A.; Levy, M.; Yetman, G.; de Sherbinin, A.; Chen, R.; Yiu, Q.; et al. Data for Development: A Needs Assessment for SDG Monitoring and Statistical Capacity Development; Sustainable Development Solutions Network: New York, NY, USA, 2015. [Google Scholar]
  12. Fritz, S.; See, L.; Carlson, T.; Haklay, M.; Oliver, J.L.; Fraisl, D.; Mondardini, R.; Brocklehurst, M.; Shanley, L.A.; Schade, S.; et al. Citizen Science and the United Nations Sustainable Development Goals. Nat. Sustain. 2019, 2, 922–930. [Google Scholar] [CrossRef]
  13. Bonney, R.; Shirk, J.L.; Phillips, T.B.; Wiggins, A.; Ballard, H.L.; Miller-Rushing, A.J.; Parrish, J.K. Next Steps for Citizen Science. Science 2014, 343, 1436–1437. [Google Scholar] [CrossRef]
  14. Pocock, M.J.O.O.; Roy, H.E.; August, T.; Kuria, A.; Barasa, F.; Bett, J.; Githiru, M.; Kairo, J.; Kimani, J.; Kinuthia, W.; et al. Developing the Global Potential of Citizen Science: Assessing Opportunities That Benefit People, Society and the Environment in East Africa. J. Appl. Ecol. 2019, 56, 274–281. [Google Scholar] [CrossRef]
  15. Célleri, R.; Buytaert, W.; de Bièvre, B.; Tobón, C.; Crespo, P.; Molina, J.; Feyen, J.A.N. Understanding the Hydrology of Tropical Andean Ecosystems through an Andean Network of Basins. IAHS-AISH Publ. 2010, 336, 209–212. [Google Scholar] [CrossRef]
  16. Buytaert, W.; Zulkafli, Z.; Grainger, S.; Acosta, L.; Alemie, T.C.; Bastiaensen, J.; de Bièvre, B.; Bhusal, J.; Clark, J.; Dewulf, A.; et al. Citizen Science in Hydrology and Water Resources: Opportunities for Knowledge Generation, Ecosystem Service Management, and Sustainable Development. Front. Earth Sci. 2014, 2, 26. [Google Scholar] [CrossRef] [Green Version]
  17. Njue, N.; Stenfert Kroese, J.; Gräf, J.; Jacobs, S.R.; Weeser, B.; Breuer, L.; Rufino, M.C. Citizen Science in Hydrological Monitoring and Ecosystem Services Management: State of the Art and Future Prospects. Sci. Total Environ. 2019, 693, 133531. [Google Scholar] [CrossRef] [PubMed]
  18. Tripathi, A.; Mishra, A.K. Knowledge and Passive Adaptation to Climate Change: An Example from Indian Farmers. Clim. Risk Manag. 2017, 16, 195–207. [Google Scholar] [CrossRef]
  19. Conway, D.; Schipper, E.L.F. Adaptation to Climate Change in Africa: Challenges and Opportunities Identified from Ethiopia. Glob. Environ. Change 2011, 21, 227–237. [Google Scholar] [CrossRef]
  20. Kotir, J.H. Climate Change and Variability in Sub-Saharan Africa: A Review of Impacts on Agriculture and Food Security. Environ. Dev. Sustain. 2021, 23, 23–43. [Google Scholar] [CrossRef]
  21. Yeshanew, A.; Jury, M.R. Ethiopian Decadal Climate Variability. Theor. Appl. Climatol. 2010, 101, 29–40. [Google Scholar] [CrossRef]
  22. Gebrechorkos, S.H.; Hülsmann, S.; Bernhofer, C. Long-Term Trends in Rainfall and Temperature Using High-Resolution Climate Datasets in East Africa. Sci. Rep. 2019, 9, 11376. [Google Scholar] [CrossRef] [Green Version]
  23. Thornton, P.; Rosenstock, T.S. Future Climate Projections in Africa: Where Are We Headed? Clim.-Smart Agric. Pap. 2018, 4, 15–17. [Google Scholar] [CrossRef] [Green Version]
  24. Deressa, T.T.; Hassan, R.M. Economic Impact of Climate Change on Crop Production in Ethiopia: Evidence from Cross-Section Measures. J. Afr. Econ. 2009, 18, 529–554. [Google Scholar] [CrossRef]
  25. Moges, D.M.; Bhat, H.G. Climate Change and Its Implications for Rainfed Agriculture in Ethiopia. J. Water Clim. Change 2021, 12, 1229–1244. [Google Scholar] [CrossRef]
  26. Nigussie, L.; Haile, A.T.; Gowing, J.; Walker, D.; Parkin, G. Citizen Science in Community-Based Watershed Management: An Institutional Analysis in Ethiopia; International Water Management Institute (IWMI): Colombo, Sri Lanka, 2020; Volume 191. [Google Scholar] [CrossRef]
  27. Gebrehiwot, S.G.; Bewket, W.; Mengistu, T.; Nuredin, H.; Ferrari, C.A.; Bishop, K. Monitoring and Assessment of Environmental Resources in the Changing Landscape of Ethiopia: A Focus on Forests and Water. Environ. Monit. Assess. 2021, 193, 624. [Google Scholar] [CrossRef]
  28. van Loon, A.F. Hydrological Drought Explained. WIREs Water 2015, 2, 359–392. [Google Scholar] [CrossRef]
  29. Fraisl, D.; Campbell, J.; See, L.; Wehn, U.; Wardlaw, J.; Gold, M.; Moorthy, I.; Arias, R.; Piera, J.; Oliver, J.L.; et al. Mapping Citizen Science Contributions to the UN Sustainable Development Goals. Sustain. Sci. 2020, 15, 1735–1751. [Google Scholar] [CrossRef]
  30. Pateman, R.; Tuhkanen, H.; Cinderby, S. Citizen Science and the Sustainable Development Goals in Low and Middle Income Country Cities. Sustainability 2021, 13, 9534. [Google Scholar] [CrossRef]
  31. PIRE Home. Water and Food Security PIRE. Available online: https://pire.engr.uconn.edu/ (accessed on 22 August 2021).
  32. Dickinson, J.L.; Shirk, J.; Bonter, D.; Bonney, R.; Crain, R.L.; Martin, J.; Phillips, T.; Purcell, K. The Current State of Citizen Science as a Tool for Ecological Research and Public Engagement. Front. Ecol. Environ. 2012, 10, 291–297. [Google Scholar] [CrossRef] [Green Version]
  33. Cohn, J.P. Citizen Science: Can Volunteers Do Real Research? BioScience 2008, 58, 192–197. [Google Scholar] [CrossRef] [Green Version]
  34. Wiggins, A.; Newman, G.; Stevenson, R.D.; Crowston, K. IEEE Xplore Full-Text PDF. Mechanisms for Data Quality and Validation in Citizen Science. In Proceedings of the IEEE Seventh International Conference on e-Science Workshops, Stockholm, Sweden, 5–8 December 2011; pp. 14–19. [Google Scholar] [CrossRef]
  35. Danielsen, F.; Jensen, P.M.; Burgess, N.D.; Altamirano, R.; Alviola, P.A.; Andrianandrasana, H.; Brashares, J.S.; Burton, A.C.; Coronado, I.; Corpuz, N.; et al. A Multicountry Assessment of Tropical Resource Monitoring by Local Communities. BioScience 2014, 64, 236–251. [Google Scholar] [CrossRef] [Green Version]
  36. Evans, D.M. Citizen Science Comes of Age. Trends Ecol. Evol. 2013, 28, 451. [Google Scholar] [CrossRef]
  37. Jordan, R.C.; Ballard, H.L.; Phillips, T.B. Key Issues and New Approaches for Evaluating Citizen-Science Learning Outcomes. Front. Ecol. Environ. 2012, 10, 307–309. [Google Scholar] [CrossRef]
  38. Dile, Y.T.; Tekleab, S.; Kaba, E.A.; Gebrehiwot, S.G.; Worqlul, A.W.; Bayabil, H.K.; Yimam, Y.T.; Tilahun, S.A.; Daggupati, P.; Karlberg, L.; et al. Advances in Water Resources Research in the Upper Blue Nile Basin and the Way Forward: A Review. J. Hydrol. 2018, 560, 407–423. [Google Scholar] [CrossRef]
  39. Bo Tegnäs, S.D.; Johnson, E.P.; Yared Fekade Mandefro, S.J. Rural Households Socioeconomic Baseline Survey of 56 Woredas in the Amhara Region, Volume VII—Crop Production and Protection; Swedish International Development Cooperation Agency: Stockholm, Sweden; Bahir Dar, Ethiopia, 2009.
  40. Bewket, W. Rainfall Variability and Agricultural Vulnerability in the Amhara Region, Ethiopia. Ethiop. J. Dev. Res. 2008, 29, 823–836. [Google Scholar] [CrossRef]
  41. Awulachew, S.; Merrey, D.; Kamara, A.; van Koppen, B.; Penning de Vires, F.; Boelee, E.; Makombe, G. Experiences and Opportunities for Promoting Small-Scale/Micro Irrigation and Rainwater Harvesting for Food Security in Ethiopia; (Working paper 98); International Water Management Institute: Colombo, Sri Lanka, 2005; Volume 98, 86p. [Google Scholar]
  42. Awulachew, S.B.; Erkossa, T.; Namara, R. Irrigation Potential in Ethiopia: Constraints and Opportunities for Enhancing the System. Research Report, International Water Management Institute, Addis Ababa. Int. Water Manag. Inst. 2010, 3, 1–59. [Google Scholar] [CrossRef]
  43. Hailemichael, S.; Haug, R. The Use and Abuse of the ‘Model Farmer’ Approach in Agricultural Extension in Ethiopia. J. Agric. Educ. Ext. 2020, 26, 465–484. [Google Scholar] [CrossRef]
  44. Xu, Z.; Zhou, W.; Zhang, H.; Shen, M.; Liu, Y.; Cai, D.; Li, Y.; Lei, Y.; Wang, G.; Bagtzoglou, A.C.; et al. Flat Thin Mm-Sized Soil Moisture Sensor (MSMS) Fabricated by Gold Compact Discs Etching for Real-Time in Situ Profiling. Sens. Actuators B Chem. 2018, 255, 1166–1172. [Google Scholar] [CrossRef]
  45. Kieslinger, B.; Schäfer, T.; Heigl, F.; Dörler, D.; Richter, A.; Bonn, A. The Challenge of Evaluation: An Open Framework for Evaluating Citizen Science Activities. SocArXiv 2017, 1–31. [Google Scholar] [CrossRef] [Green Version]
  46. United Nations. Transforming Ethiopia Together: The United Nations in Ethipiopia; United Nations: New York, NY, USA, 2018. [Google Scholar]
  47. Sachs, J.D. From Millennium Development Goals to Sustainable Development Goals. Lancet 2012, 379, 2206–2211. [Google Scholar] [CrossRef]
  48. Khadim, F.K.; Dokou, Z.; Lazin, R.; Moges, S.; Bagtzoglou, A.C.; Anagnostou, E. Groundwater Modeling in Data Scarce Aquifers: The Case of Gilgel-Abay, Upper Blue Nile, Ethiopia. J. Hydrol. 2020, 590, 125214. [Google Scholar] [CrossRef]
  49. Karthikeyan, L.; Chawla, I.; Mishra, A.K. A Review of Remote Sensing Applications in Agriculture for Food Security: Crop Growth and Yield, Irrigation, and Crop Losses. J. Hydrol. 2020, 586, 124905. [Google Scholar] [CrossRef]
  50. Yang, D.; Yang, Y.; Xia, J. Hydrological Cycle and Water Resources in a Changing World: A Review. Geogr. Sustain. 2021, 2, 115–122. [Google Scholar] [CrossRef]
  51. Taing, L.; Dang, N.; Agarwal, M.; Glickman, T. Water-Related Sustainable Development Goal Accelerators: A Rapid Review. Water Secur. 2021, 14, 100100. [Google Scholar] [CrossRef]
  52. Assumpção, T.H.; Popescu, I.; Jonoski, A.; Solomatine, D.P. Citizen Observations Contributing to Flood Modelling: Opportunities and Challenges. Hydrol. Earth Syst. Sci. 2018, 22, 1473–1489. [Google Scholar] [CrossRef] [Green Version]
  53. Moczek, N.; Voigt-Heucke, S.L.; Mortega, K.G.; Fabó Cartas, C.; Knobloch, J. A Self-Assessment of European Citizen Science Projects on Their Contribution to the UN Sustainable Development Goals (SDGs). Sustainability 2021, 13, 1774. [Google Scholar] [CrossRef]
  54. le Coz, J.; Patalano, A.; Collins, D.; Guillén, N.F.; García, C.M.; Smart, G.M.; Bind, J.; Chiaverini, A.; le Boursicaud, R.; Dramais, G.; et al. Crowdsourced Data for Flood Hydrology: Feedback from Recent Citizen Science Projects in Argentina, France and New Zealand. J. Hydrol. 2016, 541, 766–777. [Google Scholar] [CrossRef] [Green Version]
  55. Fehri, R.; Khlifi, S.; Vanclooster, M. Testing a Citizen Science Water Monitoring Approach in Tunisia. Environ. Sci. Policy 2020, 104, 67–72. [Google Scholar] [CrossRef]
  56. Duddigan, S.; Alexander, P.D.; Shaw, L.J.; Sandén, T.; Collins, C.D. The Tea Bag Index-UK: Using Citizen/Community Science to Investigate Organic Matter Decomposition Rates in Domestic Gardens. Sustainability 2020, 12, 6895. [Google Scholar] [CrossRef]
  57. Thapa, R.B.; Matin, M.A.; Bajracharya, B. Capacity Building Approach and Application: Utilization of Earth Observation Data and Geospatial Information Technology in the Hindu Kush Himalaya. Front. Environ. Sci. 2019, 7, 165. [Google Scholar] [CrossRef]
  58. Eitzel, M.V.; Cappadonna, J.L.; Santos-Lang, C.; Duerr, R.E.; Virapongse, A.; West, S.E.; Kyba, C.C.M.; Bowser, A.; Cooper, C.B.; Sforzi, A.; et al. Citizen Science Terminology Matters: Exploring Key Terms. Citiz. Sci. Theory Pract. 2017, 2, 1. [Google Scholar] [CrossRef] [Green Version]
  59. Conrad, C.C.; Hilchey, K.G. A Review of Citizen Science and Community-Based Environmental Monitoring: Issues and Opportunities. Environ. Monit. Assess. 2011, 176, 273–291. [Google Scholar] [CrossRef]
  60. Jones, M.G.; Childers, G.; Andre, T.; Corin, E.N.; Hite, R. Citizen Scientists and Non-Citizen Scientist Hobbyists: Motivation, Benefits, and Influences. Int. J. Sci. Educ. Part B Commun. Public Engagem. 2018, 8, 287–306. [Google Scholar] [CrossRef]
Figure 1. Schematic of the CSI design.
Sustainability 14 03647 g001
Figure 2. (a) Location of study area, highlighting the two woredas and four kebeles; (b) the detailed monitoring locations.
Sustainability 14 03647 g002
Figure 3. Field images of citizen science training. (1). Soil moisture training at Quashni. (2). Well Monitoring at Quashni. (3). River Stage Quashni. (4). Bahir Dar University Master of Science student training a woman high school student on river stage measurement at Koga. (5). Training for well monitoring at Quashni. (6). Training for well monitoring at Branti. (7). Soil moisture training at Quashni. (8). Soil Moisture Training at Koga.
Sustainability 14 03647 g003
Figure 4. Social network flowchart method to identify agent-scale-capacity connection towards SDG Target.
Sustainability 14 03647 g004
Figure 5. Seasonal averages of soil moisture and resistivity values across citizen science collection sites.
Sustainability 14 03647 g005
Figure 6. Time series data for distance to GWT, degree of saturation (soil moisture), and river stage at citizen science sites.
Sustainability 14 03647 g006
Figure 7. Citizen Science data for groundwater model validation.
Sustainability 14 03647 g007
Figure 8. Citizen science measurements for different forecast timelines. (a) box-plots of TDR measured saturation (%) and (b) decision on soil wetness in the forecast bulletins. Pre-wet season includes 20 April to 10 May, whereas pre-dry season is for the month of October.
Sustainability 14 03647 g008
Figure 9. The Social network schematic highlights the ties between agents and the resultant SDG targets (seen in grey along the connection). Target 6.4 is addressed in every connection; on the right, it shows the type of social and capacity built, per connection, at local and international scales.
Sustainability 14 03647 g009
Figure 10. Process Schematic, color-coded according to agent engaged and/or primarily affected. Grey are steps governed by researchers, orange is related to high schoolers and farmers, blue is for students, and green is for farmers.
Sustainability 14 03647 g010
Table 1. Selection Criteria for Citizen Scientists.
StudentsFarmers
Live near the schoolModel farmer 1
Be in good academic standingAbility to write and speak the local language fluently
Age 17–24Able to interact with graduate students easily
Be active in communicationAge 45 or below
Gender balance among sites (6 men, 3 women)Societal acceptance
Gender balance was not achieved because women farmers are engaged in household-based tasks
1. Model farmers are those considered with high crop productivity, due to their ‘best practices’ and ability to communicate this, in their network of farmers [43].
Table 2. This table outlines the location, hydro-climatological parameter, frequency, number of collection points, and the instrument used for calibration and capturing data.
LocationHydrological
Parameter
FrequencyNumber of LocationsStart DateEnd DatePrincipal Citizen
Science Investigator
Branti
Rainfed 1
River Stage, mDaily1July 2017December 2021Students
Soil Moisture, %Weekly8July 2017December 2021Students
Depth to GWT, mWeekly28July 2017December 2021Students
Soil Resistivity 2, ΩWeekly12June 2018December 2020Farmers
Markudi
Rainfed 3
River StageDaily1September 2018December 2020Students
Soil MoistureWeekly8September 2018December 2020Students
Depth to GWTWeekly11September 2018December 2020Students
Soil ResistivityWeekly12September 2018December 2020Farmers
Koga
Irrigated 4
Soil MoistureWeekly9October 2017December 2021Students
Depth to GWTWeekly5October 2017December 2021Students
Soil ResistivityWeekly6June 2018December 2021Farmers
Quashni
Irrigated 5
River StageDaily1March 2018December 2021Students
Soil MoistureWeekly9March 2018December 2021Students
Depth to GWTWeekly5March 2018December 2021Students
Soil ResistivityWeekly6December 2019December 2021Farmers
1. Branti—soil resistivity months omitted: 5/18–7/18, 4/19–5/19. 2. Two sensors were deployed per location and collected resistivity values at 10 cm and 40 cm. 3. Markudi soil resistivity months omitted: 10/18, 7/19. 4. Koga—soil moisture months omitted: 10/19–11/19 and soil resistivity months omitted: 10/19–12/19, depth to GWT months omitted: 10/19–11/19. 5. Quahsni—soil moisture month omitted: 11/19, soil resistivity month omitted: 11/19, depth to GWT months omitted: 10/19–11/19.
Publisher’s Note: MDPI stays neutral with regard to jurisdictional claims in published maps and institutional affiliations.

