Article

Assessment of the Similarity of the Situation in the EU Labour Markets and Their Changes in the Face of the COVID-19 Pandemic

by
Beata Bieszk-Stolorz
* and
Krzysztof Dmytrów
Institute of Economics and Finance, University of Szczecin, 71-101 Szczecin, Poland
*
Author to whom correspondence should be addressed.
Sustainability 2022, 14(6), 3646; https://doi.org/10.3390/su14063646
Submission received: 2 March 2022 / Revised: 16 March 2022 / Accepted: 18 March 2022 / Published: 20 March 2022
(This article belongs to the Special Issue The Impact of COVID-19 Pandemic on Sustainable Development Goals)

Abstract

:
The aim of the study is to assess the similarity of the situation in the EU labour markets and their evolution using selected indicators in the period before and during the COVID-19 pandemic. The benchmark are the countries that most closely meet the Sustainable Development Goals related to the labour market. We use quarterly data from Eurostat presenting the basic indicators of the labour market: unemployment, employment, and activity rates. We analyse all indicators for the total population, young people, and people aged 55+. We assess the similarity of the situation using the TOPSIS method and similarity of changes by means of the Dynamic Time Warping. We obtain homogeneous groups of countries due to similarity of time series using hierarchical clustering. We conduct the analysis in two periods: the years 2018 and 2019 (pre-pandemic period) and from the beginning of 2020 to the present (pandemic period). The composition of the clusters in the pre-pandemic and pandemic periods is different. The impact of the COVID-19 pandemic on the situation in the labour market can be noted. This is a result of different degree of development of labour markets, which had an impact on coping with the effects of the crisis caused by the pandemic.

1. Introduction

The outbreak of the pandemic brought significant changes to the economic landscape at both national and international levels. Crisis-related policies have changed both economic behaviour and the labour market. From time to time, the world’s economies are shaken by the emergence of various crises. However, the challenges associated with the emergence of the COVID-19 pandemic are much higher than during previous crises. This is mainly caused by the fact that today’s world is much more globalised. The current pandemic has significant potential to slow down economic development and, in many cases, even lead to recession. The lockdowns and the uncertainty about of the outcomes of the pandemic have spread throughout society and compounded its negative economic impact [1].
One of the most important challenges facing policy makers is how to effectively govern the economy so as to minimise the negative impact of any restrictions [2,3]. The negative effects of the pandemic, which were first observed in China, have spread globally since 2020. China is a significant global commodity importer. The outbreak of the pandemic in China had a domino effect on the global commodity market, which in turn affected economic growth [4,5,6]. The negative effects included disruptions in global supply and demand chains and consequent disturbances in the supply of goods. In particular, lockdowns and suspensions of international travel resulted in decreased fuel consumption and consequently a lack of demand for oil [7]. The demand for energy has declined due to the partial cessation of industrial activities, stagnation in the transport sector (aviation, public, and individual transport), among other factors. Additionally, fluctuations in metal and agricultural commodity prices were much greater than they used to be in recent years [8]. Unconventional policy decisions introduced by national governments may have been more dangerous than the pandemic itself [9]. Western societies, including the European ones, appeared more vulnerable in the face of a new pandemic compared to Eastern ones [10]. Achieving sustainable development, with respect to the environment and economics has become quite a challenging task in recent years. This has been influenced by the recent economic crisis and the effects of climate change. In the context of the COVID-19 pandemic outbreak, sustainability can be considered not only from an economic or environmental point of view, but also from a public health perspective [11]. The pandemic crisis has demonstrated the existence of a complex set of inequalities that have emerged within the global system at different levels: the global economy and finance, healthcare, education, the judiciary, governance, the non-governmental sphere, public affairs, business and entrepreneurship, political rights and civil liberties, family life, etc. The downturn in industrial production and introduced restrictions hampering economic activity have particularly affected the labour market.
EU Member States have significant differences in the level of human development. A distinction has been made between dynamically developing regions and regions that differ significantly from this level [12,13,14,15,16,17]. In such situation, it is extremely important to constantly supervise changes in the level of social development of the EU countries and to determine the rank that a given country occupies in relation to the other ones.
The Sustainable Development Goals Report 2021 indicates that the COVID-19 crisis disturbed economic activities in the whole world and caused the strongest recession since the Great Depression [18]. Around 255 million full-time jobs were lost in 2020—about four times more than during the global financial crisis of 2007–2009. The pandemic has caused great risk to the workers in informal employment because they do not have protection against illness or lockdowns. The crisis affected young workers and women particularly strongly.
The aim of the study is the assessment of the similarity of the situation in the EU labour markets and their changes using selected indicators in the period before and during the COVID-19 pandemic. Therefore, two research questions arise:
  • Q1–Does the COVID-19 pandemic influence similarities of the labour markets in the EU countries?
  • Q2–Does the COVID-19 pandemic influence similarities of changes in the labour markets in the EU countries?
Until now, many scientific articles have appeared on the economic impact of the COVID-19 pandemic. These are mostly studies on individual countries or small groups of them. However, to our knowledge, there have been no published studies comparing time series for all EU countries before and during the pandemic. There is therefore a research gap in this area, which we are trying to fill with our study.
We refer our analysis to the benchmark countries, i.e., the ones that most closely meet the Sustainable Development Goals related to the labour market. We assess the similarity of the situation by using the TOPSIS method, and the similarity of changes by using the Dynamic Time Warping method. We obtain homogeneous clusters of countries due to time series similarity using hierarchical clustering.
The manuscript is organised as follows: Section 2 presents the literature review. In Section 3, we present the materials and research methods. Section 4 presents the results of empirical analysis. In Section 5, we present the discussion of obtained results. The manuscript ends with conclusions.

2. Literature Review

Achieving sustainable development worldwide requires a fair and balanced social and economic environment [19]. Barska et al. [20] assess the human development of EU countries in the background of sustainable development from 2014 to 2018. On the basis of their results, we can draw a conclusion that many countries experience positive trends that bring them closer to the successful implementation of the sustainable development paradigm. However, they are also observing unfavourable trends. In almost half of the EU countries, the percentage of poverty-stricken working people and the risk of poverty for older people (65+) increased between 2014 and 2018. The analysis also reveals that there are large discrepancies between the countries studied, relating to different areas of human development. They are particularly clear for labour market indicators. Sweden, Denmark, and The Netherlands are among the highest-ranking countries for several thematic areas. At the opposite end of the spectrum are Romania, Bulgaria, Greece, and Italy. In many countries, there are significant gaps between the thematic areas. They perform very well in some areas and very poorly in others. Every EU country has a room for improvement in at least one of the analysed areas, but there are also countries (e.g., Romania, Bulgaria, and Greece) that need to change and improve in all examined areas.
Sustainable economic development needs a well-balanced workforce of young and older people [21]. As the balance is moving towards older people, the productivity tends to suffer. Furthermore, the older people demand more from health services. The results show that there is a significant difference between the developed and developing EU countries. It suggests the need for specific policies and strategies for the labour market integration of older people. It also implies higher public health expenditures, which has consequences for EU labour market performance.
Crises of all kinds have a negative impact on labour market equilibrium. The recovery period poses significant risk for sustainable development goals. It is therefore important for communities in pandemic-affected countries to prepare for a return to sustainable growth. Kapecki [22] analyses the impact of environmental, financial, and humanitarian crises on sustainable development. He pays particular attention to the financial crisis of 2007 and the crisis caused by the outbreak of the COVID-19 pandemic.
Since the onset of the pandemic, various studies have been carried out on its impact on the economies of particular countries and the world economy. As the pandemic continues to develop, the results of early studies are also changing. Studies on the negative impact of the pandemic on global GDP have started to appear in the global literature [23,24,25,26,27] and on financial performance on global stock exchanges [28,29,30,31,32]. In line with previous literature [33,34], the COVID-19 pandemic can trigger financial panics and lead governments to adjust their economic policies, as in other crisis periods [35].
Su et al. [36] (2022) analyse the relation of COVID-19 to corporate sustainability from the point of view of both internal organization and external social environment. They attempt to analyse and find implications for companies and society to better cope with crises and achieve sustainable development in the post-pandemic era. They conclude that if enterprises aim at maintaining sustainable development in the post-COVID-19 era with coexistence of challenges and opportunities, they must have full integration of internal and external resources. They should also rely on digital transformation to achieve survival, development, and upgrade. The pandemic causes many negative emotions amongst employees such as loneliness, anxiety, fear, worry, or collapse. This, in turn, affects job performance and employee satisfaction, then poses dangers to sustainable human resource management.
In analyses related to the impact of COVID-19 on the economic and financial situation, a trend of research on the impact of COVID-19 on the labour market has emerged. In times of crisis, the labour market becomes one of the first to experience severe turbulence. Employability is one of the parameters that has changed significantly due to the existence of the global health crisis. People employed in flexible forms of employment, which are hardly subject to any legal protection, are the first to lose their jobs [37,38]. Informal workers, youth, and women [39], as well as small traders, the self-employed, migrant workers, and daily wage earners [40] were the first to experience employment problems. Nivakoski and Mascherini [41] note that the COVID-19 may have had a different impact on gender equality than previous recessions. Emerging evidence suggests that women’s paid work has declined in many countries due to both labour demand and labour supply factors. Demand for labour declined because women’s work is often associated with close contact with other people, for example hospitality, travel, personal care, and cleaning. These are the industries for which activities were significantly reduced at the start of the pandemic. Botha et al. [42] showed the significant negative relationship between labour market shocks triggered by the COVID-19 crisis and financial wellbeing. They show these labour market shocks are disproportionately felt by people at the lower end of the financial wellbeing distribution. In 2020, the tourism industry was particularly affected, including that in European countries. Changes in the number of arrivals and overnight stays were related to the degree of restrictions imposed [43].
Svabova et al. [44] analyses changes in unemployment in the Slovak Republic due to the impact of the anti-spreading regulations adopted by the government. The authors showed that the reduction in economic activity of firms operating in Slovakia resulted in a decrease in consumer demand, which put pressure on employers to reduce costs through lay-offs. This resulted in an increase in unemployment. The restrictions adopted to prevent the spread of COVID-19 had a negative impact on the Slovak labour market.
Many analyses highlight the major change brought about in the EU-27 by ‘teleworking’ and the instability of traditional jobs in the new context based on digitisation [45,46,47,48]. This situation was exacerbated during the pandemic period. The empirical findings point to a situation of deep economic crisis generated by the economic downturn and high unemployment rates in the EU-27.
Galik et al. [49] assess labour market flexibility using the TOPSIS method and multi-criteria decision analysis (MCDA) methods. The processes of sustainable industrial relations are considered in the context of shaping labour market flexibility in 15 European Union countries between 2009 and 2018. Their results indicate that the TOPSIS method is a suitable approach for measuring labour market flexibility on the international scale. Moreover, with regard to labour force phenomena, this method provides an opportunity to examine the impact of individual factors related to social and employment policies in the context of sustainable development and socio-economic growth. The lack of precise tools for forecasting the development of national and transnational labour markets, especially in the COVID-19 era, highlights the importance of such a method for planners and policy makers.
The empirical study by Gavriluta et al. [50] presents the situation of employability in the EU-27 under the conditions of the COVID-19 pandemic. The crisis caused by the pandemic highlights existing differences in the labour market in different regions of Europe. These differences have often increased under the influence of regulations introduced by national governments. The socio-economic category most affected by the economic impact of the COVID-19 pandemic is young people with primary or secondary education. In their conclusions, the authors stress that such phenomena as an increase in education levels and a reduction in gender inequalities and material and social deprivation should be correlated with economic freedom and increased opportunities for entrepreneurship. Such measures are beneficial in the context of sustainable development in the EU.
An interesting study is conducted by Guo et al. [51] on the economic impact on COVID-19 vaccination rates in the USA. They find that there is positive correlation between both the county-level per capita income and county-level unemployment rates and county-level COVID-19 vaccination rates across the U.S. However, these associations are divergent with respect to race/ethnicity.

3. Materials and Methods

3.1. Materials

We use the quarterly Eurostat data for all 27 EU member states, available online at: https://ec.europa.eu/eurostat/web/main/data/database (accessed on 7 February 2022). The data cover the basic indicators of labour market:
  • unemployment rate;
  • activity rate;
  • employment rate.
We consider every indicator for the total population, for young people (aged 15–24 years), and for people aged 55 years or more. The only exception is the unemployment rate, which excludes the data for people aged 55 years or more. The reason for this is the lack of data for Malta and Luxembourg. The data cover the period starting at the 1st quarter of 2018 and ending at the 3rd quarter of 2021. We divide the period into two sub-periods. The first (1st quarter 2018–4th quarter 2019) is the pre-pandemic period, and the second (1st quarter 2020–3rd quarter 2021) is the pandemic period.
We consider the countries that closely meet the Sustainable Development Goal (SDG) related to the labour market as the benchmark ones. The SDG that includes the indicators related to the labour market is the SDG8 (Promote sustained, inclusive, and sustainable economic growth, full and productive employment, and decent work for all). SDG8 is one of the 17 Sustainable Development Goals (SDGs) that were established by the United Nations General Assembly in 2015 [52]. Progress towards the goals is measured, monitored, and evaluated through 17 indicators. SDG8 has a total of twelve targets. These are: sustainable economic growth (8.1); diversify, innovate, and upgrade for economic productivity (8.2); promote policies to support job creation and growing enterprises (8.3); improve resource efficiency in consumption and production (8.4); full employment and decent work with equal pay (8.5); promote youth employment, education, and training (8.6); end modern slavery, trafficking, and child labour (8.7); protect labour rights and promote safe working environments (8.8); promote beneficial and sustainable tourism (8.9); universal access to banking, insurance, and financial services (8.10); increase aid for trade support (8.a); and develop a global youth employment strategy (8.b). SGD8 is the aspiration that the economic sector of each country should provide its citizens with the necessary needs for a good life, regardless of their origin, race, or culture. As we wish to assess the SDG indicators for every analysed quarter, we select the following, as only they were available in the form of quarterly data:
  • young people neither in employment nor in education or training (NEET);
  • employment rate;
  • long-term unemployment rate.

3.2. Methods

We perform the analysis in the following steps:
  • By means of the TOPSIS method, we create the ranking of the countries with respect to fulfilment of the sustainable development goals regarding the labour market. The best countries in the whole period create the benchmark.
  • For every quarter, by means of the TOPSIS method, we assess the situation of the EU countries in their labour markets, using unemployment, activity, and employment rates for total population, for young people, and for people aged 55 years or more.
  • With respect to the values of the TOPSIS measure, we select the groups of countries with very good, rather good, rather poor, and very poor situation in their labour markets.
  • We analyse similarities of time series of the situation in the labour markets (assessed by the TOPSIS method) between the countries by means of the Dynamic Time Warping (DTW) method in the pre-pandemic and pandemic periods.
  • The similarities between the time series are assessed by means of the DTW distance.
  • The DTW distance is then used in hierarchical clustering to distinguish the homogeneous clusters of countries with respect to similarity of changes of the situation in their labour markets in both pre-pandemic and pandemic periods.

3.2.1. The TOPSIS Method

The TOPSIS (Technique for Order of Preference by Similarity to Ideal Solution) is the technique created for the need of the multi-criteria decision making. It is, however, also widely used in the multivariate statistical analysis. It was created by Hwang and Yoon [53] and is based on the weighed distance of each object (in our case country) from the so-called pattern (i.e., the best values of variables in the dataset) and from the anti-pattern (i.e., the worst values of variables in the dataset).
A starting point of the TOPSIS method is the observation matrix X :
X = x 11 x 12 x 1 m x 21 x 22 x 2 m x n 1 x n 2 x n m
where x i j is the value of j-th variable in i-th object ( i = 1 , , n , j = 1 , , m ), m is the number of variables, and n is the number of objects.
As all variables in our dataset are measured on the ratio scale, we can normalise them by means one of the quotient inversions (such normalisation method preserves the scale strength):
z i j = x i j i = 1 n x i j 2
where z i j is the normalised value of j-th variable in i-th object ( i = 1 , , n , j = 1 , , m ).
The next step of the TOPSIS method is determination of weights. The problem of determining the variables’ weights is not an easy task. There is also no single method of weights determination recognised as best. We can assign weights of variables statistically (on the basis of variables’ dispersion, mutual correlations, or entropy measures) or by using the expert methods. The first method would cause weights in every analysed period to be different, and the second would indicate a high degree of subjectivism. If there is no clear indication that some variables are more important than the others, we should assume equal weights.
We multiply the normalised values of variables by their weights, thus creating the weighed, normalised observation matrix:
t i j = w j z i j , i = 1 , , n , j = 1 , , m
where w j = 1 m are the variables’ weights ( j = 1 , , m ) .
In the next step of the TOPSIS method we calculate the pattern ( A b ) and the anti-pattern ( A w ):
A b = max i t i j | j J + , min i t i j | j J | i = 1 , , n = t b 1 , , t b j , , t b m
A w = min i t i j | j J + , max i t i j | j J | i = 1 , , n = t w 1 , , t w j , , t w m
where J + indicates stimulants (variables for which the highest values are the most desirable) and J indicated destimulants (variables for which the lowest values are the most desirable).
Next, we calculate the weighed distances of each object from the pattern ( d i 0 + ) and anti-pattern ( d i 0 ) by means of the Euclidean metric:
d i 0 + = j = 1 m t i j t b j 2 , i = 1 , , n
d i 0 = j = 1 m t i j t w j 2 , i = 1 , , n
Finally, we calculate the composite measure q i :
q i = d i 0 d i 0 + d i 0 + , i = 1 , , n
The composite measure q i has the following properties: q i [ 0 , 1 ] , max i q i —the best object, and min i q i —the worst object.

3.2.2. The Dynamic Time Warping Method

The Dynamic Time Warping (DTW) method was invented by Bellman and Kalaba [54]. Originally, it was used for speech recognition problems [55,56,57]. Other fields of its application include music information retrieval [58], gesture recognition [59], or in bioinformatics [60]. It is now more and more often used in research on time series describing economic and social phenomena. Landmesser [61] uses it to find similarities in time series describing the dynamics of the number of cases and deaths of COVID-19 in the provinces of Poland. Dmytrów and Bieszk-Stolorz [62] look for correlations and links between unemployment rates and unemployment duration in the Visegrad countries. Dmytrów et al. [63] assess the links between the number of COVID-19 cases and the energy commodity sector. Denkowska and Wanat [64] use the DTW algorithm to group insurance institutions by the similarity of their contribution to systemic risk, as expressed by DeltaCoVaR. Stübinger [65] uses the DTW method to find optimal causal path algorithm for the minute-by-minute data of the S&P 500 constituents from 1998 to 2015.
By using the DTW algorithm we can measure similarity between two time series. The DTW method looks for an optimal alignment between them by using the dynamic programming. The alignment is described by a given scoring function. Let X = ( x 1 , x 2 , , x N ) and Y = ( y 1 , y 2 , , y M ) be two time series. In order to be able to compare them, both time series must be normalised. The most frequently used method is z-normalisation. The need for normalisation of time series is often highlighted in classification or clustering methods with the DTW and other distance measures [66,67].
Next, we define the local cost measure for two elements of X and Y by means of the equation:
c x i , y j = x i y j , i = 1 , , N , j = 1 , , M
We calculate this measure for every pair of elements of X and Y, thus obtaining the local cost matrix L C M R N × M . The optimal alignment between time series X and Y is the one having minimal overall cost.
The point-to-point match between the time series X and Y is represented by the time warping path. It is a sequence p = ( p 1 , , p L ) , where p l = ( n l , m l ) { 1 , , N } × { 1 , , M } for l { 1 , , L } L max ( N , M ) , , N + M 1 . The sequence satisfies three conditions: boundary, monotonicity, and step size conditions [68]. The boundary condition ensures that the first and the last element of p are p 1 = ( 1 , 1 ) and p L = ( N , M ) , respectively. It means that the first (last) index from the first sequence must be matched with the first (last) index from the second one. The monotonicity condition ensures that the path always moves up, right, or up and right of the current position, i.e., p l + 1 p l ( 1 , 0 ) , ( 0 , 1 ) , ( 1 , 1 ) for l = 1 , , L 1 . The step size condition ensures that every index from the time series X must be matched with one or more indices from the time series Y (and vice versa).
The optimal match is the one that satisfies all the above-mentioned conditions and that has the minimal total cost. The total cost c p ( X , Y ) of a warping path p is defined as:
c p ( X , Y ) = l = 1 L c ( x n l , y m l ) = l = 1 L x n l y m l
The optimal match between X and Y is then:
D T W ( X , Y ) = c p * ( X , Y ) = min c p ( X , Y ) | p P
where P is the set of all possible warping paths.
By means of the DTW algorithm, we find the path that minimises the alignment between X and Y. It iteratively steps through the local cost matrix and aggregates the cost. We find the optimal path p * by using a dynamic programming algorithm. The obtained value D T W ( X , Y ) is the measure of distance between the time series X and Y.
We use obtained by the Equation (11) distances between all time series to create the dissimilarity matrix. In the next step, we use this matrix in agglomerative hierarchical clustering of time series [69]. Its main advantage is the visualisation capabilities. In our research we use the Ward’s method to minimise the variance within the clusters. We check the robustness of the clustering algorithm and set the number of clusters by means of the silhouette index.
Clustering methods are used in many economic and social issues. Rozmus [70] uses different measures of stability to group EU member states by their level of sustainability. Zalewska [71] uses cluster analysis to identify and compare determinants influencing the opinion of students and lecturers on the evaluation of the possibility and effectiveness of introducing the CQI system in Polish higher education. Sikora-Alicka [72] performs a comparative analysis of Polish teaching hospitals. The aim of her study is to confirm the thesis that teaching hospitals, despite significant organisational and functional differences, due to the specificity of their activities, do not differ significantly in the structure of generated costs. Małkowska et al. [73] use the TOPSIS method and cluster analysis to measure and assess the impact of digital transformation on the EU countries. Roman et al. [43] use cluster analysis to group European countries in terms of changes in tourism due to the outbreak of the pandemic.

4. Results

4.1. Sustainable Development Goals Related to Labour Market

In the first step of the analysis, we create the ranking of countries with respect to fulfilment of the sustainable development goals (SDG) regarding the labour market. We consider the following variables: young people neither in employment nor in education or training (NEET) ( S D G 8 1 ) , employment rate ( S D G 8 2 ) , and long-term unemployment rate ( S D G 8 3 ) . Variables S D G 8 1 , S D G 8 2 , and S D G 8 3 are related to the implementation of SDG8 targets 8.5 and 8.6 and relate directly to the labour market. The first and the third variables are the destimulants, while the second is the stimulant. We set the pattern and anti-pattern values for the whole period (Table 1).
The best (pattern) value of the percentage of NEETs (5.0%) is in the first quarter of 2020 in the Netherlands and the worst (anti-pattern) (24.4%) in the second quarter of 2020 in Italy. The best value of the employment rate (71.5%) is in the third quarter of 2021 in the Netherlands and the worst (43.3%) in the second quarter of 2020 in Greece. The pattern value of the long-term unemployment rate (12.5%) is observed in the third quarter of 2019 in Sweden and the anti-pattern (73.1%) in the third quarter of 2018 in Slovakia. For the the percentage of NEETs and the long-term unemployment rate, the relative differences between the best and the worst values are very large. The best value of the former is just above 1 5 of the worst and for the latter this ratio equals about 1 6 .
We then apply the Equations (1)–(8) to calculate the TOPSIS measure for every quarter of the analysed period. Having calculated the TOPSIS measures, for every quarter we calculate the median ( M e ), the first ( Q 1 ) and the last ( Q 3 ) quartile, and divide the countries into four groups (Table 2).
The countries, for which the TOPSIS measure calculated for labour market variables that are related to SDGs falls in the first interval— ( Q 3 , 1 ] in the largest number of quarters of the analysed period, create the benchmark.
In the whole analysed period (first quarter 2018–third quarter 2021) we can distinguish four countries that fulfil the sustainable development goals related to the labour market to the highest degree—Denmark, The Netherlands, Finland, and Sweden. Therefore, we treat these countries as the benchmark in further analysis. It is also worth noting that, on the other side, there are countries with very low fulfilment of the SDGs—Bulgaria, Greece, Spain, Italy, Romania, and Slovakia. These countries have the lowest degree of fulfilment of SDGs related to the labour market in the whole analysed period. We present the results of grouping countries with respect to the fulfilment of the SDGs related to the labour market in Table 3.

4.2. Assessment of the Situation of EU Countries in Their Labour Markets

We use the following variables for assessment of the situation in the labour markets of the EU countries:
  • x 1 —total unemployment rate (in %);
  • x 2 —unemployment rate for people aged 15–24 years (in %);
  • x 3 —total activity rate (in %);
  • x 4 —activity rate for people aged 15–24 years (in %);
  • x 5 —activity rate for people aged 55 years or more (in %);
  • x 6 —total employment rate (in %);
  • x 7 —employment rate for people aged 15–24 years (in %);
  • x 8 —employment rate for people aged 55 years or more (in %).
Many authors also identify other indicators of labour market conditions, including job finding and separation rates, job vacancy rate, long-term unemployment rate, hours of work, wages and compensation costs, labour productivity, and employment in the informal economy [74,75]. However, including them in our analysis is impossible for two main reasons. First, they are not always quarterly, but annual data. Second, they are not available for all EU countries. As the time series used must be complete due to the methods used, we have decided to limit ourselves to only the selected variables.
In order to initially assess the general situation in the labour market in the EU, we present some basic descriptive statistics (arithmetic mean, standard deviation, coefficient of variation, median, skewness, minimum, and maximum) for total unemployment, activity, and employment rates in Table A1, Table A2 and Table A3 in Appendix A. The average and median values of analysed variables had been improving during the pre-pandemic period. When the state of the pandemic was declared (11 March 2020), the indicators had begun to deteriorate and reached their worst values in the third quarter of 2020. The general situation then started to improve. All analysed indicators reached the best values in the whole analysed period in the third quarter of 2021. We may have been observing a revival from the recession caused by the COVID-19 pandemic. However, further data on the situation in the EU labour market are rather unclear due to the ongoing war in Ukraine.
The unemployment rate has much higher volatility than the activity and employment rates. It means that there is much higher difference between the best (Czechia, Germany, and The Netherlands) and the worst (Greece, Spain, or Italy) countries. Additionally, in case of Greece and Italy, we can observe high, outlying values of the unemployment rate. This causes a high, positive skewness of the distribution of this indicator. In case of the activity and employment rates, the distributions have moderate, negative skewness.
The pattern and anti-pattern values for all variables in the whole period are presented in Table 4.
The best values of the unemployment rates (total and for young people) are in Czechia (in the whole year 2019 and in the first quarter of 2020 for the former and in the fourth quarter of 2019 for the latter). The worst values of the unemployment rates are in Greece (in the first quarter of 2018 for both rates). The pattern values of activity and employment rates for total population and for young people are in the Netherlands (all of them in the third quarter of 2021), while the pattern values of these indicators for people aged 55 years or more are in Sweden (for activity rate in the fourth quarter of 2020 and for employment rate in the fourth quarter of 2018). The anti-pattern value of total activity rate is in Italy (in the second quarter of 2020), activity rate for young people in Bulgaria (in the third quarter of 2021) and activity rate for people aged 55 years or more in Romania (in the second quarter of 2018). The worst values of total employment rate and employment rate for young people are in Greece (both in the second quarter of 2020), employment rate for young people in and employment rate for people aged 55 years or more in Romania (in the second quarter of 2018). Interestingly, we cannot say that the pandemic period has brought a worsening of the labour market indicators—in 6 out of 8 cases, the best values have been achieved during the pandemic period. In half of cases, the worst values of indicators have happened in the pre-pandemic period.
In addition, as in the case of indicators related to the sustainable development goals, the differences are sometimes very high. Such a situation is the case of total unemployment rate (the worst value is over 10 times higher than the best one) and unemployment rate for young people (the worst value is almost 9 times higher than the best one).
We now repeat the TOPSIS method for the variables describing the situation in the labour market. After applying Equations (1)–(8) and calculating the TOPSIS measure, we obtain the assessment of the situation in the labour market. We then calculate median and quartiles for every quarter in the analysed period and create the groups of countries. The intervals are the same as in Table 2. However, in case of the assessment of the situation, the groups are as follows: A—very good situation, B—rather good situation, C—rather poor situation, and D—very poor situation. We present the results in Table 5.
Denmark, Germany, Malta, The Netherlands, and Austria are amongst the countries with the best situation in their labour markets in the whole analysed period (in both pre-pandemic and pandemic periods). On the other hand, Greece, Spain, Croatia, Italy, and Romania are the countries with the worst situation in the whole analysed period. When we compare the results of analysis of the situation in the labour markets to fulfilment of SDGs, it turns out that the best situation does not always correspond with the highest fulfilment of the SDGs. Denmark and The Netherlands are the countries with the best outlook with respect to both their labour markets and fulfilment of SDGs (in the whole analysed period). Finland and Sweden are always among the best with respect to fulfilment of the SDGs, but not in the case of their general situation in their labour markets. Interestingly, their situation changes in different directions. Finland, since the beginning until the end of 2nd quarter 2020, is in group “B” and in group “A” afterwards, while Sweden is in group “A” until the 2nd quarter 2019, in group “B” afterwards and until the end of the 2nd quarter 2021. In the last analysed period, it falls into the group “C”. It is mostly caused by relatively high (as compared to the best countries) unemployment rates. Finland’s situation improves mostly due to increase in activity and employment rates.
Germany, Malta, and Austria—the remaining countries with the best situation in their labour markets—are not in the group of countries with the highest degree of fulfilment of the SDGs. Germany is with this respect in the group “B”, or “C” (there is no difference in the pre-pandemic and pandemic periods). Malta’s membership varies from “A” to “C” (also with no relation to the existence of the pandemic), and Austria’s from “A” to “B” (also with no relation to the existence of the pandemic).
The majority countries with the lowest fulfilment of the SDGs during the whole period (Greece, Spain, Italy, and Romania) also have the worst situation in their labour markets. For the remaining countries with lowest degree of fulfilment of SDGs (Bulgaria and Slovakia), their general situation in their labour markets is generally better.
There are several interesting cases for which there is high discrepancy between fulfilment of the SDGs and situation in their labour markets. The first is Germany. When we consider the degree of fulfilment of SDGs, Germany did not place in the best group in any of the analysed quarters. However, when we look at their situation in the labour market, it was always in the best group. The opposite situation occurs in the case of Luxembourg. This country was, in most of analysed quarters, amongst the countries with the highest degree of fulfilment of the SDGs. When we consider its situation in the labour market, it was generally in the group of countries for which the situation was generally poor.
For most countries, we can hardly see the difference in membership of countries to specific groups of countries with respect to their situation in their labour markets. There are several countries where this difference can be seen. France and Finland, in the pandemic period, moved to the groups with better situation in their labour markets. For Sweden, the situation was the opposite. Therefore, for the majority of cases, we should answer the research question Q1 negatively.

4.3. Analysis of Changes of Situation of EU Countries in Their Labour Markets

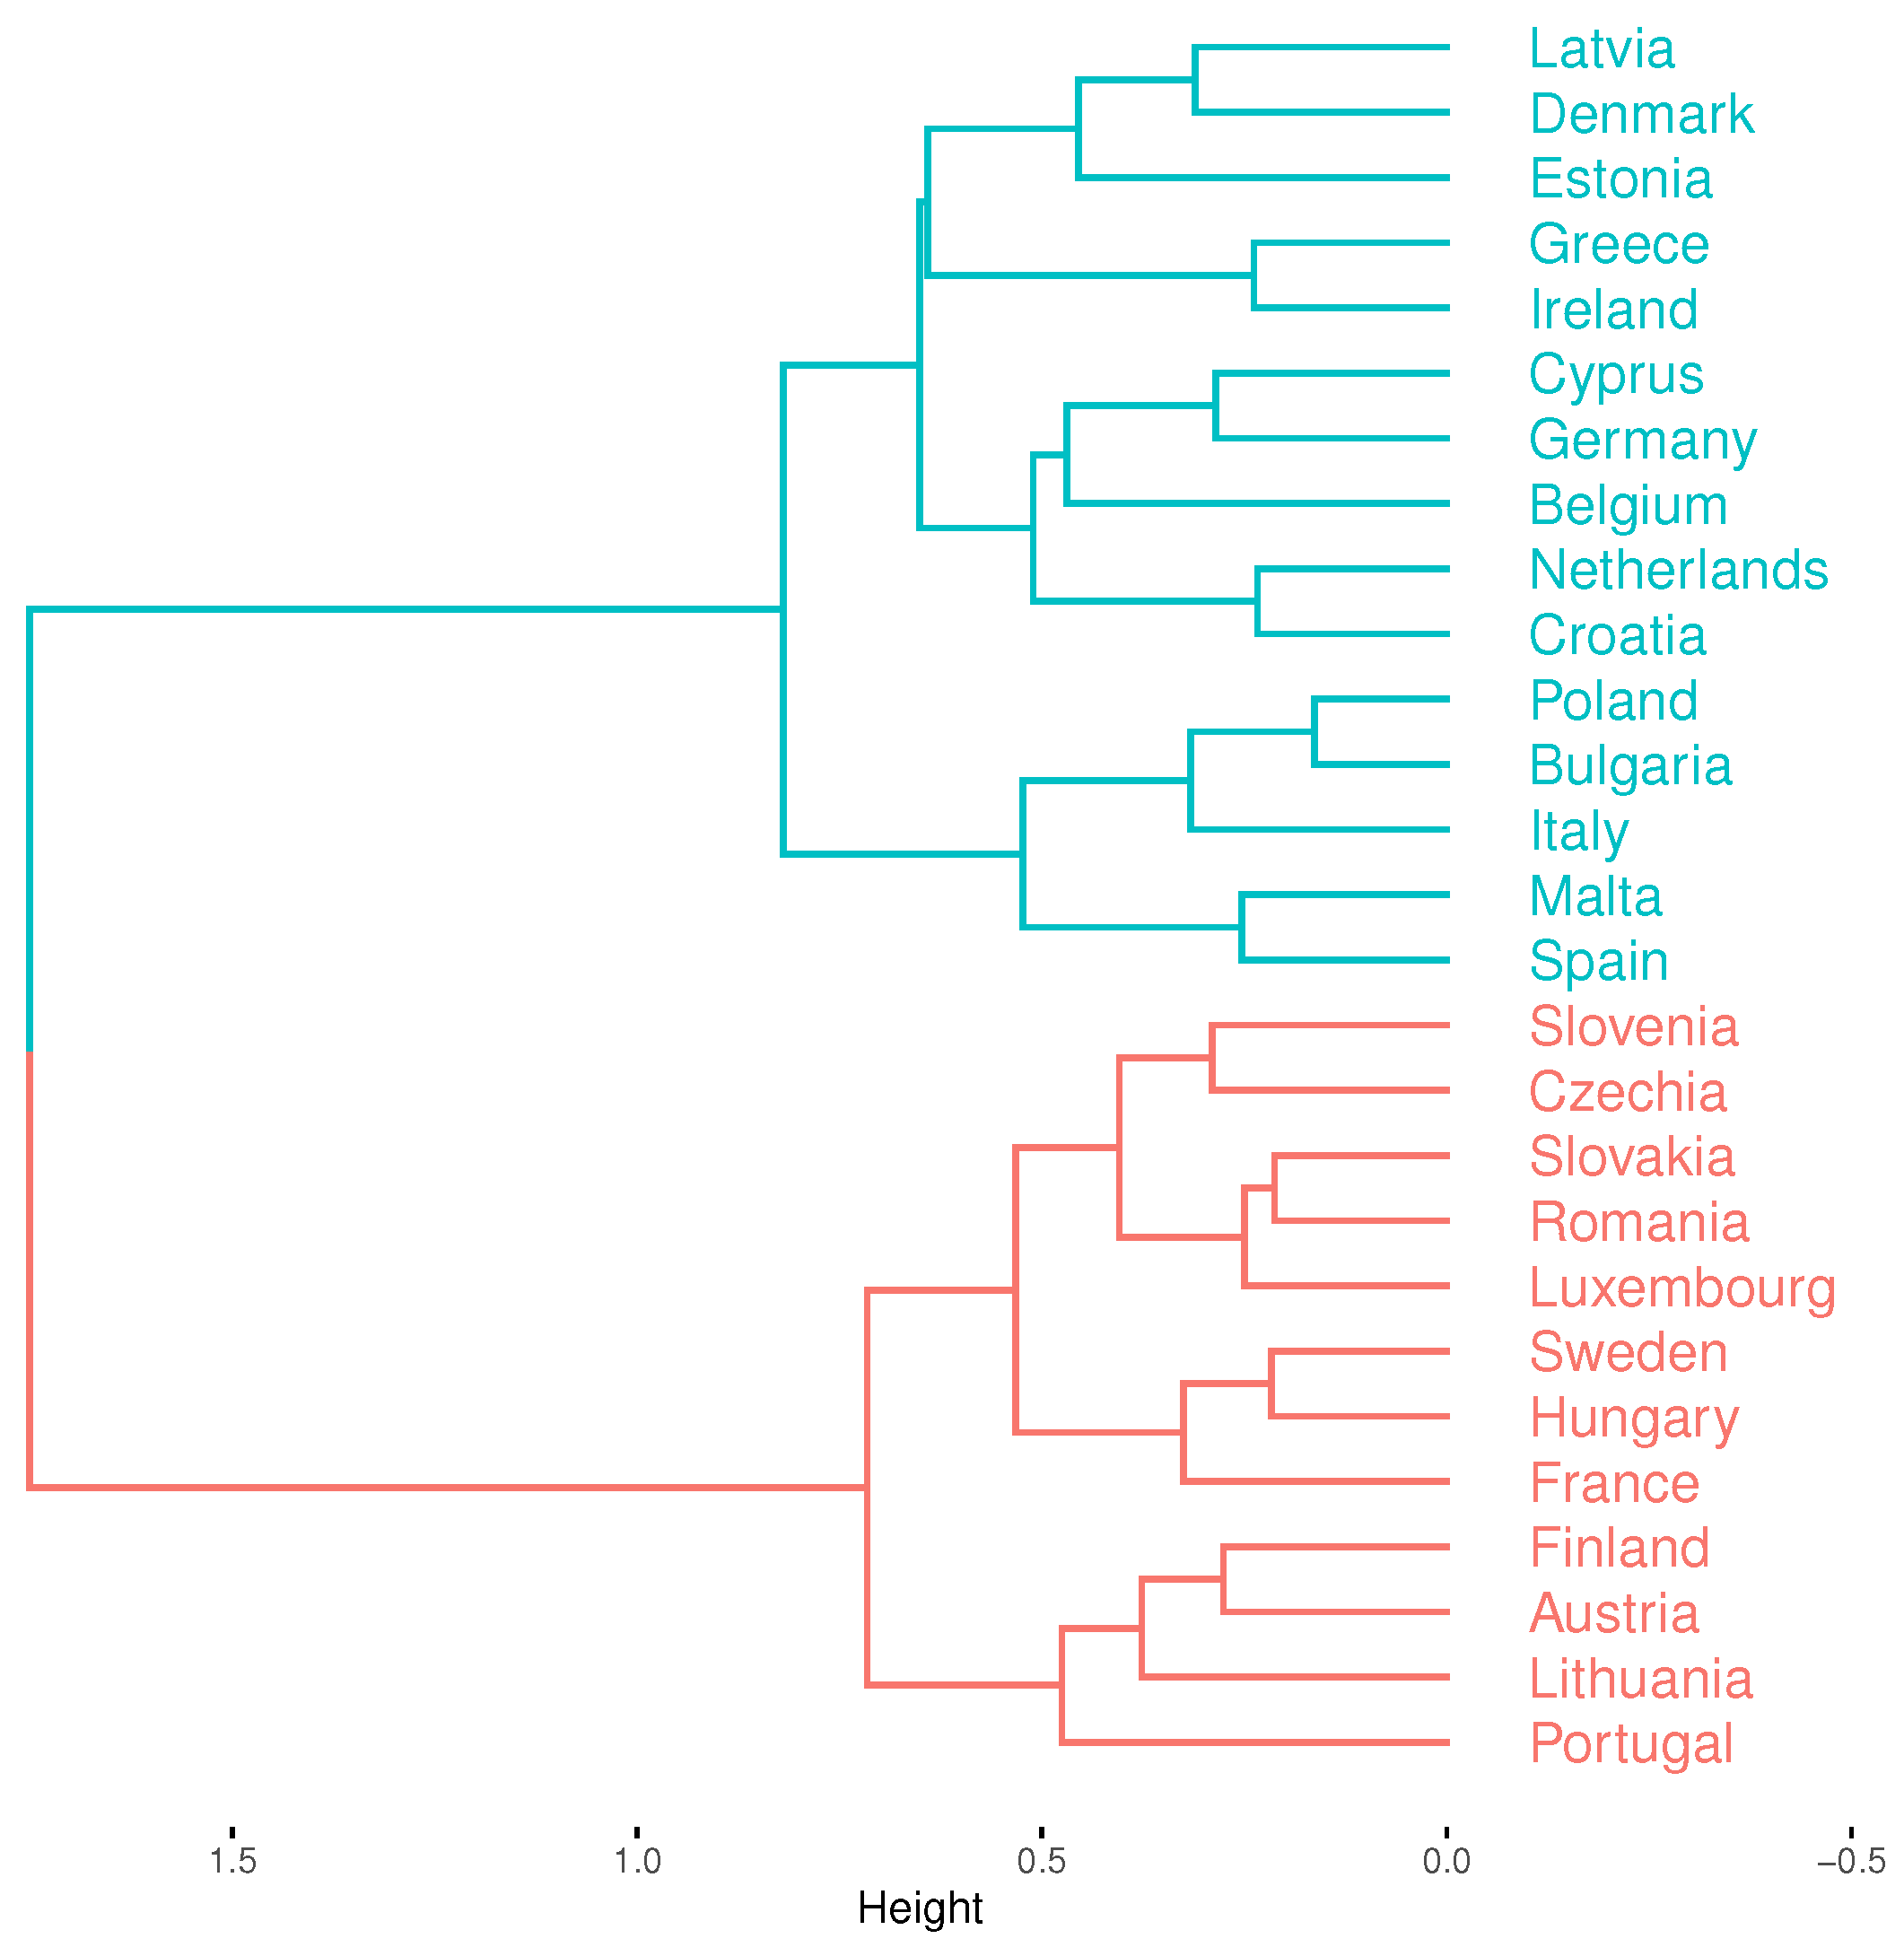
We make pairwise comparisons of time series with synthetic TOPSIS measure between all EU countries. We make these comparisons in two periods: pre-pandemic and pandemic ones. We then estimate the DTW distance matrices for these two periods. On their basis, we perform the hierarchical cluster analysis. For the pre-pandemic period, we present the clusters of countries with respect to their situation in their labour markets in Figure 1.
We can distinguish the two clearly separated clusters of countries. The first, slightly bigger (coloured blue), contains countries where the situation in their labour markets in the pre-pandemic period was generally at the constant level. The second, smaller cluster (coloured red) contains countries where the situation in their labour markets deteriorated. If we consider the benchmark countries (these with the highest degree of fulfilment of the SDGs), two of them (Denmark and The Netherlands) are in the first cluster, and the remaining two (Finland and Sweden) are the members of the second cluster.
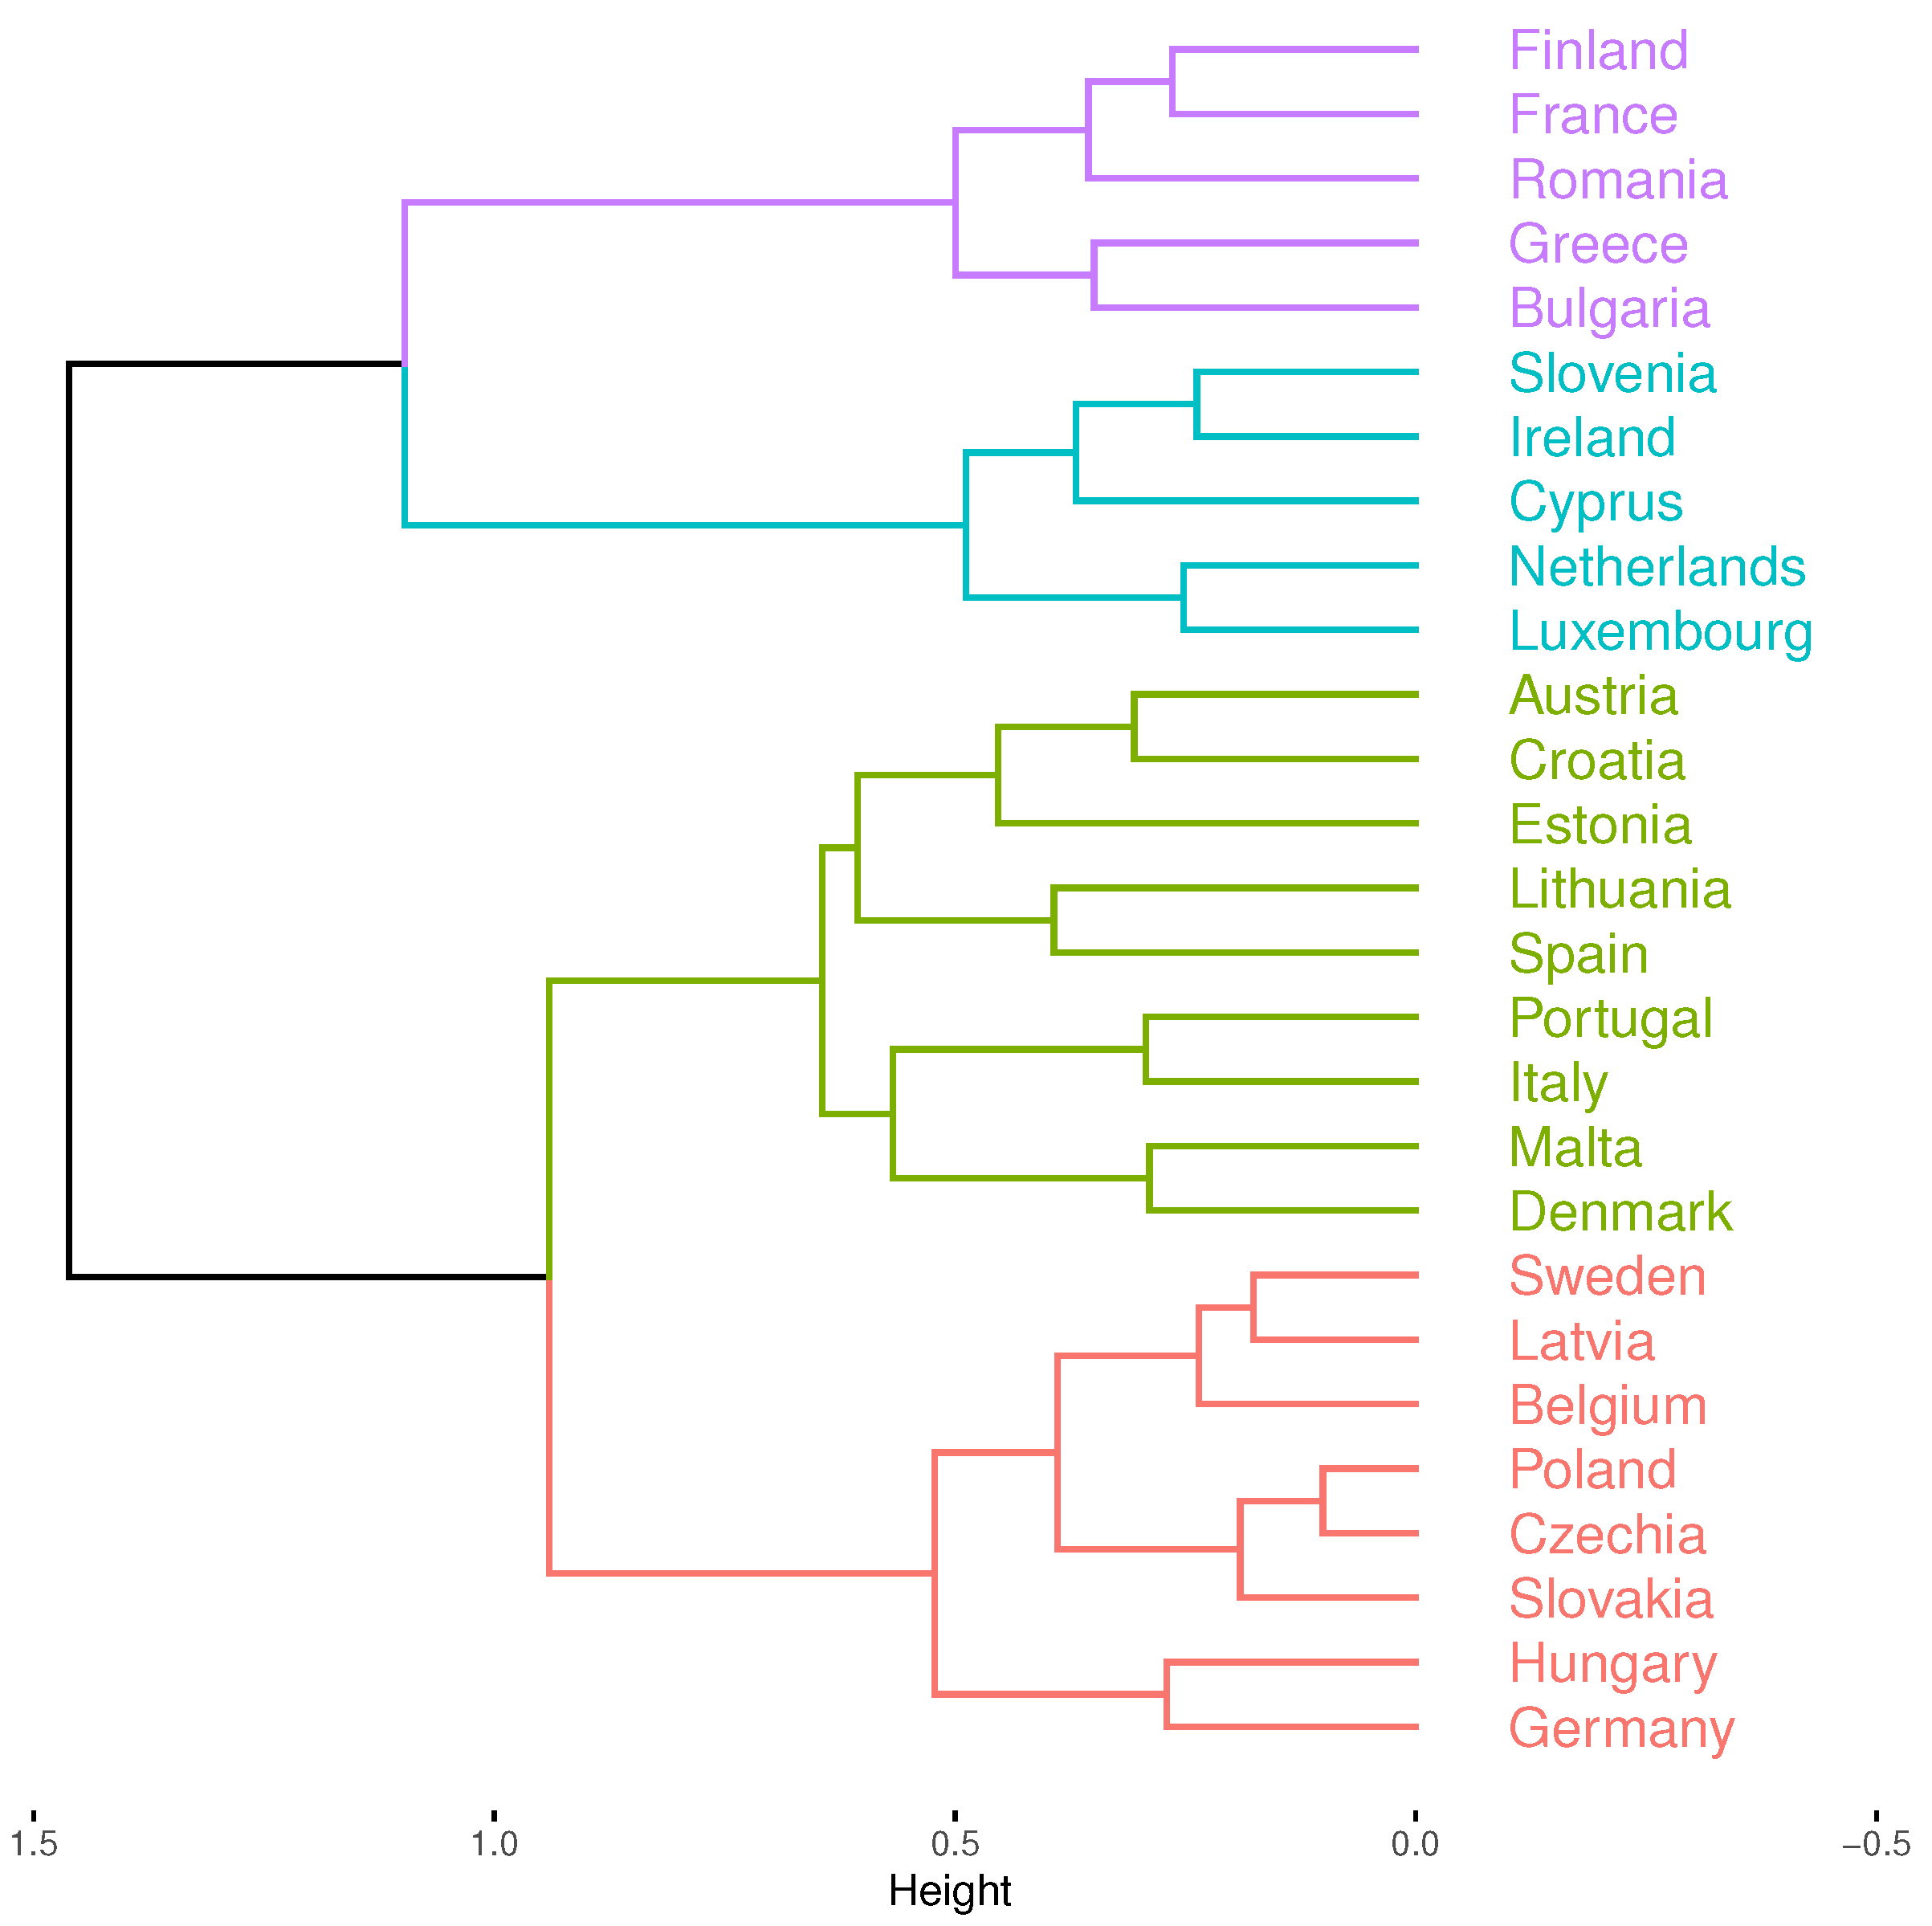
We present the clusters of EU countries with respect to change of situation in their labour markets in the pandemic period in Figure 2.
In the pandemic period we can distinguish four clusters of countries. The first, coloured purple, contains countries for which the situation was generally stable during the whole pandemic period. The second cluster (coloured blue) consists of countries in which the situation deteriorated at the beginning and increased at the end of the analysed period. The third cluster (coloured green) consists of countries in which the situation in their labour markets fluctuated during the whole pandemic period. Finally, the fourth cluster (coloured red) consists of countries in which the situation slightly deteriorated during the pandemic period.
When we look for the benchmark countries (those which have the highest degree of fulfilment of labour market related sustainable development goals), we can see that Finland, The Netherlands, Denmark, and Sweden are in the first, second, third, and fourth cluster, respectively.
The number and composition of clusters with respect to changes of the situation in their labour markets are different in the pre-pandemic and the pandemic periods. In addition, the direction of changes of the situation for many countries was different during the pre-pandemic and the pandemic periods. The examples of such countries can be found in the second (coloured red) cluster in the pre-pandemic period—Sweden, Romania, or France. These countries were characterised by a slightly deteriorating situation in their labour markets. In the pandemic period, their situation stabilised. When we look at the first cluster in the pre-pandemic period (coloured blue), there are countries (Poland, Belgium, Germany, and Latvia) in which the situation in their labour markets was stable, while during the pandemic period they were in the cluster with the countries in which the situation had deteriorated.
For the pre-pandemic period, we obtain the optimal (highest) value of the silhouette index for two clusters. In the pandemic period, the highest value of the silhouette index is in case of four clusters. Therefore, we set the number of clusters in both periods correctly.
When we analyse the membership to clusters in the pre-pandemic and the pandemic periods, there are clear differences in both similarities between countries and the number of clusters. Therefore, the answer to the research question Q2 should be affirmative.

5. Discussion

Our research covers a limited set of variables, as only these ones are available on a quarterly basis. Our results with respect to the fulfilment of the sustainable development goals (Table 3) are, however, similar to research conducted by Jianu et al. [76]. They apply the hierarchical clustering and analyse the labour market inequalities—SDG8 (Promote sustained, inclusive, and sustainable economic growth, full and productive employment, and decent work for all) indicators. Countries that are the benchmark in our research (Denmark, Finland, The Netherlands, and Sweden) are also in the same cluster in their research. Therefore, we may confirm that the benchmark countries have been selected properly.
We can compare our results to the previous ones we obtained using the multidimensional scaling [77] and the clustering with the use of the DTW method [78] in the pre-pandemic period. These analyses use yearly data and the different set of variables (total, young, and long-term unemployment rates, median unemployment duration, total employment and activity rates, duration of working life, and age dependency ratio). Analysis with the use of multidimensional scaling [77] indicates that, even with the different set of variables, the same countries (Denmark, Germany, The Netherlands, Finland, Sweden, Czechia, or Estonia) are among the best and the same (Greece, Italy, Spain, or Croatia) are classified as the worst (of course, these data refer to a similar period—2018–2019). Rollnik-Sadowska and Jarocka [79] perform similar analysis for year 2019 for Central European and Eastern (CEE) countries. Our results confirm their research—Czechia, Estonia, and Poland are among the countries with the best situation in their labour markets, while Bulgaria, Croatia, Romania, and Slovakia are among the countries with the worst situation in their labour markets.
When we compare the analysis of changes in the situation in the labour markets obtained on the different set of variables in the pre-pandemic period [78] with the present research, we can see many similarities. In both analyses, the countries (especially those with the best and the worst situation) are in the same respective clusters.
The labour market situation affects the size of the living cost gap, i.e., the differential between income, expenditure, and poverty lines. This gap tends to widen as a result of economic crises and recessions [80,81,82,83]. Comparing the results of our study with the research presented by Kucčas et al. [84], it can be seen that the obtained clusters do not overlap. This indicates that the labour market situation is not the main determinant of the living cost gap, which is also strongly influenced by factors such as the level of GDP, trade flows, migration, and savings.
Economic convergence is a declared objective of the EU. It is considered a fundamental mechanism for achieving socio-economic cohesion. For example, the 2007 economic crisis had an uneven impact on EU countries and brought the process of economic and social convergence to a halt [85]. In our study, the clusters formed do not show an east–west or north–south geographical pattern. The identified groups include both highly developed and developing countries. Similar observations are made by Lafuente et al. [85] when analysing convergence in poverty and social exclusion indicators for EU countries. They show that convergence in each identified cluster tends to be in a catching-up process, with eastern countries coming closer to their western counterparts.
The COVID-19 pandemic has shown that people with digital skills quickly adjust to new situation. The economies need to be urgently reshaped in order to follow up-to-date technological trends. Consistent action is needed to improve people’s digital skills to achieve a more efficient and flexible labour market. Equally important components are internet accessibility, cost of device, cost of service, cost of electricity, and access to native language content. Piroşcă et al. [86] analyse the relationship between wage and salary per hour and Internet coverage dimension score for the 27 EU member states. These authors’ studies partly explain the unstable or weak labour market during the pandemic period. In Figure 2 of our research, such countries are marked in green and red, respectively. Some of these countries are characterised by poor access to the Internet, which makes it difficult to work remotely. Some are countries with economies based largely on tourism. Restrictions introduced in connection with the development of the pandemic were quite effective in hindering the activities of the tourism industry. In addition, these countries already had a weaker labour market before the pandemic than other European countries (Figure 1).

6. Conclusions

The aim of our research is assessment of the similarity of the situation in labour markets of the EU countries and its changes in the pre-pandemic and the pandemic periods. We present this analysis on the background of countries that fulfil the sustainable development goals (SDG) related to the labour market. The pre-pandemic period contains the years 2018–2019 and the pandemic contains the years 2020–2021. Our analysis shows that the countries that satisfy the sustainable development goals to the highest degree during the whole period (the benchmark countries—Denmark, Finland, The Netherlands, and Sweden) are also among the those with the best situation in their labour markets. There are, however, countries that have a very good situation in their labour markets and at the same time poor degree of fulfilment of the SDGs related to the labour market (Germany and Malta). The opposite situation is in the case of Luxembourg. When we analyse the situation of countries and their labour markets, it turns out that the membership of countries in particular groups are very often the same during the whole period. This means that the mutual relationship between the countries did not change much during the pandemic period with regard to the pre-pandemic one. Therefore, we should answer the research question Q1 negatively.
Quite the opposite is true in the analyses of changing situations of the EU countries in their labour markets. The number of clusters and their composition is different in the pre-pandemic and the pandemic periods. This means that the answer to the research question Q2 is affirmative. The benchmark countries are divided among the clusters in both periods equally. Therefore, we can take these countries as the benchmark in assessment of the situation in the labour market, but not in assessment of changes of such situation.
The situation in labour markets and its change varies across countries. This is a result of different degrees of social and economic development. We can, however, provide some policy recommendations. Analysis of dynamics of situation in labour markets can give the directions of activities counteracting the unemployment and other unfavourable phenomena. Clusters of countries with deterioration of the situation in their labour markets indicate where such activities should be addressed.
Our study has some limitations due to the lack of availability of data that fully describe the labour market. The applied method of comparing time series (DTW) does not require their equal length, but the same frequency is necessary. Very often, labour market data are annual, while the applied methods require at least quarterly data. The Eurostat database is a good source of data, but not all countries collect and make available accurate data that cover their labour market.
The Sustainable Development Goals Report 2021 [18] highlights that, for many countries, economic growth will remain below pre-pandemic trends for a prolonged period. The USA and China, the world’s most developed economies, are forecast to be the fastest to emerge from the crisis. However, the economic situation of the whole world, and of Europe in particular, will also be affected by the war in Ukraine and the migration of millions of its citizens. This will certainly change the European labour market.

Author Contributions

Conceptualization, B.B.-S. and K.D.; methodology, B.B.-S. and K.D.; software, B.B.-S. and K.D.; validation, B.B.-S. and K.D.; formal analysis, B.B.-S. and K.D.; investigation, B.B.-S. and K.D.; resources, B.B.-S. and K.D.; data curation, B.B.-S. and K.D.; writing—original draft preparation, B.B.-S. and K.D.; writing—review and editing, B.B.-S. and K.D.; visualization, B.B.-S. and K.D.; supervision, B.B.-S. and K.D.; project administration, B.B.-S. and K.D.; funding acquisition, B.B.-S. and K.D. All authors have read and agreed to the published version of the manuscript.

Funding

The project is financed within the framework of the program of the Minister of Science and Higher Education under the name “Regional Excellence Initiative” in the years 2019–2022, project number 001/RID/2018/19, the amount of financing PLN 10,684,000.00.

Institutional Review Board Statement

Not applicable.

Informed Consent Statement

Not applicable.

Data Availability Statement

All data comes from https://ec.europa.eu/eurostat/web/main/data/database (accessed on 7 February 2022).

Conflicts of Interest

The authors declare no conflict of interest.

Appendix A. Descriptive Statistics for Main Variables

We present the basic descriptive statistics for three variables (total unemployment rate, total activity rate and total employment rate) in order to initially assess the situation in the EU labour market for the analysed period. We present the following statistics:
  • x ¯ —arithmetic mean,
  • S x —standard deviation,
  • V S —coefficient of variation,
  • M e —median,
  • S k e w —skewness,
  • min—minimal value,
  • max—maximal value.
Table A1. Descriptive statistics for the unemployment rate. Source: own calculations on the basis of the Eurostat data.
Statistics2018Q12018Q22018Q32018Q42019Q12019Q22019Q32019Q42020Q12020Q22020Q32020Q42021Q12021Q22021Q3
x ¯ 7.26.86.76.56.46.16.16.06.27.07.57.27.26.96.4
S x 3.8183.6563.5233.4693.4843.2903.2563.1733.1253.3883.2563.1983.0393.0282.837
V S 53.27%53.95%52.82%53.76%54.82%53.55%53.43%52.59%50.80%48.66%43.33%44.53%42.01%43.74%44.20%
M e 6.35.95.95.85.65.45.45.35.26.67.06.56.96.86.0
S k e w 1.9492.0612.0822.0562.1492.0302.0431.9311.8872.1771.4061.6011.6051.4241.456
min2.32.32.32.12.02.02.02.02.02.52.83.13.33.12.7
max20.719.919.418.919.217.817.617.016.819.417.217.016.515.614.8
Table A2. Descriptive statistics for the activity rate. Source: own calculations on the basis of the Eurostat data.
Statistics2018Q12018Q22018Q32018Q42019Q12019Q22019Q32019Q42020Q12020Q22020Q32020Q42021Q12021Q22021Q3
x ¯ 64.864.965.265.265.365.365.365.565.364.065.065.165.065.666.0
S x 4.4744.5304.5484.6124.5384.5564.5874.6364.7315.2734.8194.9014.7684.7564.842
V S 6.90%6.98%6.98%7.07%6.95%6.97%7.02%7.08%7.25%8.24%7.41%7.25%7.34%7.25%7.34%
M e 65.165.365.565.765.865.966.166.165.964.765.665.665.466.266.2
S k e w 0.347 0.378 0.487 0.465 0.434 0.490 0.455 0.395 0.382 0.372 0.339 0.380 0.289 0.393 0.441
min54.754.654.954.855.055.155.455.755.853.355.655.355.155.856.2
max72.973.172.873.173.573.173.373.673.472.873.373.673.574.174.4
Table A3. Descriptive statistics for the employment rate. Source: own calculations on the basis of the Eurostat data.
Statistics2018Q12018Q22018Q32018Q42019Q12019Q22019Q32019Q42020Q12020Q22020Q32020Q42021Q12021Q22021Q3
x ¯ 60.260.660.961.161.261.461.461.661.359.660.260.560.361.161.8
S x 5.4395.4165.3925.4425.3215.3015.3355.2685.3115.8575.3035.3445.2665.2645.318
V S 8.88%8.94%8.86%8.91%8.70%8.64%8.69%8.55%8.67%9.83%8.81%8.83%8.74%8.61%8.60%
M e 61.461.762.162.362.562.362.362.361.960.561.061.461.462.762.9
S k e w 0.628 0.607 0.711 0.653 0.668 0.690 0.671 0.595 0.639 0.893 0.684 0.742 0.616 0.642 0.608
min47.247.647.748.348.648.948.849.748.743.348.047.547.849.050.6
max68.368.768.169.468.568.868.969.669.067.968.268.569.770.971.5

References

  1. Onvista. MSCI World Index: Kurs, Chart News. Available online: https://www.onvista.de/index/MSCI-WORLD-Index-3193857 (accessed on 1 July 2020).
  2. Anjorin, A.A.A. The coronavirus disease 2019 (COVID-19) pandemic: A review and an update on cases in Africa. Asian Pac. J. Trop. Med. 2020, 13, 199–203. [Google Scholar] [CrossRef]
  3. Feinstein, M.M.; Niforatos, J.D.; Hyun, I.; Cunningham, T.V.; Reynolds, A.; Brodie, D.; Levine, A. Considerations for ventilator triage during the COVID-19 pandemic. Lancet Respir. Med. 2020, 8, 53. [Google Scholar] [CrossRef]
  4. De Vijlder, W. The COVID-19 Pandemic: Economic Consequences Pervasive Uncertainty, Delayed Recovery; BNP Paribas, Economic Research Department: Paris, France, 2020; pp. 1–51. [Google Scholar]
  5. CRISIL (An S&P Global Company). The COVID-19 Fallout: Quantifying First-Cut Impact of the Pandemic. Impact Note. 2020, pp. 1–44. Available online: https://www.spglobal.com/en/research-insights/articles/the-covid-19-fallout-quantifying-first-cut-impact-of-the-pandemic (accessed on 15 February 2021).
  6. Hunter, C.L.; Kim, K.; Rubin, H. COVID-19 Economic Impacts: Beware of March A Day Romans Settled Debts. KPMG Economics. 2020. Available online: https://assets.kpmg/content/dam/kpmg/cl/pdf/2020-03-kpmg-chile-advisory-coronavirus-mapping.pdf (accessed on 15 February 2021).
  7. Shaikh, I. Impact of COVID-19 pandemic on the energy markets. Econ. Chang. Restruct. 2022, 55, 433–484. [Google Scholar] [CrossRef]
  8. Tröster, B.; Küblböck, K. Unprecedented but not Unpredictable: Effects of the COVID 19 Crisis on Commodity Dependent Countries. Eur. J. Dev. Res. 2020, 32, 1430–1449. [Google Scholar] [CrossRef] [PubMed]
  9. Zhang, D.; Hu, M.; Ji, Q. Financial markets under the global pandemic of COVID-19. Finance Res. Lett. 2020, 36, 101528. [Google Scholar] [CrossRef] [PubMed]
  10. Trompenaars, F.; Hampden-Turner, C. Culture, Crisis and COVID-19: The Great Reset; Cambridge Scholars Publishing: Cambridge, UK, 2021. [Google Scholar]
  11. Nelson, P. Global Development and Human Rights. The Sustainable Development Goals and Beyond; University of Toronto Press: Toronto, ON, Canada, 2021. [Google Scholar]
  12. Remeikiene, R.; Belas, J.; Kliestik, T.; Lubos Smreka, L. Quantitative Assessment of Dynamics of Economic Development in the Countries of the European Union. Technol. Econ. Dev. Econ. 2020, 26, 933–946. [Google Scholar] [CrossRef]
  13. Sebestyén, V.; Domokos, E.; Abonyi, J. Focal points for sustainable development strategies—Text mining-basedcomparative analysis of voluntary national reviews. J. Environ. Manag. 2020, 263, 110414. [Google Scholar] [CrossRef] [PubMed]
  14. Soava, G.; Mehedintu, A.; Sterpu, M. Relations Between Income Inequality, Economic Growth and Poverty Threshold: New Evidences from EU Countries Panels. Technol. Econ. Dev. Econ. 2020, 26, 290–310. [Google Scholar] [CrossRef] [Green Version]
  15. Cyrek, M.; Fura, B. Employment for Sustainable Development: Sectoral Efficiencies in EU Countries. Soc. Indic. Res. 2019, 143, 277–318. [Google Scholar] [CrossRef] [Green Version]
  16. Ezcurra, R. Regional Disparities and Within-country Inequality in the European Union. Rev. Econ. Mund. 2019, 51, 139–162. [Google Scholar] [CrossRef] [Green Version]
  17. Compagnolo, L.; Carraro, C.; Eboli, F.; Farnia, L.; Parrado, R.; Pierfederici, R. The Ex-Ante Evaluation of Achieving Sustainable Development Goals. Soc. Indic. Res. 2018, 136, 73–116. [Google Scholar] [CrossRef]
  18. The Sustainable Development Goals Report 2021. Available online: https://unstats.un.org/sdgs/report/2021/ (accessed on 11 March 2022).
  19. Ruesga-Benito, S.M.; González-Laxe, F.; Picatoste, X. Sustainable Development, Poverty, and Risk of Exclusion for Young People in the European Union: The Case of NEETs. Sustainability 2018, 10, 4708. [Google Scholar] [CrossRef] [Green Version]
  20. Barska, A.; Jędrzejczak-Gas, J.; Wyrwa, J.; Kononowicz, K. Multidimensional Assessment of the Social Development of EU Countries in the Context of Implementing the Concept of Sustainable Development. Sustainability 2020, 12, 7821. [Google Scholar] [CrossRef]
  21. Cristea, M.; Noja, G.G.; Stefea, P.; Sala, A.L. The impact of population aging and public health support on EU labor markets. Int. J. Environ. Res. Public Health 2020, 17, 1439. [Google Scholar] [CrossRef] [Green Version]
  22. Kapecki, T. Elements of Sustainable Development in the Context of the Environmental and Financial Crisis and the COVID-19 Pandemic. Sustainability 2020, 12, 6188. [Google Scholar] [CrossRef]
  23. Ayittey, F.K.; Ayittey, M.K.; Chiwero, N.B.; Kamasah, J.S.; Dzuvor, C. Economic impacts of Wuhan 2019-nCoV on China and the world. J. Med. Virol. 2020, 92, 473–475. [Google Scholar] [CrossRef] [Green Version]
  24. Alfaro, L.; Chari, A.; Greenland, A.N.; Schott, P.K. Aggregate and Firm-Level Stock Returns during Pandemics. In Real Time; NBER Working Papers 26950; National Bureau of Economic Research: Cambridge, MA, USA, 2020. [Google Scholar]
  25. Michelsen, C.; Baldi, G.; Dany-Knedlik, G.; Engerer, H.; Gebauer, S.; Rieth, M. Coronavirus causing major economic shock to the global economy. DIW Wkly. Rep. 2020, 10, 180–182. [Google Scholar]
  26. Ruiz Estrada, A.M. Economic Waves: The Effect of the Wuhan COVID-19 on the World Economy (2019–2020). 2020. Available online: https://ssrn.com/abstract=3545758 (accessed on 26 March 2021).
  27. Albulescu, C. Coronavirus and Oil Price Crash. 2020. Available online: https://ssrn.com/abstract=3553452 (accessed on 26 March 2021).
  28. Ahmar, A.S.; del Val, E.B. SutteARIMA: Short-term forecasting method, a case: Covid-19 and stock market in Spain. Sci. Total Environ. 2020, 729, 138883. [Google Scholar] [CrossRef]
  29. Al-Awadhi, A.M.; Al-Saifi, K.; Al-Awadhi, A.; Alhamadi, S. Death and contagious infectious diseases: Impact of the COVID-19 virus on stock market returns. J. Behav. Exp. Finance 2020, 27, 100326. [Google Scholar] [CrossRef] [PubMed]
  30. Bieszk-Stolorz, B.; Dmytrów, K. A survival analysis in the assessment of the influence of the SARS-CoV-2 pandemic on the probability and intensity of decline in the value of stock indices. Eurasian Econ. Rev. 2021, 11, 363–379. [Google Scholar] [CrossRef]
  31. Bieszk-Stolorz, B.; Dmytrów, K. Evaluation of Changes on World Stock Exchanges in Connection with the SARS-CoV-2 Pandemic. Survival Analysis Methods. Risks 2021, 9, 121. [Google Scholar] [CrossRef]
  32. Bieszk-Stolorz, B.; Markowicz, I. Decline in Share Prices of Energy and Fuel Companies on the Warsaw Stock Exchange as a Reaction to the COVID-19 Pandemic. Energies 2021, 14, 5412. [Google Scholar] [CrossRef]
  33. Baker, S.R.; Bloom, N.; Davis, S.J.; Terry, S.J. Covid-Induced Economic Uncertainty (No. w26983); National Bureau of Economic Research: Cambridge, MA, USA, 2020. [Google Scholar] [CrossRef]
  34. Sharif, A.; Aloui, C.; Yarovaya, L. COVID-19 pandemic, oil prices, stock market, geopolitical risk and policy uncertainty nexus in the US economy: Fresh evidence from the wavelet-based approach. Int. Rev. Financ. Anal. 2020, 70, 101496. [Google Scholar] [CrossRef]
  35. McIver, R.P.; Kang, S.H. Financial crises and the dynamics of the spillovers between the US and BRICS stock markets. Res. Int. Bus. Financ. 2020, 54, 101276. [Google Scholar] [CrossRef]
  36. Su, R.; Obrenovic, B.; Du, J.; Godinic, D.; Khudaykulov, A. COVID-19 Pandemic Implications for Corporate Sustainability and Society: A Literature Review. Int. J. Environ. Res. Public Health 2022, 19, 1592. [Google Scholar] [CrossRef] [PubMed]
  37. Schoon, I.; Bynner, J. Young people and the great recession: Variations in the school-to-work transition in Europe and the United States. Longitud. Life Course Stud. 2019, 10, 153–173. [Google Scholar] [CrossRef]
  38. Mikołajczak, P. What affects employment by NGOs? Counteraction to precarious employment in the Polish non-profit sector in the perspective of COVID-19 pandemic crises. Oeconomia Copernic. 2021, 12, 761–788. [Google Scholar] [CrossRef]
  39. Lee, S.; Schmidt-Klau, D.; Verick, S. The Labour Market Impacts of the COVID-19: A Global Perspective. Indian J. Labour Econ. 2020, 63, 11–15. [Google Scholar] [CrossRef] [PubMed]
  40. Mamgain, R.P. Understanding labour market disruptions and job losses amidst COVID-19. J. Soc. Econ. Dev. 2021, 23, 23. [Google Scholar] [CrossRef] [PubMed]
  41. Nivakoski, S.; Mascherini, M. Gender Differences in the Impact of the COVID-19 Pandemic on Employment, Unpaid Work and Well-Being in the EU. Inter Econ. 2021, 56, 254–260. [Google Scholar] [CrossRef] [PubMed]
  42. Botha, F.; de New, J.P.; de New, S.C.; Ribar, D.C.; Salamanca, N. Implications of COVID-19 labour market shocks for inequality in financial wellbeing. J. Popul. Econ. 2021, 34, 655–689. [Google Scholar] [CrossRef]
  43. Roman, M.; Roman, M.; Grzegorzewska, E.; Pietrzak, P.; Roman, K. Influence of the COVID-19 Pandemic on Tourism in European Countries: Cluster Analysis Findings. Sustainability 2022, 14, 1602. [Google Scholar] [CrossRef]
  44. Svabova, L.; Tesarova, E.N.; Durica, M.; Strakova, L. Evaluation of the impacts of the COVID-19 pandemic on the development of the unemployment rate in Slovakia: Counterfactual before-after comparison. Equilib. Q. J. Econ. Econ. Policy 2021, 16, 261–284. [Google Scholar] [CrossRef]
  45. Dunphy, D.; Benveniste, J.; Griffiths, A.; Sutton, P. Sustainability. The Corporate Challenge of the 21st Century; Allen & Unwin: Crows Nest, Australia, 2000. [Google Scholar]
  46. Hodder, A. New Technology, Work and Employment in the era of COVID-19: Reflecting on legacies of research. New Technol. Work. Employ. 2020, 35, 262–275. [Google Scholar] [CrossRef] [PubMed]
  47. Fana, M.; Torrejón Pérez, S.; Fernández-Macías, E. Employment impact of COVID-19 crisis: From short term effects to long terms prospects. J. Ind. Bus. Econ. 2020, 47, 391–410. [Google Scholar] [CrossRef]
  48. Webb, A.; McQuaid, R.; Rand, S. Employment in the informal economy: Implications of the COVID-19 pandemic. Int. J. Sociol. Soc. Policy 2020, 40, 1005–1019. [Google Scholar] [CrossRef]
  49. Galik, A.; Bąk, M.; Bałandynowicz-Panfil, K.; Cirella, G.T. Evaluating Labour Market Flexibility Using the TOPSIS Method: Sustainable Industrial Relations. Sustainability 2022, 14, 526. [Google Scholar] [CrossRef]
  50. Gavriluta, N.; Grecu, S.-P.; Chiriac, H.C. Sustainability and Employability in the Time of COVID-19. Youth, Education and Entrepreneurship in EU Countries. Sustainability 2022, 14, 1589. [Google Scholar] [CrossRef]
  51. Guo, Y.; Kaniuka, A.R.; Gao, J.; Sims, O.T. An Epidemiologic Analysis of Associations between County-Level Per Capita Income, Unemployment Rate, and COVID-19 Vaccination Rates in the United States. Int. J. Environ. Res. Public Health 2022, 19, 1755. [Google Scholar] [CrossRef] [PubMed]
  52. Transforming Our World: The 2030 Agenda for Sustainable Development. Available online: https://www.un.org/ga/search/view_doc.asp?symbol=A/RES/70/1&Lang=E (accessed on 11 March 2022).
  53. Hwang, C.-L.; Yoon, K. Multiple Attribute Decision Making. Methods and Applications. A State-of-the-Art Survey; Springer: Berlin/Heidelberg, Germany, 1981. [Google Scholar]
  54. Bellman, R.; Kalaba, R. On adaptive control processes. IRE Trans. Autom. Control. 1959, 4, 1–9. [Google Scholar] [CrossRef]
  55. Rabiner, L.; Rosenberg, A.; Levinson, S. Considerations in dynamic time warping algorithms for discrete word recognition. IEEE Trans. Acoust. Speech, Signal Process. 1978, 26, 575–582. [Google Scholar] [CrossRef]
  56. Sakoe, H.; Chiba, S. Dynamic programming algorithm optimization for spoken word recognition. IEEE Trans. Acoust. Speech Signal. Process. 1978, 26, 43–49. [Google Scholar] [CrossRef] [Green Version]
  57. Myers, C.S.; Rabiner, L.R. A comparative study of several dynamic time-warping algorithms for connected word recognition. Bell Syst. Tech. J. 1981, 60, 1389–1409. [Google Scholar] [CrossRef]
  58. Müller, M. Information Retrieval for Music and Motion; Springer: Berlin/Heidelberg, Germany, 2007. [Google Scholar]
  59. Arici, T.; Celebi, S.; Aydin, A.S.; Temiz, T.T. Robust gesture recognition using feature pre-processing and weighted dynamic time warping. Multimed. Tools Appl. 2014, 72, 3045–3062. [Google Scholar] [CrossRef]
  60. Aach, J.; Church, G.M. Aligning gene expression time series with time warping algorithms. Bioinformatics 2001, 17, 495–508. [Google Scholar] [CrossRef] [PubMed] [Green Version]
  61. Landmesser, J. The use of the dynamic time warping (DTW) method to describe the COVID-19 dynamics in Poland. Oeconomia Copernic. 2021, 12, 539–556. [Google Scholar] [CrossRef]
  62. Dmytrów, K.; Bieszk-Stolorz, B. Mutual relationships between the unemployment rate and the unemployment duration in the Visegrad Group countries in years 2001–2017. Equilib. Q. J. Econ. Econ. Policy 2019, 14, 129–148. [Google Scholar] [CrossRef] [Green Version]
  63. Dmytrów, K.; Landmesser, J.; Bieszk-Stolorz, B. The Connections between COVID-19 and the Energy Commodities Prices: Evidence through the Dynamic Time Warping Method. Energies 2021, 14, 4024. [Google Scholar] [CrossRef]
  64. Denkowska, A.; Wanat, S. Dynamic Time Warping Algorithm in Modeling Systemic Risk in the European Insurance Sector. Entropy 2021, 23, 1022. [Google Scholar] [CrossRef]
  65. Stübinger, J. Statistical arbitrage with optimal causal paths on high-frequency data of the S&P 500. Quant. Finance 2019, 19, 921–935. [Google Scholar] [CrossRef] [Green Version]
  66. Keogh, E.; Kasetty, S. On the need for time series data mining benchmarks: A survey and empirical demonstration. Data Min. Knowl. Discov. 2003, 7, 349–371. [Google Scholar] [CrossRef]
  67. uczak, M. Combining raw and normalized data in multivariate time series classification with dynamic time warping. J. Intell. Fuzzy Syst. 2018, 34, 373–380. [Google Scholar] [CrossRef]
  68. Keogh, E.; Ratanamahatana, C.A. Exact indexing of dynamic time warping. Knowl. Inf. Syst. 2005, 7, 358–386. [Google Scholar] [CrossRef]
  69. Sardá-Espinosa, A. Time-series clustering in R using the dtwclust package. R J. 2019, 11, 22–43. [Google Scholar] [CrossRef]
  70. Rozmus, D. Clustering Poland Among Eu Countries in Terms of a Sustainable Development Level in the Light of Various Cluster Stability Measures. Folia Oeconomica Stetin. 2020, 20, 319–340. [Google Scholar] [CrossRef]
  71. Zalewska, E. The Application of Continuous Quality Improvement Methods at Universities in the Opinion of Students and Lecturers of the University of Lodz. Folia Oeconomica Stetin. 2021, 21, 175–189. [Google Scholar] [CrossRef]
  72. Sikora-Alicka, J. A Taxonomic Analysis of the Structure of Prime Costs in Polish Clinical Hospitals. Folia Oeconomica Stetin. 2021, 21, 118–131. [Google Scholar] [CrossRef]
  73. Małkowska, A.; Urbaniec, M.; Kosała, M. The impact of digital transformation on European countries: Insights from a comparative analysis. Equilib. Q. J. Econ. Econ. Policy 2021, 16, 325–355. [Google Scholar] [CrossRef]
  74. Key Indicators of the Labour Market, Ninth Edition. Available online: https://www.ilo.org/wcmsp5/groups/public/—dgreports/—stat/documents/publication/wcms_498929.pdf (accessed on 11 March 2022).
  75. Botelho, V.; Da Silva, A.D. Indicators of Labour Market Conditions in the Euro Area. Available online: https://www.ecb.europa.eu/pub/economic-bulletin/focus/2019/html/ecb.ebbox201908_04~f77013b361.en.html (accessed on 11 March 2022).
  76. Jianu, E.; Pîrvu, R.; Axinte, G.; Toma, O.; Cojocaru, A.V.; Murtaza, F. EU Labor Market Inequalities and Sustainable Development Goals. Sustainability 2021, 13, 2675. [Google Scholar] [CrossRef]
  77. Bieszk-Stolorz, B.; Dmytrów, K. Influence of Accession of the Visegrad Group Countries to the EU on the Situation in Their Labour Markets. Sustainability 2020, 12, 6694. [Google Scholar] [CrossRef]
  78. Dmytrów, K.; Bieszk-Stolorz, B. Comparison of changes in the labour markets of post-communist countries with other EU member states. Equilib. Q. J. Econ. Econ. Policy 2021, 16, 741–764. [Google Scholar] [CrossRef]
  79. Rollnik-Sadowska, E.; Jarocka, M. CEE Labour Markets—Homogenity or Diversity? Technol. Econ. Dev. Econ. 2021, 27, 1142–1158. [Google Scholar] [CrossRef]
  80. Lustig, N. Economic crisis, adjustment and living standards in Mexico, 1982–1985. World Dev. 1990, 19, 1325–1342. [Google Scholar] [CrossRef]
  81. Colombo, E.; Menna, L.; Tirelli, P. Informality and the labor market effects of financial crises. World Dev. 2019, 119, 1–22. [Google Scholar] [CrossRef]
  82. Gilbert, A. Third World Cities: Housing, Infrastructure and Servicing. Urban Stud. 1992, 29, 435–460. [Google Scholar] [CrossRef]
  83. Pratt, A.C.; Hutton, T.A. Reconceptualising the relationship between the creative economy and the city: Learning from the financial crisis. Cities 2013, 33, 86–95. [Google Scholar] [CrossRef] [Green Version]
  84. Kucčas, A.; Kavalov, B.; Lavalle, C. Living Cost Gap in the European Union Member States. Sustainability 2020, 12, 8955. [Google Scholar] [CrossRef]
  85. Lafuente, J.Á.; Marco, A.; Monfort, M.; Ordóñez, J. Social Exclusion and Convergence in the EU: An Assessment of the Europe 2020 Strategy. Sustainability 2020, 12, 1843. [Google Scholar] [CrossRef] [Green Version]
  86. Piroşcă, G.I.; Şerban-Oprescu, G.L.; Badea, L.; Stanef-Puică, M.-R.; Valdebenito, C.R. Digitalization and Labor Market—A Perspective within the Framework of Pandemic Crisis. J. Theor. Appl. Electron. Commer. Res. 2021, 16, 2843–2857. [Google Scholar] [CrossRef]
Figure 1. Clusters of the EU countries with respect to the situation in their labour markets in the pre-pandemic period. Source: own elaboration on the basis of the Eurostat data.
Sustainability 14 03646 g001
Figure 2. Clusters of the EU countries with respect to the situation in their labour markets in the pandemic period. Source: own elaboration on the basis of the Eurostat data.
Sustainability 14 03646 g002
Table 1. Pattern and anti-pattern values of the SDG-related variables. Source: own calculations on the basis of the Eurostat data.
Specification ( SDG 8 1 ) ( SDG 8 2 ) ( SDG 8 3 )
pattern5.0%71.5%12.5%
anti-pattern24.4%43.3%73.1%
Table 2. Groups with respect to fulfilment of the SDGs. Source: own elaboration.
GroupValue of the TOPSIS Measure
A—very high fulfilment ( Q 3 , 1 ]
B—rather high fulfilment ( M e , Q 3 ]
C—rather low fulfilment ( Q 1 , M e ]
D—very low fulfilment [ 0 , Q 1 ]
Table 3. Groups of countries with respect to fulfilment of the SDGs. Source: own calculations on the basis of the Eurostat data.
Country2018Q12018Q22018Q32018Q42019Q12019Q22019Q32019Q42020Q12020Q22020Q32020Q42021Q12021Q22021Q3
BelgiumCCCCCCCCDDCDCCC
BulgariaDDDDDDDDDDDDDDD
CzechiaAABBBBBBBAABABA
DenmarkAAAAAAAAAAAAAAA
GermanyBBBBCCCBBCCBBBB
EstoniaABBABAAAAAAABAB
IrelandBCCCBCCBBCCCAAA
GreeceDDDDDDDDDDDDDDD
SpainDDDDDDDDDDDDDDD
FranceBBBBBBBBBBBBCCB
CroatiaDDDDDCDDCCCCDCD
ItalyDDDDDDDDDDDDDDD
CyprusCCCCCDCCCCDCCDC
LatviaCCCCCCCBCBBBCBB
LithuaniaBAABBBBCCCCBCCC
LuxembourgAAAAAAAAABAABBC
HungaryCCBBBCBBBBBCCCB
MaltaCBCCAAACAABAACA
NetherlandsAAAAAAAAAAAAAAA
AustriaBBAAABBABBBBBAB
PolandCCCCCBBCCBCCBBC
PortugalCCCCCCCCCCCCCCC
RomaniaDDDDDDDDDDDDDDD
SloveniaBBBBCBCCCCBCBBC
SlovakiaDDDDDDDDDDDDDDD
FinlandAAAAAAAAAAAAAAA
SwedenAAAAAAAAAAAAAAA
Table 4. Pattern and anti-pattern values. Source: own calculations on the basis of the Eurostat data.
Specification x 1 x 2 x 3 x 4 x 5 x 6 x 7 x 8
pattern2.0%5.1%74.4%79.9%83.6%71.5%73.5%78.7%
anti-pattern20.7%44.0%53.3%19.4%39.0%43.3%11.8%37.6%
Table 5. Groups of countries with respect to the situation in their labour markets. Source: own calculations on the basis of the Eurostat data.
Country2018Q12018Q22018Q32018Q42019Q12019Q22019Q32019Q42020Q12020Q22020Q32020Q42021Q12021Q22021Q3
BelgiumCDCCCCCCCCCCCCC
BulgariaCCDCCCCCCDCCCCC
CzechiaBBBBBBBBBAABBAB
DenmarkAAAAAAAAAAAAAAA
GermanyAAAAAAAAAAAAAAA
EstoniaAABAABAAABBBABB
IrelandBBABAAAAABBABBA
GreeceDDDDDDDDDDDDDDD
SpainDDDDDDDDDDDDDDD
FranceDDDDDDDDDCCCCCC
CroatiaDDDDDDDDDDDDDDD
ItalyDDDDDDDDDDDDDDD
CyprusDCCDDCCCCCCCCCB
LatviaCCBCCCCBCBBBCCC
LithuaniaCBBBBBBCCCCCBCC
LuxembourgCCCCCCDCDDDDCBC
HungaryBBBBBCBBBBBBBBB
MaltaAAAAAAAAAAAAAAA
NetherlandsAAAAAAAAAAAAAAA
AustriaAAAAAAAAAAAAAAA
PolandBCCCCBBBBABBBBB
PortugalCCCCCDCDCCDDDDD
RomaniaDDDDDDDDDDDDDDD
SloveniaBBCBBBCCBCCCCCB
SlovakiaCCCCCCCCCCCCDDD
FinlandBBBBBBBBBBAAAAA
SwedenAAAABABBBBBBBBC
Publisher’s Note: MDPI stays neutral with regard to jurisdictional claims in published maps and institutional affiliations.

