1. Introduction
Which urban forms are vulnerable to urban heat islands? Answering this question provides not only deriving urban planning measures to alleviate urban heat islands but also providing clues for the debate on sustainable urban forms that has long been discussed. There has been considerable skepticism until recently, but a consensus has been reached that a compact urban form provides the most sustainable future, and several studies have suggested that a compact city is an urban form to solve various urban problems [
1,
2,
3,
4,
5,
6,
7,
8].
However, it is questionable whether the compact city is the ideal urban form for solving all urban problems. This question arises because urban problems appear in various fields, and even if the compact urban form is effective in alleviating or solving an urban problem, it could worsen another one. This issue can occur with urban heat islands, and several studies have proven that the compact city is vulnerable to the urban heat island problem [
9,
10,
11]. A form that collects people, facilities, or services in specific spaces, such as downtowns and subcenters, is not ideal for urban heat islands. However, in terms of urban planning, cities should not be expanded disorderly in sprawled form. Because urban sprawl causes several urban problems, such as increased vehicle miles traveled (VMT), increased energy consumption and air pollution, higher infrastructure, and public service costs, reduced land resources, declined original city centers, and decreased natural value [
1]. Urban planners and policymakers should seek ways to mitigate the effects of urban heat islands while maintaining compact urban forms.
The necessity and motivation of this study can be summarized as follows. (1) Compact city has the potential to worsen some urban problems, especially urban heat island problems. (2) Nevertheless, the compact urban form must be maintained for sustainable urban development. (3) Therefore, research is needed to accurately identify the relationship between urban form and urban heat island, and to derive strategies to mitigate the effect of urban heat island while maintaining a compact urban form. (4) Such work can not only derive an urban heat island mitigation strategy, but also provide a key to a sustainable urban form. This study was conceived with this discussion in mind.
This study investigated the relationship between the urban heat island effect and urban form, examined which urban forms are vulnerable to this effect, and provided urban planning measures to alleviate urban heat islands. By performing micro- and macro-scale analyses, this study was able to make policy suggestions for urban heat island mitigation. The reasons for performing the multiscale analysis are as follows.
First, urban forms have a profound effect on the urban thermal environment and urban sustainability because of the strong “lock-in” effect on changes in urban forms [
11]. This effect happens because most environments already built are irreversible, and these changes require enormous costs; once a city is built, it is almost impossible to significantly modify its form [
12]. Second, the effect of urban form on urban heat islands may vary depending on vertical scales (urban screen, canopy, and boundary levels) and horizontal scales (mirco-, local, and regional scales) [
10,
13]. These two facts indicate that the effect of urban form on urban heat islands should be approached using various scales, and in particular, the “lock-in” effect of urban forms suggests that the relationship between urban form and urban heat islands should be considered from a microscopic perspective. In addition, a multiscale analysis can be an effective strategy for exploring vulnerable urban forms and seeking ways to mitigate urban heat island effects.
Meanwhile, attempts to analyze urban heat islands through the urban form approach have been discussed in several studies [
9,
10,
11,
14,
15,
16,
17]. The direction of this study is the same as that of previous studies in that it analyzes the effect of urban form on urban heat islands through various urban form characteristics. However, it is different from previous studies in that the influence of urban forms was analyzed on two scales to verify the research hypothesis. In addition, this study has more differentiated implications in that it has developed the discussion of previous studies into a discussion of sustainable urban forms.
2. Theory and Previous Research
Because of the rapid urbanization trend, urban heat islands are now common in cities around the world, explaining the rise in temperature in urban areas compared to the surrounding environments. Temperatures in urban areas, which are higher than those outside cities, have a significant impact on the health and welfare of the people living there, and these higher temperatures lower water quality and increase energy consumption, air pollutants, and greenhouse gas emissions [
18,
19,
20,
21]. In addition, because the duration and frequency of heat waves have increased over the past several decades due to climate change, the damage caused by urban heat islands is expected to intensify [
22]. The urban heat island effect occurs when artificial modifications of the natural landscape results in atmospheric and thermophysical changes of the urban boundary layer [
10]. For example, as urban development and population density increase, existing natural surfaces are replaced with impermeable surfaces, resulting in a continual increase in overall urban heat release that often leads to urban heat island effects [
16]. Structures such as buildings, roads, and other infrastructures absorb and reabsorb more heat from the sun than natural landscapes such as forests and water. Urban areas with highly dense structures and limited green areas become “islands,” and these thermal pockets are called heat islands. This mechanism of the urban heat island effect suggests that taking an urban-form approach to the urban heat island phenomenon is important.
The United States Environmental Protection Agency (EPA) cited the causes of heat islands as the reduction of natural landscapes in urban areas, urban material properties, urban geometry, heat from human activities, weather, and geography. Urban geometry causes include the dimensions and spacing of a city’s buildings that affect the wind flow and the ability of urban materials to absorb and emit solar energy. The more highly developed areas are, the more the blocked surfaces and structures become large masses that cannot easily dissipate heat. From these characteristics, it can be inferred that the intensity of the heat island phenomenon varies depending on the form of urban development within the city.
As mentioned in the introduction, the effect of urban forms on urban heat can appear on vertical and horizontal scales. Studies based on horizontal scales (micro-, local, and regional scales) have the advantage of being able to derive mitigation measures according to each scale because the individual contributions of each factor appear differently depending on the scale [
13]. For example, it is possible to develop mitigation measures from a macroscopic perspective by comparing which factors affect urban heat islands in different cities. In addition, temperature can vary within the city. Some places are hotter than others because of uneven distributions of heat-absorbing buildings and packaging, whereas others remain cool from trees and green areas. Because these temperature differences create heat islands, it is possible to derive solutions to address the problem, even on a micro-scale.
The relationship between urban forms and urban heat islands has been proven in several studies. Most of these studies were conducted at the urban level, and this relationship was proven using statistical methodologies, including regression analyses of dozens to hundreds of cities [
10,
11,
14,
15,
16]. A characteristic of these studies is that most tried to express the urban form using variables representing geometric cities. Using indices representing fractal geometry, urban compactness [
10,
11,
15], spatial connectivity [
11], and shape of a long and narrow city [
10,
11], these studies grafted the relationship between geometric variables and urban areas to the urban heat island.
Efforts have also been made to investigate the relationship between urban form and urban heat islands at the microscopic level [
16,
17,
19,
23]. Micro-scale research can be divided into two broad categories: studies on specific urban factors that affect the urban heat island and studies that divide cities into more detailed development types. Those in the first category investigated land use that significantly affects urban heat islands, such as impermeable surfaces and green areas [
19,
23]. Those in the second category identified the micro-unit urban forms vulnerable to urban heat islands through a micro-unit zone called the local climate zone (LCZ) [
16,
17].
3. Research Design
3.1. Research Framework
To investigate the relationship between urban form and urban heat islands at the macro- and micro-levels, we divided the analysis into two approaches. Borrowing from previous studies that the impact of urban form on urban heat islands might appear differently depending on the scale, this plan allowed for making policy suggestions for each scale. By doing so, we hoped to further the discussion on ideal urban forms. In the macro- scale analysis, the relationship between urban form and urban heat islands was identified through a statistical approach using a regression equation, and a spatial analysis method using LCZ was used for the micro-scale analysis. The related research framework is shown in
Figure 1.
This study was conceived by questioning which urban forms are vulnerable to urban heat islands. Through the process of establishing and verifying the following hypotheses, we continued discussions on urban forms and sought measures to improve urban heat islands according to urban spatial structure and form.
Hypothesis 1. Compact urban forms will reduce the urban heat island effect.
(1-1) Cities in a dense form will show a lower urban heat island effect.
(1-2) Cities a compacted fractal form will show a lower urban heat island effect.
(1-3) Cities with higher spatial connectivity of development sites will show a lower urban heat island effect.
(1-4) Cities with a non-dispersed development pattern will show a lower urban heat island effect.
Hypothesis 2. No difference in surface temperature will be found for different urban climate zones within the city where the urban heat islands appear.
Research hypothesis 1 was conceived for macro-scale analysis, and detailed hypotheses were established regarding the effects of various characteristics of urban forms on urban heat islands. Research hypothesis 2 was conceived for micro-scale analysis, and it was devised to understand significant differences in temperature in detailed units, along with the urban heat island effect appearing in urban units.
3.2. Case Area and Spatial Scope
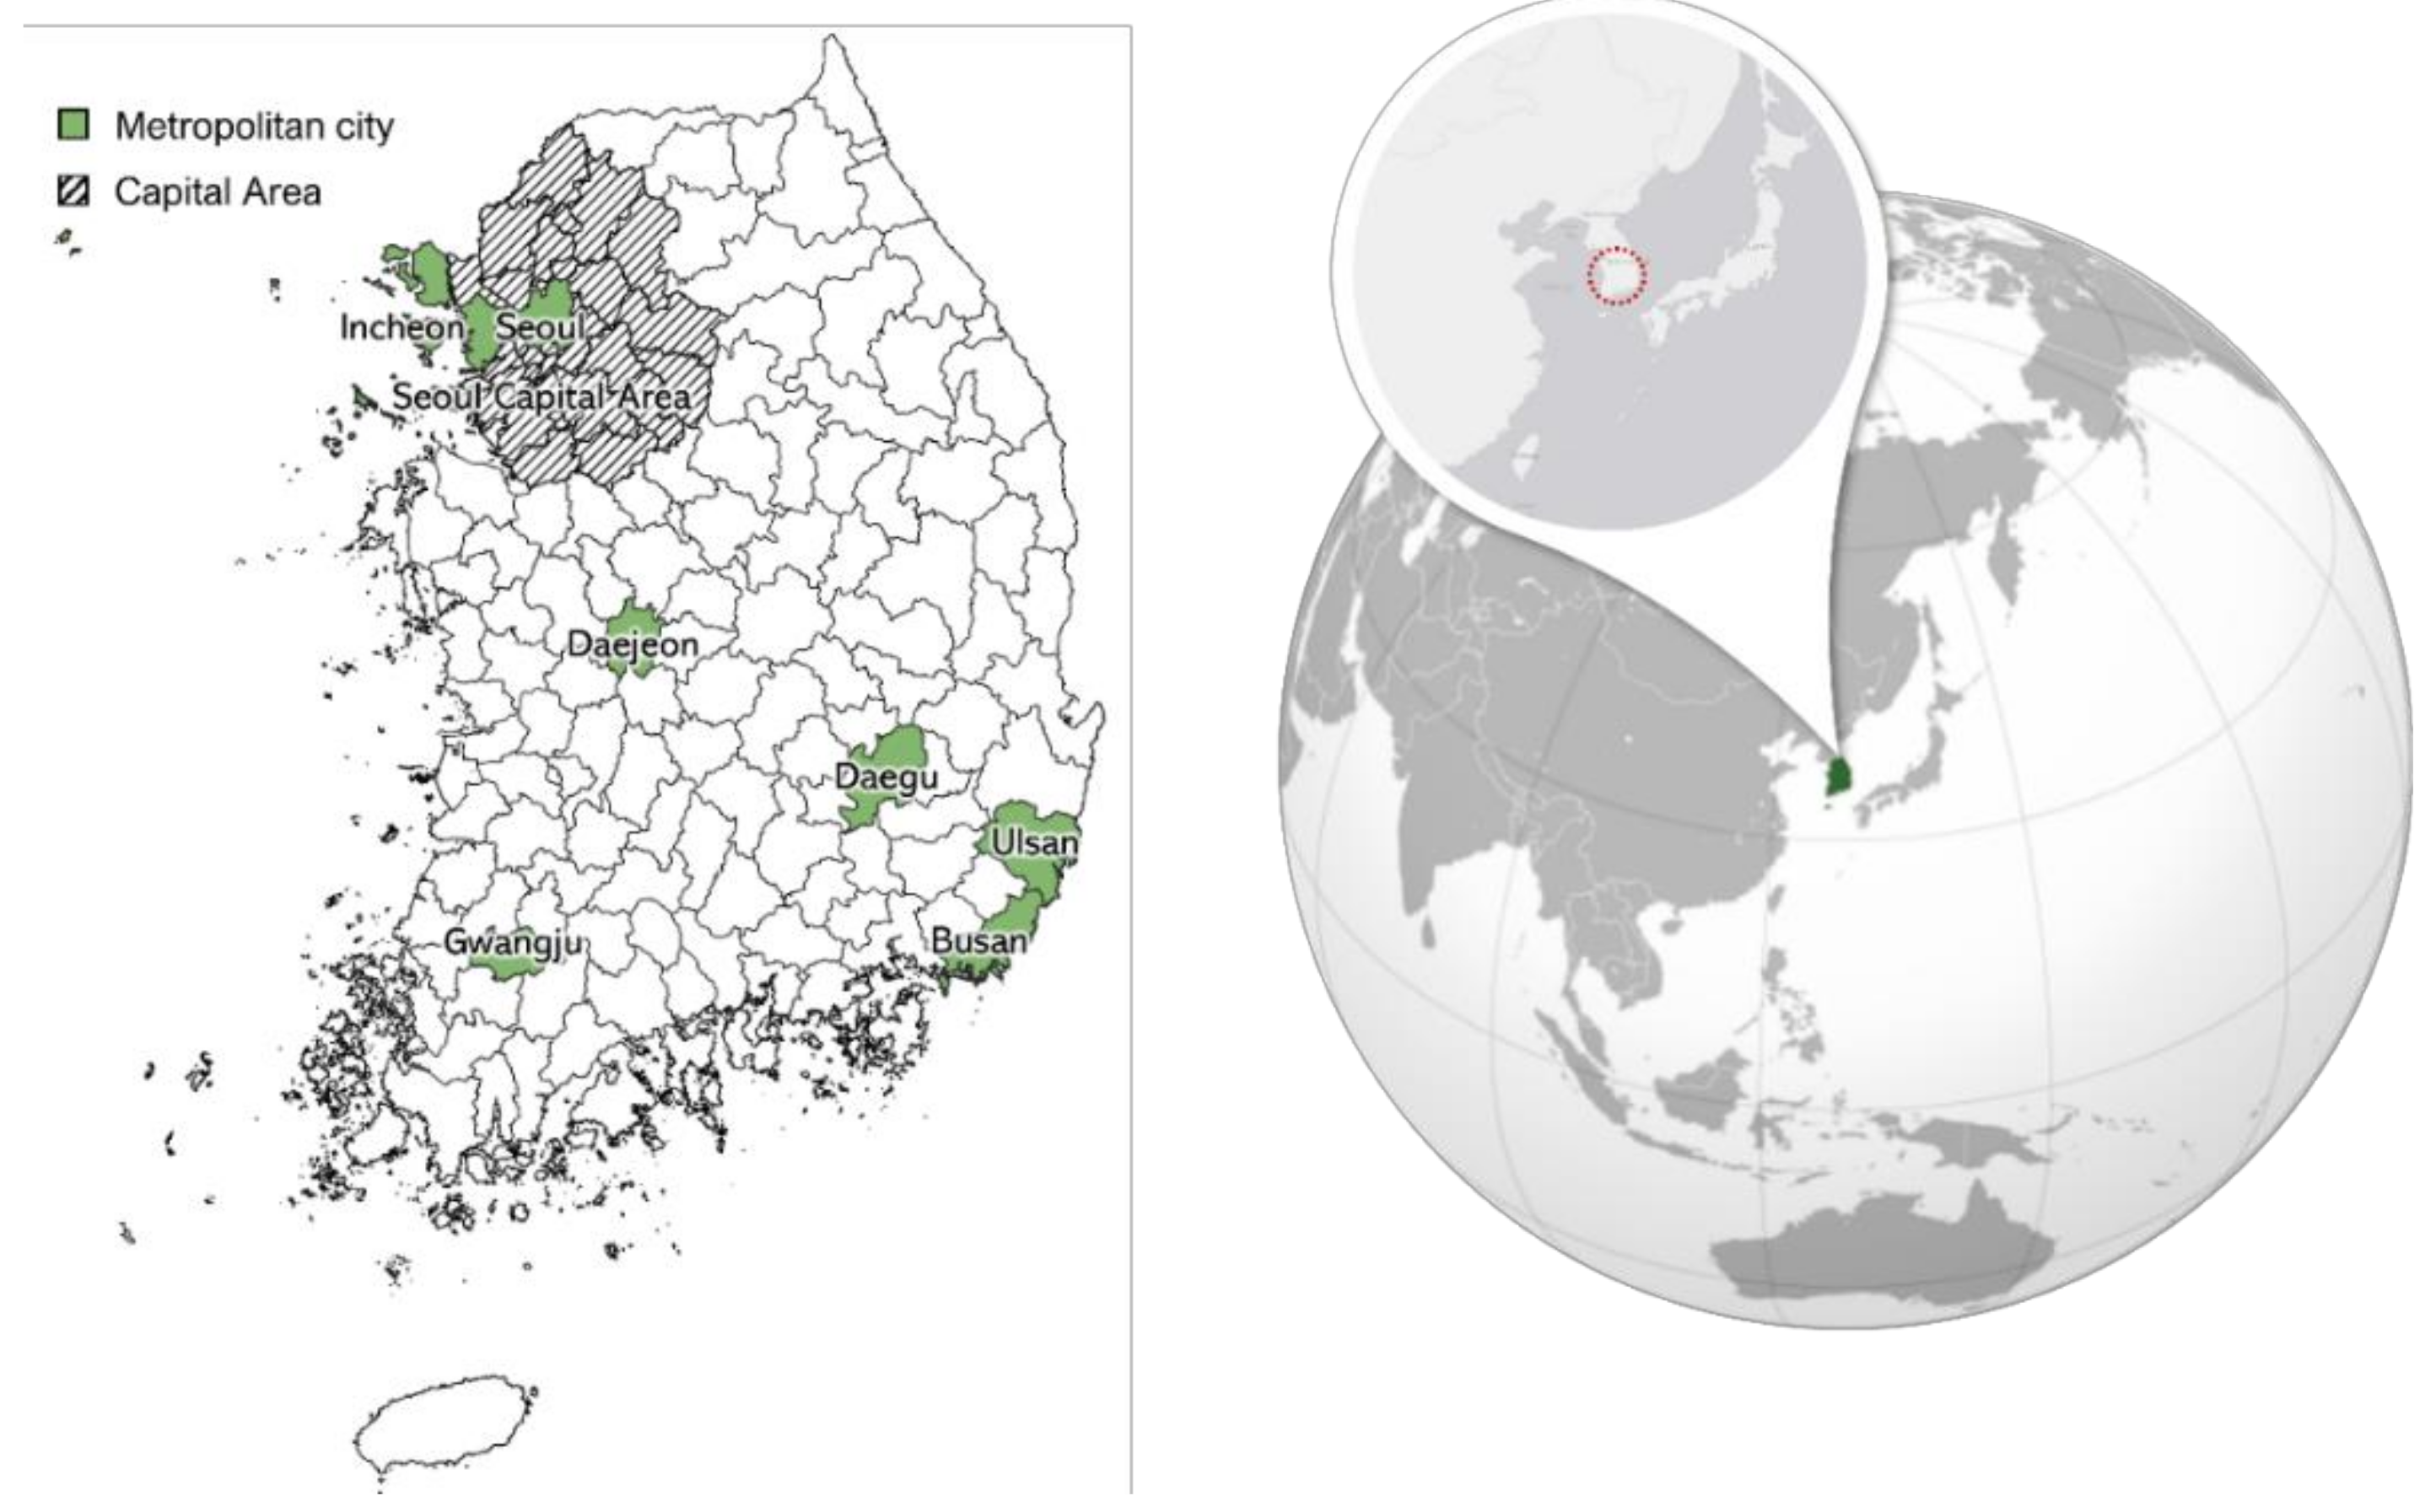
Korea served as the case area for this study for the following reasons. First, located in the mid-latitude zone, Korea has the characteristics of a temperate climate with four distinct seasons. Although Korea has a relatively low latitude and is a peninsula surrounded by sea on three sides, it has long summers with remarkably high temperatures, making it a suitable case area for analyzing urban forms vulnerable to urban heat islands during the summer. Second, several studies have provided evidence that urbanization can change local climates [
24,
25,
26,
27], and urbanization aggravates urban heat islands [
28]. Korea has experienced rapid growth that is hard to find elsewhere. Because of its narrow territory, population overcrowding continues, and urbanization has progressed quickly because of rapid economic growth. Metropolitan areas have very high population densities and urbanization rates, making them suitable case areas for urban heat islands. Third, in Korea, the difference in urbanization levels between cities is very high. Unlike metropolitan areas and large cities, which have high urbanization rates, small and medium-sized cities are experiencing a rapid decrease in population, and the economic growth and urbanization rates in these areas show a big gap compared with large cities [
29]. Therefore, Korea is ideal for analyzing the effects of urban heat islands according to various urbanization levels. The spatial scope of this study consisted of 145 cities (73 si (cities), 65 gun (counties), and 7 metropolitan cities) selected for research design and data limitation reasons, and was used to select cities with comprehensive plans that include measures to address urban heat islands effectively (
Figure 2). In addition, regarding land cover maps, which were necessary data for the independent variables, the border areas were removed because disclosure was restricted under Article 13 of Korea’s Environmental and Spatial Information Security Management Regulations (disclosure and utilization of spatial information).
4. Data and Method
4.1. Urban Heat Island (UHI) Intensity
To calculate the land surface temperature (
LST), we used summer data (June to August, 2018 to 2020) from MODIS, the Moderate Resolution Imaging Spectroradiometer (Aqua 8-day complex; MYD11A2, version 6). This product uses a physical-based method, or a split-window method, to accurately estimate the surface radiation and recover the temperature [
30,
31]. The error of MODIS
LST products is usually within ± 1K [
32,
33], and the product version used has better cloud contaminated
LST removal in level 2 and level 3
LST products than previous versions. This product provides both daytime and nighttime
LST, and since daytime surface
UHI is more pronounced than nighttime, this study focused on daytime
LST [
10]. The ocean and other zero pixels were not processed, and the multiyear summer average
LST was calculated based on the
LST data processed in Equation (1) for a total of 36 images.
The
UHI intensity of each city is the difference between the temperature of the urban area and the temperature of the suburban area of the city, and it is expressed as Equation (2).
The temperature of the suburban area used in Equation (2) is calculated differently in different studies using urban heat island intensity. The first method is to designate a buffer of a certain radius for each city. In this method, all urban areas are set uniformly with buffers of a certain radius (5 km, 10 km, etc.), or the urban buffer radius is calculated through a series of equations based on the radius of each city [
11]. The second method sets a buffer for a high-intensity urbanization area. Studies employing this method use satellite data to calculate a high-intensity urbanization area and set a buffer with a radius of 2 to 3 km for the area [
34,
35]. In addition, another method of calculating the intensity of urban heat islands is dividing the target area into urbanized and non-urbanized areas without using buffers and calculating the difference in
LST between urbanized and non-urbanized areas [
36].
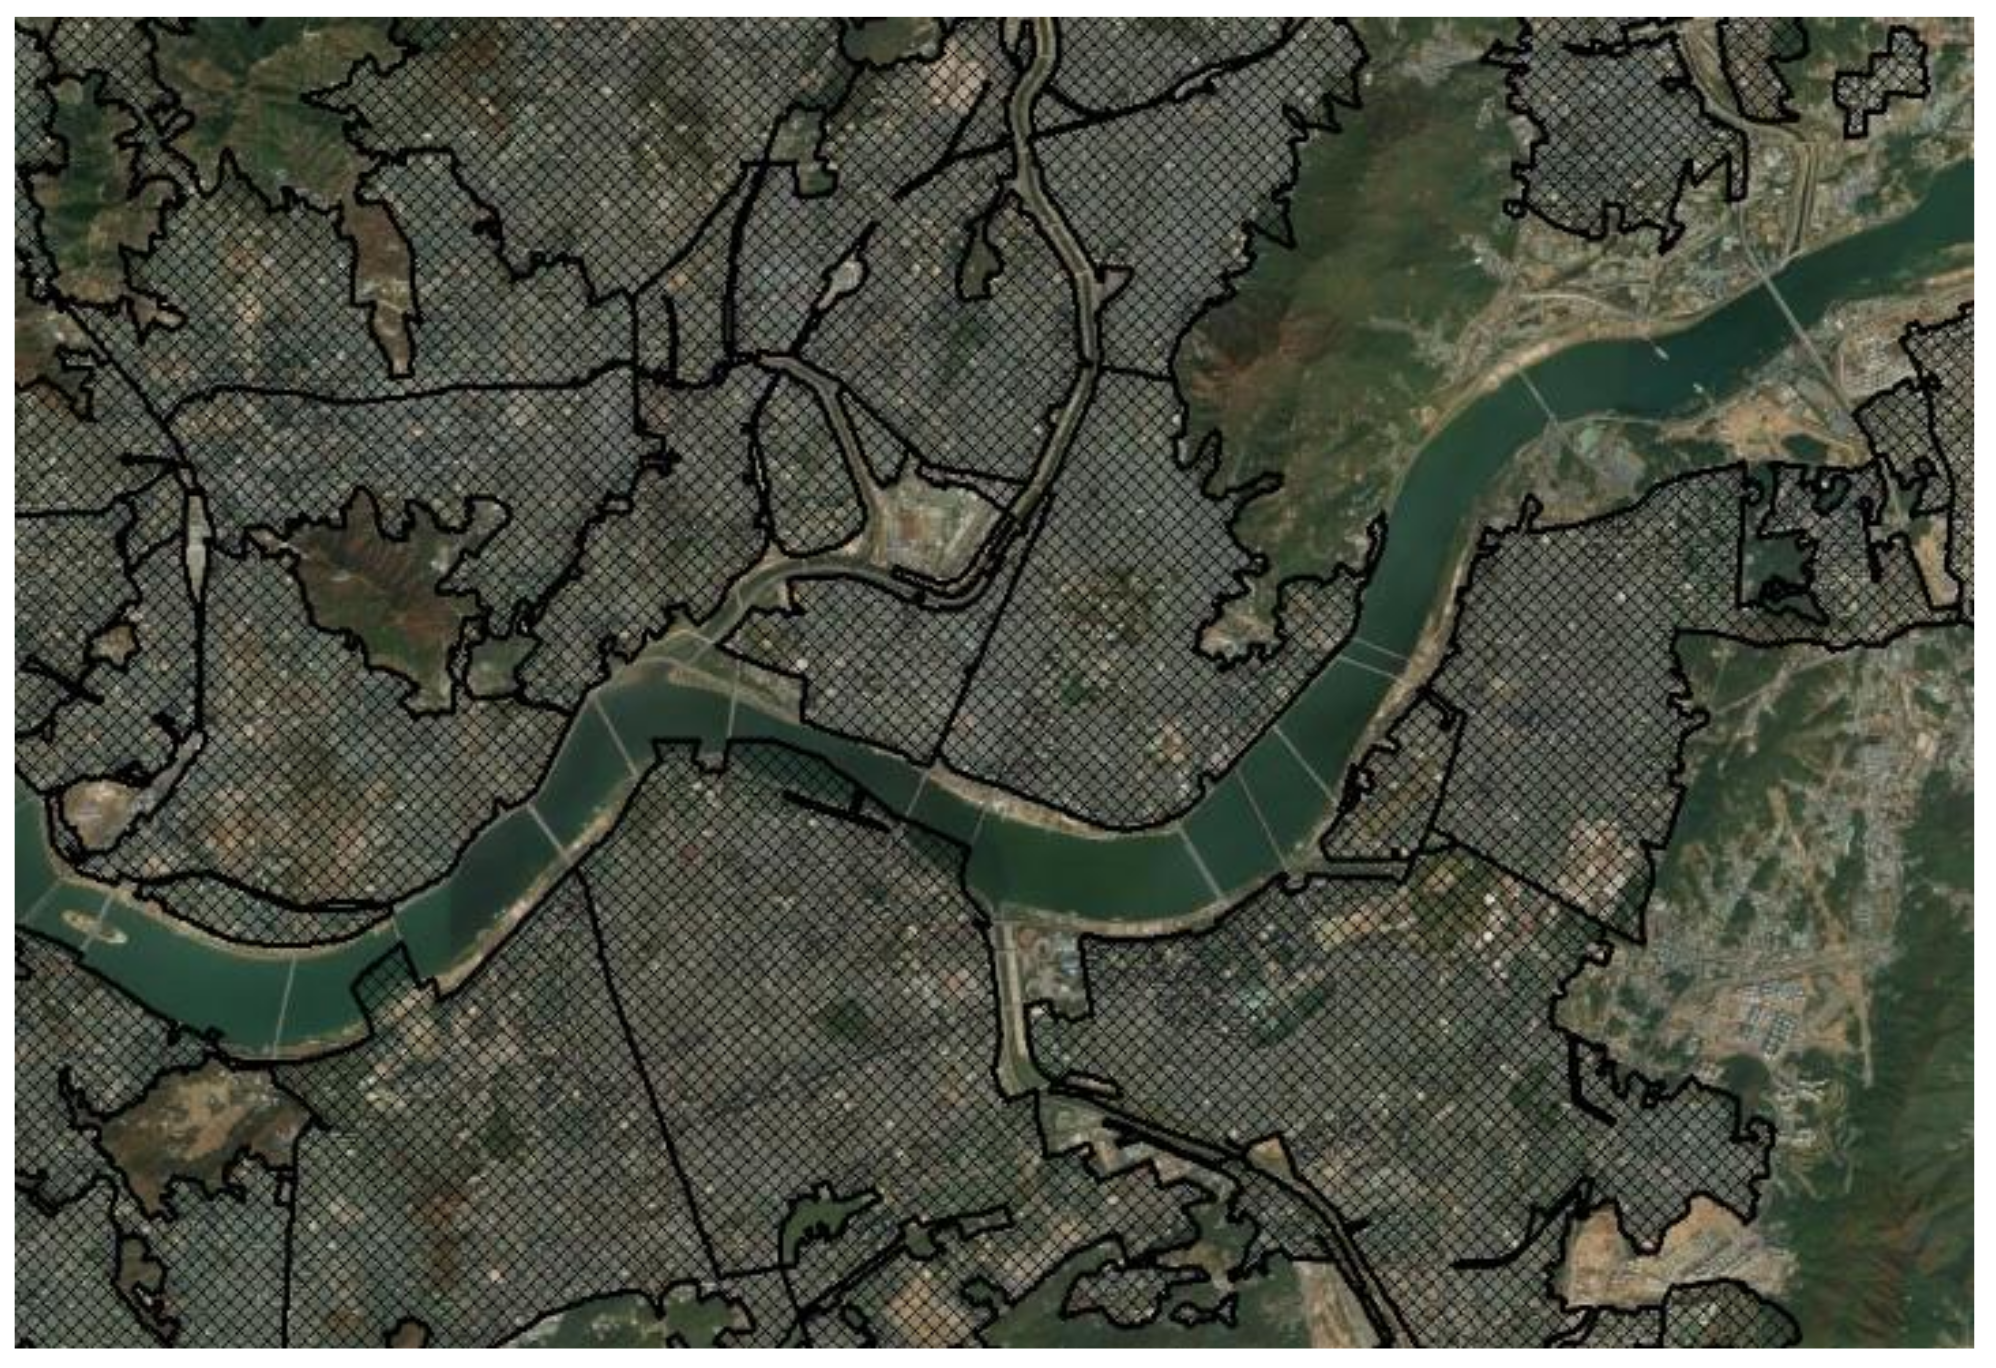
In this study, the
LST of the suburban area was calculated by setting a buffer based on the urbanization area. Unlike in other studies, the urbanization area was not calculated from land cover data based on satellite products but from the urbanization area boundary data provided by the Ministry of Land, Infrastructure, and Transport’s National Spatial Information Portal. This method was used because it is difficult to calculate a high-intensity urbanization area when using satellite-based land cover data, and the accuracy of buffer settings is poor because several sizes of urbanization areas are distributed. In contrast, the urbanization area boundary data used in this study included spatial information and attributed information for all urbanization areas. As shown in
Figure 3, not all large and small urban areas were included, and high-intensity urbanization areas were concentrated.
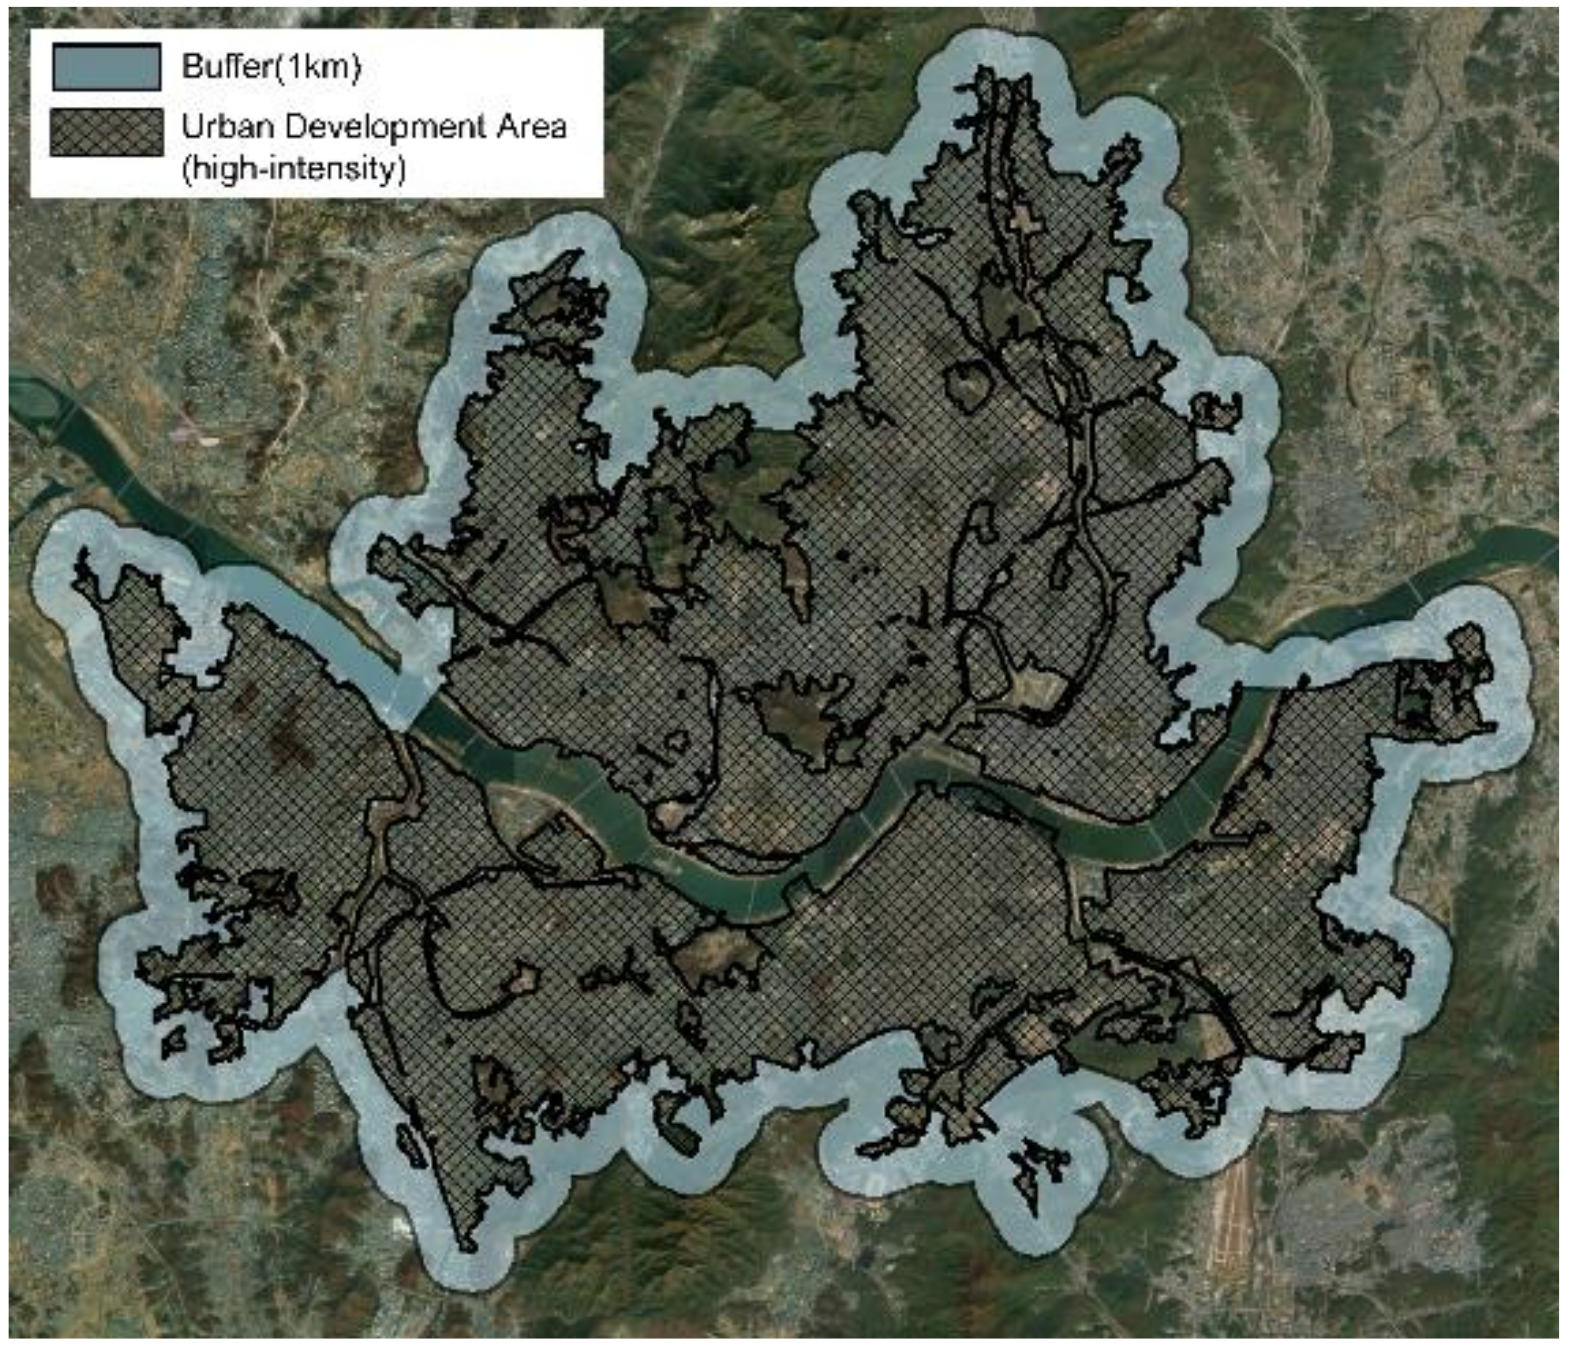
In this study, the buffer of the calculated high-intensity urbanization area was set according to the city unit. This setting was chosen because urbanization areas in large Korean cities, such as metropolitan cities, are widely distributed enough to account for most of the city’s total area, and small and medium-sized cities near metropolitan cities are also widely distributed, resulting in overlapped buffers in nearby cities. Therefore, as shown in
Figure 4, the buffer’s radius in the suburbs of metropolitan cities was set to 1 km, and the buffer’s radius in other cities (si) and counties (gun) was set to 2 km.
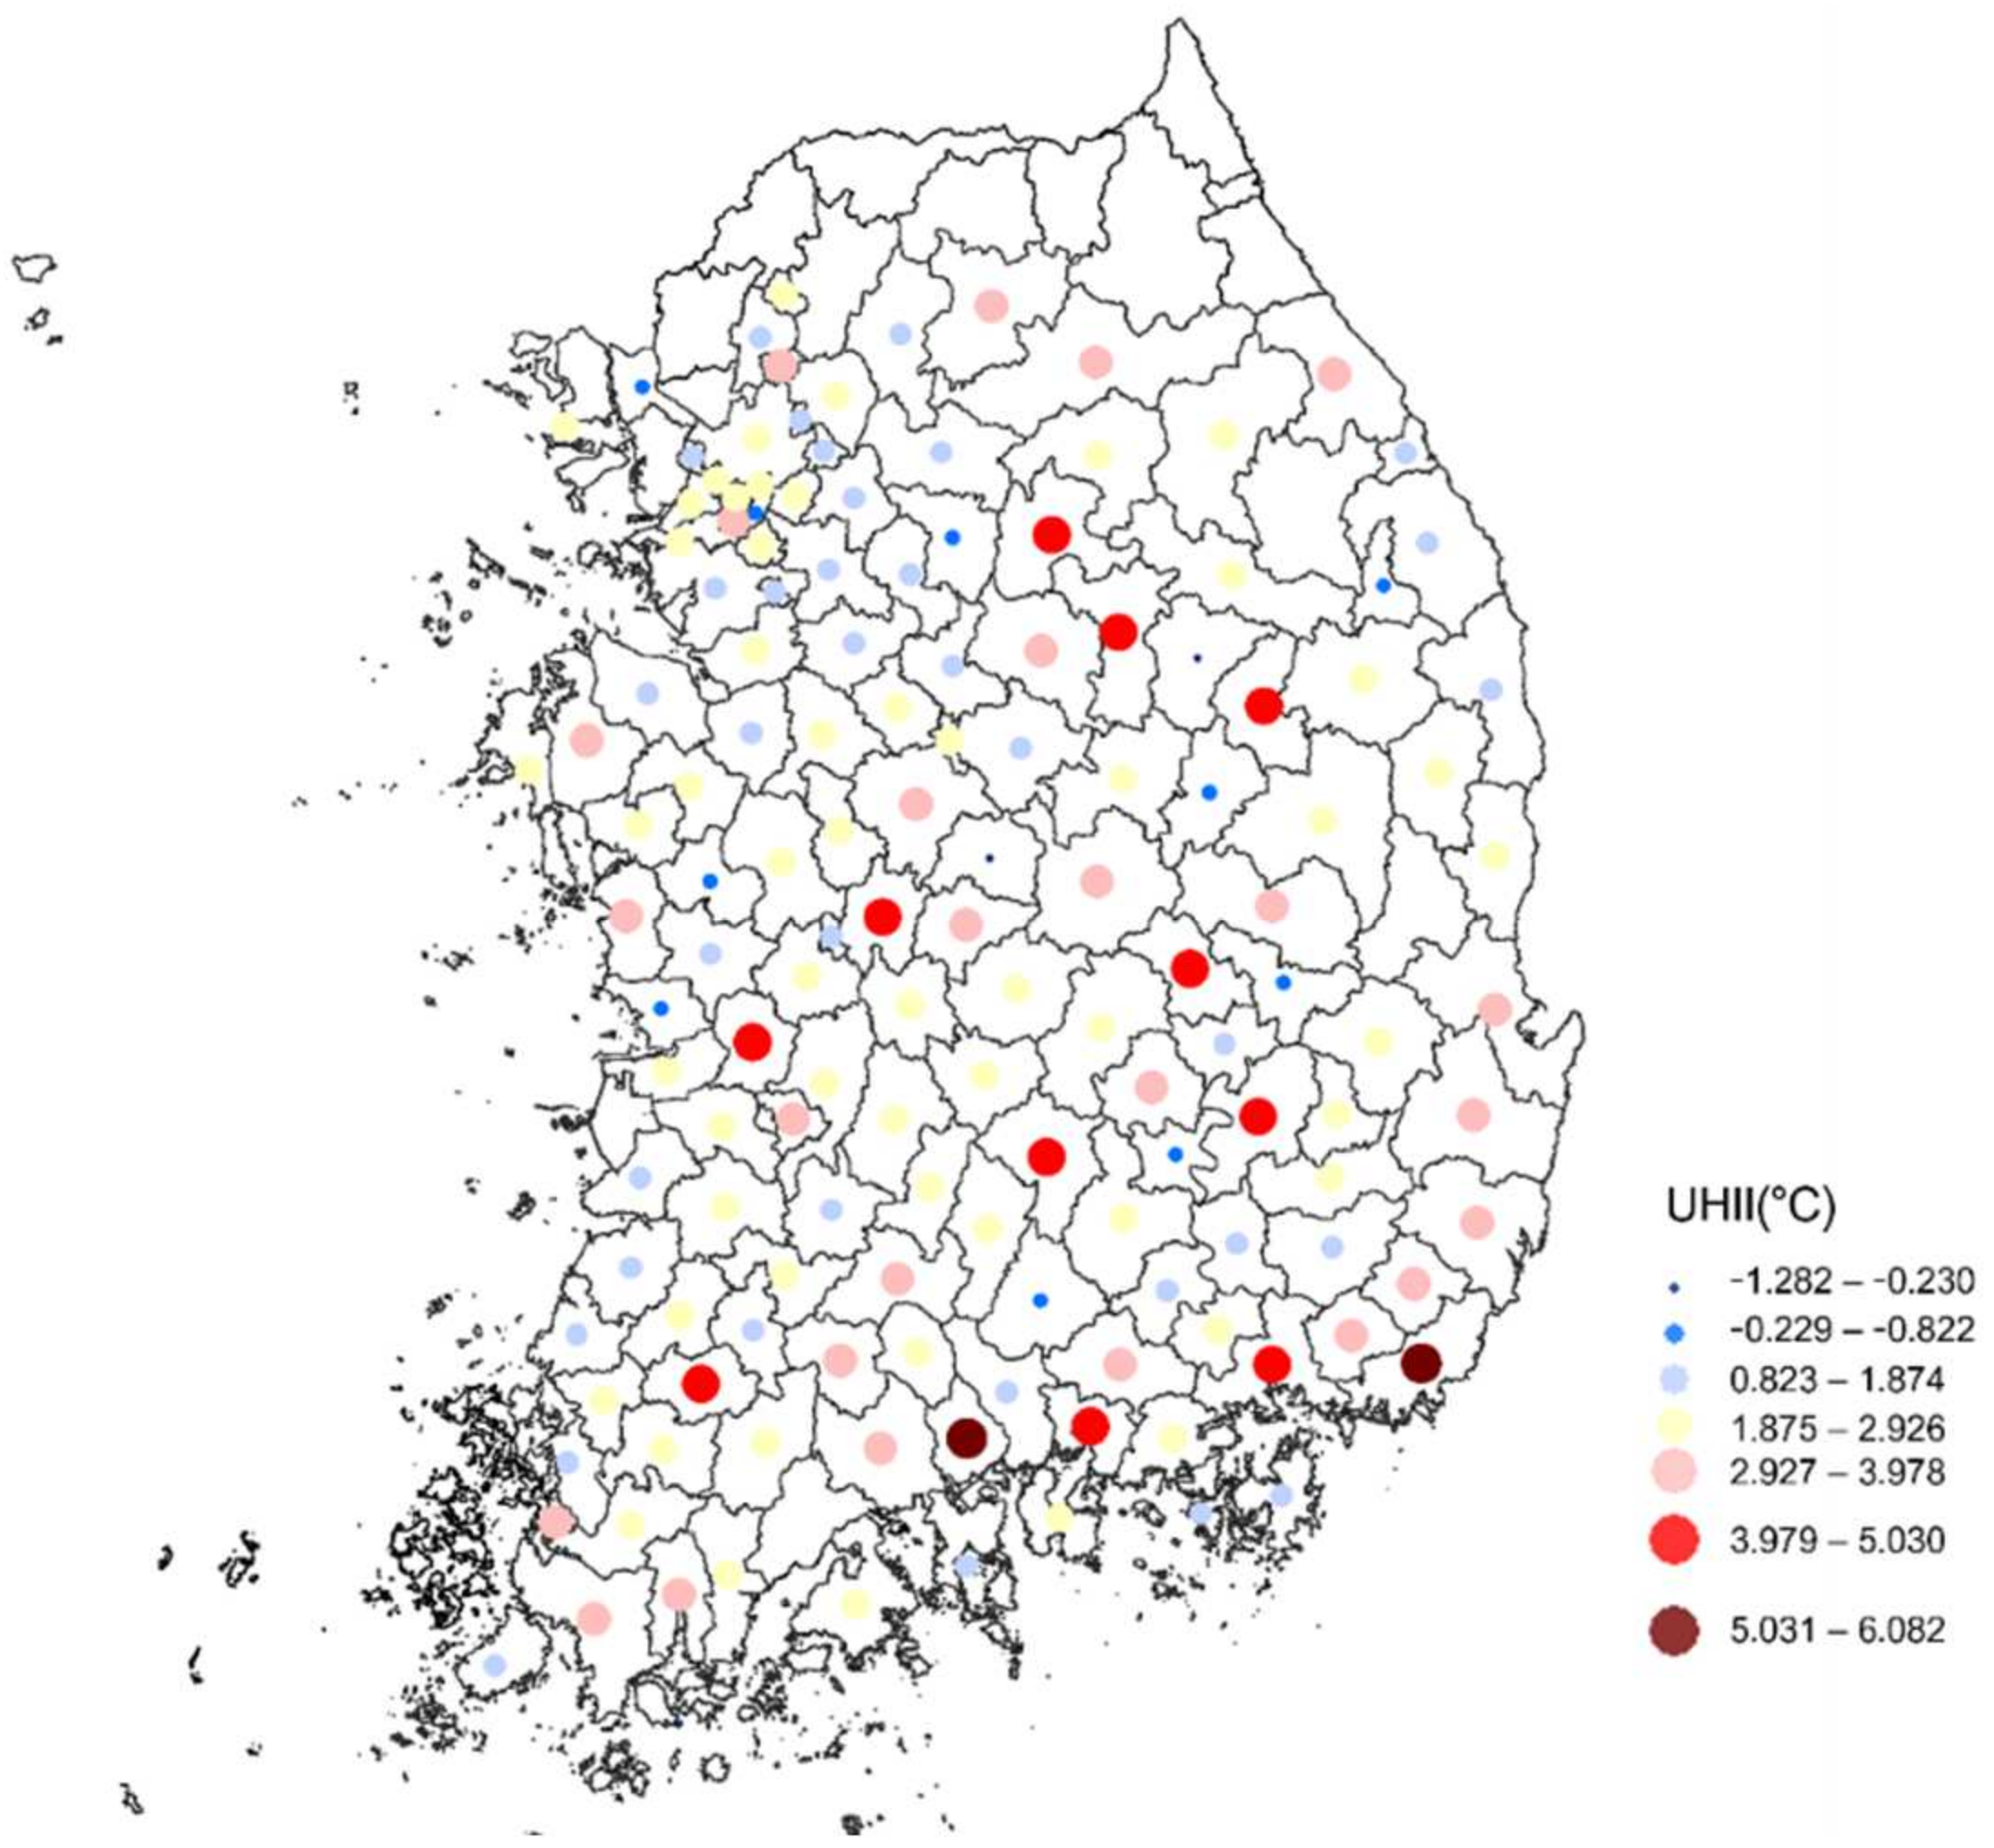
Figure 5 shows the urban heat island intensity calculated using the above methodology.
4.2. Urban Form Index
At the macroscopic level, the characteristics of urban forms related to urban heat islands include city size, compactness, distribution, and connectivity (
Table 1). Regarding city size, several studies have suggested that large cities tend to have higher
UHI intensities [
10,
37]. Evidence also exists of the association between the urban heat island effect and urban compactness and dispersion [
38,
39]. When air conditioner use increases in summer in a compact urban structure, hot air is excessively discharged into the outdoor environment, and a city’s high density may increase humidity, interfere with the natural ventilation pattern, and reduce passive cooling through evaporation and proliferation. As a result, the development of a compact city that has not implemented appropriate cooling measures, such as expanding green spaces, may enhance the urban heat island effect because of changes in the urban microclimate [
40]. In addition, at the fractal level, it has been found that city compactness is related to urban heat islands [
10]. Connectivity is related to resilience in urban heat island reduction. Implementing appropriate urban design for landscape connection can prevent urban landscape fragmentation, ease urban heat islands, and improve air quality, flood control, management, and access to ecosystem services [
40,
41,
42].
The indices for urban form are classified into several categories, including Entropy Index, Gini Coefficient, Global Moran’s I index and Fragstats Index. In this study, the Fragstats Index was used to match the hierarchy between two different scale analyses. In the micro-scale analysis LCZ (Local Climate Zone), which is land cover-based data, was used. For comparison with the micro-scale, land cover-based data (Fragstats Index) was also used at the macro–scale.
For this study, urban geometry variables were used for the urban form index. To calculate the data, the land cover map (2018–2019) provided by the Korea Environmental and Spatial Information Service was processed, and the landscape ecology program FRAGSTATS was used. FRAGSTATS can obtain the landscape index at three levels (patch, class, and landscape) and is useful for obtaining geometric values, such as fragmentation and connectivity [
43]. In this study, the fractal dimension index (
FRAC), continuity index (
CONTIG), and aggregation index (
AI) were used (
Table 2). The fractal dimension index represents the complexity of the shape and the compactness of the geometric city in the fractal dimension. The continuity index represents the spatial connectivity of each landscape cell, and the higher this index, the more the landscape is connected without breaks. The aggregation index indicates how unfragmented and aggregated the urbanized areas are, and the higher the value, the more relaxed the degree of urban sprawl
4.3. Control Variables
To remove the influence of the third variable acting between the urban form and the urban heat island variable, control variables were selected: the digital elevation model (DEM), which controls the influence of urban heat islands due to geographical factors, and the normalized difference vegetation index (NDVI), which controls the influence of urban heat islands due to vegetation. In the case of DEM data, the 90M DEM dataset provided by the National Spatial Information Portal was used. For the NDVI index, the multiyear summer average NDVI was calculated using the MODIS Terra 16-day complex (MYD11A2, version 6) NDVI product for summer (June–August) from 2018 to 2020.
Table 3 shows the descriptive statistics for all described variables.
4.4. Multiple Regression Analysis
For macro-scale analysis, the effect of each urban form’s characteristics on the urban heat island effect was identified to analyze vulnerable urban forms at the city level. Therefore, the relationship between urban heat island intensity (∆T) and urban form indices was quantified by adopting a multiple regression model.
4.5. Local Climate Zone (LCZ) Classification
For micro-scale analysis, detailed land-use patterns within cities were created to identify which land-use patterns are vulnerable to urban heat islands. The most suitable method for this approach is LCZ classification. The landcover products provided by MODIS have a limited number of grades related to urban surface, so each different urban structure appearing in various cities cannot be easily analyzed with existing land cover products [
17]. To overcome this problem, LCZ have been introduced. In this classification system, cities are divided into 17 grades, of which 10 grades (1–10) consist of urban types and the remaining 7 types (A–G) consist of other land cover types (
Table 4). This classification system was originally designed to provide a framework for urban heat island research, making it possible to observe the standardized exchange of urban temperatures [
44]. The LCZ grade is officially defined as “a region of uniform surface cover, structure, material, and human activity ranging from hundreds of meters to several kilometers,” excluding “culturally or locally unique class names and definitions” [
45]. In 2015, as part of the community-based World Urban Database and Access Portal Tools (WUDAPT) project, a protocol was developed to map cities into LCZs using open-source data and software packages, and an online platform is currently being provided to do this.
5. Results
5.1. Macro-Scale Analysis
First, using histograms and Q–Q plots, it was confirmed that the analysis model satisfied the assumption of normality. In addition, the Durbin–Watson value was 1.951, indicating that the independence of the residual was also satisfied. The coefficient of determination of the analysis model was 0.351. Also, the VIF values for all variables were less than 10, indicating that this model had no problem of multicollinearity.
Table 5 shows the results of the multiple regression analysis model.
The size and density type represents the compactness of a city in terms of density. A city’s size is a quantitative indicator that distinguishes whether it is a large or small city, and the two widely used measures for city size are population and area [
46]. A linear relationship exists between population and area, which indicates that density increases to a certain level as urban areas increase [
40,
46]. Accordingly, this type consists of variables related to a city’s size or density. In this study, the area variable had a significant effect on the intensity of urban heat islands. The larger the city’s area, the higher the urban heat island’s strength, and this finding is consistent with previous studies suggesting that large cities tend to have higher
UHI intensity [
10,
37]. The criteria for city size were set based on the population and area, but the characteristics related to the population did not significantly affect the urban heat island.
The geometric dimension type represents the geometric characteristics of the urban form. This type consists of an index indicating the compactness of a geometric city, the degree of dispersion and cohesion, and spatial continuity. The variables that have been shown to significantly affect this type are the continuity (CONTIG) and aggregation (AI) indices. First, the AI index was found to have a very significant effect on urban heat islands in a positive direction. The higher the AI index value, the more relaxed the degree of urban sprawl, indicating that the more compact a city is, the higher the urban heat island intensity is. The CONTIG index showed a significant effect in a negative direction. The higher the CONTIG index value was, the higher the spatial connectivity of the landscape was. Because the continuity index was calculated based on the urbanized area, the higher the spatial connectivity of the urbanized area was, the lower the urban heat island intensity was. The fact that urban areas are connected without being cut off means that they have not been developed in a sporadic pattern, which also means that the city has been developed in a compact pattern. Therefore, it can be interpreted that the intensity of urban heat islands increases as cities are developed in a compact pattern in terms of connectivity. In summary, regarding the geometric dimension type, an index was constructed that can represent urban compactness in various aspects. However, each variable representing compactness influenced the intensity of urban heat islands in different directions. The aggregation characteristic increased the urban heat island intensity, and the connectivity decreased the urban heat island intensity. This finding suggests that the effect on the intensity of urban heat islands may differ depending on each characteristic representing urban compactness.
Regarding natural and geographic characteristics, they are configured to control the effect of increasing and decreasing of UHI intensity due to third factors. For this type, the DEM variable showed a significant effect in the negative direction.
In this study, a null hypothesis was established: a compact urban form would alleviate urban heat islands. As a result of the analysis, it seems difficult to reject the null hypothesis and adopt the alternative hypothesis; the compact urban form, in terms of city size and aggregation resulted in increased urban heat islands, but in terms of connectivity, it resulted in reduced urban heat islands. However, in the process of hypothesis verification, this study found meaningful facts. Even for the same city form, the influence of the city form can vary depending on the perspective of interpreting the form. Therefore, it is necessary to establish an urban heat island mitigation strategy that considers that a city’s compactness has different effects on urban heat islands depending on the connectivity and aggregation representing the density of development.
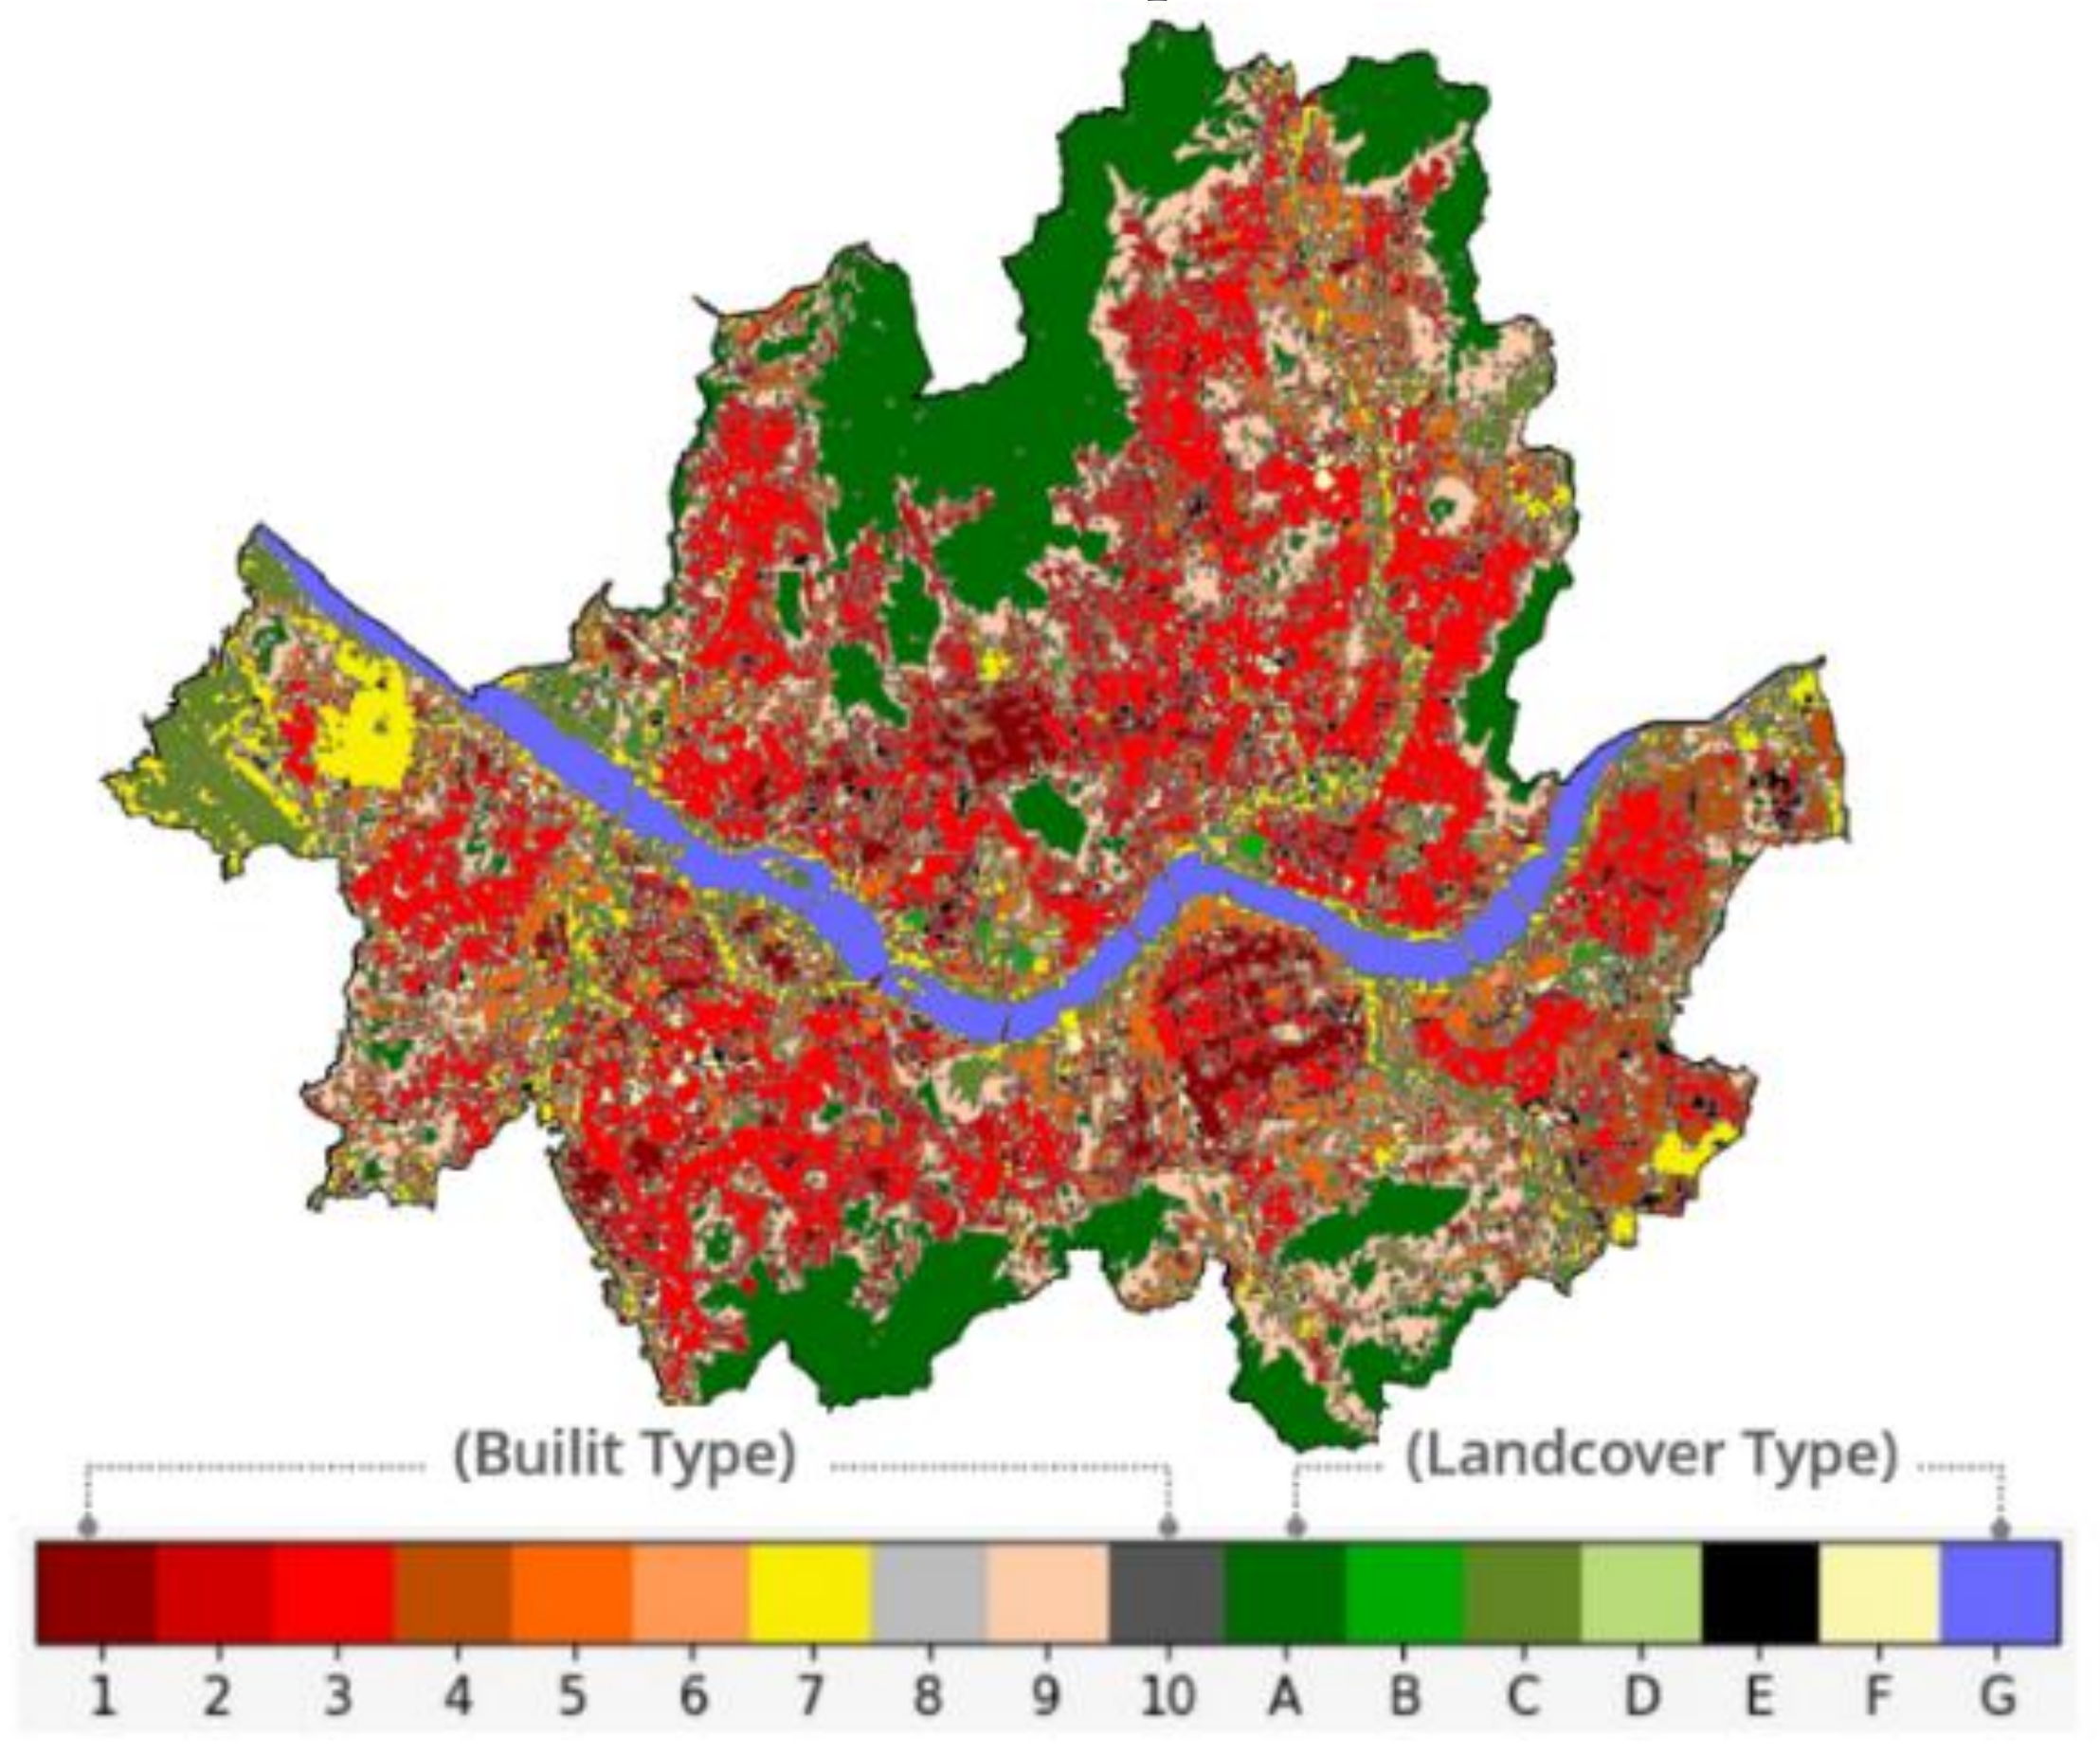
5.2. Micro–Scale Analysis
The LCZs for Seoul were obtained from the related
online platform LCZ Generator [
47] (
Figure 6). Although Seoul has a very high urbanization rate because most of the urban areas are developed, the intensity of the urban heat island is relatively low compared to other large cities (Seoul 2.31; Busan 6.08; Daegu 4.25). Therefore, it was necessary to use a microscopic scale analysis to identify the detailed urban types in Seoul and to analyze which types were vulnerable to urban heat islands. Regarding LCZs in Seoul, all areas except LCZ 10 (heavy industry) existed, making it easy to identify detailed urban forms vulnerable to urban heat islands. The LCZ Generator provides overall accuracy (OA) for the provided LCZ. The OA for the Seoul data was 0.71, which is quite high among LCZs provided by the LCZ Generator (minimum accuracy 0; maximum accuracy 0.95). In the micro-scale analysis,
LST data was used instead of
UHI intensity, which was used in the macro-scale analysis, because the
UHI intensity data is built on a city-level basis. Because
LST is raster data, it can be processed for each cell intended by the researcher.
In addition, temperature data with real recording in the weather stations could be used. However, in the case of this data, there were only 27 observation stations. Therefore, spatial interpolation methodology had to be used to compare with LCZ, but it was not used in this study due to high uncertainty. However, since the modification coefficient between the two variables for both MOD11A1
LST and AWS ground temperature data (real recording data) is 0.495, showing a high correlation,
LST data can be used as an alternative to real recording data [
48].
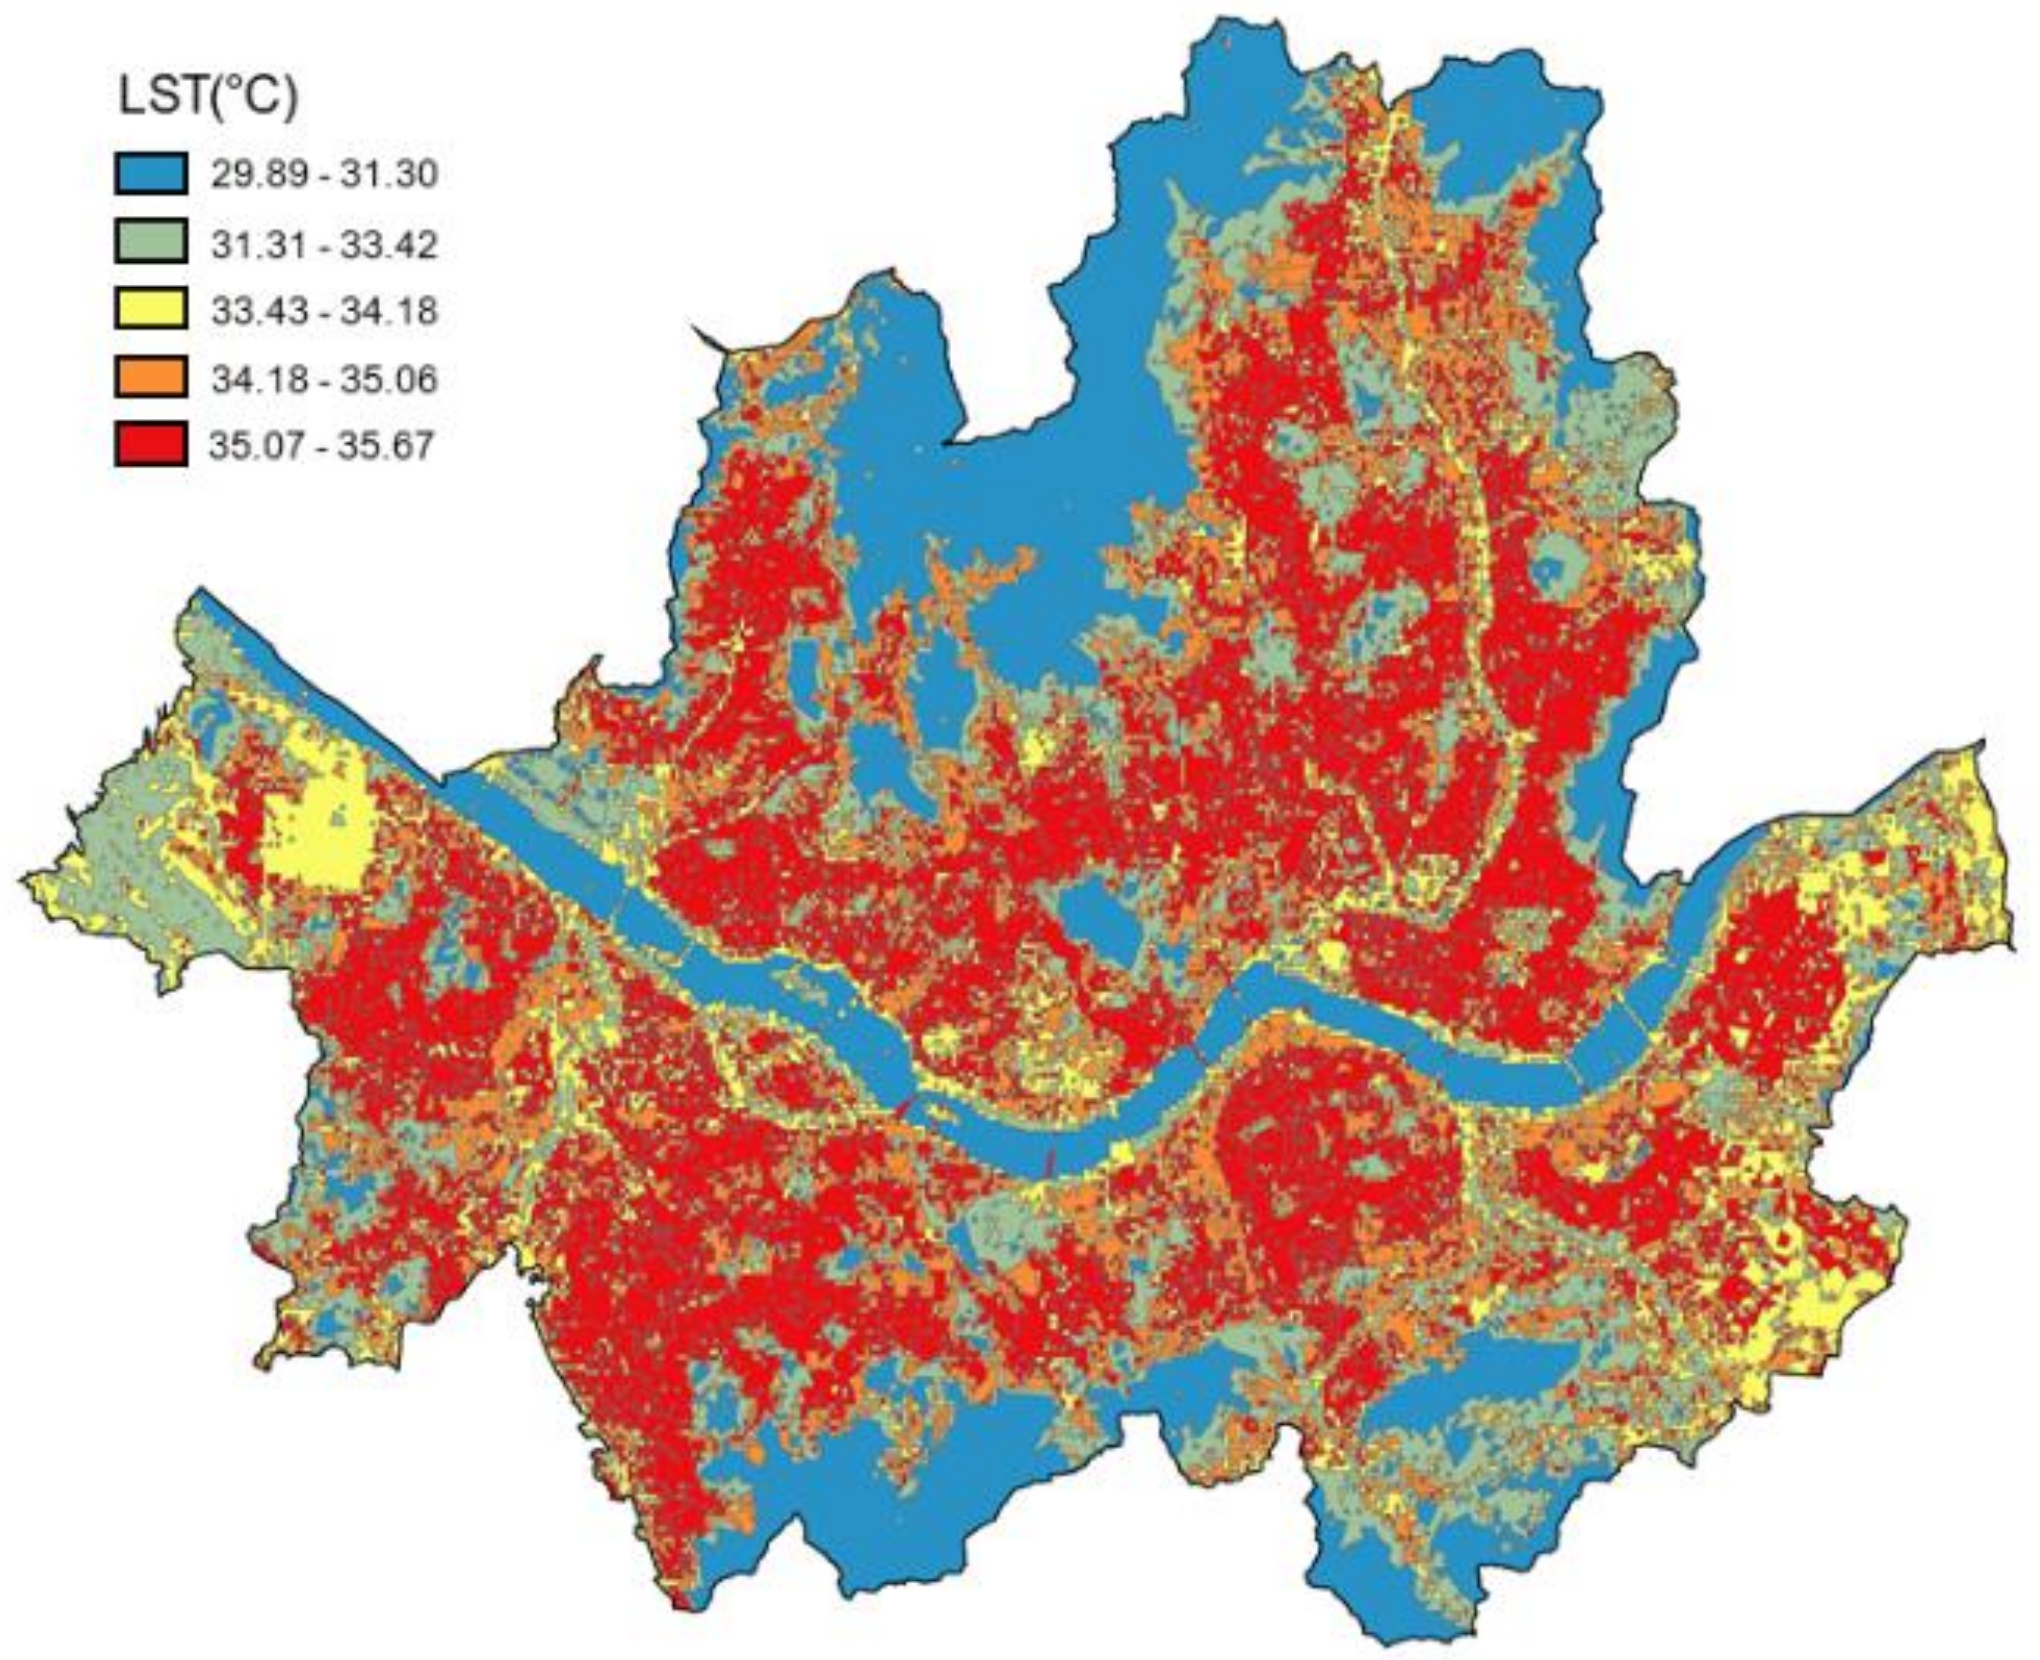
Figure 7 is an
LST map constructed in the same size as the detailed cells of LCZs in Seoul.
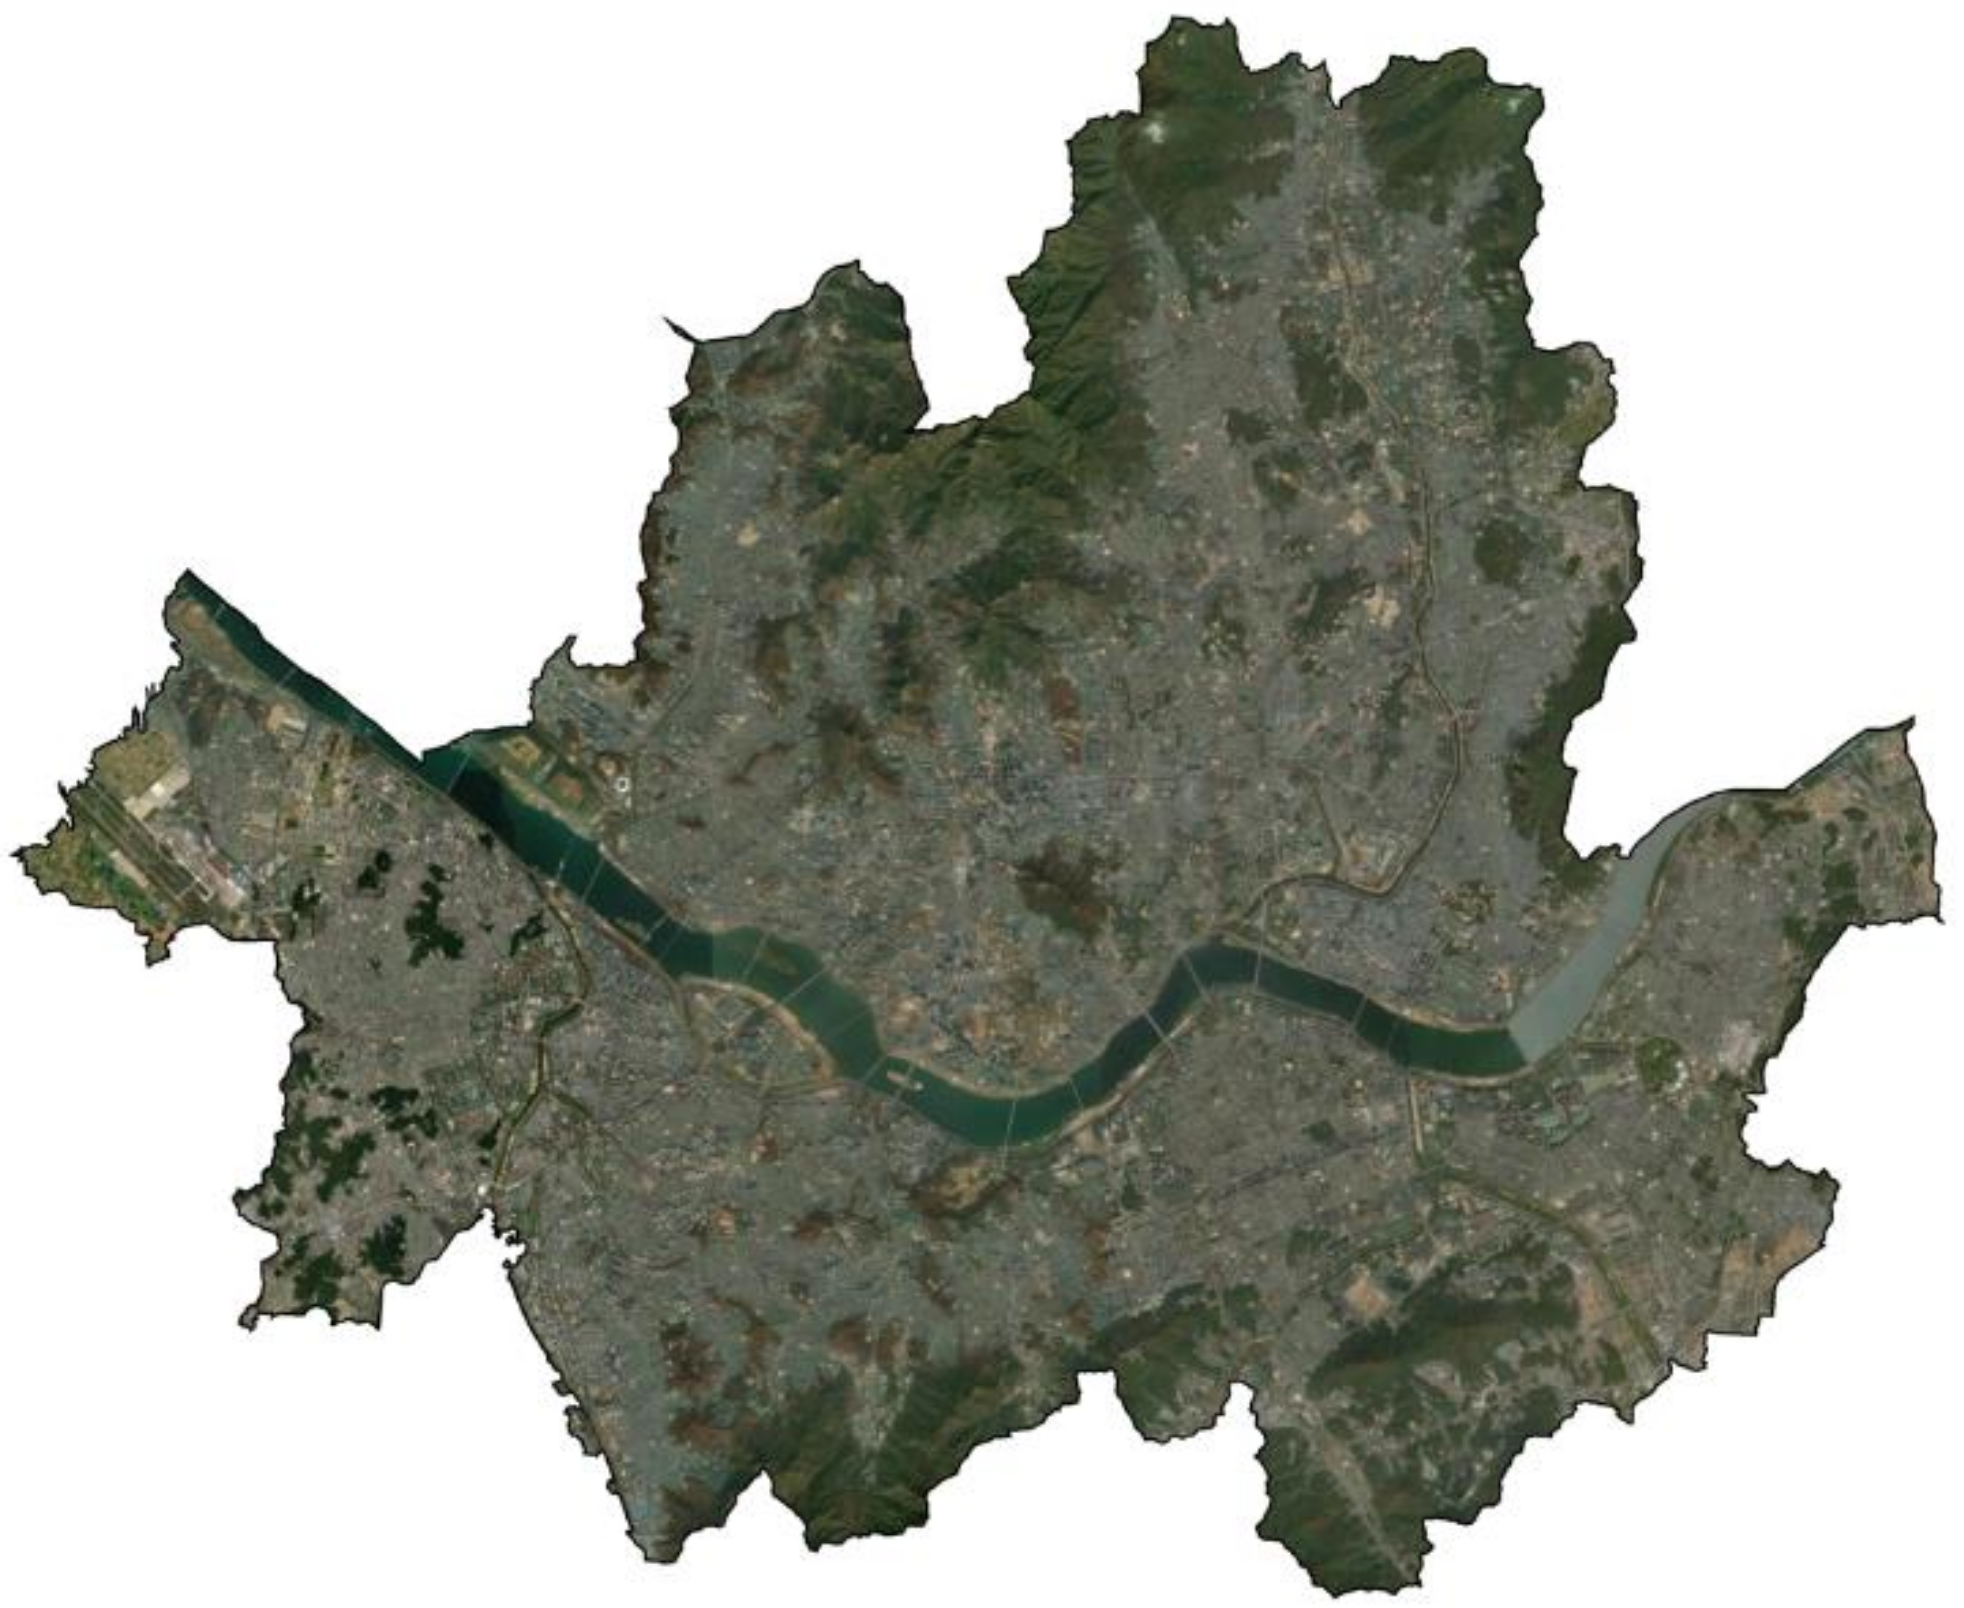
Figure 8 is a satellite image of the city presented for comparison with
Figure 6 and
Figure 7.
Finally, detailed areas vulnerable to high temperatures were calculated using LCZ data and
LST data built in units of cells (
Table 6). First, regarding research hypothesis 2, because the
LST appeared to be different for each LCZ, it seems that the null hypothesis can be rejected, and the alternative hypothesis adopted. As a result of the analysis, the LCZs, which are vulnerable to high temperatures in Seoul, were found in the order of LCZ 3 (compact low-rise), LCZ 1 (compact high-rise), and LCZ F (bare soil or sand). Overall, the
LST was high in areas where many buildings were concentrated. In addition, even in the same urbanized area, the
LST was low when the buildings were somewhat separated, such as in LCZ 4-6. When looking at LCZs 1, 3, 4, and 6, the
LST was lower in the area where the building height was low, even if the buildings were equally concentrated. It is thought that the
LST was relatively low in the area with a high average building height because of the shade caused by the height. Most of the green areas showed lower surface temperatures, and even in the same area, the surface temperature was lower if the green areas were densely formed. In summary, the high-density development pattern is vulnerable to high temperatures, but controlling building height and creating many dense green areas throughout the city can alleviate the high-temperature phenomenon in the area.
6. Conclusions
As urban problems arise in fields related to the environment, energy, climate, and transportation, approaches to urban form are discussed as ways to solve these issues. Discussions of urban form have mainly dealt with dispersion and concentration. The sprawl form aims to provide cheap and comfortable residential environments by developing the outskirts, whereas the compact form aims to develop the city center and provide public services to obtain the benefits of agglomeration. After the discovery of several problems with the sprawl form, the compact urban form has become a paradigm in urban planning, but as Gordon and Richardson (1997) pointed out, the “compact city” will not be able to solve all urban problems. The urban heat island phenomenon is one of these urban problems.
In other words, there is a conflicting point between the urban heat island problem and the sustainable development aimed at by the compact urban form. To discuss these conflicting points, this study presented theories and previous studies on the relationship between urban heat islands and urban forms and analyzed the effect of urban form on urban heat islands on two scales. The analysis results are summarized as follows.
First, in this study, the effect of urban heat islands was expected to increase as cities were developed in a compact form in the hypothesis setting process, but the effect on urban heat islands was different depending on the characteristics of urban forms. In terms of city size and aggregation, compact urban forms increase the urban heat island effect, but compact urban forms in terms of connectivity have resulted in alleviating the urban heat island effect. Second, in micro-scale analysis, a significant difference in LST occurred according to each LCZ, and a difference in LST value occurred according to density, height, and land cover.
7. Discussion
According to the macro-scale analysis results of this study, urban compactness increases the intensity of urban heat islands not only in terms of simple high density but also in geometric dimensions. How can we answer the question of whether a compact urban form should be directed toward a sprawled urban form because it is vulnerable to urban heat islands? In this study, we answered this question by stating that it cannot be done. We have made this statement because scholars in various fields have been raising concerns about problems with urban sprawl since Gordon and Richardson (1997) [
49] and Ewing (1997) [
1] published a debate about urban sprawls and compact cities in the Journal of the American Planning Association. In addition, the impact of compactness may vary depending on the perspective of interpreting compact urban forms. Accordingly, this study examined compact urban forms from a macroscopic perspective and mixed the forms, using a microscopic perspective, to examine how to mitigate urban heat islands. High density increases urban heat islands on a macro-scale, but when considering the micro-scale, the heat island effect can be mitigated by applying multiple mitigation strategies with high density. In this regard, Berardi and Wang (2016) demonstrated that increasing density through high-rise buildings can provide shading benefits under summer conditions and reduce
UHI effects [
50]. This result has also been demonstrated in the micro-scale analysis in this study. In addition, the
UHI effect can be mitigated by utilizing smart design solutions that promote better ventilation conditions (e.g., including a mixture of high and low buildings in the site) [
40].
If an urban planning approach is proposed, urban heat islands can be mitigated by mixing transect planning. This planning theory is that of Andres Duany, an American architect and urban planner, and it is an effort to solve the question of what urban sprawl is and what problems it causes by using form rather than zoning and density. In transect planning, the concept of a sector that subdivides the continuous environment between non-development and development sites further increases the density of the city center and further inhibits development where conservation is needed [
51]. It is possible to alleviate urban heat islands by easing building height limits in downtown areas where high density is required and securing more green space through transit planning. This urban transect theory approach is a good example of enhancing resilience to disasters by strengthening the landscape connectivity of cities [
52,
53]. The fact that urban connectivity reduces the urban heat island effect has been well demonstrated in the macro-scale analysis of this study. In addition, form-based codes, which act as regulatory means to achieve a specific urban shape, can be used as urban planning techniques to improve urban heat islands.
According to this study, the relationship between urban forms and urban heat islands in macroscopic and microscopic units should be identified. This study is meaningful in that it discusses sustainable urban forms by analyzing urban forms vulnerable to urban heat islands on a macroscopic and microscopic scale and provides urban planning measures to alleviate urban heat islands. In addition, regarding the verification, first, the analysis results were compared and analyzed with the results of previous studies, and second, in the case of data, it was intended to increase the reliability of data use by presenting comparisons with alternative data. However, in micro-scale analysis, the reliability of LST data was not improved by using various temperature data along with average LST data, and there is also a limit to the failure to improve the reliability of macro-scale analysis results using panel data. In the future, researchers should use panel data to avoid the distortion caused by not considering time series. And, as more LCZs are built in more regions, more meaningful studies can be conducted. In addition, if future studies deal with the changes in urban form caused by the emergence of smart cities, more profound discussions on urban form can be conducted.
Author Contributions
Conceptualization, S.K., D.L. and J.J.; methodology, S.K.; formal analysis, S.K.; investigation, J.P.; writing—original draft preparation, S.K.; writing—review and editing, J.P. and J.J.; visualization, S.K.; supervision, J.J.; All authors have read and agreed to the published version of the manuscript.
Funding
This work was supported by the National Research Foundation of Korea (Grant number NRF-2020R1F1A1074105). This work is financially supported by Korea Ministry of Land, Infrastructure and Transport (MOLIT) as “Innovative Talent Education Program for Smart City”.
Institutional Review Board Statement
Not applicable.
Informed Consent Statement
Not applicable.
Data Availability Statement
Data available in a publicly accessible repository that does not issue DOIs. Publicly available datasets were analyzed in this study. This data can be found here: [
47].
Conflicts of Interest
The authors declare no conflict of interest.
References
- Ewing, R. Is Los Angeles-style sprawl desirable? J. Am. Plan. Assoc. 1997, 63, 107–126. [Google Scholar] [CrossRef]
- Burton, E. The compact city: Just or just compact? A preliminary analysis. Urban Stud. 2000, 37, 1969–2006. [Google Scholar] [CrossRef]
- Burton, E. The compact city and social justice. In Housing, Environment and Sustainability. Housing Studies Association Spring Conference; University of York: New York, NY, USA, 2001. [Google Scholar]
- Van Der Waals, J. The compact city and the environment: A review. Tijdschr. Econ. Soc. Geogr. 2000, 91, 111–121. [Google Scholar] [CrossRef]
- Neuman, M. The compact city fallacy. J. Plan. Educ. Res. 2005, 25, 11–26. [Google Scholar] [CrossRef]
- Lin, J.J.; Yang, A.T. Does the compact-city paradigm foster sustainability? An empirical study in Taiwan. Environ. Plan. B: Plan. Des. 2006, 333, 365–380. [Google Scholar] [CrossRef]
- Boussauw, K.; Neutens, T.; Witlox, F. Relationship between spatial proximity and travel-to-work distance: The effect of the compact city. Reg. Stud. 2012, 466, 687–706. [Google Scholar] [CrossRef]
- Mouratidis, K. Compact city, urban sprawl, and subjective well-being. Cities 2019, 92, 261–272. [Google Scholar] [CrossRef]
- Yang, L.; Niyogi, D.; Tewari, M.; Aliaga, D.; Chen, F.; Tian, F.; Ni, G. Contrasting impacts of urban forms on the future thermal environment: Example of Beijing metropolitan area. Environ. Res. Lett. 2016, 113, 034018. [Google Scholar] [CrossRef] [Green Version]
- Zhou, B.; Rybski, D.; Kropp, J.P. The role of city size and urban form in the surface urban heat island. Sci. Rep. 2017, 7, 4791. [Google Scholar] [CrossRef]
- Liang, Z.; Wu, S.; Wang, Y.; Wei, F.; Huang, J.; Shen, J.; Li, S. The relationship between urban form and heat island intensity along the urban development gradients. Sci. Total Environ. 2020, 708, 135011. [Google Scholar] [CrossRef]
- Avner, P.; Rentschler, J.; Hallegatte, S. Carbon Price Efficiency: Lock-in and Path Dependence in Urban Forms and Transport Infrastructure; World Bank: Washington, DC, USA, 2014. [Google Scholar]
- Arnfield, A.J. Two decades of urban climate research: A review of turbulence, exchanges of energy and water, and the urban heat island. Int. J. Climatol. A J. R. Meteorol. Soc. 2003, 23, 1–26. [Google Scholar] [CrossRef]
- Tan, M.; Li, X. Quantifying the effects of settlement size on urban heat islands in fairly uniform geographic areas. Habitat Int. 2015, 49, 100–106. [Google Scholar] [CrossRef]
- Tu, L.; Qin, Z.; Li, W.; Geng, J.; Yang, L.; Zhao, S.; Wang, F. Surface urban heat island effect and its relationship with urban expansion in Nanjing, China. J. Appl. Remote Sens. 2016, 10, 026037. [Google Scholar] [CrossRef] [Green Version]
- Yang, J.; Wang, Y.; Xiu, C.; Xiao, X.; Xia, J.; Jin, C. Optimizing local climate zones to mitigate urban heat island effect in human settlements. J. Clean. Prod. 2020, 275, 123767. [Google Scholar] [CrossRef]
- Yoo, C.; Lee, Y.; Cho, D.; Im, J.; Han, D. Improving local climate zone classification using incomplete building data and Sentinel 2 images based on convolutional neural networks. Remote Sens. 2020, 12, 3552. [Google Scholar] [CrossRef]
- Somers, K.A.; Bernhardt, E.S.; McGlynn, B.L.; Urban, D.L. Downstream Dissipation of storm flow heat pulses: A case study and its landscape-level implications. JAWRA J. Am. Water Resour. Assoc. 2016, 52, 281–297. [Google Scholar] [CrossRef]
- Mohajerani, A.; Bakaric, J.; Jeffrey-Bailey, T. The urban heat island effect, its causes, and mitigation, with reference to the thermal properties of asphalt concrete. J. Environ. Manag. 2017, 197, 522–538. [Google Scholar] [CrossRef] [PubMed]
- Santamouris, M. Recent progress on urban overheating and heat island research. Integrated assessment of the energy, environmental, vulnerability and health impact. Synergies with the global climate change. Energy Build. 2020, 207, 109482. [Google Scholar] [CrossRef]
- Vaidyanathan, A.; Malilay, J.; Schramm, P.; Saha, S. Heat-Related Deaths—United States, 2004–2018. Morb. Mortal. Wkly. Rep. 2020, 69, 729. [Google Scholar] [CrossRef] [PubMed]
- Tan, J.; Zheng, Y.; Tang, X.; Guo, C.; Li, L.; Song, G.; Chen, H. The urban heat island and its impact on heat waves and human health in Shanghai. Int. J. Biometeorol. 2010, 54, 75–84. [Google Scholar] [CrossRef]
- Stone, B., Jr.; Rodgers, M.O. Urban form and thermal efficiency: How the design of cities influences the urban heat island effect. J. Am. Plan. Assoc. 2001, 67, 186. [Google Scholar] [CrossRef]
- Bornstein, R.; Lin, Q. Urban heat islands and summertime convective thunderstorms in Atlanta: Three case studies. Atmos. Environ. 2000, 34, 507–516. [Google Scholar] [CrossRef]
- Kalnay, E.; Cai, M. Impact of urbanization and land-use change on climate. Nature 2003, 423, 528–531. [Google Scholar] [CrossRef] [PubMed]
- Rotach, M.W.; Vogt, R.; Bernhofer, C.; Batchvarova, E.; Christen, A.; Clappier, A.; Voogt, J.A. BUBBLE–an urban boundary layer meteorology project. Theor. Appl. Climatol. 2005, 81, 231–261. [Google Scholar] [CrossRef] [Green Version]
- Grossman-Clarke, S.; Liu, Y.; Zehnder, J.A.; Fast, J.D. Simulations of the urban planetary boundary layer in an arid metropolitan area. J. Appl. Meteorol. Climatol. 2008, 47, 752–768. [Google Scholar] [CrossRef] [Green Version]
- Zhang, D.L.; Shou, Y.X.; Dickerson, R.R. Upstream urbanization exacerbates urban heat island effects. Geophys. Res. Lett. 2009, 36, 1–5. [Google Scholar] [CrossRef] [Green Version]
- Ha, S.K. Future tasks and challenges of urban planning and urban policy. J. Environ. Stud. 2013, 52, 19–26. [Google Scholar]
- Wan, Z.; Dozier, J. A generalized split-window algorithm for retrieving land-surface temperature from space. IEEE Trans. Geosci. Remote Sens. 1996, 34, 892–905. [Google Scholar]
- Wan, Z.; Li, Z.L. A physics-based algorithm for retrieving land-surface emissivity and temperature from EOS/MODIS data. IEEE Trans. Geosci. Remote Sens. 1997, 35, 980–996. [Google Scholar]
- Wan, Z. New refinements and validation of the collection-6 MODIS land-surface temperature/emissivity product. Remote Sens. Environ. 2014, 140, 36–45. [Google Scholar] [CrossRef]
- Yao, R.; Wang, L.; Huang, X.; Zhang, W.; Li, J.; Niu, Z. Interannual variations in surface urban heat island intensity and associated drivers in China. J. Environ. Manag. 2018, 222, 86–94. [Google Scholar] [CrossRef] [PubMed]
- Imhoff, M.L.; Zhang, P.; Wolfe, R.E.; Bounoua, L. Remote sensing of the urban heat island effect across biomes in the continental USA. Remote Sens. Environ. 2010, 114, 504–513. [Google Scholar] [CrossRef] [Green Version]
- Zhou, D.; Zhao, S.; Liu, S.; Zhang, L.; Zhu, C. Surface urban heat island in China’s 32 major cities: Spatial patterns and drivers. Remote Sens. Environ. 2014, 152, 51–61. [Google Scholar] [CrossRef]
- Park, C.; Lee, D.; Sung, S.; Park, J.; Jeong, S. Analyzing the diurnal and spatial variation of surface urban heat island intensity distribution: Focused on 30 cities in Korea. J. Korea Plan. Assoc. 2016, 51, 125–136. [Google Scholar] [CrossRef]
- Zhao, L.; Lee, X.; Smith, R.B.; Oleson, K. Strong contributions of local background climate to urban heat islands. Nature 2014, 511, 216–219. [Google Scholar] [CrossRef]
- Adachi, S.A.; Kimura, F.; Kusaka, H.; Duda, M.G.; Yamagata, Y.; Seya, H.; Aoyagi, T. Moderation of summertime heat island phenomena via modification of the urban form in the Tokyo metropolitan area. J. Appl. Meteorol. Climatol. 2014, 53, 1886–1900. [Google Scholar] [CrossRef]
- Schwarz, N.; Manceur, A.M. Analyzing the influence of urban forms on surface urban heat islands in Europe. J. Urban Plan. Dev. 2015, 141, A40140032015. [Google Scholar] [CrossRef]
- Sharifi, A. Resilient urban forms: A macro-scale analysis. Cities 2019, 85, 1–14. [Google Scholar] [CrossRef]
- Ahern, J. Urban landscape sustainability and resilience: The promise and challenges of integrating ecology with urban planning and design. Landsc. Ecol. 2013, 28, 1203–1212. [Google Scholar] [CrossRef]
- Jayawardena, H.M.I.D.P.; van Roon, M. Water sensitive planning and design as an ecologically inspired approach to delivering flood resilient urban environment in Sri Lanka. Water Pract. Technol. 2017, 12, 964–977. [Google Scholar] [CrossRef]
- Leitão, A.B.; Miller, J.; Ahern, J.; McGarigal, K. Measuring Landscapes: A Planner’s Handbook; Island Press: Washington, DC, USA, 2012. [Google Scholar]
- Stewart, I.D.; Oke, T.R. Local climate zones for urban temperature studies. Bull. Am. Meteorol. Soc. 2012, 93, 1879–1900. [Google Scholar] [CrossRef]
- Demuzere, M.; Kittner, J.; Bechtel, B. LCZ Generator: A web application to create Local Climate Zone maps. Front. Environ. Sci. 2021, 9, 1–18. [Google Scholar] [CrossRef]
- Louf, R.; Barthelemy, M. How congestion shapes cities: From mobility patterns to scaling. Sci. Rep. 2014, 4, 5561. [Google Scholar] [CrossRef] [PubMed]
- Choi, Y.; WUDAPT Level 0 Training Data for Seoul (Korea, Republic of), Submitted to the LCZ Generator. This Dataset is Licensed under CC BY-SA, and More Information is. Available online: https://lcz-generator.rub.de/factsheets/fbc9c7df7ca14092bd36398719e2e74bf3876887/fbc9c7df7ca14092bd36398719e2e74bf3876887_factsheet.html (accessed on 26 September 2021).
- Shin, H.S.; Chang, E.M.; Hong, S.W. Estimation of Near Surface Air Temperature Using MODIS Land Surface Temperature Data and Geostatistics. J. Korea Spat. Inf. Soc. 2014, 22, 55–63. [Google Scholar]
- Gordon, P.; Richardson, H.W. Are compact cities a desirable planning goal? J. Am. Plan. Assoc. 1997, 63, 95–106. [Google Scholar] [CrossRef]
- Berardi, U.; Wang, Y. The effect of a denser city over the urban microclimate: The case of Toronto. Sustainability 2016, 8, 822. [Google Scholar] [CrossRef]
- Duany, A.; Talen, E. Transect planning. J. Am. Plan. Assoc. 2002, 68, 245. [Google Scholar] [CrossRef]
- Ling, C.; Dale, A. Nature, place and the creative class: Three Canadian case studies. Landsc. Urban Plan. 2011, 99, 239–247. [Google Scholar] [CrossRef]
- Olazabal, M.; Chelleri, L.; Sharifi, A. Is connectivity a desirable property in urban resilience assessments. In Resilience-Oriented Urban Planning; Springer: Berlin/Heidelberg, Germany, 2018; Volume 65, pp. 195–211. [Google Scholar]
| Publisher’s Note: MDPI stays neutral with regard to jurisdictional claims in published maps and institutional affiliations. |
© 2022 by the authors. Licensee MDPI, Basel, Switzerland. This article is an open access article distributed under the terms and conditions of the Creative Commons Attribution (CC BY) license (https://creativecommons.org/licenses/by/4.0/).


