Article

Profiling (Non-)Nascent Entrepreneurs in Hungary Based on Machine Learning Approaches

by
Márton Gosztonyi
* and
Csákné Filep Judit
Office for Entrepreneurship Development, Budapest Business School University of Applied Sciences, 1149 Budapest, Hungary
*
Author to whom correspondence should be addressed.
Sustainability 2022, 14(6), 3571; https://doi.org/10.3390/su14063571
Submission received: 22 February 2022 / Revised: 9 March 2022 / Accepted: 11 March 2022 / Published: 18 March 2022

Abstract

:
In our study, we examined the characteristics of nascent entrepreneurs using the 2021 Global Entrepreneurship Monitor national representative data in Hungary. We examined our topic based on Arenius and Minitti’s four-category theory framework. In our research, we examined system-level feature sets with four machine learning modeling algorithms: multivariate adaptive regression spline (MARS), support vector machine (SVM), random forest (RF), and AdaBoost. Our results show that each machine algorithm can predict nascent entrepreneurs with over 90% adaptive cruise control (ACC) accuracy. Furthermore, the adaptation of the categories of variables based on the theory of Arenius and Minitti provides an appropriate framework for obtaining reliable predictions. Based on our results, it can be concluded that perceptual factors have different importance and weight along the optimal models, and if we include further reliability measures in the model validation, we cannot pinpoint only one algorithm that can adequately identify nascent entrepreneurs. Accurate forecasting requires a careful and predictor-level analysis of the algorithms’ models, which also includes the systemic relationship between the affecting factors. An important but unexpected result of our study is that we identified that Hungarian NEs have very specific previous entrepreneurial and business ownership experience; thus, they can be defined not as a beginner but as a novice enterprise.

1. Introduction

The exploration of the factors of entrepreneurial intention is a constantly evolving field of business research. In order to capture the characteristics of nascent entrepreneurs (NEs), we agree with Van Stel et al. [1] that analysis of both economic and non-economic factors is essential. Thus, in our group characteristics analysis, the goal was not only to explore the socio-economic context and individual characteristics and motivations but also to analyze the individual perceptions. Consequently, analytical methods that can handle system dynamism were essential for the analysis.
As a consequence, we worked with models based on machine learning for the system-wide analysis of the characteristics of nascent entrepreneurs. The idea that entrepreneurial activities are “complex social problems” that create nonlinear network loop systems and thus depend on dynamic properties that are very difficult to predict is well established in the entrepreneurial literature [2,3,4]. Nascent enterprises are thus complex adaptive systems [5] that incorporate interactive, nonlinear dynamic mechanisms. Machine learning methods offer very useful tools for accurate analysis of systems of such complexity due to their ability to take into account all available data and all possible interactions and nonlinear forms [6,7].
The aim of this paper was to examine the theories found in the international literature, adapting them to the Hungarian context and analyzing the effect that leads to nascent entrepreneurship with models based on complex machine learning (ML) methodology. In our study, we also performed a comparative analysis of machine learning algorithms and identified factors that play a significant role in nascent entrepreneurship. Thus, we could obtain an accurate picture of the usability of machine learning algorithms in nascent entrepreneurship.

2. Nascent Entrepreneurs

Several studies show that entrepreneurship has a positive effect on economic growth [8,9]. As a result, examining factors influencing entrepreneurship that can contribute to the development of the business ecosystem, which has a positive impact on economic growth and employment, has become an increasingly important area of research in recent years [10].
In our study, nascent entrepreneurs (NEs) were defined based on the definitions of Lueckgen et al. [11] and Wagner [12] as people who (alone or with others) are actively involved in setting up a new business and who expect to become owner(s) or co-owners of this economic entity in the future. The definition of nascent entrepreneur captures a point in the process of becoming an entrepreneur where the entrepreneurial intention and the gestation stage of an individual have been completed, and the entrepreneur is already devoting time and resources to the concrete foundation of his/her business idea [13,14,15]. This stage is followed by the realization of entrepreneurial behavior within a structured framework when the entrepreneurial activity already takes place with the achievement of sales income [16]. Although not all NEs reach the creation of a structured, income-generating enterprise, the existence of an NE is a critical point in the entrepreneurial life cycle; thus the factors influencing it deserve special attention [17].
According to Rotefoss and Kolvereid [18], NE studies can be divided into three categories as follows: research areas in which (1) the individual, the entrepreneur, is the focus, (2) the environmental, regional, or macro characteristics are emphasized in the development of the process, and, finally, (3) the research focuses on the actual activities of the entrepreneurs during the nascent period of the firm. In our analysis, we highlighted the first and second categories due to our cross-sectional data.
Demographic and economic factors were initially emphasized in mapping the characteristics of individuals who become entrepreneurs, but research on the impact of these factors on becoming a nascent entrepreneur is highly mixed. According to Delmar and Davidsson [19], Kolvereid [20], and Minniti [21], while the factors influencing entrepreneurship are the same for men and women, men are more likely to become nascent entrepreneurs. In contrast, Capelleras et al. [22] found no significant difference in the likelihood of women and men becoming entrepreneurs in their model, where the effects of human, social, and financial capital were included in the analysis. Mueller [23] hypothesized that the opportunity cost of those with higher incomes is higher and they are reluctant to give up their higher-paying employee work for precarious income from the business, yet their research found that self-employment is more attractive to those with higher incomes. In contrast, Kim et al. [24] found that neither household wealth nor household income increases the chances of becoming a nascent entrepreneur [22,25,26,27].
The results in the literature on the impact of education are not clear either. In the Swedish sample, the educational attainment of nascent entrepreneurs was measured to be higher than in the control group [19], while Capelleras et al. [22] found that those with higher education were less likely to become nascent entrepreneurs. However, in addition to education, the variety of skills acquired plays a greater role in becoming an entrepreneur. The more diverse and colorful the path an individual travels in education and can be characterized by switching between each educational opportunity, or the number of trainings completed, the more likely he or she is to become an entrepreneur [28]. Furthermore, the results of research examining various demographic factors show that nascent entrepreneurs are more prevalent among the younger and middle-aged population [1,17]. The propensity to start a business describes an inverse U-curve within the adult population according to age. Nagy et al. [29], on examining the entrepreneurial profiles of Croatia, Hungary, Romania, and Serbia, concluded that, except in Serbia, where NEs were most common in the 35–44-year-old age group, members of the 25–34-year-old age group were most likely to become entrepreneurs. Alomani at al. [30] found that cognitive abilities influence the nascent entrepreneurship process in two ways. Cognitive capital traits affect the outcome directly and indirectly, through boosting the impacts of human and social capital. Differences in cognitive traits may explain the different levels of success of nascent entrepreneurs with similar human and social capital resources. Cai et al. [31] also highlighted the importance of social capital and entrepreneurship education through entrepreneurial passion and entrepreneurial self-efficacy in nascent entrepreneurial behaviors.
In addition, a great number of studies explore the key role of environmental, socioeconomic, and macroeconomic variables in NEs [18,29,32]. Becoming an entrepreneur is influenced by geographical location, the economic performance of the country, and the local, business-friendly ecosystem [33,34]. Macroeconomic considerations are definitely considered by an individual when starting a business, and he or she chooses an entrepreneurial, self-employed way of life if the financial and non-financial benefits outweigh those of being employed [35,36,37]. However, Mueller [23] emphasized not only the availability of economic capital but also the role of social capital in these decisions.
Kirzner [38,39] highlighted the importance of individual and macro-level perception of opportunity as a fundamental and distinguishing feature of entrepreneurial behavior, which Wagner [12] later identified as particularly important for nascent entrepreneurs. Baciu et al. [40], examining how nascent entrepreneurs’ personal characteristics influence entrepreneurial perceived behavioral control, found that personality traits empathy and adaptive assertiveness equally have a significant effect. Thus, not only individual demographic and economic factors but also aggregate and macro factors, along with perceptual factors, play a prominent role in becoming a nascent entrepreneur. Perceptual factors in the literature consider personal perceptions and judgments about oneself and the environment, which, although subjective, nevertheless play an important role in individuals’ decisions regarding starting a business [25]. These perceptual variables are further broken down in the literature into the individual’s self-perception [41] and the subjective perception of the environment, which constitutes perceptions of the economic and social context [42]. The literature highlights that role models play a particularly important role in the development of perceptual factors [43], which are often based on popular entrepreneurs or out of acquaintance or family [44,45,46,47]. Mueller [23] pointed out that the importance of perceptual factors declines in the life cycle following the NE stage.
A great number of theoretical models have been set up to synthesize the factors that shape the NE. One of the first theories can be linked to Arenius and Minitti [25], who studied several sets of features in a complex way. The authors described the characteristics of NEs through three groups of factors: (1) demographic and economic characteristics: age, gender, education, job status, and household income; (2) perceptual variables: perception of opportunities, confidence in skills and abilities, fear of failure, and knowledge of other entrepreneurs; and (3) aggregate factors: country effect and macro contextual characteristics. Juric et al. [48] used a complex approach to create a profile of Croatian-born entrepreneurs. Using the neural network method, the most important characteristics defining nascent entrepreneurs were identified by attitudes, skills, and demographics. Nguyen [49] used the method of structural equation models to examine the factors influencing the emergence of young people in Generation Y in Vietnam as nascent entrepreneurs. In their model, they synthesized macro variables (entrepreneurial ecosystem, entrepreneurship education), demographic-economic variables (family background), perceptual variables (perceived behavioral control, social evaluation, perceived opportunity, entrepreneurial intention), and attitude variables (entrepreneurial self-efficacy). Shapero and Sokol [50] incorporated the results of research on entrepreneurial intent into a complex model wherein they found that entrepreneurial intent is influenced by the perceptions of personal desirability, feasibility, and propensity to act. Ajzen [51] supplemented Shapero’s model, stating that entrepreneurial intentions depend on personal attractiveness, social norms, and feasibility.
The theory base of our study builds on the model of Arenius and Minitti [25]. Through this theoretical model, we approach nascent entrepreneurs in Hungary, supplementing the original model by further breaking down the perceptual variables into the perceptual subcategories as social environment perpetuation and individual’s perpetuation of oneself. Based on the framework of Arenius and Minitti [25], individual, environmental, and perceptual effects can be grasped as well as synthesized. The management and interpretation of a set of variables in a system are made possible by the fact that sociodemographic variables are path-dependent and, consequently, change slowly, as is the case with perceptual variables, as it takes a long time to change the way individuals think about themselves and their role in society; finally, country-specific variables also change slowly over time [25]. All this change in the long run allows us to analyze the variables in a common model.
Thus, in our study, we explored the NE complex, multi-layered, systematic characteristics in 2021 in Hungary. This includes exploring the macro context in which actions take place, exploring individual demographic and economic characteristics, and capturing the personal and social implications of individual perceptions.

3. Methodology

In our study, we built on the methodology of machine learning as part of the knowledge discovery in databases process [52,53,54,55,56,57]. Within data mining, our research can be classified as a predictive technique, as it predicts data using different data results that are already known [58,59,60]. The process uses computational (learning) intelligence for all of this, with a limited set of predictive data sets. The process does not require prior knowledge of the mathematical relationships that link to predictors and to the objective variable [14,61].
Our research problem also included the binary classification problems of the machine learning method [62,63,64,65], for the solution of which we tested the performance of different ML algorithms [66]. The area of ML that we researched can be described as Montebruno et al. [67] did, i.e., a predictive prediction problem: D = { ( x n , y n ) } n = 1 N where D is the training set, N is the number of test examples, x is the input characteristics or attributes, and y is the output variable. In our case, the classification of y is binary, with a value of {0, 1}. Traditional ML follows a method called function approximation, where it is assumed that y = f(x), i.e., the purpose of the learning process is to estimate the function f with a labeled learning set.
Therefore, we examined our data with two nonlinear classification models (multivariate adaptive regression spline (MARS), support vector machines (SVMs)) and two classification-tree- and rule-based models (random forest, AdaBoost). Because the target variable (nascent entrepreneur) is known in our study, our problem falls into the category of supervised learning [68]. We chose appropriate machine learning algorithms for this category. The four techniques were selected based on their popularity for supervised machine learning and their applicability [69,70,71,72,73] in a business context [61,74,75,76].
MARS machine learning modeling, like neural networks and the partial least-squares method, uses surrogate features in modeling instead of the original predictors [77] thus creating flexible regression estimates that include a method of recursive partitioning to simplify higher-dimensional, nonparametric results [78]. MARS creates a multivariate additive model in a two-step process in which it models the predictors and linear relationships between the predictor and the outcome variable at each step. In the first phase, MARS uses a very fast search algorithm to uncover the main or basic functions (BFs) that should be inserted into the model and set up a model that usually “overfits” the given data. This process stops as soon as the model reaches a certain maximum number of BFs (Mmax BF) [79]. Once the initial model is created with the characteristics, the algorithm continuously reduces the complexity of this overfitted model based on the residual squared errors of the BFs [78,80,81]. This process continues until it reaches a stopping point (optimally estimated model) that results in the best model fit. The data point for each predictor is then evaluated by the model with the selected characteristics, and the model error is then calculated. After creating the complete set of values for the model, the algorithm sequentially removes features that do not significantly contribute to the model equation [82,83]. MARS, thus, builds essentially flexible models by fitting “piece-by-piece” linear regressions, i.e., it approximates the nonlinearity of a model using separate regression slopes in separate intervals of the independent variable field. Therefore, the slope of the regression line can vary from one interval to another, and, by looking for interactions between variables, it allows any degree of consideration for the interaction.
The MARS algorithm is extremely popular in social and behavioral research [84]. Highlighting the most important research, Chen et al. [85] used the MARS algorithm to explore the factors that shape entrepreneurship, while Freund et al. [86] analyzed the different perceptions of women’s entrepreneurial orientation with the algorithm compared to the male entrepreneurs, showing that entrepreneurial orientation differs by gender in different industries. Thapa [87] used this ML to identify the determinants of microenterprise performance and explored the key importance of perceptual variables in his research. Yao et al. [88] also used the method to identify perceptual but environmental variables among Chinese students, showing a strong association between positive environmental interpretation and entrepreneurial propensity.
The other nonlinear classification model we used can be classified into the SVM algorithm category. The development of the SVM model can be linked to the dimensional theory of Vladimir Vapnik, who developed the algorithm in the 1960s to create a hard decision boundary in classifying samples, as opposed to the results from previously dominant class probability estimation theory [89,90]. Subsequent developments of SVM based on Vapnik’s research created one of the most flexible and efficient machine learning tools by incorporating the Gaussian kernel function into the algorithm, thereby enabling the modeling technique to form nonlinear class boundaries, i.e., to compute internal products of multidimensional vectors [91,92]. Since then, other nonlinear transformations have become applicable for SVMs as follows: polynomial, radial, or hyperbolic. In our analysis, we worked with radial SVM (svmRadial). This is because the SVMs used today, based on the principle of structural risk minimization, try to find a “compromise” between minimizing the errors in the training series and maximizing the classification interval [93]. The main goal of SVM as a classifier is thus to find the equation dividing the hyperplane [94]. The general formula for classifying an object F can be written as: (x) = s(wTxb), where w = (w1, w2, …, wn), and b = −w0 [92]. Within the () function, a linear combination of object properties is created with algorithm weights (w and b), and thus SVM can be interpreted as a linear algorithm. During the SVM process, the hyperplane partition can be built in several ways; usually, however, the weights w and b are set so that the class objects are as far away from the hyperplane distribution as possible. In other words, the algorithm maximizes the margin between the objects in the hyperplane and the classes closest to it. Thus, SVMs work with a defined alternative measure (margin), which is the difference between the classification boundary and the nearest training data [95]. This limit is used to evaluate possible models and redefine sample boundaries [96].
An important advantage of SVMs is that they work well with a large number of feature spaces and small amounts of data, and our database can be described with these features. SVMs are mainly used for practical solutions to visual classification problems [85,97,98,99], but they also play an increasing role in business education research. Nasution et al. [100] used the SVM algorithm to predict the entrepreneurial intentions of recent graduates and alumni. Marijana et al. [101] used the method to predict the entrepreneurial intention of first-year university students, while Iskender and Bati [102] classified Indian universities in terms of their specificity in teaching entrepreneurship with SVM.
In our study, we used the random forest (RF) algorithm as the next algorithm. RF is a classification tree model that introduces a random component into the tree-building process by generating bootstrap patterns [68,103]. Bootstrapping relies on the logic of re-sampling from the original data set, the samples of which approach the actual distribution of parameters in the original sample [104]. The trees used before the RF method were not completely independent from each other, as all original predictors were taken into account for each division of each tree. Consequently, although each tree was roughly unique, they all began with a similar structure and were, consequently, related to each other. The RF model aimed to reduce this correlation between trees, thus improving model performance. Statistically, reducing the correlation between predictors in the algorithm is accomplished by adding randomness to the tree-building process using a recursive partitioning technique [105]. Dietterich [81] developed the theory of random split selection, where trees are formed from a random subset of the predictor “k” in each segment of tree formation. Another approach was to build complete trees based on random subsets of predictors [32,106,107]. The unified RF algorithm was finally developed by Breiman in 2001 [103], according to which the general random forest algorithm of a tree-based model can be implemented by using each forest model to generate a prediction of a new sample, where the prediction is based on the averages of these predictions. Because the algorithm randomly selects the predictors for each division, the correlation of the trees necessarily decreases.
Breiman [103] demonstrated that random forests are protected from overfitting; thus the model also offers the possibility to include a large number of predictors. In addition, RF is able to analyze the classification characteristics of complex interactions and has good robustness and fast learning speed to examine noisy data [108]. The method has been widely used in business research in recent years. Xu et al. [109] examined the relationship between corporate credit and personal credit with RF; their results show that the random forest technique performs well in predicting borrowing. Carter et al. [110] used random forests to search for the source of heterogeneity in entrepreneurial programs and to identify the benefits of these programs for households.
The fourth modeling algorithm was the AdaBoost algorithm, which is one of the boosting models. Boosting models were originally developed for classification problems and later extended to solve regression problems [111,112]. One of the earliest developments in boosting models was the AdaBoost algorithm, which is now widely used. Boosting algorithms that emerged in the early 1990s aimed to combine weak classifiers (a classifier that can only slightly predict better than chance) to create a combined classifier that results in a low overall classification error rate [86,113]. The efficient implementation of the boosting theory was finally embodied in the AdaBoost algorithm thanks to the collaboration of Freund and Schapire [114]. AdaBoost provided a practical implementation of Kerns and Valiant’s [112] concept that weak learners can be turned into strong learners. The AdaBoost algorithm has proven to be an effective predictive tool, and, consequently, its application is widespread in gene research [115,116], chemometrics [117], or even the identification of musical genres [118].
Using the machine learning algorithms presented above, we analyzed our data for the best predictive model. For each predictive modeling technique, we set tuning parameters that allowed the models to flexibly find the structure of the data. For this, the existing data were broken down into training and test sets. The training set was used to construct and tune the model, and the test set was used to estimate the predictive performance of the model.
To measure the predictions of the models, we used their optimized prediction, the classification accuracy or adaptive cruise control (ACC) as a measurement, and the kappa statistics. Cohen’s kappa statistics were originally used to measure reconciliation between predictors [119,120]; now, however, it is mostly used to guide the likelihood that our prediction simply follows from chance [83]. To compare the models, we used the sensitivity indicator, which shows the extent to which the event to be predicted was correctly predicted for all samples containing the event, as well as the specificity indicator, which shows the ratio of a non-occurring event to a non-predicted event in all samples where there was no event [83]. We also used the widely used measure of receiver operating characteristic (ROC) curve in our analysis to combine the sensitivity and specificity of the model into a single value. We used the ROC curve because one of the often-overlooked aspects of sensitivity and specificity is that they are measures of conditional conditions, but in an analysis, we are usually interested in non-conditional measures, which can be best captured by the ROC measure [121,122,123].

4. Data and Hypotheses

For the machine learning models, we used the Hungarian representative data of the Global Entrepreneurship Monitor (GEM) 2021 [124]. GEM is the world’s largest annual survey about businesses. GEM’s national representative surveys are based on a sample of at least 2000 adults (aged 18–64) per country. The survey measures nascent entrepreneurs as well in each year, which is an aggregate variable derived from the answers to the following two questions: (1) Are you currently trying to start a new business alone or with others? (2) Have you received any salary, wages, or benefits from your new business in the last three months? [124].
In 2021, the representative population sample of GEM in Hungary contained the opinions of 2014 respondents. Of these, 9.8% of respondents were considered nascent entrepreneurs, which is a middle-ranking position compared to Europe or the world [124]. With our machine learning models, we predicted this binary variable, with “yes” and “no” categories. The “yes” category of the variable indicated the NEs, while the “no” category indicated all other respondents who did not try to start a new business.
In its data collection, GEM places great emphasis on the assessment of demographic and economic factors, as well as the assessment of both individual and environmental perceptions. In addition, aggregate country characteristics are measured, albeit to a lesser extent than in the previous two categories. Consequently, it contains appropriate prediction and output variables to enable us to perform our analysis.
The study of Hungary may help us to explore the drivers of nascent entrepreneurs in a developed economy. Our research is considered cross-sectional research, as we analyzed only one year, but this year represents a stability point in the Hungarian economic system, and, consequently, it can serve as a reference point for understanding the nascent entrepreneurs’ drivers in an economy that is free from major economic turbulence at the local level.
We included 30 predictor variables from the GEM data in our models, which are summarized in Table A1 in the Appendix A. Based on the theory of Arenius and Minitti [25], the set of variables was divided into four categories: aggregate conditions with 2 variables, demographic and economic factors with 13 variables, social perceptual issues with 5 variables, and individual perceptual issues with 10 variables.
In our study, based on the theory of Arenius and Minitti [25], we tested the following hypotheses using four modeling algorithms based on machine learning:
H1: 
In 2021, the nascent entrepreneurs can be forecasted at least 90% of accuracy in Hungary using demographic and economic indicators, macroeconomic indicators, and perceptual indicators.
H2: 
In 2021, nascent entrepreneurs in Hungary can be determined by individual demographic and economic indicators.

5. Analysis of Nascent Entrepreneurs in Hungary

In our analysis, we wanted to give a statistically reliable forecast of the factors that lead to someone becoming a nascent entrepreneur in Hungary based on the data of GEM 2021. We used the R-program Caret package for our analyses [83]. For machine-learning-based models, we divided our sample into training data sets containing 80% of the data and test data which were 20% of our sample. During the design of the training and test data sets, we used a function that retained the ratio of the predictor categories to the output variable. As the missing values did not exceed 5% for any of the involved variables, we were able to impute missing data using the k-nearest neighboring method. The variables were then normalized to a range of 0 to 1 using the min–max transformation.
To build our models, we created descriptive statistics to examine primarily and visually how predictors affect the output variable. If we group the predictor variables according to the categories of the output variable, we have the opportunity to review the possible correlation of the variables with density diagrams (Figure 1).
These results only serve as a guide to determine approximately which variables would play an important predictive role in the upcoming models. Figure 1 shows that the fact that the respondent wants to start a new business in the future (FutureBuisnessStart), the self-employed labor market position (EmploymentSelf), and the fact that the respondent thinks that society is one where entrepreneurs have high prestige (ContextEntrHigh), thinks that he or she has the knowledge and skills to start a business (skillStart), considers the socio-economic context appropriate for starting a business (EasyStartBisness), and considers himself/herself to be proactive (proAct) and middle-aged (age) appeared to be variables that could become potentially strong predictive variables in the models. Based on this, it is expected that start-up entrepreneurs will be shaped primarily by individual perceptual variables (FutureBuisnessStart, skillStart, proAct) and variables measuring socio-environmental perceptions (EasyStartBisness, ContextEntrHigh), in addition to variables measuring demographic and economic factors (EmploymentSelf, age).
The data were further analyzed by the method of recursive feature elimination (RFE). We used this method because most machine learning algorithms can determine which predictors are important for predicting the output variable; in some cases, however, they can omit variables that are known to be theoretically or practically significant in exploring a particular entity. Based on RFE’s exploratory analysis, the four most important predictors were whether he/she wants to start a new business in the future (futureBusiStart), whether he/she currently has a business (ownerBusiness), he or she is self-employed (employeeSelf), and he or she belongs to the middle-aged age group (age). Thus, the RFE results suggest that demographic-economic factors (ownerBusiness, employeeSelf, age) play a stronger role in the case of nascent entrepreneurs than the descriptive statistics showed before.
After pre-analysis of the data, we modeled the data with MARS, AdaBoost, random forest, and svmRadial machine learning algorithms. For each machine learning model, we performed cross-checking and optimal tuning of the hyperparameters in order to increase model performance and to select the optimal models for prediction.
Predictions of the final models generated by the algorithms are provided in the form of a confusion matrix (Table 1), and the evaluation metrics for the models are provided in Table A2 in the Appendix A.
The confusion matrix shows the differences between the predictions made in the test data set and the actual data at the item number level. It can be seen from Table 1 that the MARS model gave a false-positive result in 3% and a false-negative result in 6% of the values; consequently, the accuracy of the model predictions was 91.04%. The AdaBoost algorithm gave a false-positive result of 2% and a false-negative result of 7%, and its prediction accuracy was the same as the MARS algorithm, 91.04%. Random forest gave a false-positive result of 1% and a false-negative result of 7%, resulting in a model with a predictive accuracy of 91.59%. Finally, svmRadial gave 1% false-positive and 7% false-negative results, resulting in a model prediction accuracy of 91.74%.
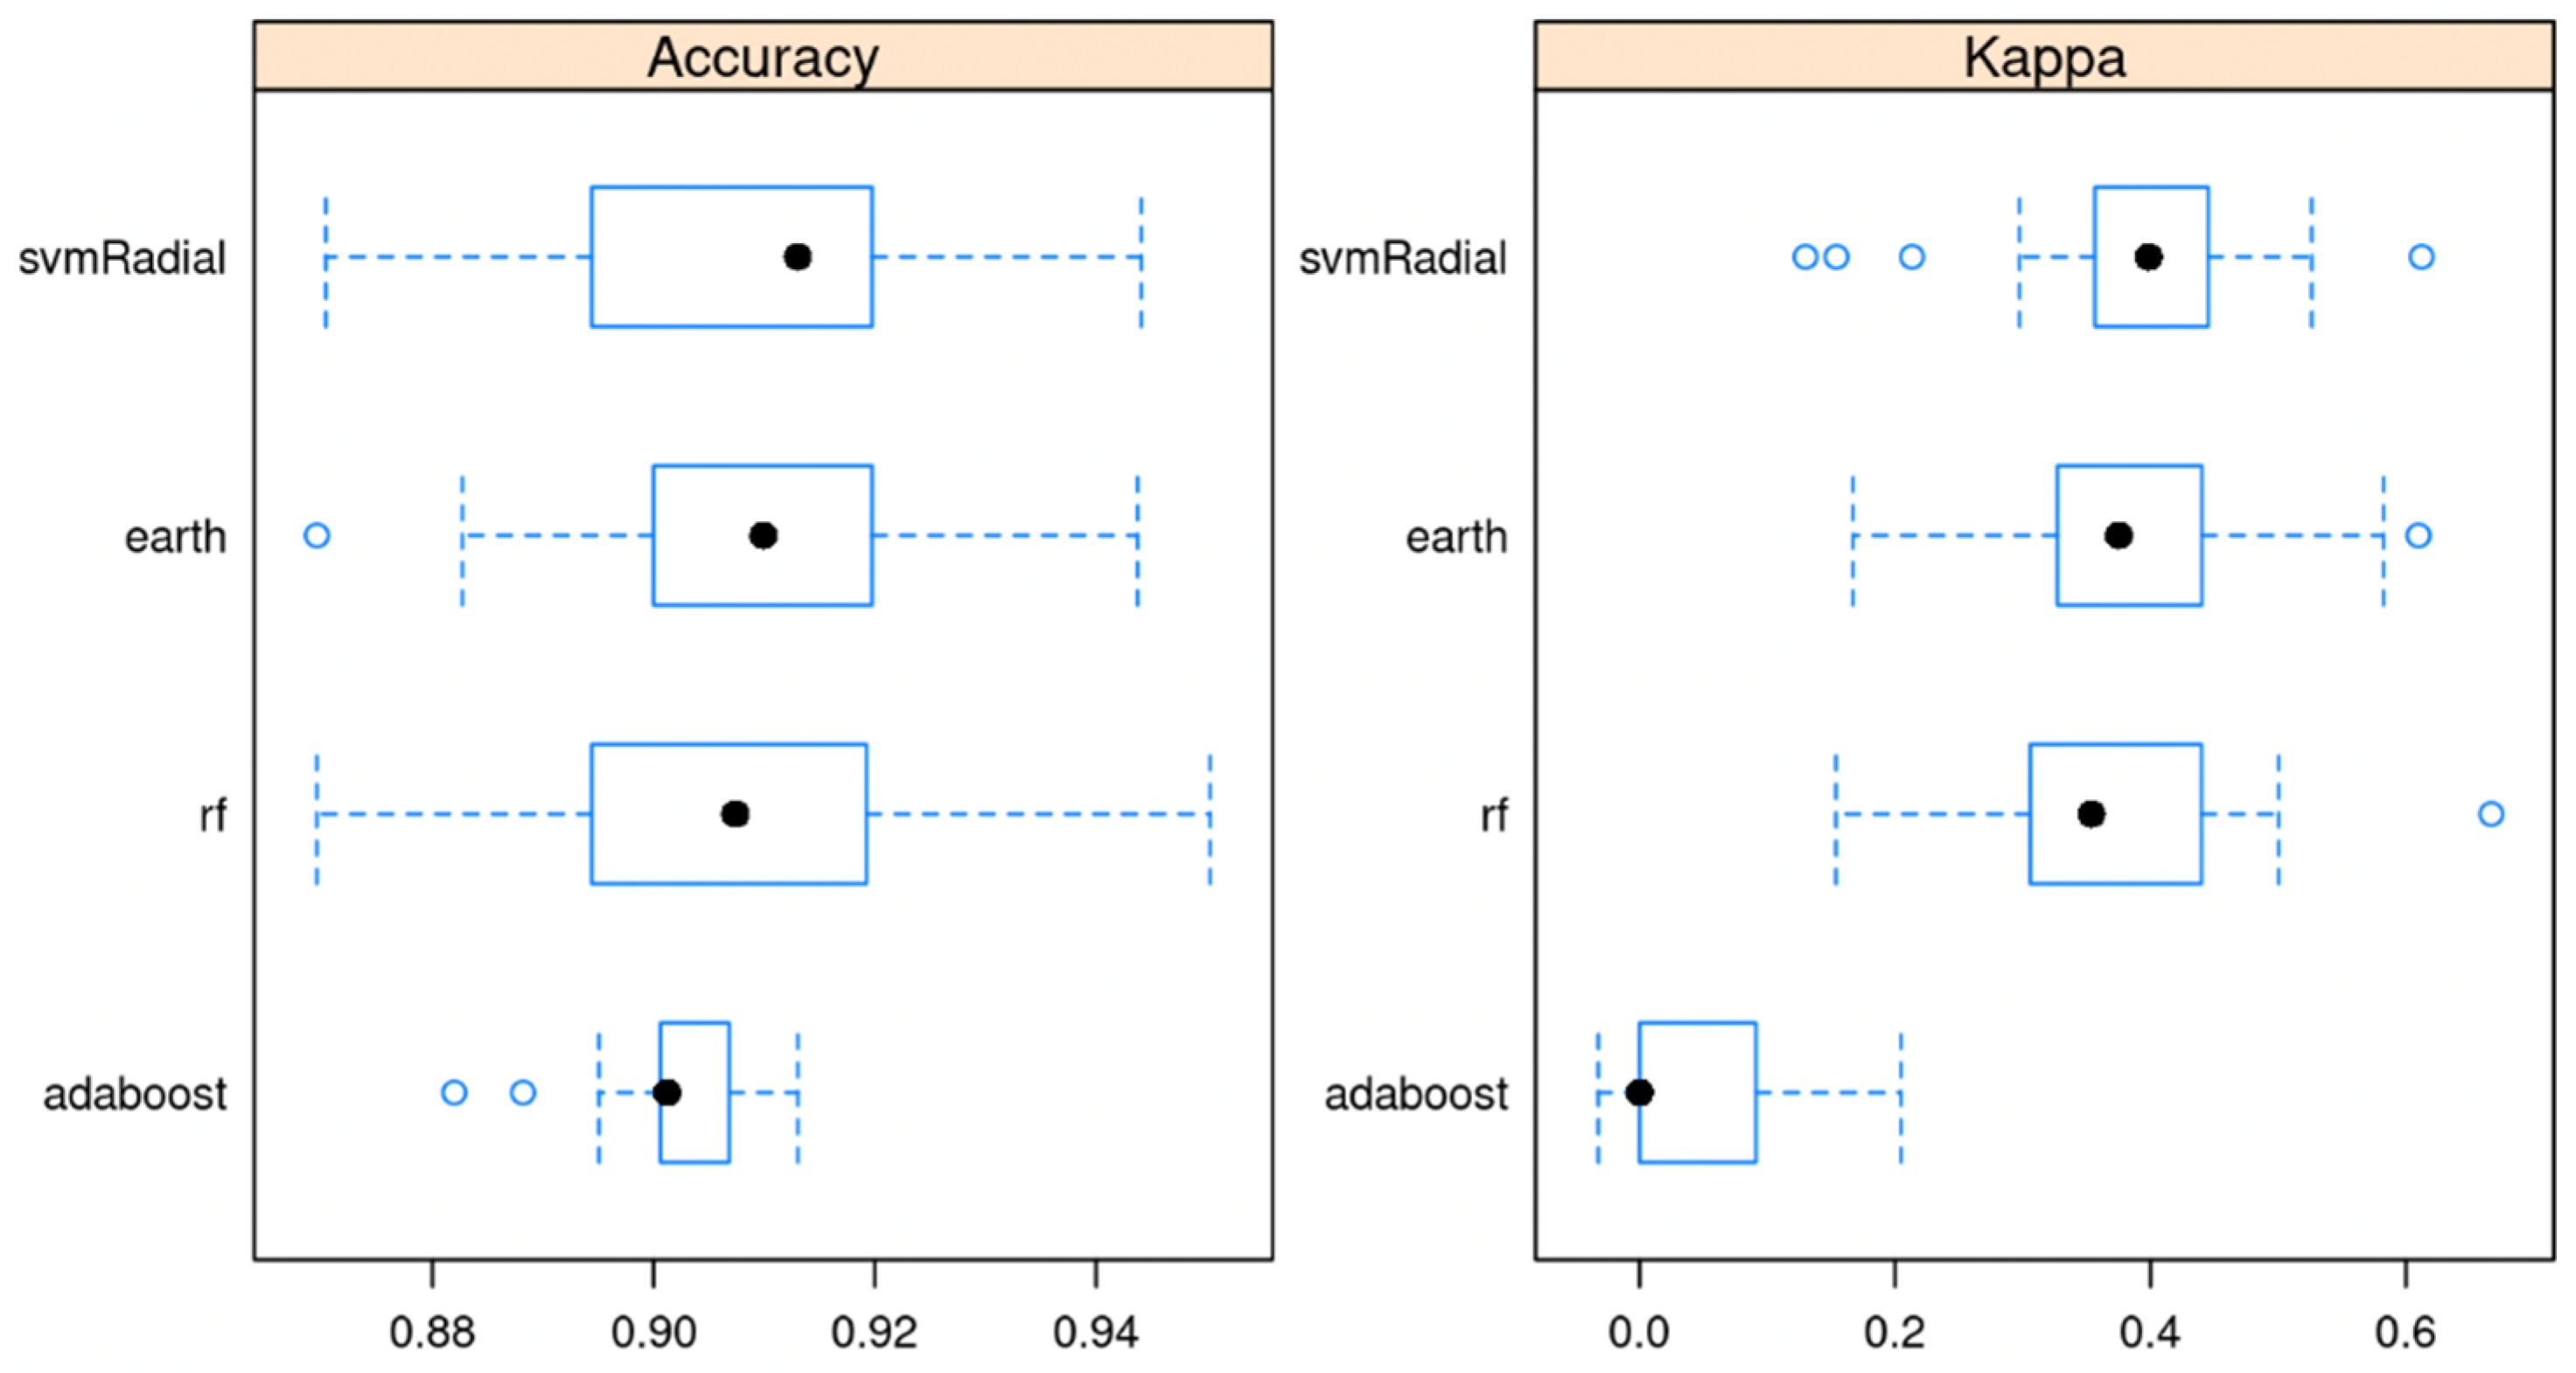
It can be seen from all this that all algorithms were able to predict nascent entrepreneurs above 90%, based on predictor variables. There is no significant difference in the prediction accuracy of the four algorithms; however, with a few tenths of a percentage point, svmRadial performed the best. If we assign kappa values to the forecast values, the performances of the models are as in Figure 2.
Based on Figure 2, it can be seen that the average kappa values ranged from 0.00461 to 0.39172. For kappa values as well as for predictions, svmRadial performed the most reliably (κ 0.39172) and AdaBoost the least reliably (κ 0.00461). It is also important to note that there are quite large differences in kappa values between the different algorithms. While SVM, MARS, and RF gave low but nearly similar kappa values, AdaBoost’s kappa values lag far behind other models.
By further examining the performance of the models along ROC, sensitivity, and specification, Table 2 is obtained.
Based on the ROC values, MARS (0.956 ± 0.003) and random forest (0.953 ± 0.002) algorithms performed best. For the sensitivity values, MARS (0.973 ± 0.005) and svmRadial (0.967 ± 0.002) performed the most accurately, while for the specificity values, the AdaBoost (0.437 ± 0.036) and MARS (0.427 ± 0.056) algorithms proved to be the most accurate.
Consequently, it is difficult to determine one specific algorithm that performed best. Each algorithm was able to predict NEs with very high accuracy (>90%). However, the two nonlinear classification models stood out among the predictors. Therefore, it can be said that svmRadial was the most accurate predictor of nascent entrepreneurs; however, the MARS model seems to be a better performing model if we include metrics based on false-positive and false-negative values in the validation criteria.
Consequently, in identifying the predictive variables of the models, all four models were included in the further analysis. This decision was made not only on the basis of predictions metrics but also from a theoretical point of view, as the four different machine learning models showed different predictive variable importance. Variable importance reflects the relative contribution of each predictor to the optimal forecasting model. The higher this value, the greater the significance of the variable.
In the case of the MARS model, the fact that the respondent currently owns a business (ownerBusiness), wants to start a new business in the future (futureBusiStart), belongs to the middle-aged group (age), is self-employed (employeeSelf), has stopped a business in the past (stopBuisness), knows entrepreneurs personally (knowEntreprenure), considers himself/herself as a proactive person (proAct), and has a medium-sized household (hhsize) were the variables that made nascent entrepreneurs predictable (Figure 3).
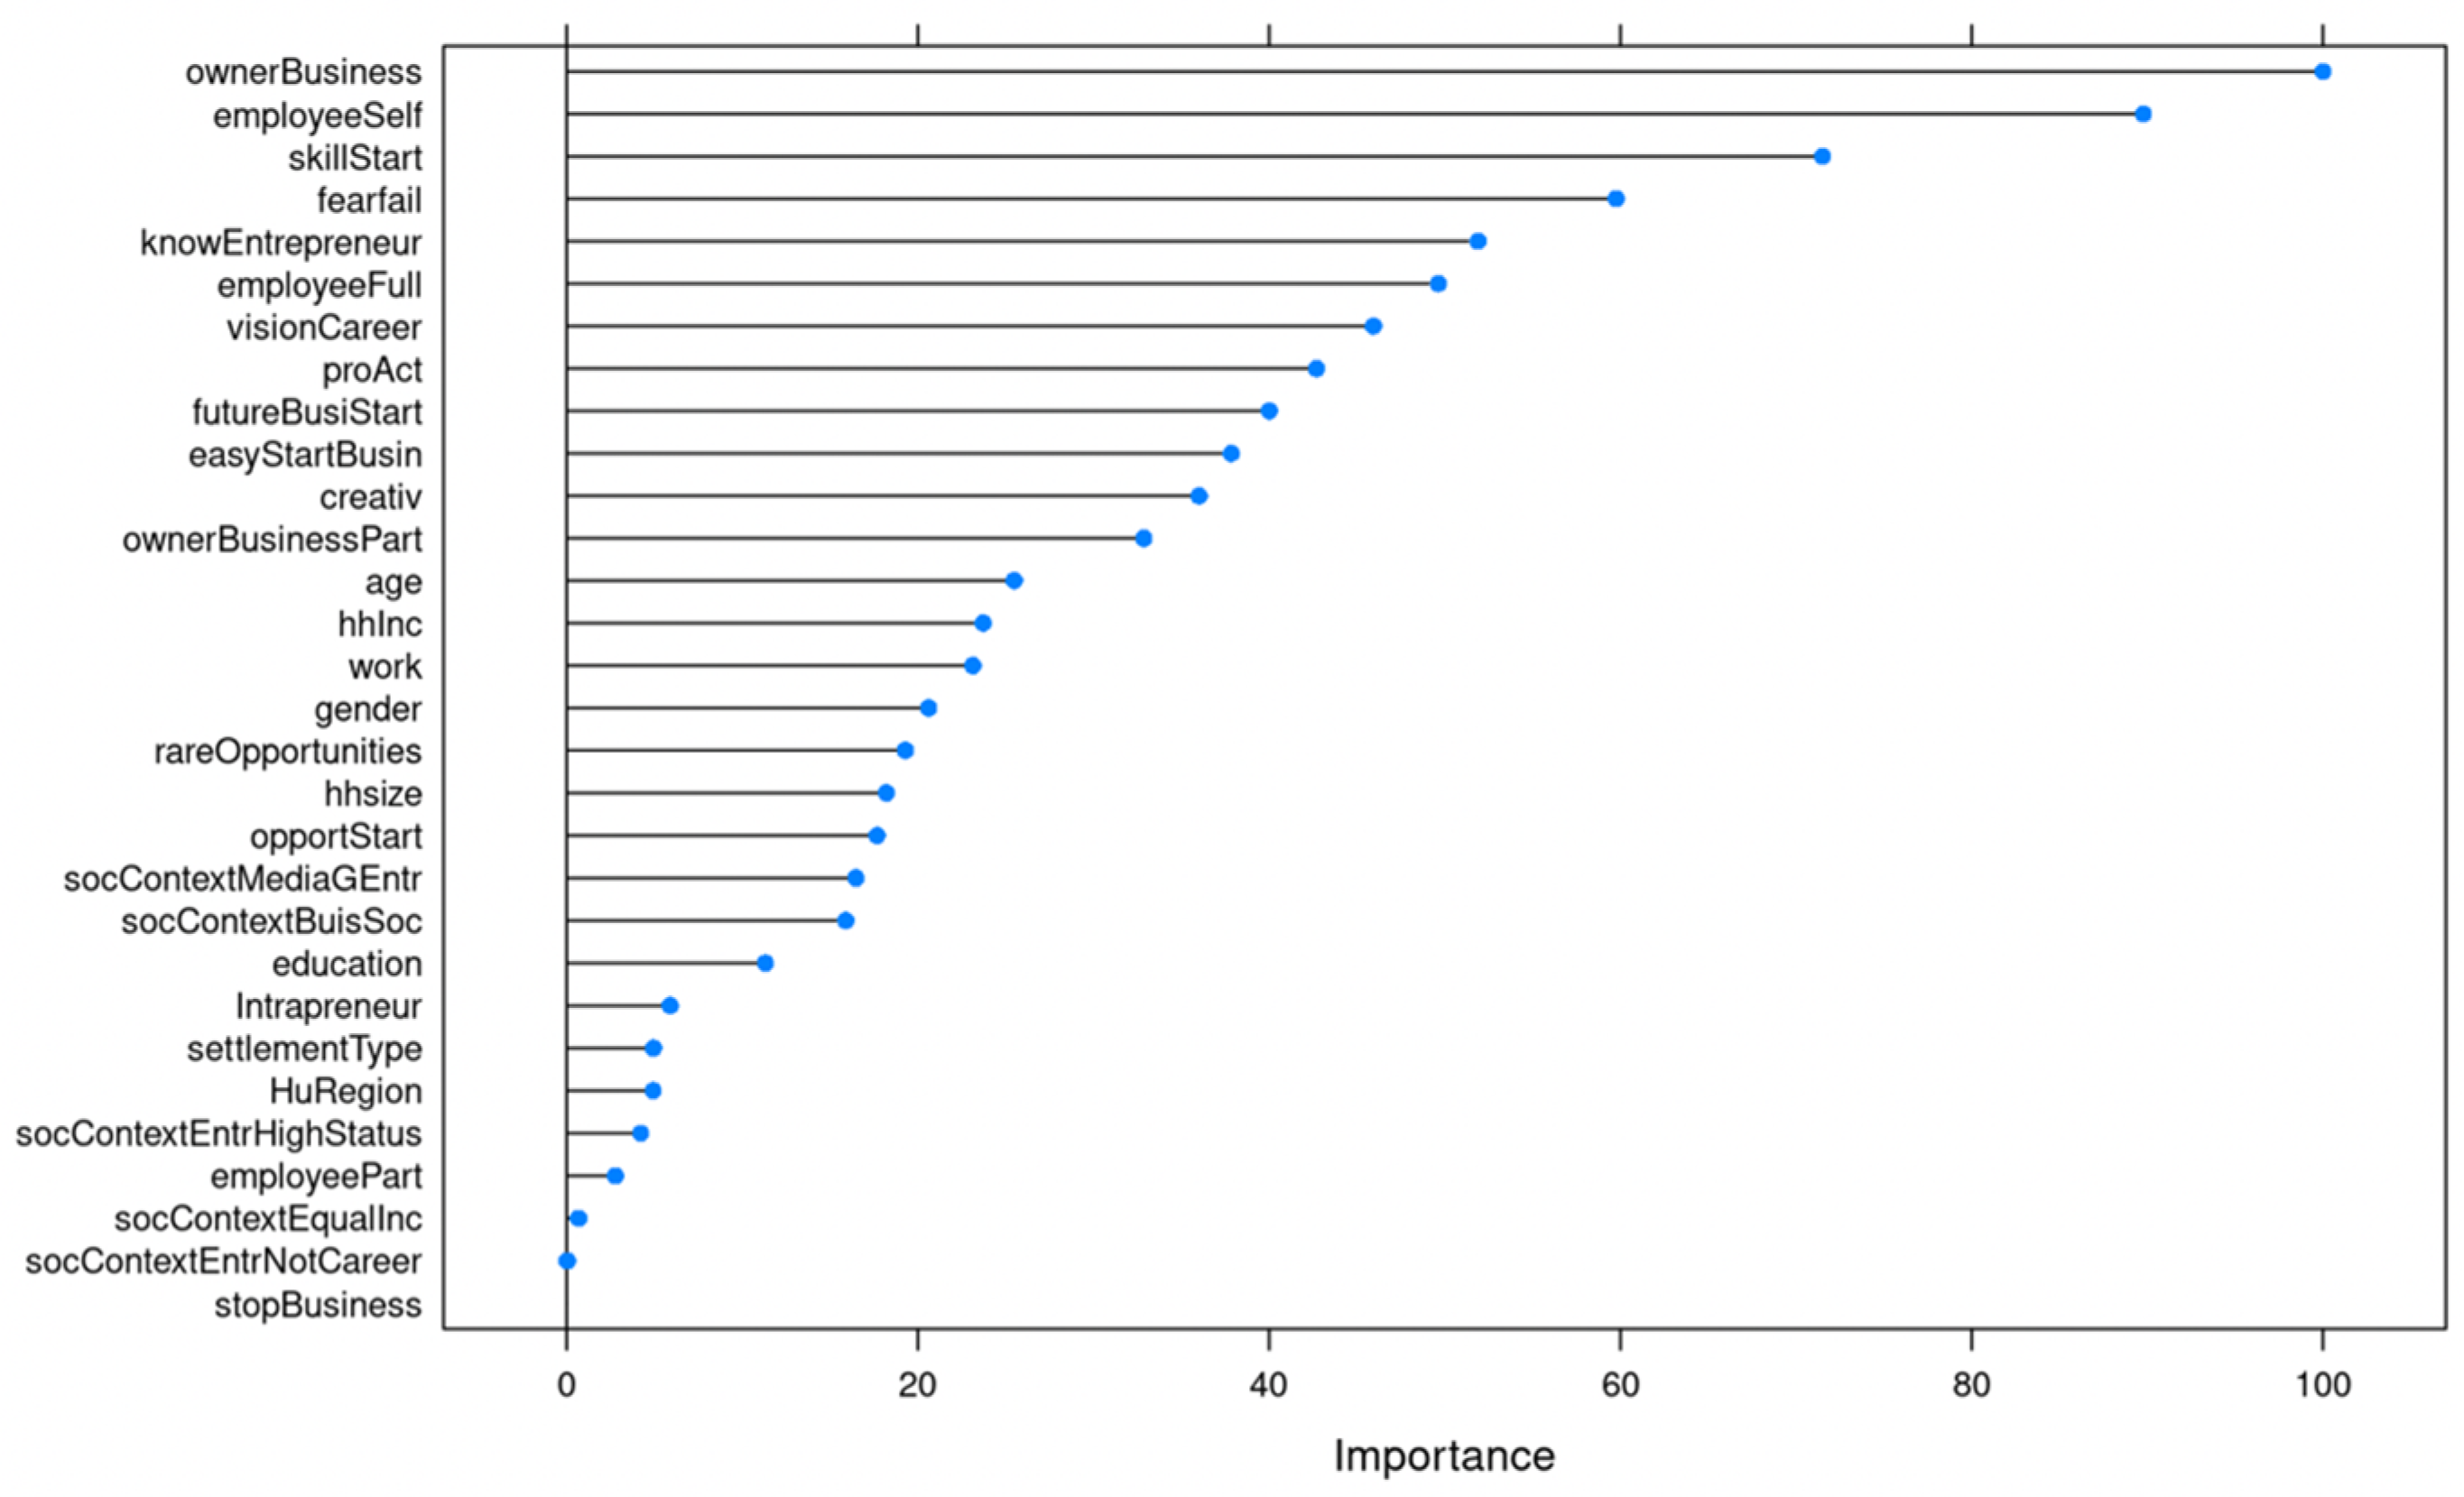
However, while the MARS model identified eight predictor variables for its prediction, the svmRadial model included all 30 variables in the analysis, albeit with very different intensities (Figure 4).
Based on the SVM model, the three most important predictor variables were: the respondent currently has a business (ownerBuisness), the respondent is self-employed (employeeSelf), and the respondent feels that he or she has the knowledge to start a business (skillStart). However, similar to the MARS algorithm, the fact that the respondent knows an entrepreneur (knowEntreprenure) appears as an important factor among the predictor variables of the model. Unlike MARS, the SVM identified demographic-economic variables (age, hhinc) with medium importance. Furthermore, the aggregate variables were included in the model with low predictive strength. It is also important to note that while in the MARS model the stopBuisness variable played a very important role, the SVM algorithm listed the importance of the variable in the last place.
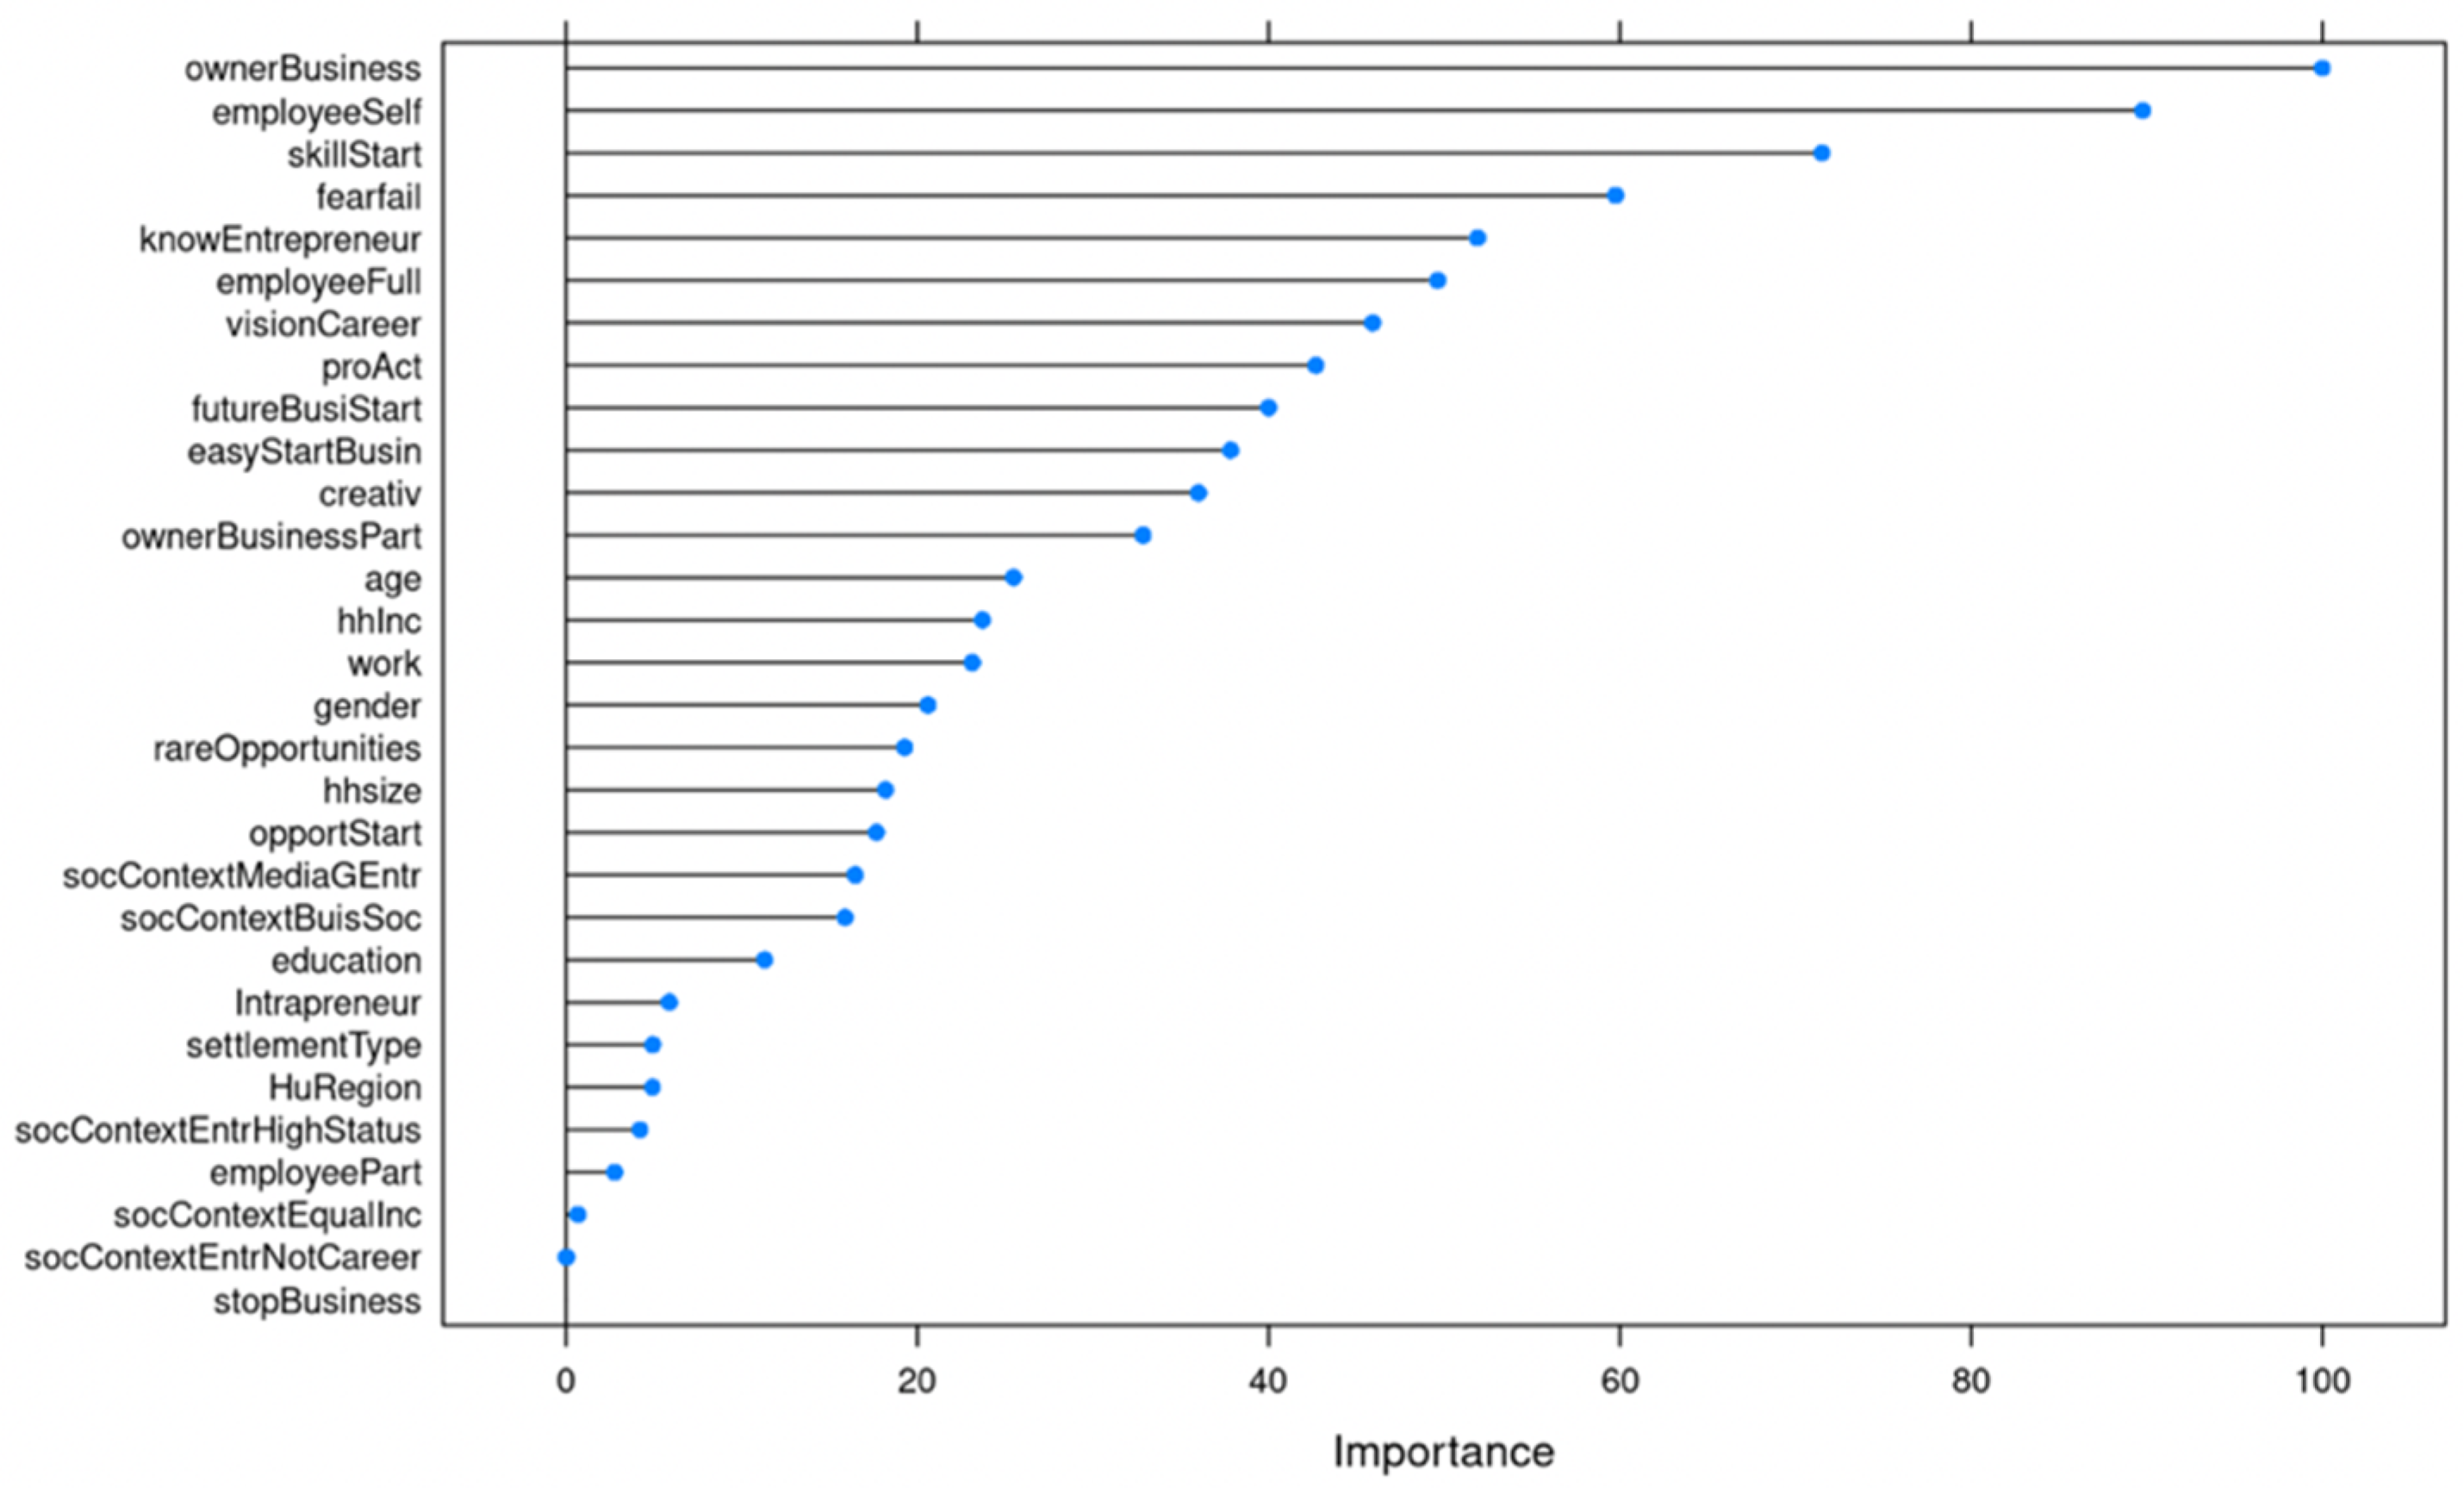
The AdaBoost model gave almost exactly the same results in terms of the importance of variables as svmRadial (Figure 5). Consequently, the algorithm identified demographic and economic factors as the most important predictor variables, followed by variables measuring an individual’s self-perception, followed by aggregate variables and then socio-environmental perception variables.
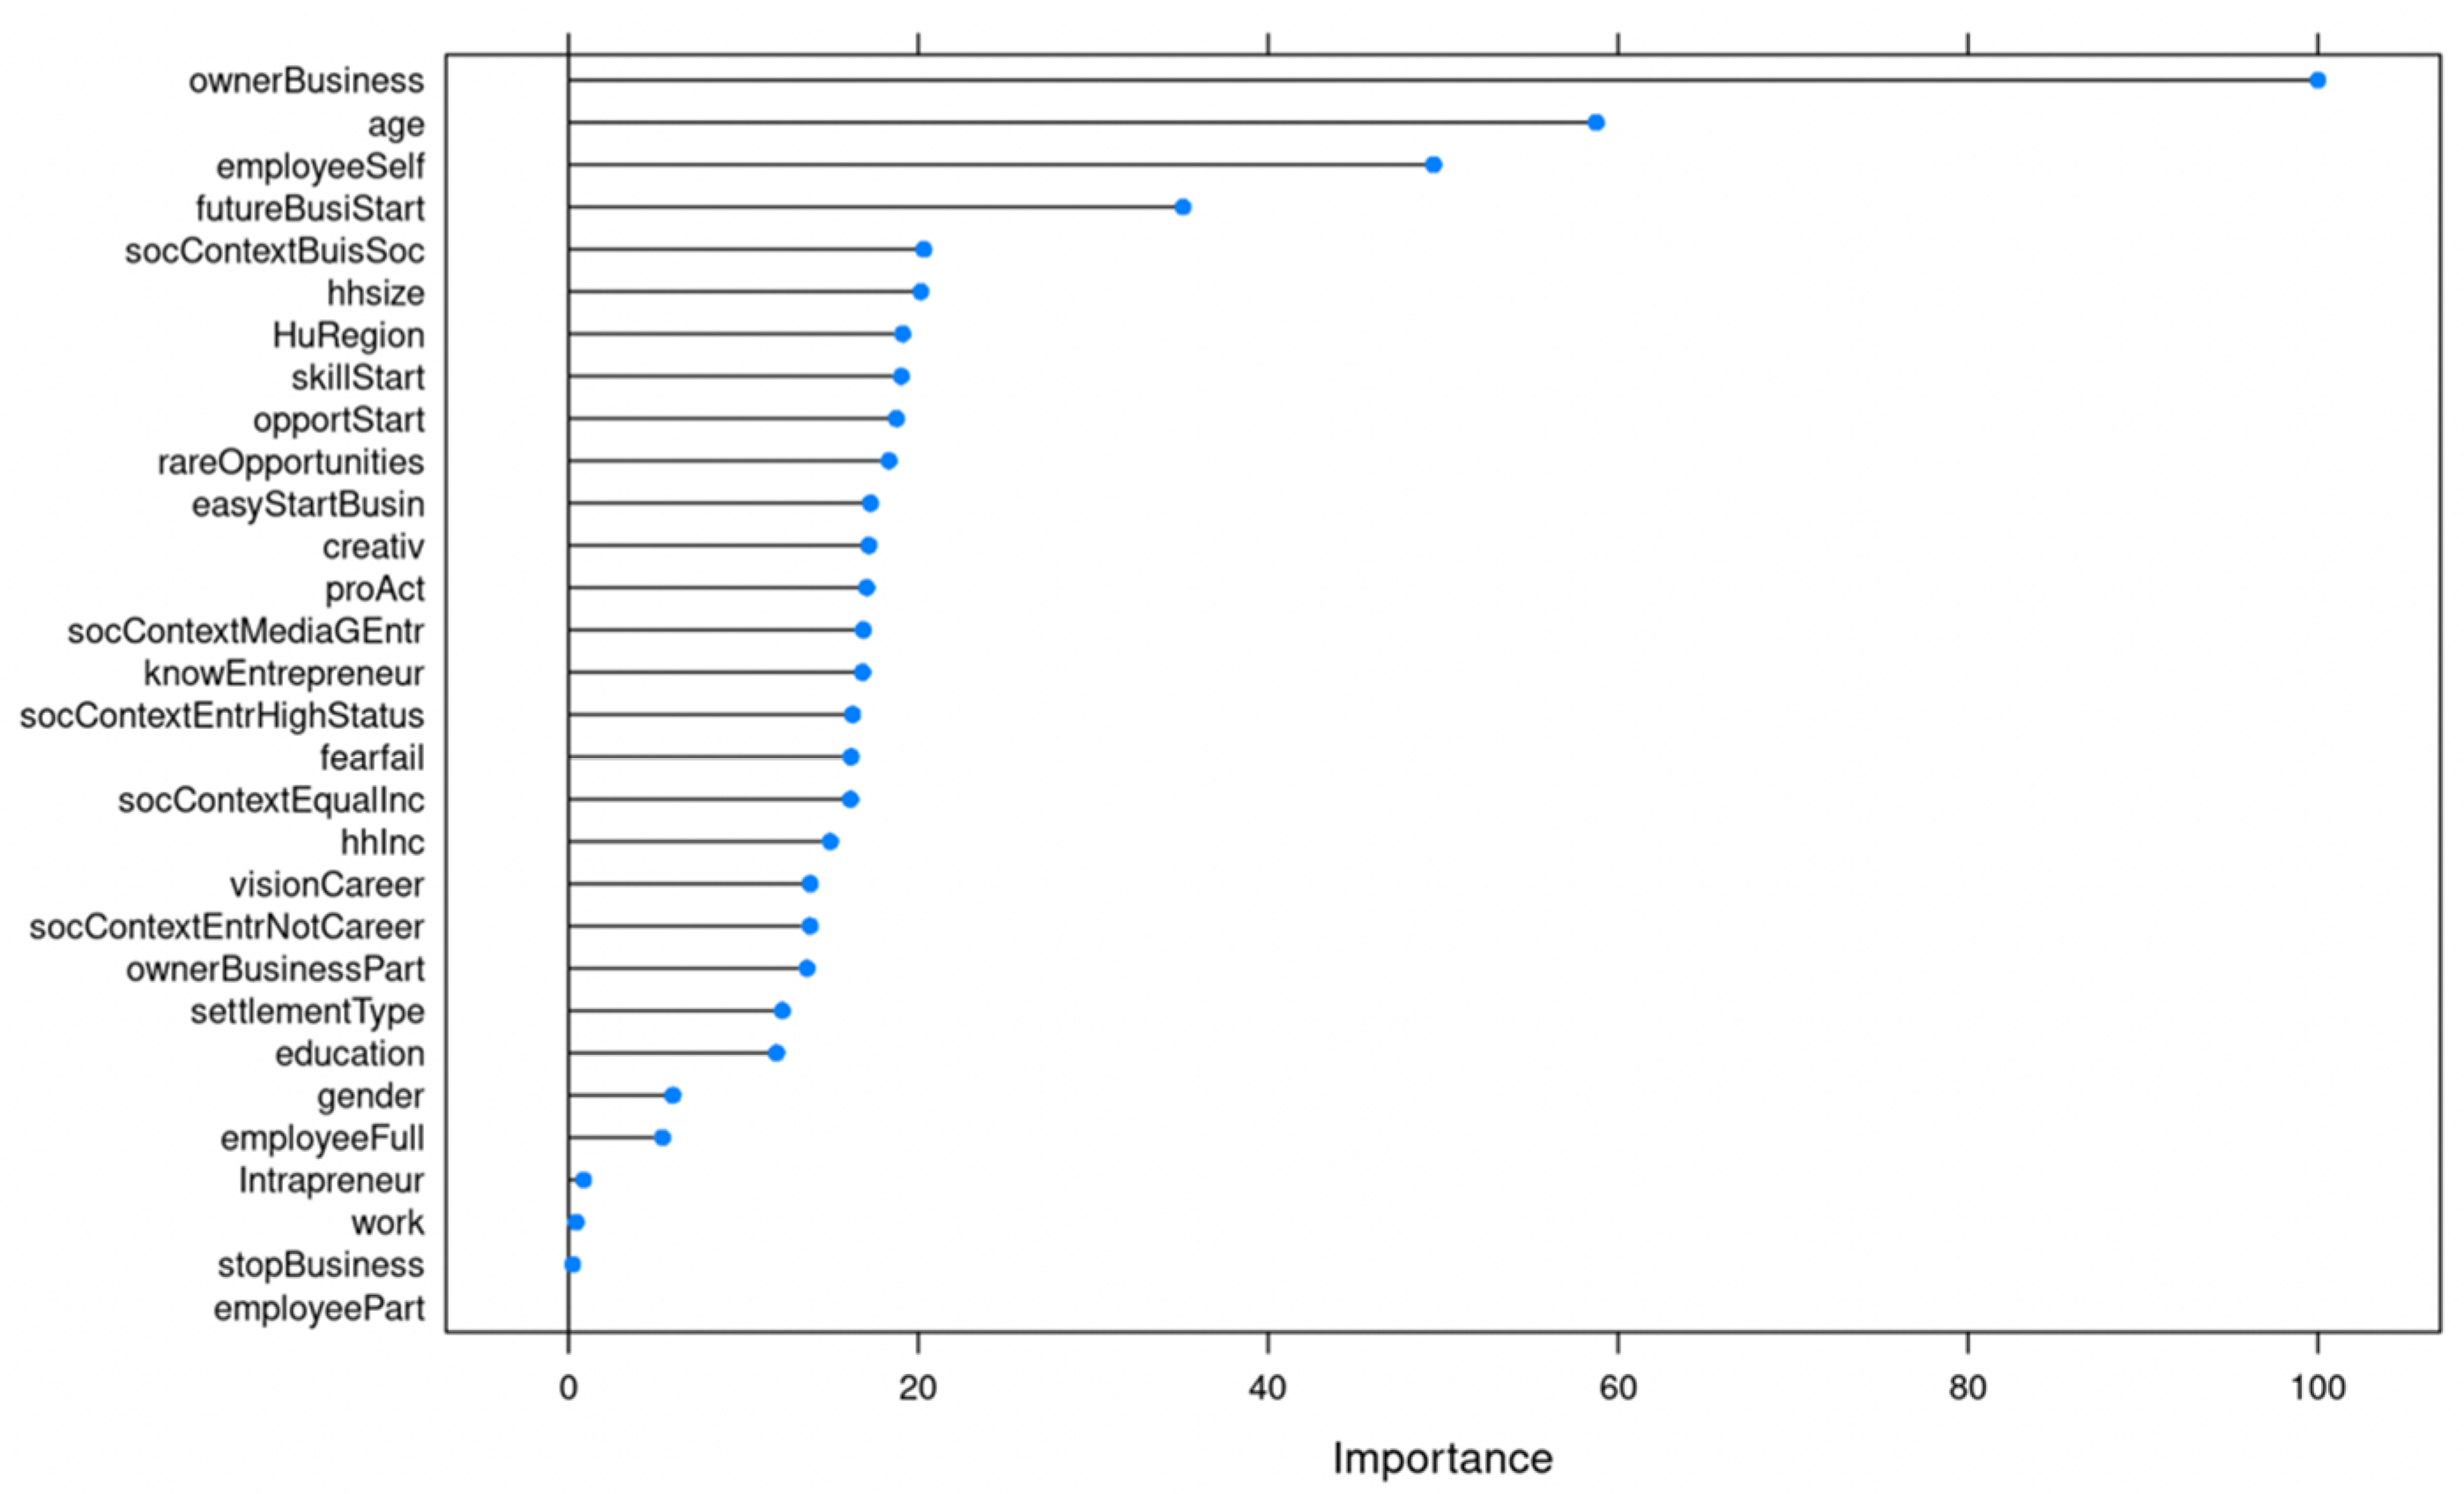
The random forest algorithm formed a different model from the previous three models based on the importance of the variables (Figure 6). However, like the other algorithms, RF also emphasizes demographic factors (ownerBuisness, age, employeeSelf) in the top three predictors; it also handles the social-environment perceptual variable (socContextBusiSoc) and the aggregate variable (HuRegion) in a leading position in the model.
Consequently, the models formed by the four artificial intelligences yielded different results in the order of importance of the variables (Table 3).
As shown in Table 3, several variables can be identified that each model considers important predictors. Among these demographic and economic factors, the respondent has a business (ownerBusiness) and the respondent is self-employed (employeeSelf). Among the perceptual variables, in the individual segment, we find a variable (futureBusiStart) that each model treats as an important predictor variable.
The models can be divided into roughly two patterns, with the results of MARS and RF as one pattern and the results of SVM and AdaBoost as the other. However, it is important to note that while the results of the SVM and AdaBoost models show a perfect agreement for the key predictors, the RF model, unlike MARS, assigns an important role to both aggregate and socio-environmental perceptual variables in its model. Thus, if we further examine the results in the order of importance of theoretical categories, we find that each model’s results show the role of demographic and economic variables as the most important factor, followed by the individual’s self-perception (Table 4). These variables are followed by the individual’s perception of society and its environment and then followed by aggregate variables. However, it is important to note that in the case of the MARS model, the latter two variable categories do not play a role.
All this means that each model based on artificial intelligence assumes nascent entrepreneurs as a combined effect of a system in which almost every set of variable features plays an active role. Based on the models, the process of becoming a nascent entrepreneur in Hungary in 2021 is created from the interaction of these feature sets. However, based on our results, it can also be seen that there is some difference between these variable sets. The two main sets of characteristics in NEs are demographic and economic variables (owning a business, age, work status, household size) and individuals’ perceptions of themselves (commitment to start a business, knowledge and experience of starting a business, knowing an entrepreneur personally, and proactive personality). This is followed by the variables measuring the perception of the socio-environment and then the order ends with the aggregate macro variables.
As a result, we believe that we verified our H1 hypothesis during our research, as it was shown that, in 2021, nascent entrepreneurs in Hungary can be predicted with at least 90% accuracy using demographic and economic indicators, macroeconomic indicators, and perceptual indicators. At the same time, we have to reject our H2 hypothesis because, although in 2021 NEs in Hungary can be defined by individual demographic and economic indicators, it is also essential to include at least one additional set of characteristics, the perception of individuals about themselves.
We think that an important but unexpected result of our study is that, based on the models, nascent entrepreneurs in Hungary in 2021 will not come from “nothing”. If we take a look at the ownerBuisness variable, we find that each artificial intelligence marked the predictive role of the variable as the most important. All this means that there are typically few new entrants among nascent entrepreneurs in Hungary, as the models show that those who already have a business want to start a business in Hungary. All this can show that, in the case of Hungary, a theoretical category can be created that covers nascent entrepreneurs as entrepreneurs who are not beginners, but their enterprise can be characterized as a novice business.

6. Conclusions

In our study, we modeled nascent entrepreneurs using four algorithms based on machine learning with the representative data of GEM in Hungary in 2021. Based on the theory of Arenius and Minitti [25], we started from the premise that NEs can be described by a set of characteristics and variables that can be classified into four categories, which include demographic and economic factors, perceptual individual variables, perceptual environmental variables, and aggregate macro variables. The theory was tested using the MARS, svmRadial, AdaBoost, and RF algorithms.
Our results show that each algorithm was able to predict NEs with over 90% ACC accuracy based on the given parameters. However, there were minimal differences between these prediction values, and if we not only base the evaluation on a single measure but also include measures based on false-positive and false-negative values, we need to consider the results of each algorithm model in a possible analysis. Therefore, based on our results, it is not possible to select one specific algorithm that predicts nascent entrepreneurs in Hungary with the best reliability. Rather, we can reach reliable conclusions about NEs by comparing the results of different models.
In our opinion, the comparison should be based on careful analysis of the level of predictors, as there are strong differences between the models on this level. Although each model highlighted the role of the category of demographic and economic variables along the predictor categories as the most important factor followed by the category of self-perceptions of the individual, the models attached moderate importance to the category of variables measuring the individual’s perception of society and the aggregate variable category. It is important to note that the combined effect of these categories as systemic effects affects nascent entrepreneurs. Furthermore, if we look at our results at the level of each predictor, we can see that the RF model, for example, measures socio-environmental perceptions and an aggregate variable as important factors, while the MARS model completely eliminated these two sets of variables from its optimal prediction. Based on our results, it can be stated that, in 2021, nascent entrepreneurs can be very accurately delineated on the basis of economic demographic indicators, perceptual indicators, and aggregate indicators. Along these lines, we refer to middle-aged and medium-sized entrepreneurs who typically own a business, are self-employed, and want to start a new business. The entrepreneurial environment in Hungary is typically thought to be characterized by a strong sense of social responsibility, and they plan to start their own business mainly in the central Hungarian region. Based on our research results, NEs in Hungary can be forecast based on these factors. We believe that this result could help planners of economic programs if they would like to strengthen this sector.
It is important to notice the fact that we were able to include just a small number of aggregate variables in the analysis; thus it still remains an open question to determine the exact importance of the aggregate variables. In our view, this could be examined with a cross-country comparative study.
It is also important to emphasize that our analysis also revealed that nascent entrepreneurs have very specific previous entrepreneurial and business ownership experience in Hungary. All this indicates that there are typically a few completely new entrants among nascent entrepreneurs, as those who already have a business would like to start a business in Hungary.
In summary, our results shed new light on the research of nascent entrepreneurs from two sides. On the one hand, we showed how questionable it is to choose only the most optimal algorithm for an analysis of a complex socio-economic phenomenon like nascent entrepreneurship. Contrary to the analyses with machine learning in the entrepreneurial research literature, we would like to emphasize the importance of conducting an in-depth analysis of the results in order to get a better understanding of the system-level drivers. On the other hand, our results support that part of the literature that emphasizes the role of personal, social, perceptual, and macro variables as important and unavoidable drivers of nascent entrepreneurs. We could demonstrate with machine learning algorithms that these variables and concepts have a significant and quantified impact on nascent entrepreneurs.

Author Contributions

Conceptualization, M.G. and C.F.J.; methodology, M.G.; software, M.G.; validation, M.G. and C.F.J.; formal analysis, M.G.; investigation, M.G.; resources, M.G.; data curation, M.G.; writing—original draft preparation, M.G.; writing—review and editing, M.G. and. C.F.J.; visualization, M.G.; project administration, C.F.J.; funding acquisition, C.F.J. All authors have read and agreed to the published version of the manuscript.

Funding

This research was funded by Thematic Excellence Programme of the Hungarian Ministry for Innovation and Technology, grant number [TKP2020-IKA-01].

Institutional Review Board Statement

The study was conducted according to the guidelines of the Declaration of Helsinki, and approved by the Institutional Review Board (or Ethics Committee) of Budapest Business School University of Applied Sciences (protocol code 22.11.33x and date of approval 2 January 2021).

Informed Consent Statement

Informed consent was obtained from all subjects involved in the study.

Data Availability Statement

The data presented in this study are available on request from the corresponding author. The data are not publicly available due to privacy issues.

Acknowledgments

This research was supported by a grant from the Thematic Excellence Programme of the Hungarian Ministry for Innovation and Technology to the Budapest Business School (TKP2020-IKA-01).

Conflicts of Interest

The authors declare no conflict of interest.

Appendix A

Table A1. Predictive and output variables.
ContextVariable Code GEM Question
Predictive (input) variablesAggregate ConditionsHuRegionSurvey vendor to provide the region in which the respondent lives
settlementTypeSettlement type of respondent
Demographic and Economic FactorsAgeWhat is your current age (in years)?
GenderWhat is your gender?
educationWhat is the highest level of education you have completed?
hhsizeHow many members make up your permanent household, including you?
workHarmonized work status
hhIncWhich ranges describes the total annual income of all the members of your household?
employeeFullEmployed by others in full-time work
employeePartEmployed by others in part-time work
employeeSelfSelf-employed
IntrapreneurActive as intrapreneur in past three years
ownerBusinessAre you, alone or with others, currently the owner of a business you help manage, self-employed, or selling any goods or services to others?
ownerBusinessPartAre you, alone or with others, currently the owner of a business you help manage for your employer as part of your main employment?
stopBusinessHave you, in the past 12 months, sold, shut down, discontinued or quit a business you owned and managed?
Perceptual VariablesSocialsocContextEqualIncIn my country, most people would prefer that everyone had a similar standard of living.
socContextEntrNotCareerIn my country, most people consider starting a new business a desirable career choice.
socContextEntrHighStatusIn my country, those successful at starting a new business have a high level of status and respect.
socContextMediaGEntrIn my country, you will often see stories in the public media and/or internet about successful new businesses.
socContextBuisSocIn my country, you will often see businesses that primarily aim to solve social problems.
IndividualfutureBusiStartAre you, alone or with others, expecting to start a new business, including any type of self-employment, within the next three years?
knowEntrepreneurDo you know someone personally who started a business in the past two years?
opportStartIn the next six months, will there be good opportunity for starting a business in the area where you live?
skillStartDo you have the knowledge, skill, and experience required to start a new business?
fearfailWould fear of failure prevent you from starting a business?
easyStartBusinIn your country, it is easy to start a business.
rareOpportunitiesYou rarely see business opportunities, even if you are very knowledgeable in the area.
proActWhen you spot a profitable opportunity, you act on it.
creativOther people think you are highly innovative
visionCareerEvery decision you make is part of your long-term career plan.
Output variable nascentCategory YES—nascent entrepreneur
Category NO—represents all other respondents
Table A2. Model evaluation metrics.
MARSAdaBoostRandom ForestsvmRadial
Accuracy0.91040.91040.91590.9174
95% CI(0.8782, 0.9365)(0.8782, 0.9365)(0.8866, 0.9428)(0.8838, 0.9407)
No Information Rate0.9030.9030.9030.903
p-Value (Acc > NIR)0.05030.135440.17771650.227
Kappa0.385310.004610.38330.3917
Mcnemar’s Test p-Value0.046750.0046070.00049851.807e-05
Pos Pred Value0.555560.571430.666670.69231
Neg Pred Value0.936000.929130.929690.92288
Precision0.555560.571430.666670.69231
Recall0.384620.307690.307690.23077
F10.454550.400000.421050.34615
Prevalence0.097010.097010.097010.09701
Detection Rate0.037310.029850.029850.02239
Detection Prevalence0.067160.052240.044780.03234
Balanced Accuracy0.675780.641450.645580.60987
“Positive” ClassYesYesYesYes

References

  1. Van Stel, A.; Wennekers, S.; Thurik, R.; Reynolds, P.; De Wit, G. Explaining Nascent Entrepreneurship Across Countries; Working Paper No. 200301; EIM Business and Policy Research: Zoetermeer, The Netherlands, 2003. [Google Scholar]
  2. Bruyat, C.; Julien, P.A. Defining the field of research in entrepreneurship. J. Bus. Ventur. 2001, 16, 165–180. [Google Scholar] [CrossRef]
  3. Dorado, S.; Ventresca, M.J. Crescive entrepreneurship in complex social problems: Institutional conditions for entrepreneurial engagement. J. Bus. Ventur. 2013, 28, 69–82. [Google Scholar] [CrossRef]
  4. Stathopoulou, S.; Psaltopoulos, D.; Skuras, D. Rural entrepreneurship in Europe. Int. J. Entrep. Behav. Res. 2004, 10, 404–425. [Google Scholar] [CrossRef]
  5. Anderson, A.R.; Dodd, S.D.; Jack, S.L. Entrepreneurship as connecting: Some implications for theorising and practice. Manag. Decis. 2012, 50, 958–971. [Google Scholar] [CrossRef] [Green Version]
  6. Nijkamp, P.; Poot, J.; Vindigni, G. Spatial dynamics and government policy: An artificial intelligence approach to comparing complex systems. In Knowledge, Complexity and Innovation Systems; Fischer, M.M., Frolich, J., Eds.; Springer: Boston, MA, USA, 2001; pp. 369–401. [Google Scholar]
  7. Varian, H.R. Big data: New tricks for econometrics. J. Econ. Perspect. 2014, 28, 3–28. [Google Scholar] [CrossRef] [Green Version]
  8. Carree, M.A.; Thurik, A.R. The impact of entrepreneurship on economic growth. In Handbook of Entrepreneurship Research; Acs, Z.J., Audretsch, D., Eds.; Springer: New York, NY, USA, 2003; pp. 557–594. [Google Scholar] [CrossRef]
  9. Neumark, D.; Wall, B.; Zhang, J. Do Small Businesses Create More Jobs? New Evidence for the United States from the National Establishment Time Series. Rev. Econ. Stat. 2008, 93, 16–29. [Google Scholar] [CrossRef] [Green Version]
  10. Haltiwanger, J.C.; Jarmin, R.S.; Miranda, J. Who Creates Jobs? Small vs. Large vs. Young; Working Paper No. 16300; National Bureau of Economic Research: Cambridge, UK, 2010. [Google Scholar] [CrossRef] [Green Version]
  11. Lueckgen, I.; Oberschachtsiek, D.; Sternberg, R.; Wagner, J. Nascent Entrepreneurs in German Regions: Evidence from the Regional Entrepreneurship Monitor (REM); Working Paper No. 1394; Institute for the Study of Labor: Bonn, Germany, 2004. [Google Scholar] [CrossRef]
  12. Wagner, J. Nascent entrepreneurs. In The Life Cycle of Entrepreneurial Ventures; Parker, S., Ed.; Springer: Boston, IL, USA, 2006; pp. 15–37. [Google Scholar] [CrossRef]
  13. Kessler, A.; Hermann, F. Nascent Entrepreneurship in a Longitudinal Perspective: The Impact of Person, Environment, Resources and the Founding Process on the Decision to Start Business Activities. Int. Small Bus. J. 2009, 27, 720–742. [Google Scholar] [CrossRef]
  14. Krueger, N. The Impact of Prior Entrepreneurial Exposure on Perceptions of New Venture Feasibility and Desirability. Entrepreneurship. Theory Pract. 1993, 18, 5–21. [Google Scholar] [CrossRef]
  15. Krueger, N.F.; Reilly, M.D.; Carsrud, A.L. Competing Models of Entrepreneurial Intentions. J. Bus. Ventur. 2000, 15, 411–432. [Google Scholar] [CrossRef]
  16. Reynolds, P.D. New Firm Creation in the United States A PSED I Overview. Found. Trends Entrep. 2007, 3, 1–150. [Google Scholar] [CrossRef]
  17. Reynolds, P.D. Who Starts New Firms—Preliminary Explorations of Firm-in-Gestation. Small Bus. Econ. 1997, 9, 449–462. [Google Scholar] [CrossRef]
  18. Rotefoss, B.; Kolvereid, L. Aspiring, Nascent and Fledgling Entrepreneurs: An Investigation of the Business Start-up Process. Entrep. Reg. Dev. 2005, 17, 109–127. [Google Scholar] [CrossRef]
  19. Delmar, F.; Davidsson, P. Where do they come from? Prevalence and characteristics of nascent entrepreneurs. Entrep. Reg. Dev. 2000, 12, 1–23. [Google Scholar] [CrossRef] [Green Version]
  20. Kolvereid, L.; Isaksen, E. New business startup and subsequent entry into self-employment. J. Bus. Ventur. 2006, 21, 566–885. [Google Scholar] [CrossRef]
  21. Minniti, M. Entrepreneurship and Network Externalities. J. Econ. Behav. Organ. 2005, 57, 1–27. [Google Scholar] [CrossRef]
  22. Capelleras, J.L.; Ignacio, C.P.; Martin-Sanchez, V.; Larraza-Kintana, M. The Influence of Individual Perceptions and the Urban/Rural Environment on Nascent Entrepreneurship. Investig. Regiionales—J. Reg. Res. 2013, 26, 97–113. [Google Scholar]
  23. Mueller, P. Entrepreneurship in the Region: Breeding Ground for Nascent Entrepreneurs? Small Bus. Econ. 2006, 27, 41–58. [Google Scholar] [CrossRef]
  24. Kim, P.; Howard, A.; Lisa, K. Access (Not) Denied: The Impact of Financial, Human, and Cultural Capital on Entrepreneurial Entryin the United States. Small Bus. Econ. 2006, 27, 5–22. [Google Scholar] [CrossRef]
  25. Arenius, P.; Minniti, M. Perceptual variables and nascent entrepreneurship. Small Bus. Econ. 2005, 24, 233–247. [Google Scholar] [CrossRef]
  26. Hindle, K.; Klyver, K. Exploring the relationship between media coverage and Participation in entrepreneurship: Initial global evidence and research implications. Int. Entrep. Manag. J. 2007, 3, 217–242. [Google Scholar] [CrossRef]
  27. Tiwari, P.; Anil, K.B.; Jyoti, T.; Kaustav, S. Exploring the factors responsible in predicting entrepreneurial intention among nascent entrepreneurs: A field research. South Asian J. Bus. Stud. 2019, 9, 1–18. [Google Scholar] [CrossRef]
  28. Krieger, A.; Joern, B.; Stuetzer, M. Skill Variety in Entrepreneurship: A Literature Review. Res. Dir. 2018, 16, 29–62. [Google Scholar]
  29. Nagy, Á.; Pete, S.; Gyorfy, L.Z.; Petru, T.P.; Benyovszki, A. Entrepreneurial Perceptions and Activity–Differences and Similarities in Four Eastern European Countries. Theor. Appl. Econ. 2010, 8, 1728. [Google Scholar]
  30. Alomani, A.; Baptista, R.; Athreye, S.S. The Interplay between Human, Social and Cognitive Resources of Nascent Entrepreneurs. Small Bus. Econ. 2022, 22, 322–342. [Google Scholar] [CrossRef]
  31. Cai, W.; Gu, J.; Wu, J. How Entrepreneurship Education and Social Capital Promote Nascent Entrepreneurial Behaviours: The Mediating Roles of Entrepreneurial Passion and Self-Efficacy. Sustainability 2021, 13, 11158. [Google Scholar] [CrossRef]
  32. Amit, Y.; Geman, D. Shape Quantization and Recognition with Randomized Trees. Neural Comput. 1997, 9, 1545–1588. [Google Scholar] [CrossRef] [Green Version]
  33. Mueller, P.; Van Stel, A.; Storey, D.J. The Effects of New Firm Formation on Regional Development over Time: The Case of Great Britain. Small Bus. Econ. 2008, 30, 59–71. [Google Scholar] [CrossRef] [Green Version]
  34. Ozmen, A.; Weber, G.W. RMARS: Robustification of multivariate adaptive regression spline under polyhedral uncertainty. J. Comput. Appl. Math. 2014, 259, 914–924. [Google Scholar] [CrossRef]
  35. Hamilton, B.H. Does Entrepreneurship Pay? An Empirical Analysis of the Returns to Self-Employment. J. Political Econ. 2000, 108, 604–631. [Google Scholar] [CrossRef] [Green Version]
  36. Moskowitz, T.J.; Vissing-Jørgensen, A. The Returns to Entrepreneurial Investment: A Private Equity Premium Puzzle? Am. Econ. Rev. 2002, 92, 745–778. [Google Scholar] [CrossRef] [Green Version]
  37. Parker, S.C. The Economics of Self-Employment and Entrepreneurship; Cambridge University Press: Cambridge, UK, 2004. [Google Scholar] [CrossRef]
  38. Kirzner, I.M. Competition and Entrepreneurship; University of Chicago Press: Chicago, IL, USA, 1978. [Google Scholar] [CrossRef]
  39. Kirzner, I.M. Perception, Opportunity, and Profit: Studies in the Theory of Entrepreneurship; University of Chicago Press: Chicago, IL, USA, 1979. [Google Scholar]
  40. Baciu, E.-L.; Vîrgă, D.; Lazăr, T.-A.; Gligor, D.; Jurcuț, C.-N. The Association between Entrepreneurial Perceived Behavioral Control, Personality, Empathy, and Assertiveness in a Romanian Sample of Nascent Entrepreneurs. Sustainability 2020, 12, 10490. [Google Scholar] [CrossRef]
  41. Wyrwich, M.; Stuetzer, M.; Sternberg, R. Entrepreneurial role models, fear of failure, and institutional approval of entrepreneurship: A tale of two regions. Small Bus. Econ. 2016, 46, 467–492. [Google Scholar] [CrossRef] [Green Version]
  42. Linan, F. Skill and value perceptions: How do they affect entrepreneurial intentions? Int. Entrep. Manag. J. 2008, 4, 257–272. [Google Scholar] [CrossRef]
  43. Wagner, J.; Sternberg, R. Start-up Activities, Individual Characteristics, and the Regional Milieu: Lessons for Entrepreneurship Support Policies from German Micro Data. Ann. Reg. Sci. 2004, 38, 219–240. [Google Scholar] [CrossRef]
  44. Bosma, N.; Hessels, J.; Schutjens, V.; Van Praag, M.; Verheul, I. Entrepreneurship and role models. J. Econ. Psychol. 2012, 33, 410–424. [Google Scholar] [CrossRef] [Green Version]
  45. Carr, J.C.; Sequeira, J.M. Prior Family Business Exposure as Intergenerational Influence and Entrepreneurial Intent: A Theory of Planned Behavior Approach. J. Bus. Res. 2007, 60, 1090–1098. [Google Scholar] [CrossRef]
  46. Nguyen, P.A.; Doan, D.R. Giving in Vietnam: A nascent third sector with potential for growth. In The Palgrave Handbook of Global Philanthropy; Palgrave Macmillan: London, UK, 2015; pp. 473–487. [Google Scholar]
  47. Portugal, I.; Alencar, P.; Cowan, D. The use of machine learning algorithms in Recommender systems: A systematic review. Expert Syst. Appl. 2018, 97, 205–227. [Google Scholar] [CrossRef] [Green Version]
  48. Juric, P.M.; Adela, H.; Tihana, K. Profiling Nascent Entrepreneurs in Croatia—Neural Network Approach. Ekon. Vjesn. 2019, 32, 335–346. [Google Scholar]
  49. Nguyen, X.T. Factors Affecting Entrepreneurial Decision of Nascent Entrepreneurs Belonging Generation Y in Vietnam. J. Asian Financ. Econ. Bus. 2010, 7, 407–417. [Google Scholar] [CrossRef]
  50. Shapero, A.; Sokol, L. The Social Dimensions of Entrepreneurship. In Encyclopedia of Entrepreneurship; Kent, C.A., Sexton, D.L., Vesper, K.H., Eds.; Prentice-Hall: Englewood Cliffs, NJ, USA, 1982; pp. 72–90. [Google Scholar]
  51. Ajzen, I. The Theory of Planned Behavior. Organizational Behavior and Human Decision Processes. Theor. Cogn. Self-Regul. 1991, 50, 179–211. [Google Scholar] [CrossRef]
  52. Fitriani, W.; Siahaan, A.P.U. Comparison Between WEKA and Salford System in Data Mining Software. Int. J. Mob. Comput. Appl. 2016, 3, 1–4. [Google Scholar]
  53. Maimon, O.; Last, M. Knowledge Discovery and Data Mining. Info-Fuzzy Netw. (IFN) Methodol. 2001, 2, 23–44. [Google Scholar]
  54. Marlina, L.; Muslim, A.; Siahaan, P.U. Data Mining Classification Comparison (Naive Bayes and C4.5 Algorithms). Int. J. Eng. Trends Technol. 2016, 38, 380–383. [Google Scholar] [CrossRef] [Green Version]
  55. Rahim, R.; Mesran, A.; Putera, U.; Siahaan, S.; Aryza, S. Composite performance index for student admission. Int. J. Res. Sci. Eng. 2017, 3, 68–74. [Google Scholar]
  56. Siahaan, M.D.L.; Elviwani, A.; Surbakti, B.; Lubis, A.H.; Siahaan, A.P.U. Implementation of Simple Additive Weighting Algorithm in Particular Instance. Int. J. Sci. Res. Sci. Technol. 2017, 3, 442–447. [Google Scholar]
  57. Turban, E.; Aronson, J.E.; Liang, T. Decision Support Sistems and Intelligent Systems; ICA: Yogyakarta, India, 2005.
  58. Dunham, M.H. Data Mining Introductory and Advanced Topics; Prentice Hall: Englewood Cliffs, NJ, USA, 2003. [Google Scholar]
  59. Lee, H. Role of artificial intelligence and enterprise risk management to promote corporate entrepreneurship and business performance: Evidence from Korean banking sector. J. Intell. Fuzzy Syst. 2020, 39, 5369–5386. [Google Scholar] [CrossRef]
  60. Nasution, M.D.T.P.; Rossanty, Y. Country of Origin as a Moderator of Halal Label and Purchase Behavior. J. Bus. Retail. Manag. Res. 2018, 12, 194–201. [Google Scholar] [CrossRef] [Green Version]
  61. Zhang, D.; Tsai, J.J.P. Advances in Machine Learning Applications in Software Engineering; Idea Group Pub: Hershey, PA, USA, 2007. [Google Scholar]
  62. Boutell, M.R.; Luo, J.; Shen, X.; Brown, C.M. Learning multi-label scene classification. Pattern Recognit. 2004, 37, 1757–1771. [Google Scholar] [CrossRef] [Green Version]
  63. Kotsiantis, S.B. Supervised machine learning: A review of classification techniques. Inform.-Ljubl. 2007, 31 Pt 3, 249–268. [Google Scholar]
  64. Mitchell, T.M. Machine Learning; McGraw-Hill: New York, NY, USA, 1997. [Google Scholar] [CrossRef]
  65. Pedregosa, F.; Varoquaux, G.; Gramfort, A.; Michel, V.; Thirion, B.; Grisel, O.; Duchesnay, E. Scikit-learn: Machine Learning in Python. J. Mach. Learn. Res. 2011, 12, 2825–2830. [Google Scholar]
  66. Cameron, A.C.; Trivedi, P.K. Microeconometrics: Methods and Applications; Cambridge University Press: Cambridge, UK, 2005. [Google Scholar] [CrossRef]
  67. Montebruno, P.; Bennett, R.J.; van Lieshout, C.; Smith, H. A tale of two tails: Do Power Law and Lognormal models fit firmsize distributions in the mid-Victorian era? Phys. A Stat. Mech. Its Appl. 2019, 573, 858–875. [Google Scholar] [CrossRef]
  68. James, G.; Witten, D.; Hastie, T.; Tibshirani, R. An Introduction to Statistical Learning; Springer: New York, NY, USA, 2013. [Google Scholar] [CrossRef]
  69. Mokhtia, M.; Eftekhari, M.; Saberi-Movahed, F. Dual-manifold regularized regression models for feature selection based on hesitant fuzzy correlation. Knowl.-Based Syst. 2021, 229, 107308. [Google Scholar] [CrossRef]
  70. Najafzadeh, M.; Etemad-Shahidi, A.; Lim, S.Y. Scour prediction in long contractions using ANFIS and SVM. Ocean Eng. 2016, 111, 128–135. [Google Scholar] [CrossRef]
  71. Najafzadeh, M.; Homaei, F.; Mohamadi, S. Reliability evaluation of groundwater quality index using data-driven models. Environ. Sci. Pollut. Res. 2022, 29, 8174–8190. [Google Scholar] [CrossRef] [PubMed]
  72. Saberi-Movahed, F.; Najafzadeh, M.; Mehrpooya, A. Receiving more accurate predictions for longitudinal dispersion coefficients in water pipelines: Training group method of data handling using extreme learning machine conceptions. Water Resour. Manag. 2020, 34, 529–561. [Google Scholar] [CrossRef]
  73. Sadeghi, G.; Najafzadeh, M.; Ameri, M. Thermal characteristics of evacuated tube solar collectors with coil inside: An experimental study and evolutionary algorithms. Renew. Energy 2020, 151, 575–588. [Google Scholar] [CrossRef]
  74. Celbis, M.G. A machine learning approach to rural entrepreneurship. Pap. Reg. Sci. 2021, 100, 1079–1104. [Google Scholar] [CrossRef]
  75. Oztekin, A.; Delen, D.; Turkyilmaz, A.; Zaim, S. A machine learning-based usability evaluation method for eLearning systems. Decis. Support Syst. 2013, 56, 63–73. [Google Scholar] [CrossRef]
  76. Qing, Y.; Zejun, W. Research on the impact of entrepreneurship policy on employment based on improved machine learning algorithms. J. Intell. Fuzzy Syst. 2021, 40, 6517–6528. [Google Scholar] [CrossRef]
  77. Friedman, J. Multivariate Adaptive Regression Splines. Ann. Stat. 1991, 19, 1–67. [Google Scholar] [CrossRef]
  78. Hastie, T.; Tibshirani, R.; Friedman, J. The Elements of Statistical Learning: Data Mining, Inference and Prediction, 2nd ed.; Springer: Boston, MA, USA, 2008. [Google Scholar]
  79. Borodin, V.; Bourtembourg, J.; Hnaien, F.; Labadie, N. Predictive modelling with panel data and multivariate adaptive regression splines: Case of farmers crop delivery for a harvest season ahead. Stoch. Environ. Res. Risk Assess. 2015, 3, 309–325. [Google Scholar] [CrossRef]
  80. Barron, A.R.; Xiao, X. Discussion: Multivariate adaptive regression splines. Annu. Stat. 1991, 19, 67–82. [Google Scholar] [CrossRef]
  81. Dietterich, T. An Experimental Comparison of Three Methods for Constructing Ensembles of Decision Trees: Bagging, Boosting, and Randomization. Mach. Learn. 2000, 40, 139–158. [Google Scholar] [CrossRef]
  82. Golub, G.; Heath, M.; Wahba, G. Generalized Cross–Validation as a Method for Choosing a Good Ridge Parameter. Technometrics 1979, 21, 215–223. [Google Scholar] [CrossRef]
  83. Kuhn, M.; Johnson, K. Applied Predictive Modeling; Springer: New York, NY, USA, 2013. [Google Scholar] [CrossRef]
  84. Huberty, C.J. Problems with stepwise methods—better alternatives. Adv. Soc. Sci. Methodol. 1989, 1, 43–70. [Google Scholar]
  85. Chen, H.-L.; Yang, B.; Liu, J.; Liu, D.-Y. A support vector machine classifier with rough set-based feature selection for breast cancer diagnosis. Expert Syst. Appl. 2011, 38, 9014–9022. [Google Scholar] [CrossRef]
  86. Freund, Y.; Schapire, R. Experiments with a New Boosting Algorithm. Mach. Learn. Proc. Thirteen. Int. Conf. 1996, 23, 148–156. [Google Scholar]
  87. Thapa, A. Determinants of microenterprise performance in Nepal. Small Bus. Econ. 2015, 45, 581–594. [Google Scholar] [CrossRef]
  88. Yao, X.; Wu, X.; Long, D. University students’ entrepreneurial tendency in China effect of students’ perceived entrepreneurial environment. J. Entrepren. Emerg. Econ. 2016, 8, 60–81. [Google Scholar] [CrossRef]
  89. Hsu, C.; Lin, C. A Comparison of Methods for Multiclass Support Vector Machines. IEEE Trans. Neural Netw. 2002, 13, 415–425. [Google Scholar] [PubMed] [Green Version]
  90. Platt, J. Probabilistic Outputs for Support Vector Machines and Comparison to Regularized Likelihood Methods. In Advances in Kernel Methods Support Vector Learning; Bartlett, B., Schölkopf, B., Schuurmans, D., Smola, A., Eds.; MIT Press: Cambridge, MA, USA, 2000; pp. 61–74. [Google Scholar]
  91. Boser, B.; Guyon, I.; Vapnik, V.A. Training Algorithm for Optimal Margin Classifiers. In Proceedings of the Fifth Annual Workshop on Computational Learning Theory, Pittsburgh, PA, USA, 27–29 July 1992; Volume 12, pp. 144–152. [Google Scholar] [CrossRef]
  92. Duan, K.; Keerthi, S. Which is the Best Multiclass SVM Method? An Empirical Study. Mult. Classif. Syst. 2005, 12, 278–285. [Google Scholar]
  93. Scholkopf, B.; Smola, A.J. Support Vector Machines, Data Mining Knowledge. Discovery 2003, 1, 283–289. [Google Scholar] [CrossRef]
  94. Blumer, A.; Ehrenfeucht, D.; Haussler, M.; Warmuth, K. Learnability and the Vapnik-Chervonenkis dimension. J. ACM 1989, 36, 929–965. [Google Scholar] [CrossRef]
  95. Vapnik, V. The Nature of Statistical Learning Theory; Springer: New York, NY, USA, 2010. [Google Scholar] [CrossRef]
  96. Cortes, C.; Vapnik, V. Support–Vector Networks. Mach. Learn. 1995, 20, 273–297. [Google Scholar] [CrossRef]
  97. Huang, C.; Davis, L.S.; Townshend, J.R.G. An assessment of support vector machines for land cover classification. Int. J. Remote Sens. 2002, 23, 725–749. [Google Scholar] [CrossRef]
  98. Huang, Z.; Chen, H.; Hsu, C.J.; Chen, W.H.; Wu, S. Credit rating analysis with support vector machines and neural net- works: A market comparative study. Decis. Support Syst. 2004, 37, 543–558. [Google Scholar] [CrossRef]
  99. Shen, L.; Chen, H.; Yu, Z. Evolving support vector machines using fruit fly optimization for medical data classification. Knowl.-Based Syst. 2016, 96, 61–75. [Google Scholar] [CrossRef]
  100. Nasution, M.D.T.P.; Siahaan, A.P.U.; Rossanty, Y.; Aryza, S. Entrepreneurship intention prediction using decision tree and support vector machine. In International Conference on Advance & Scientific Innovation; EUDL: Medan, Indonesia, 2018. [Google Scholar]
  101. Marijana, Z.S.; Sanja, P.; Ivana, D. Classification of entrepreneurial intentions by neural networks, decision trees and support vector machines. Croat. Oper. Res. Rev. 2010, 1, 62–71. [Google Scholar] [CrossRef]
  102. Iskender, E.; Bati, G.B. Comparing Turkish universities entrepreneurship and innovativeness index’s rankings with sentiment analysis results on social media. Procedia—Soc. Behav. Sci. 2015, 195, 1543–1552. [Google Scholar] [CrossRef] [Green Version]
  103. Breiman, L. Random Forests. Mach. Learn. 2001, 45, 5–32. [Google Scholar] [CrossRef] [Green Version]
  104. Efron, B.; Tibshirani, R.J. An Introduction to the Bootstrap; CRC Press Book: Boca Raton, FL, USA, 1994. [Google Scholar] [CrossRef]
  105. Breiman, L.; Friedman, J.H.; Olshen, R.A.; Stone, C.J. Classification and Regression Trees; Routledge: New York, NY, USA, 1984. [Google Scholar]
  106. Breiman, L. Randomizing Outputs to Increase Prediction Accuracy. Mach. Learn. 2000, 40, 229–242. [Google Scholar] [CrossRef] [Green Version]
  107. Ho, T. The Random Subspace Method for Constructing Decision Forests. IEEE Trans. Pattern Anal. Mach. Intell. 1998, 13, 340–354. [Google Scholar]
  108. Wang, X.; Wang, Z.; Weng, J.; Wen, C.; Chen, H.; Wang, X. A New Effective Machine Learning Framework for Sepsis Diagnosis. IEEE Access 2018, 6, 48300–48310. [Google Scholar] [CrossRef]
  109. Xu, B.; Yang, J.; Sun, B. A nonparametric decision approach for entrepreneurship. Int. Entrep. Manag. J. 2018, 14, 5–14. [Google Scholar] [CrossRef]
  110. Carter, M.R.; Tjernstro€m, E.; Toledo, P. Heterogeneous impact dynamics of a rural business development program in Nicaragua. J. Dev. Econ. 2019, 138, 77–98. [Google Scholar] [CrossRef]
  111. Kearns, M.; Valiant, L. Cryptographic Limitations on Learning Boolean Formulae and Finite Automata. In Proceedings of the Twenty-First Annual ACM Symposium on Theory of Computing, Seattle, WA, USA, 14–17 May 1989; ASSE: Cardif, UK. [Google Scholar]
  112. Valiant, L. A Theory of the Learnable. Commun. ACM 1984, 27, 1134–1142. [Google Scholar] [CrossRef] [Green Version]
  113. Schapire, R. The Strength of Weak Learnability. Mach. Learn. 1990, 45, 197–227. [Google Scholar] [CrossRef] [Green Version]
  114. Schapire, Y.F.R. Adaptive Game Playing Using Multiplicative Weights. Games Econ. Behav. 1999, 29, 79–103. [Google Scholar]
  115. Dudoit, S.; Fridlyand, J.; Speed, T. Comparison of Discrimination Methods for the Classification of Tumors Using Gene Expression Data. J. Am. Stat. Assoc. 2002, 97, 77–87. [Google Scholar] [CrossRef] [Green Version]
  116. Ben-Dor, A.; Bruhn, L.; Friedman, N.; Nachman, I.; Schummer, M.; Yakhini, Z. Tissue, Classification with Gene Expression Profiles. J. Comput. Biol. 2000, 7, 559–583. [Google Scholar] [CrossRef]
  117. Varmuza, K.; He, P.; Fang, K. Boosting Applied to Classification of Mass Spectral Data. J. Data Sci. 2003, 1, 391–404. [Google Scholar] [CrossRef]
  118. Bergstra, J.; Casagrande, N.; Erhan, D.; Eck, D.; Kegl, B. Aggregate Features and AdaBoost for Music Classification. Mach. Learn. 2006, 65, 473–484. [Google Scholar] [CrossRef]
  119. Cohen, J. A Coefficient of Agreement for Nominal Data. Educ. Psychol. Meas. 1960, 20, 37–46. [Google Scholar] [CrossRef]
  120. Cohen, P.; West, S.G.; Aiken, L.S. Applied Multiple Regression/Correlation Analysis for the Behavioral Sciences, 2nd ed.; Psychology Press: New York, NY, USA, 2014. [Google Scholar]
  121. Altman, D.; Bland, J. Diagnostic Tests 3: Receiver Operating Characteristic Plots. Br. Med. J. 1994, 309, 188. [Google Scholar] [CrossRef] [PubMed] [Green Version]
  122. Brown, C.; Davis, H. Receiver Operating Characteristics Curves and Related Decision Measures: A Tutorial. Chemom. Intell. Lab. Syst. 2006, 80, 24–38. [Google Scholar] [CrossRef]
  123. Fawcett, T. An Introduction to ROC Analysis. Pattern Recognit. Lett. 2006, 27, 861–874. [Google Scholar] [CrossRef]
  124. GEM Global Report. GEM Global Report 2021/2022. Available online: https://gemconsortium.org/file/open?fileId=50900 (accessed on 10 March 2022).
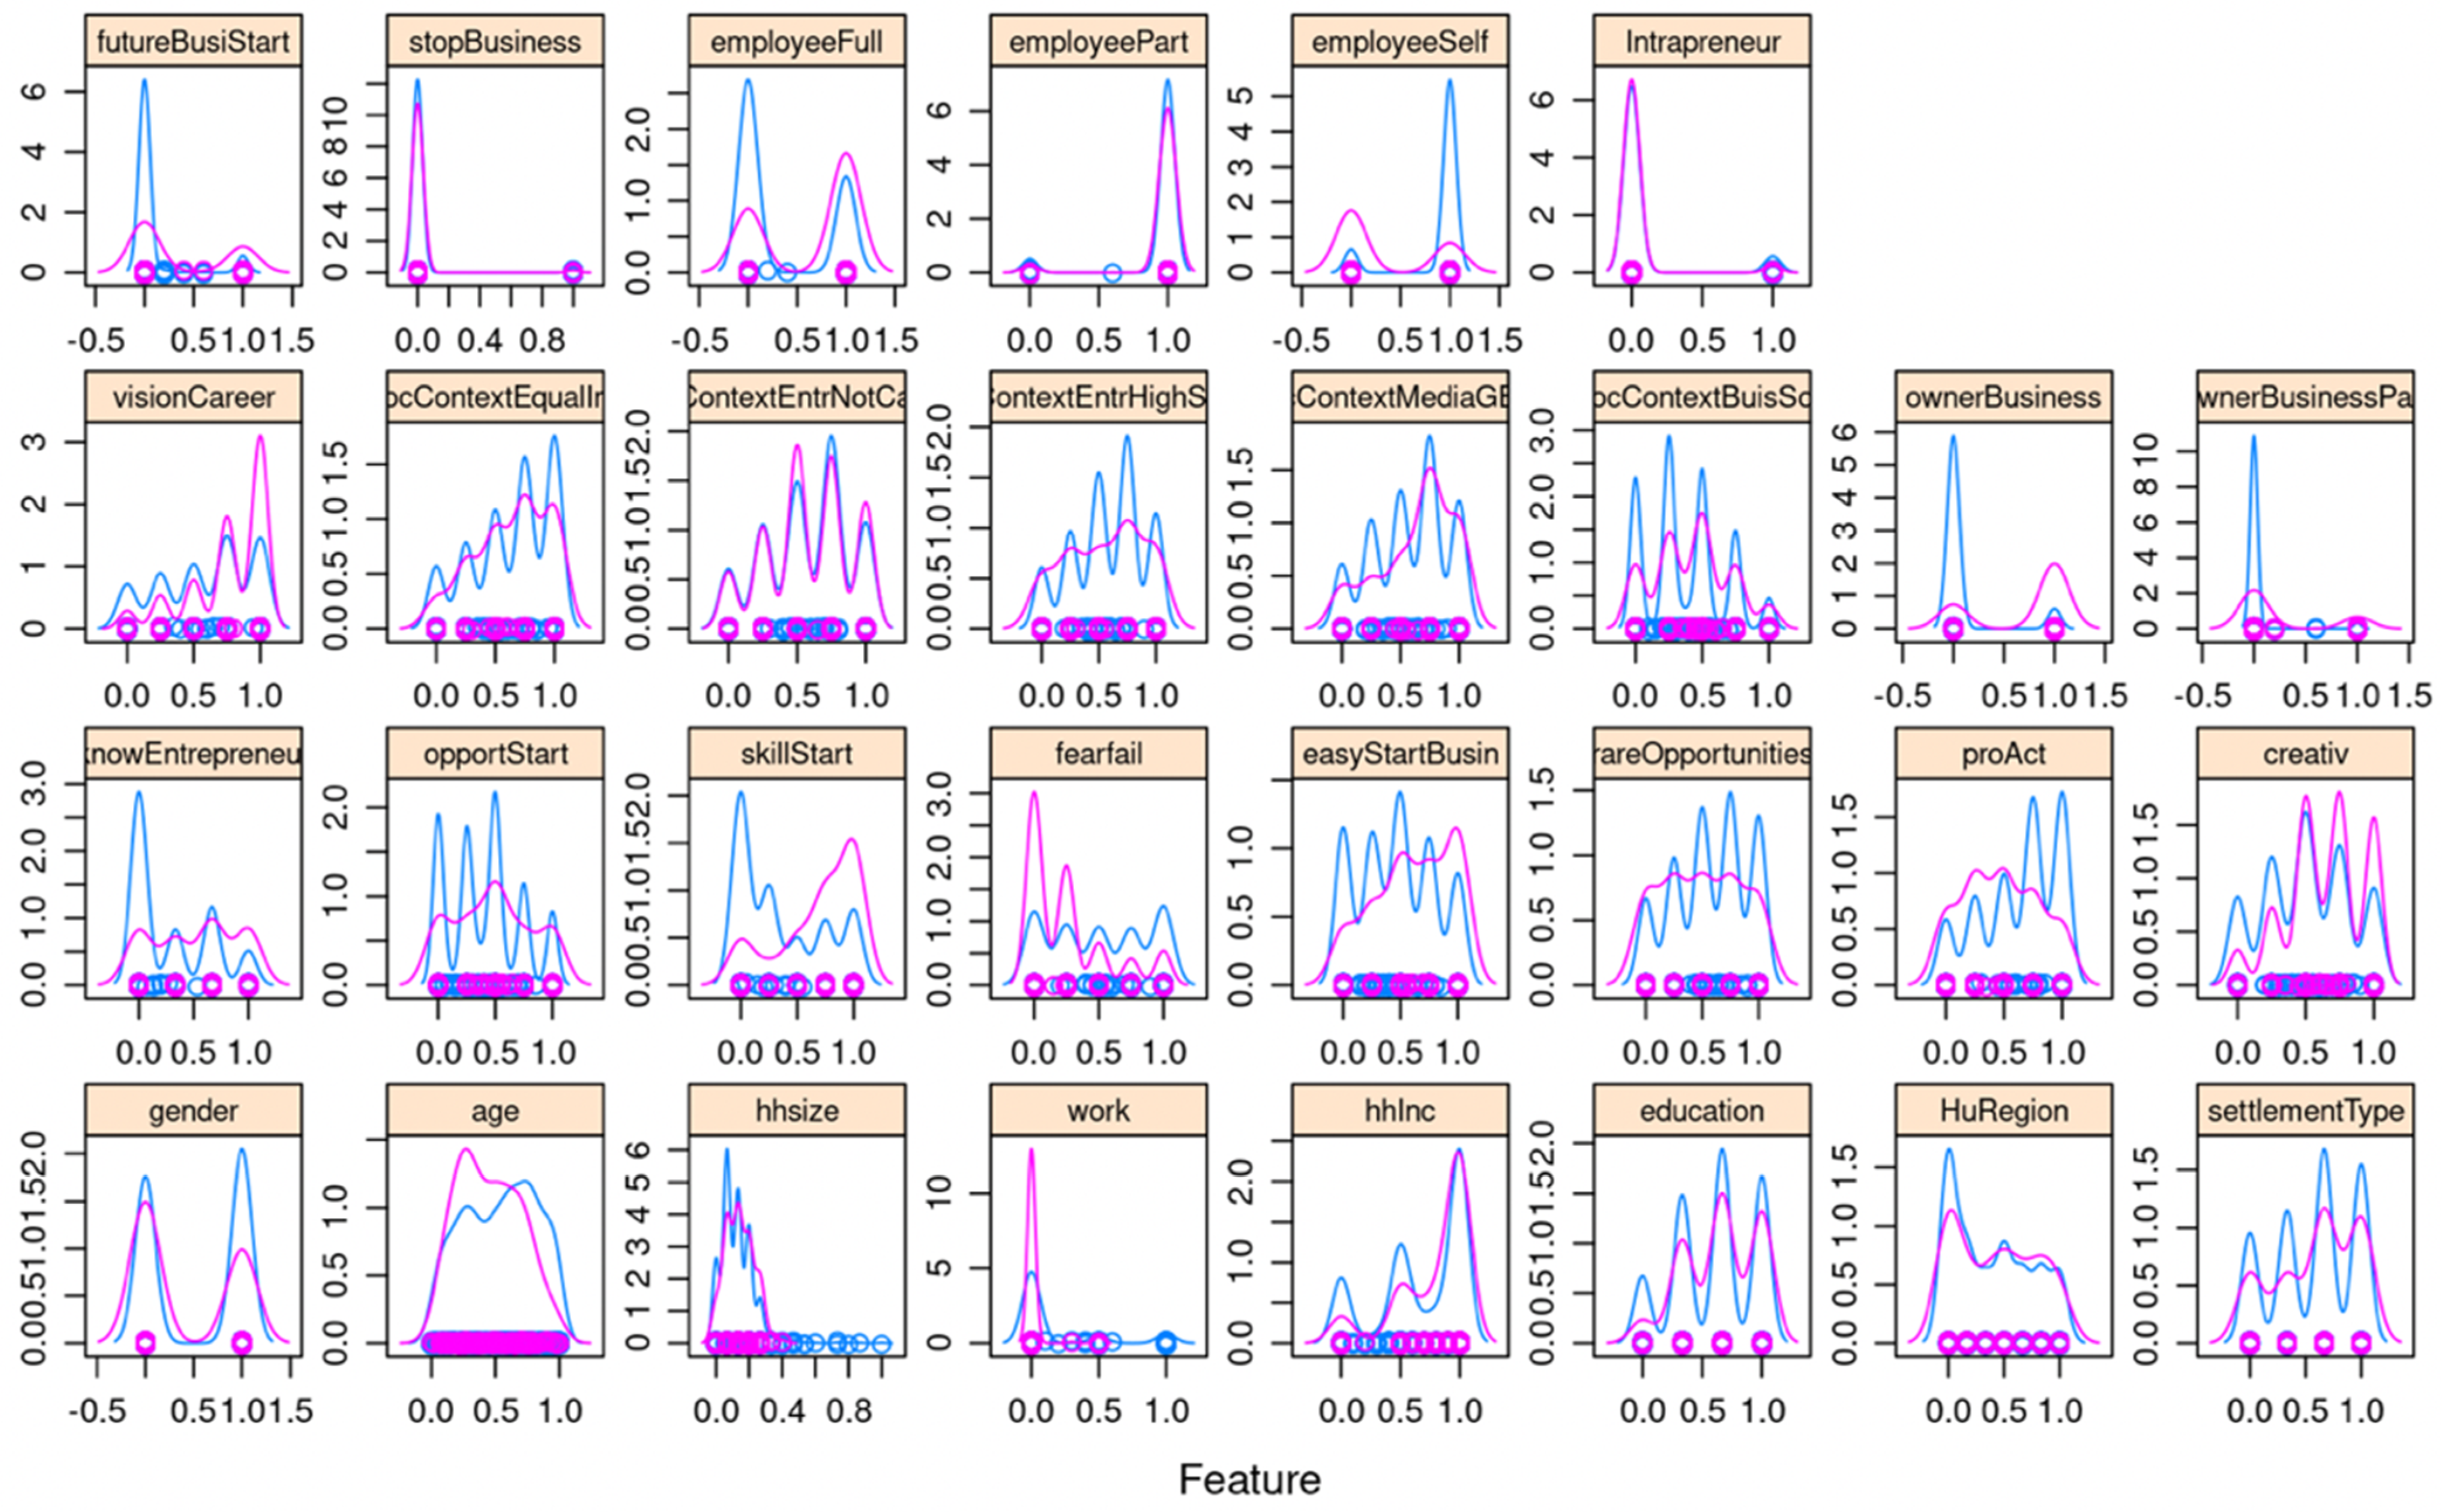
Figure 1. Density diagrams of the nascent variable along the predictor variables.
Sustainability 14 03571 g001
Figure 2. Accuracy and kappa values of the models (in Figure 2, the MARS algorithm is denoted by the term “earth” due to copyright issues).
Sustainability 14 03571 g002
Figure 3. Importance of predictive variables of MARS model.
Sustainability 14 03571 g003
Figure 4. Importance of predictive variables for the svmRadial mode.
Sustainability 14 03571 g004
Figure 5. Importance of predictive variables for the AdaBoost model.
Sustainability 14 03571 g005
Figure 6. Importance of predictive variables for the RF model.
Sustainability 14 03571 g006
Table 1. Confusion matrix and statistics.
MARSReferenceAdaBoostReference
NoYesNoYes
PredictionNo35124No35427
Yes1215Yes912
Random ForestReferencesvmRadialReference
NoYesNoYes
PredictionNo35727No 35930
Yes612Yes49
Table 2. ROC, sensitivity, and specificity values of machine learning models.
Average of ROCStdDev of ROCAverage of SensStdDev of SensAverage of SpecStdDev of Spec
AdaBoost0.9480.0010.9590.0050.4370.036
MARS0.9560.0030.9730.0050.4270.056
Random Forest0.9530.0020.9650.0170.4150.169
svmRadial0.9410.0100.9670.0020.4130.088
Total0.9490.0100.9680.0080.4200.087
Table 3. Selection of the top ten predictor variables along the models.
ContextVariable Code MARS svmRadial AdaBoostRandomForest
Aggregate ConditionsHuRegion X
settlementType
Demographic and Economic FactorsAgeX X
Gender
education
hhsize X X
work
hhInc
employeeFull XX
employeePart
employeeSelf XXXX
Intrapreneur
ownerBusinessXXXX
ownerBusinessPart
stopBusinessX
Perceptual VariablesSocialsocContextEqualInc
socContextEntrNotCareer
socContextEntrHighStatus
socContextMediaGEntr
socContextBuisSoc X
IndividualfutureBusiStartXXXX
knowEntrepreneurXXX
opportStart X
skillStart XXX
fearfail XX
easyStartBusin X X
rareOpportunities X
proAct XXX
creativ
visionCareer XX
Table 4. Importance of predictive variable sets in models.
MARSsvmRadialAdaBoostRandomForest
Demographic and Economic Factors1111
Perceptual Variables—Individual2222
Perceptual Variables—Social0333
Aggregate Conditions0444
Publisher’s Note: MDPI stays neutral with regard to jurisdictional claims in published maps and institutional affiliations.