Article

Pollution Contribution Response in Governance and Potential Pollution Factors in Licun River

1
College of Environmental Science and Engineering, Ocean University of China, Qingdao 266100, China
2
Qingdao Public Utility Construction Management Center, Qingdao 266100, China
*
Author to whom correspondence should be addressed.
Sustainability 2022, 14(6), 3547; https://doi.org/10.3390/su14063547
Submission received: 23 January 2022 / Revised: 6 March 2022 / Accepted: 9 March 2022 / Published: 17 March 2022
(This article belongs to the Section Sustainable Water Management)

Abstract

:
The development of the city results in deterioration of the water quality of the Licun River. As a result, years of governance have been conducted to improve its water quality. In order to clarify the response changes of water quality in the water governance, the governance process is divided into three stages (2000–2007, 2008–2016, 2017–2020) according to different priorities. Spearman’s rank correlation coefficient and the comprehensive pollution index are applied to analyze the variation of water quality response at various stages. In addition, the main pollution contributions with the governance changes were obtained. It is concluded that flood control and incomplete river pollution interception have a limited effect on water quality improvement, with NH3-N (ammonia nitrogen) and COD (chemical oxygen demand) being the main pollution contributions at the first stage. At the second stage, the point source control and sewage treatment facilities significantly improve water quality, and the main pollution contributions are NH3-N and TP (total phosphorus). At the third stage, sewage treatment facilities and supporting pipelines are improved, water sources are replenished, and the main pollution contribution is TN (total nitrogen). For further treatment, the factors affecting pollution are analyzed, including the contradiction of sewage system, point source pollution caused by pipe network problems, shortage of water resources, sludge pollution, and non-point source pollution.

1. Introduction

With the rapid development of cities and industries, the water quality of urban rivers is facing increasing pollution [1,2]. In particular, the rapid development of coastal cities has also resulted in the imbalance between the environment and development [3,4]. The largest river in the central area of Qingdao is the Licun River, which flows through agricultural, commercial, and industrial areas and finally into the sea. For a long time, the ecosystem of the Licun River has been damaged by water pollution. Although huge financial and physical resources have been devoted to improving water quality, the effect is unsatisfactory, and pollution prevention and control are still serious [5,6]. In the 2018 survey of black odor water in Chinese cities, the problem of black and odorous water still existed in the Licun River basin. The severe urban water problems threaten the sustainability of economic growth and the high quality of life [7,8]. In order to better manage the Licun River, it is necessary to identify potential pollution risks and water quality changes during water quality management.
In this study, the water quality changes at different treatment stages of the Licun River basin were comprehensively analyzed [9]. The variation of water quality was applied to reflect the water quality response with the change of governance, and the change in pollution contribution of different pollutants at each governance stage was analyzed [10,11]. The contradiction between the collection and the treatment capacity of the sewage system, the pipe network problems, the shortage of water, the sediment pollution discharge, and non-point source pollution were analyzed to explore existing factors of water pollution [12]. This study can provide a reference for further management of the Licun River basin.

2. Materials and Methods
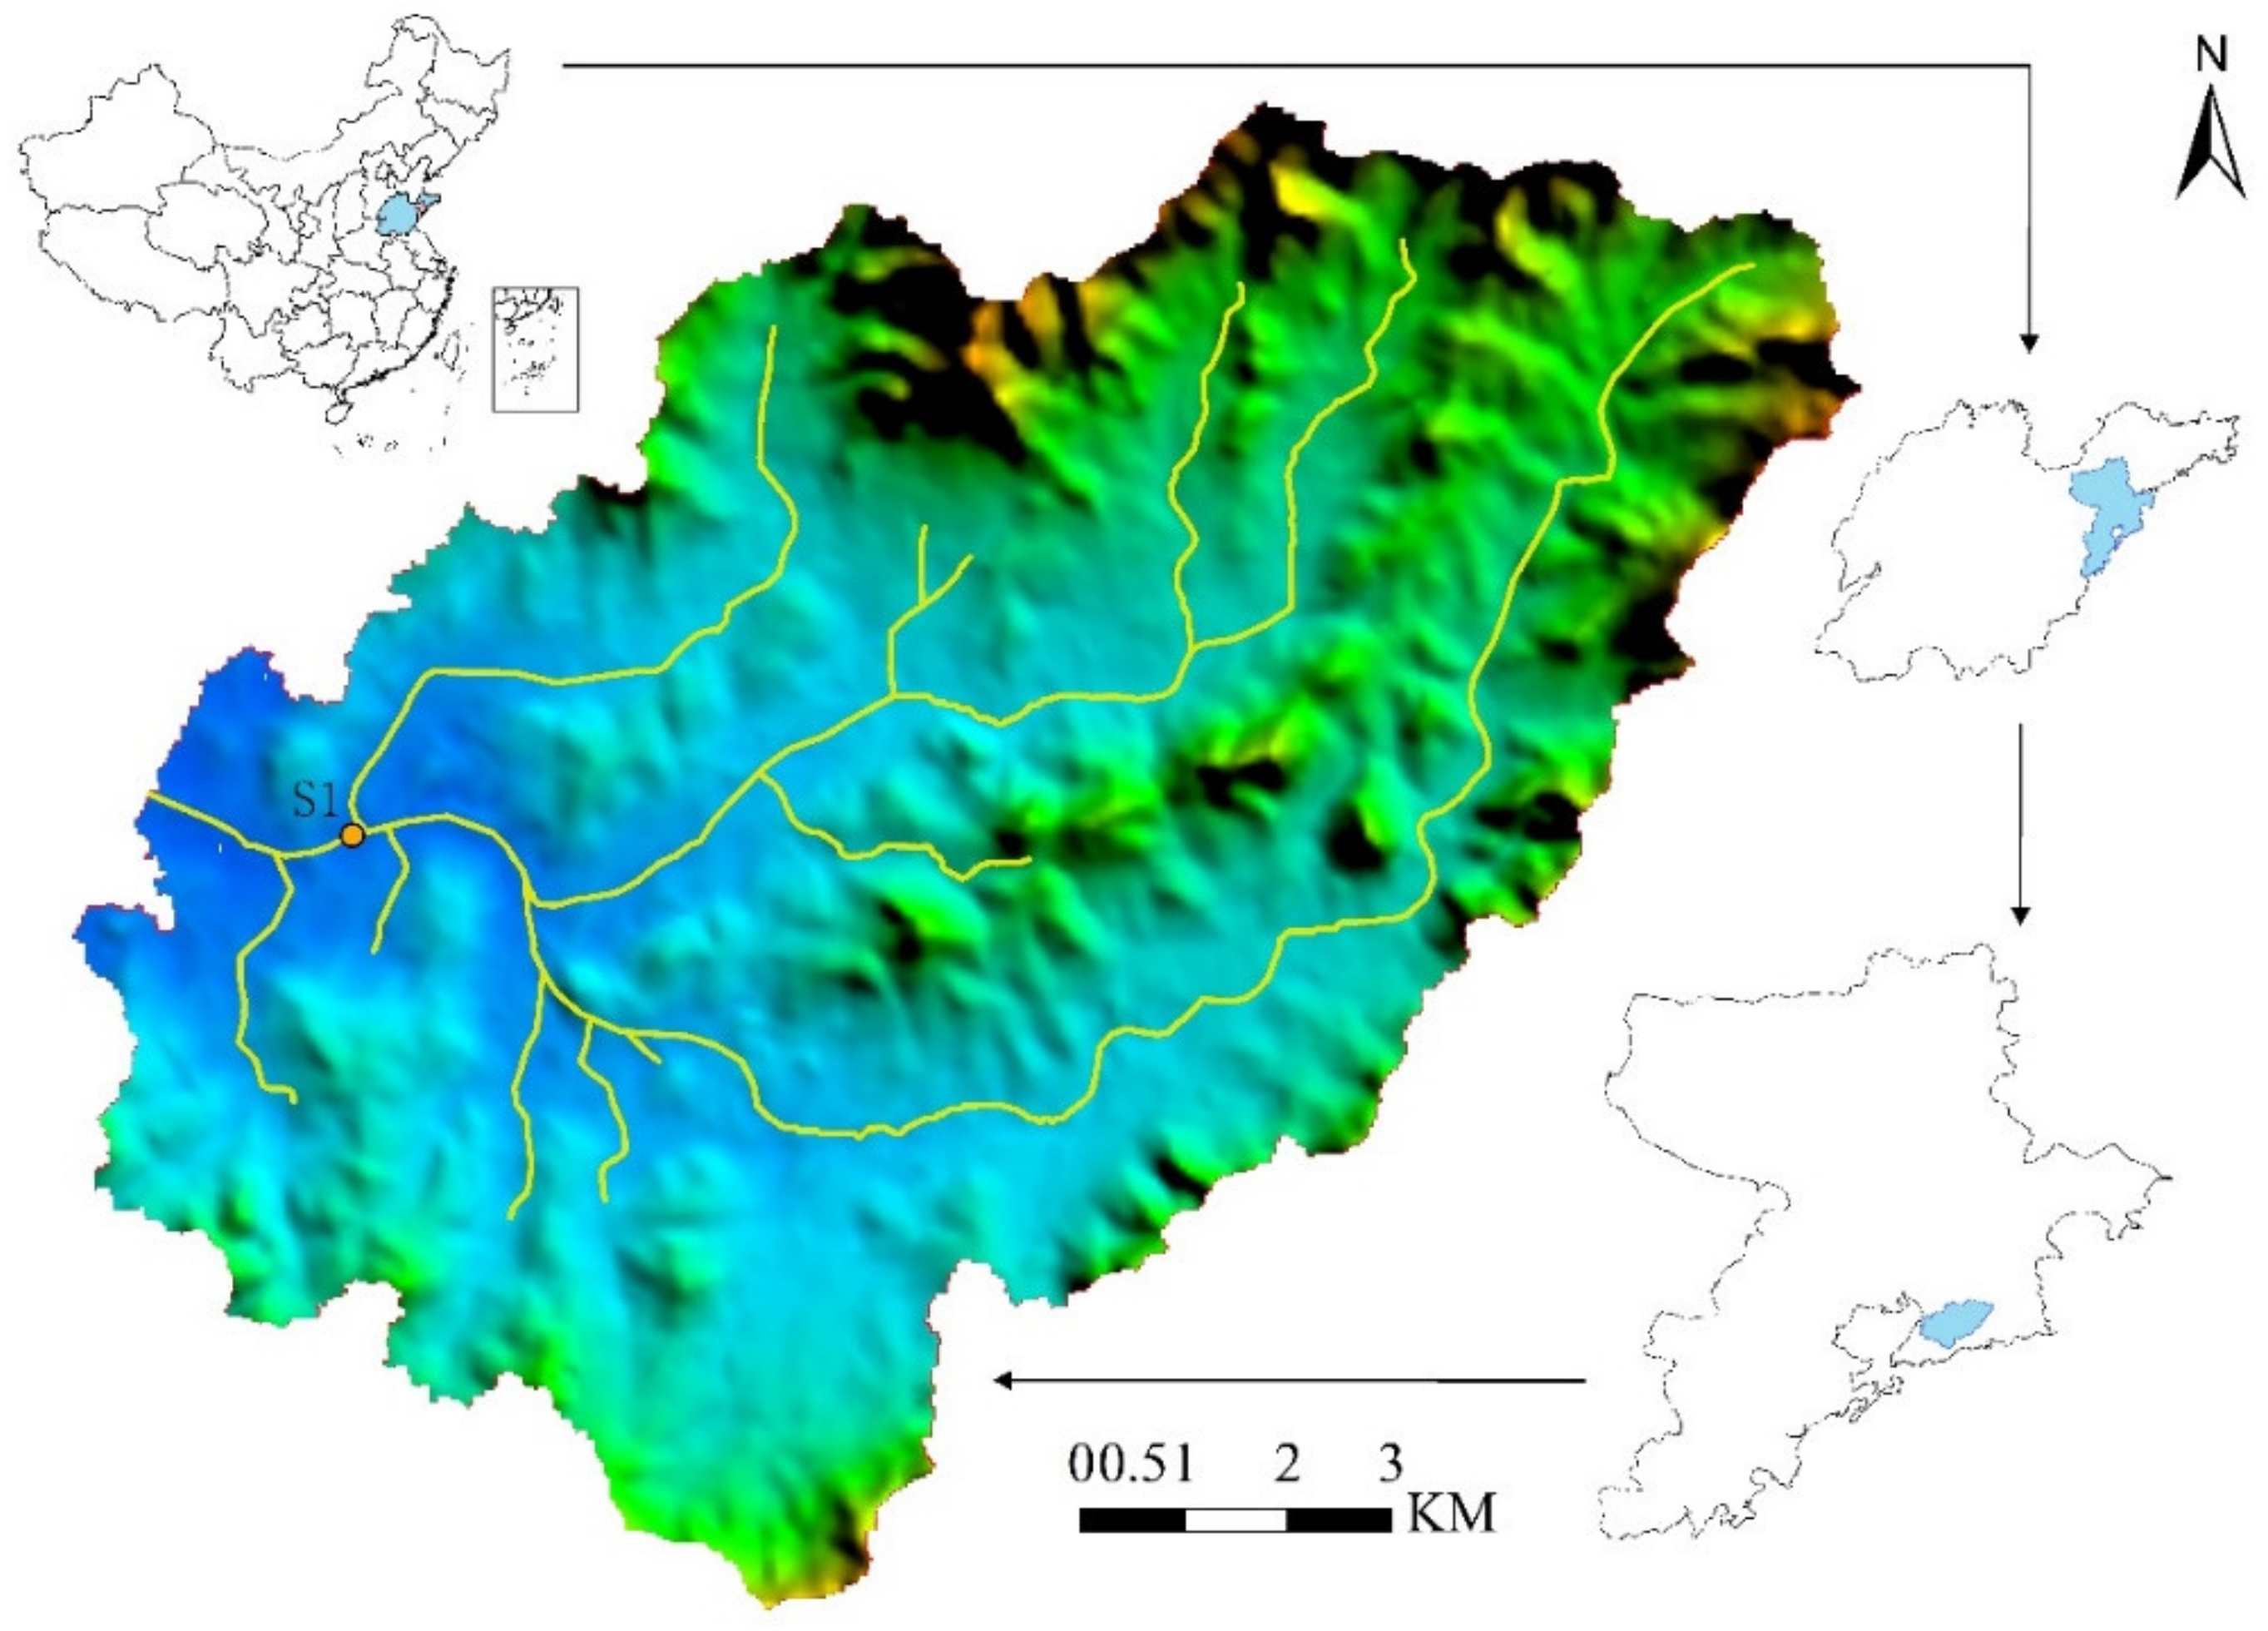
2.1. Study Area

The Licun River consists of 10 main tributaries, including the Dacun River, Zhangcun River and Shuiqinggou River (Figure 1). The total length of the water system is about 50 km, of which the main stream is about 17 km and the basin area is 137 km2. The population of the watershed was 1.3 × 10⁶, and the population density was 622 people per square kilometer in 2019. The population of the watershed has been increasing at an alarming rate. Due to the drastic development in the population and economy, the river produces about 1.66 × 10⁷ t of industrial wastewater and 3.11 × 10⁵ t of domestic sewage every day.

2.2. Data Acquisition

Water quality data were collected from the monitoring site of Shengli Bridge along the Licun River (Figure 1), which is the only national water quality monitoring site in the basin. The monitoring site is in the lower reaches of the river with a dense population, concentrated black smelly water, sufficient water, which is beneficial for continuous monitoring. The site was sampled weekly from January 2016 to December 2020. The main monitoring variables included pH, dissolved oxygen (DO), ammonia-nitrogen (NH3-N), total phosphorus (TP), total nitrogen (TN), five-day biochemical oxygen demand (BOD5), petroleum hydrocarbons, and the permanganate index for chemical oxygen demand (CODMn). Historical water quality data were collected from Qingdao Environmental Protection Bureau and Qingdao Environmental Status Bulletin.
The sampling section was selected to avoid local pollution sources and other factors that could cause water pollution spikes. The sampling process was strictly according to the surface-water-related monitoring technical specifications and national standard methods. River water at the site was sampled in polyethylene plastic bottles, pre-rinsed three times with distilled water, and kept below 4 °C for laboratory analysis [13]. DO and pH were determined directly in situ using a multiparameter water quality monitoring instrument. Pretreatment and determination for these parameters were all conducted following national standard methods.

2.3. Analytical Method

The comprehensive pollution index can evaluate water pollution status simply by statistics [14], which can express the general trend of water pollution in the river on a time scale and quickly calculate the contribution rate of a single pollution variable. This method avoids the incompleteness of water pollution represented by a single index and the difficulty of complex calculation and comparison when describing water pollution by multiple indexes [15]. In the comprehensive pollution index method, the value of P (Comprehensive River Pollution Index) and K (Pollution bearing rate) were estimated by:
P = 1 n i = 1 n P i
P i = C i C 0
K i = P i P × 100 %
P ≤ 0.8 means that the water is qualified and basically meets the corresponding functional standards, with only some indicators exceeding standards (within one time). Moreover, 0.8 < P ≤ 1.0 means the water is basically qualified, and a few water quality indicators are over corresponding standards, indicating that the water function has not been significantly damaged; 1.0 < P ≤ 2.0 refers to water pollution, and most water quality indices are beyond corresponding standards, indicating limited water function. P > 2.0 denotes severe pollution, and each water quality index is out of the standard by more than one time on average, some even several times, implying the water function has been seriously damaged [16].
Spearman’s rank correlation coefficient has fewer requirements on data conditions and fewer restrictions on the overall distribution and sample size of continuous variables. This method can further verify the reliability of the trend of water quality obtained by the comprehensive pollution index method [17]. In Spearman’s rank correlation coefficient method, the value of rs was estimated by:
r s = 1 6 i = 1 N d i 2 N 3 N
d i = X i Y i
The absolute value of rs was compared with the critical value (Wp) in Spearman’s rank correlation [18] coefficient statistical table, shown in Appendix A. When rs is greater than Wp, the change is significant. Negative rs indicates that index changes show a downward or upward trend in the evaluation period, while positive rs implies that the index changes tend to increase in the evaluation period. When rs is no more than Wp, the change is insignificant, and the water quality is stable during the evaluation period.

3. The Response of Water Quality and Pollution Contribution under Various Stages of Governance

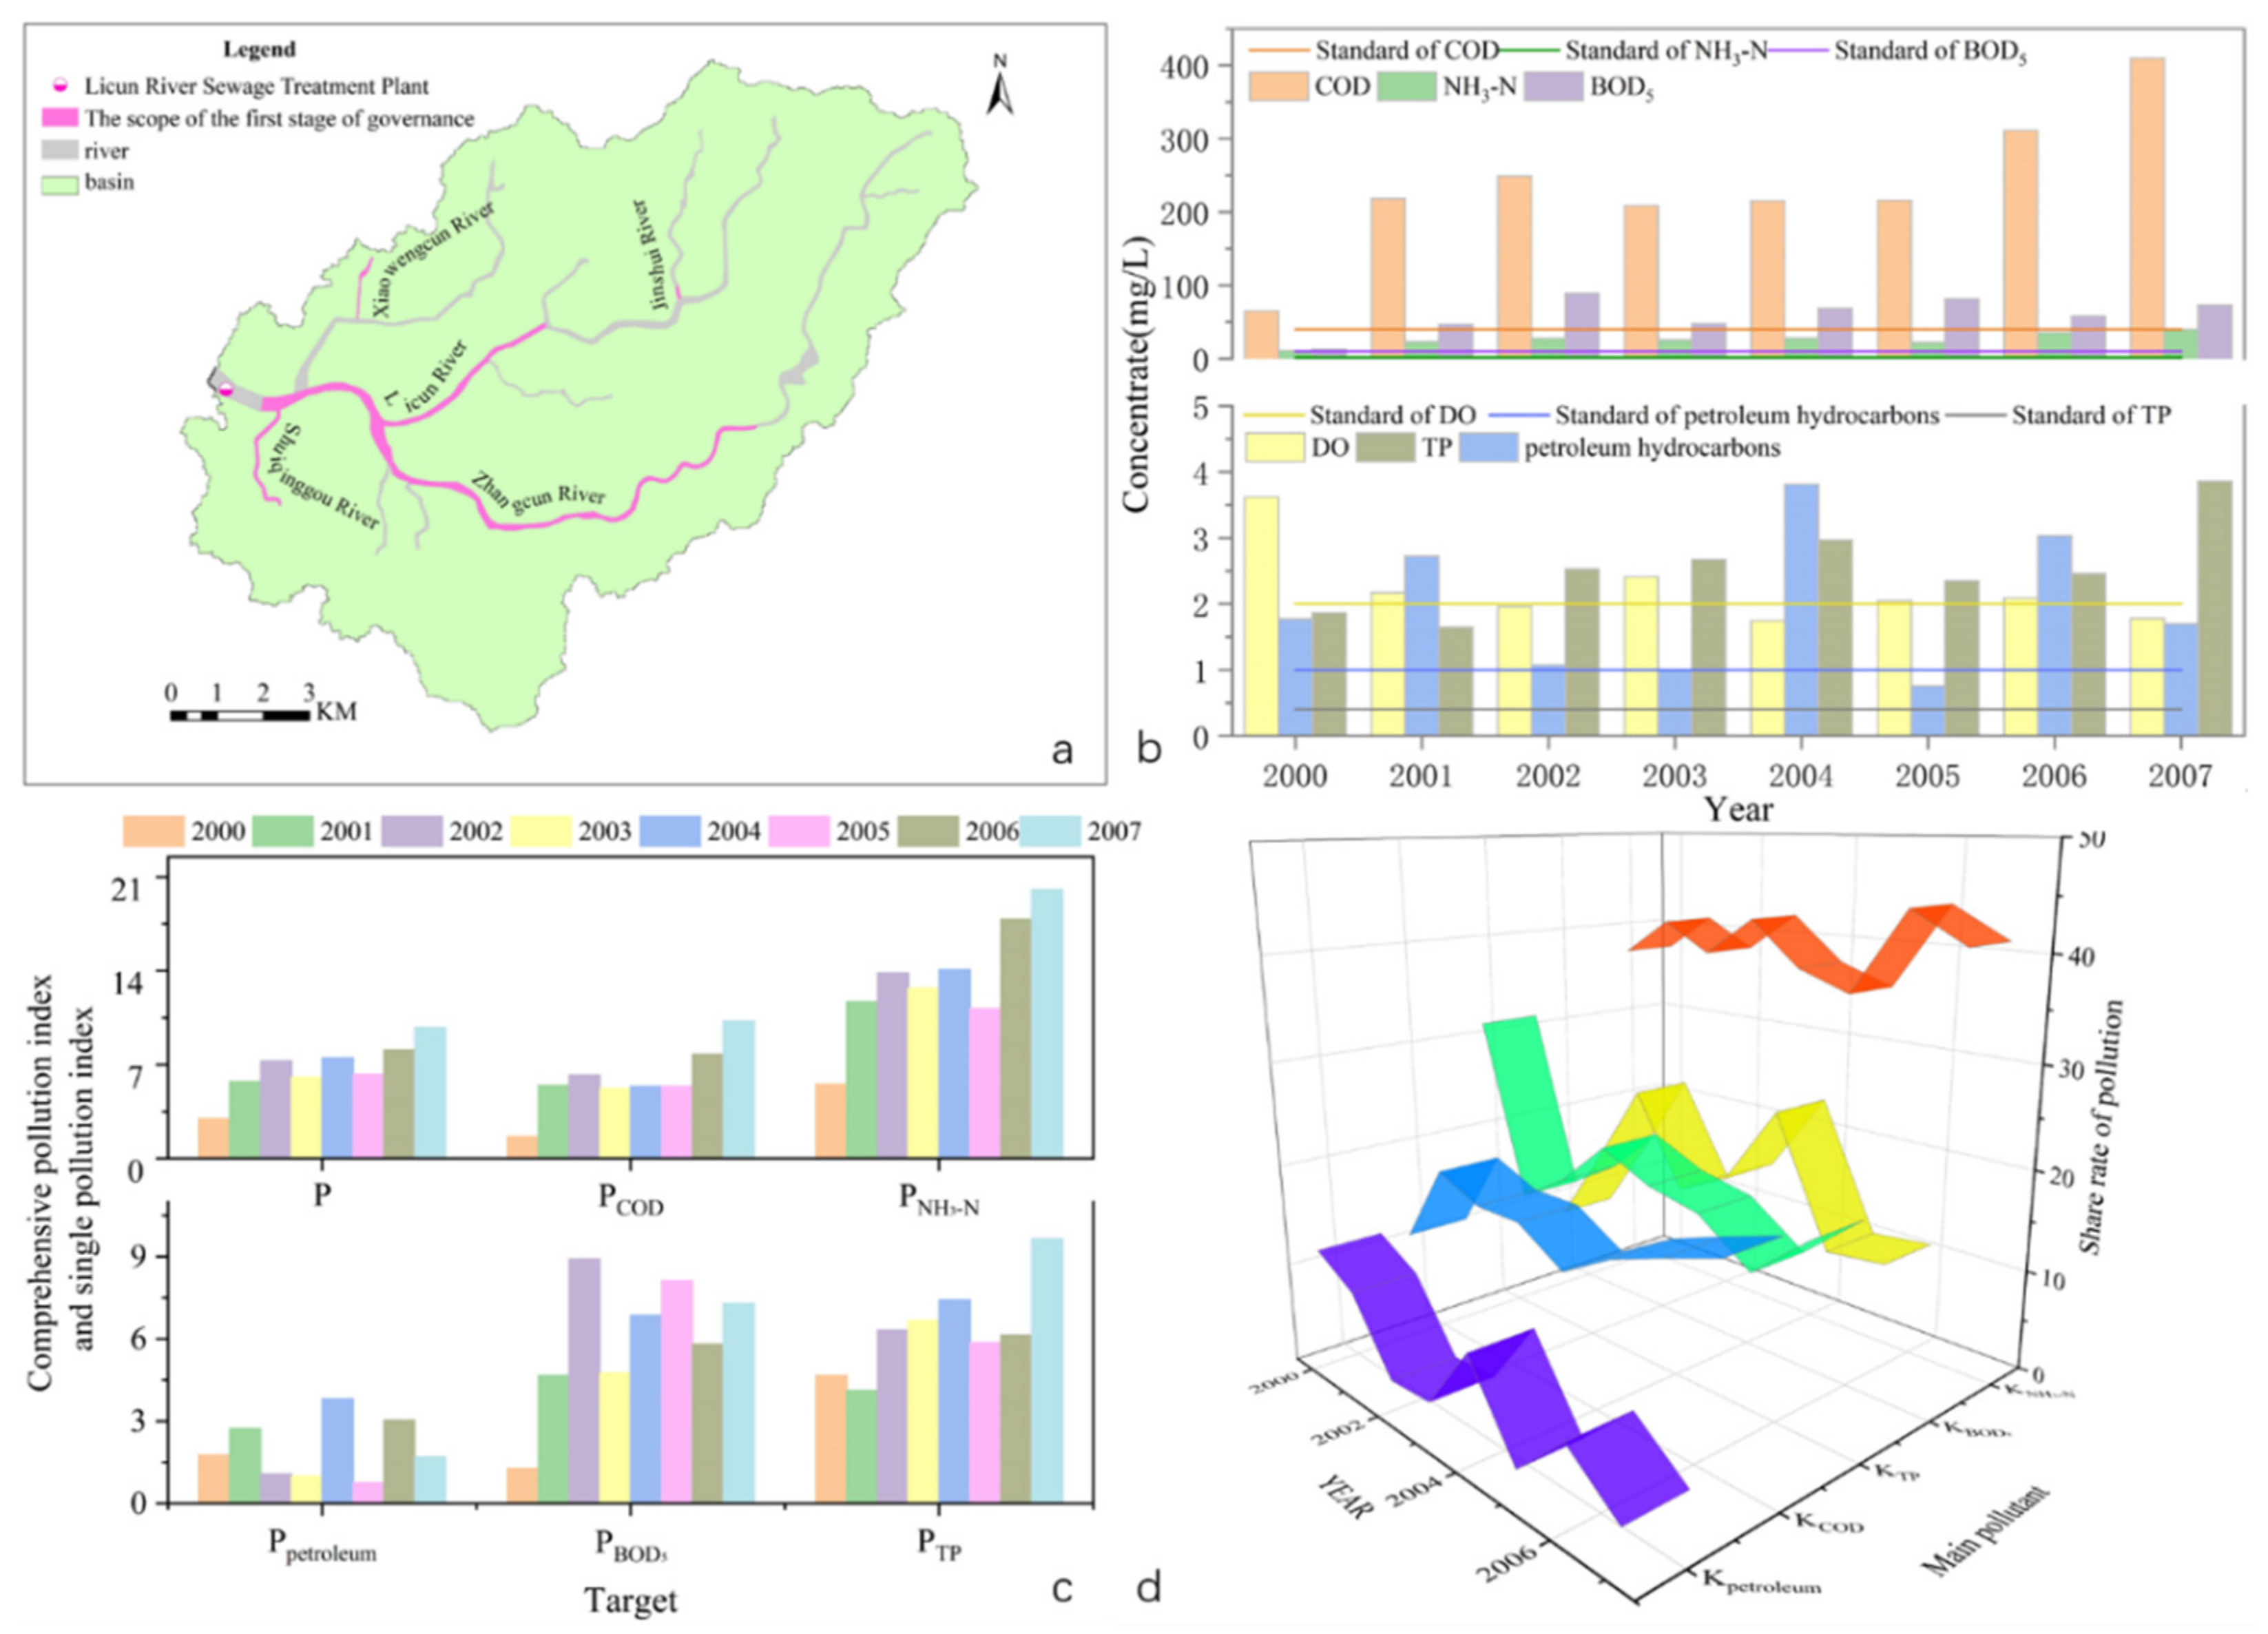
3.1. The First Stage of Governance (2000–2007)

3.1.1. Emphasis and Main Measures in the Governance

At the first stage, the control object is the watercourse, the control focus is flood control, and the interception of sewage is a supplementary control means. The treatment area includes the Licun River, the Zhangcun River, and large tributaries (Figure 2a). Greening measures were implemented in the Licun River and Zhangcun River (2001–2002). Flood control and bank protection measures were carried out in the Licun River, Zhangcun River, Jinshui River, Xiliuzhuang River, Xiaowengcun River, and Shuiqinggou River (2002–2004). Moreover, the sewerage and stormwater pipelines and interception projects were gradually implemented in the Licun River and Zhangcun River (2004–2006). The only sewage treatment facility in the basin is the Licun River Sewage Treatment Plant, which has a capacity of 80,000 t/d.

3.1.2. The Response of Water Quality and Pollution Indexes

The previous monitoring standard GHZB1-1999 did not include the TN monitoring, and the historical data were insufficient. Therefore, the TN was not analyzed in the first and second stages.
The variation of water quality (Figure 2b) shows a yearly decrease in DO and a significant increase in TP and COD. The volatility of NH3-N and BOD5 increases, and the fluctuation in petroleum hydrocarbons is dramatic. These indicators are seriously exceeded, resulting in the deterioration of water quality. Furthermore, the single pollution index and comprehensive pollution index of COD, NH3-N, and TP increase every year (Figure 2c), demonstrating the deterioration in water quality. The survey shows that the domestic sewage production of the basin is about 200,000 t/d and increasing every year, while the domestic sewage treatment capacity of the basin is only 80,000 t/d. Excessive domestic sewage that cannot be effectively treated is the biggest contributor to water pollution. Compared with 2000, industrial wastewater discharge decreased by about 15% in 2007, with a general trend of an increase followed by a decrease, explaining the rise and fall in petroleum hydrocarbons. At this stage, water quality improvement is ineffective, and the water quality tends to deteriorate with the development of population and economy.
In order to determine the impact of the above pollutants on the Licun River, their contribution rates from 2000 to 2007 were calculated (Figure 2d). The pollution contribution rates changed from KNH3-N (37.23%) > KTP (31.4%) > Kpetroleum hydrocarbons (11.91%) > KCOD (10.93%) > KBOD5 (8.52%) in 2000 to KNH3-N (40.96%) > KCOD (20.94%) > KTP (19.71%) > KBOD5 (14.91%) > Kpetroleum hydrocarbons (3.47%) in 2007. The pollution contribution rates of TP and petroleum hydrocarbons decreased, while those of NH3-N, COD, and BOD5 increased. The results show that industrial pollution is no longer the main pollution factor, while the proportion of domestic sewage in water pollution is rising. The gap between domestic sewage generation and treatment capacity also proves this result. Spearman’s rank correlation coefficient has been applied for quantitative analysis, with rs(DO) of −0.595, rs(COD) of 0.583, rs(NH3-N) of 0.5, rs(Petroleum oil) of −0.024, rs(TP) of 0.619, and rs(BOD5) of 0.524. The absolute values of the above correlation coefficients are smaller than WP, and the change is insignificant. From the perspective of water quality, the treatment effect at this stage is not significant, and the next step should emphasize the prevention and control of NH3-N and COD pollution.

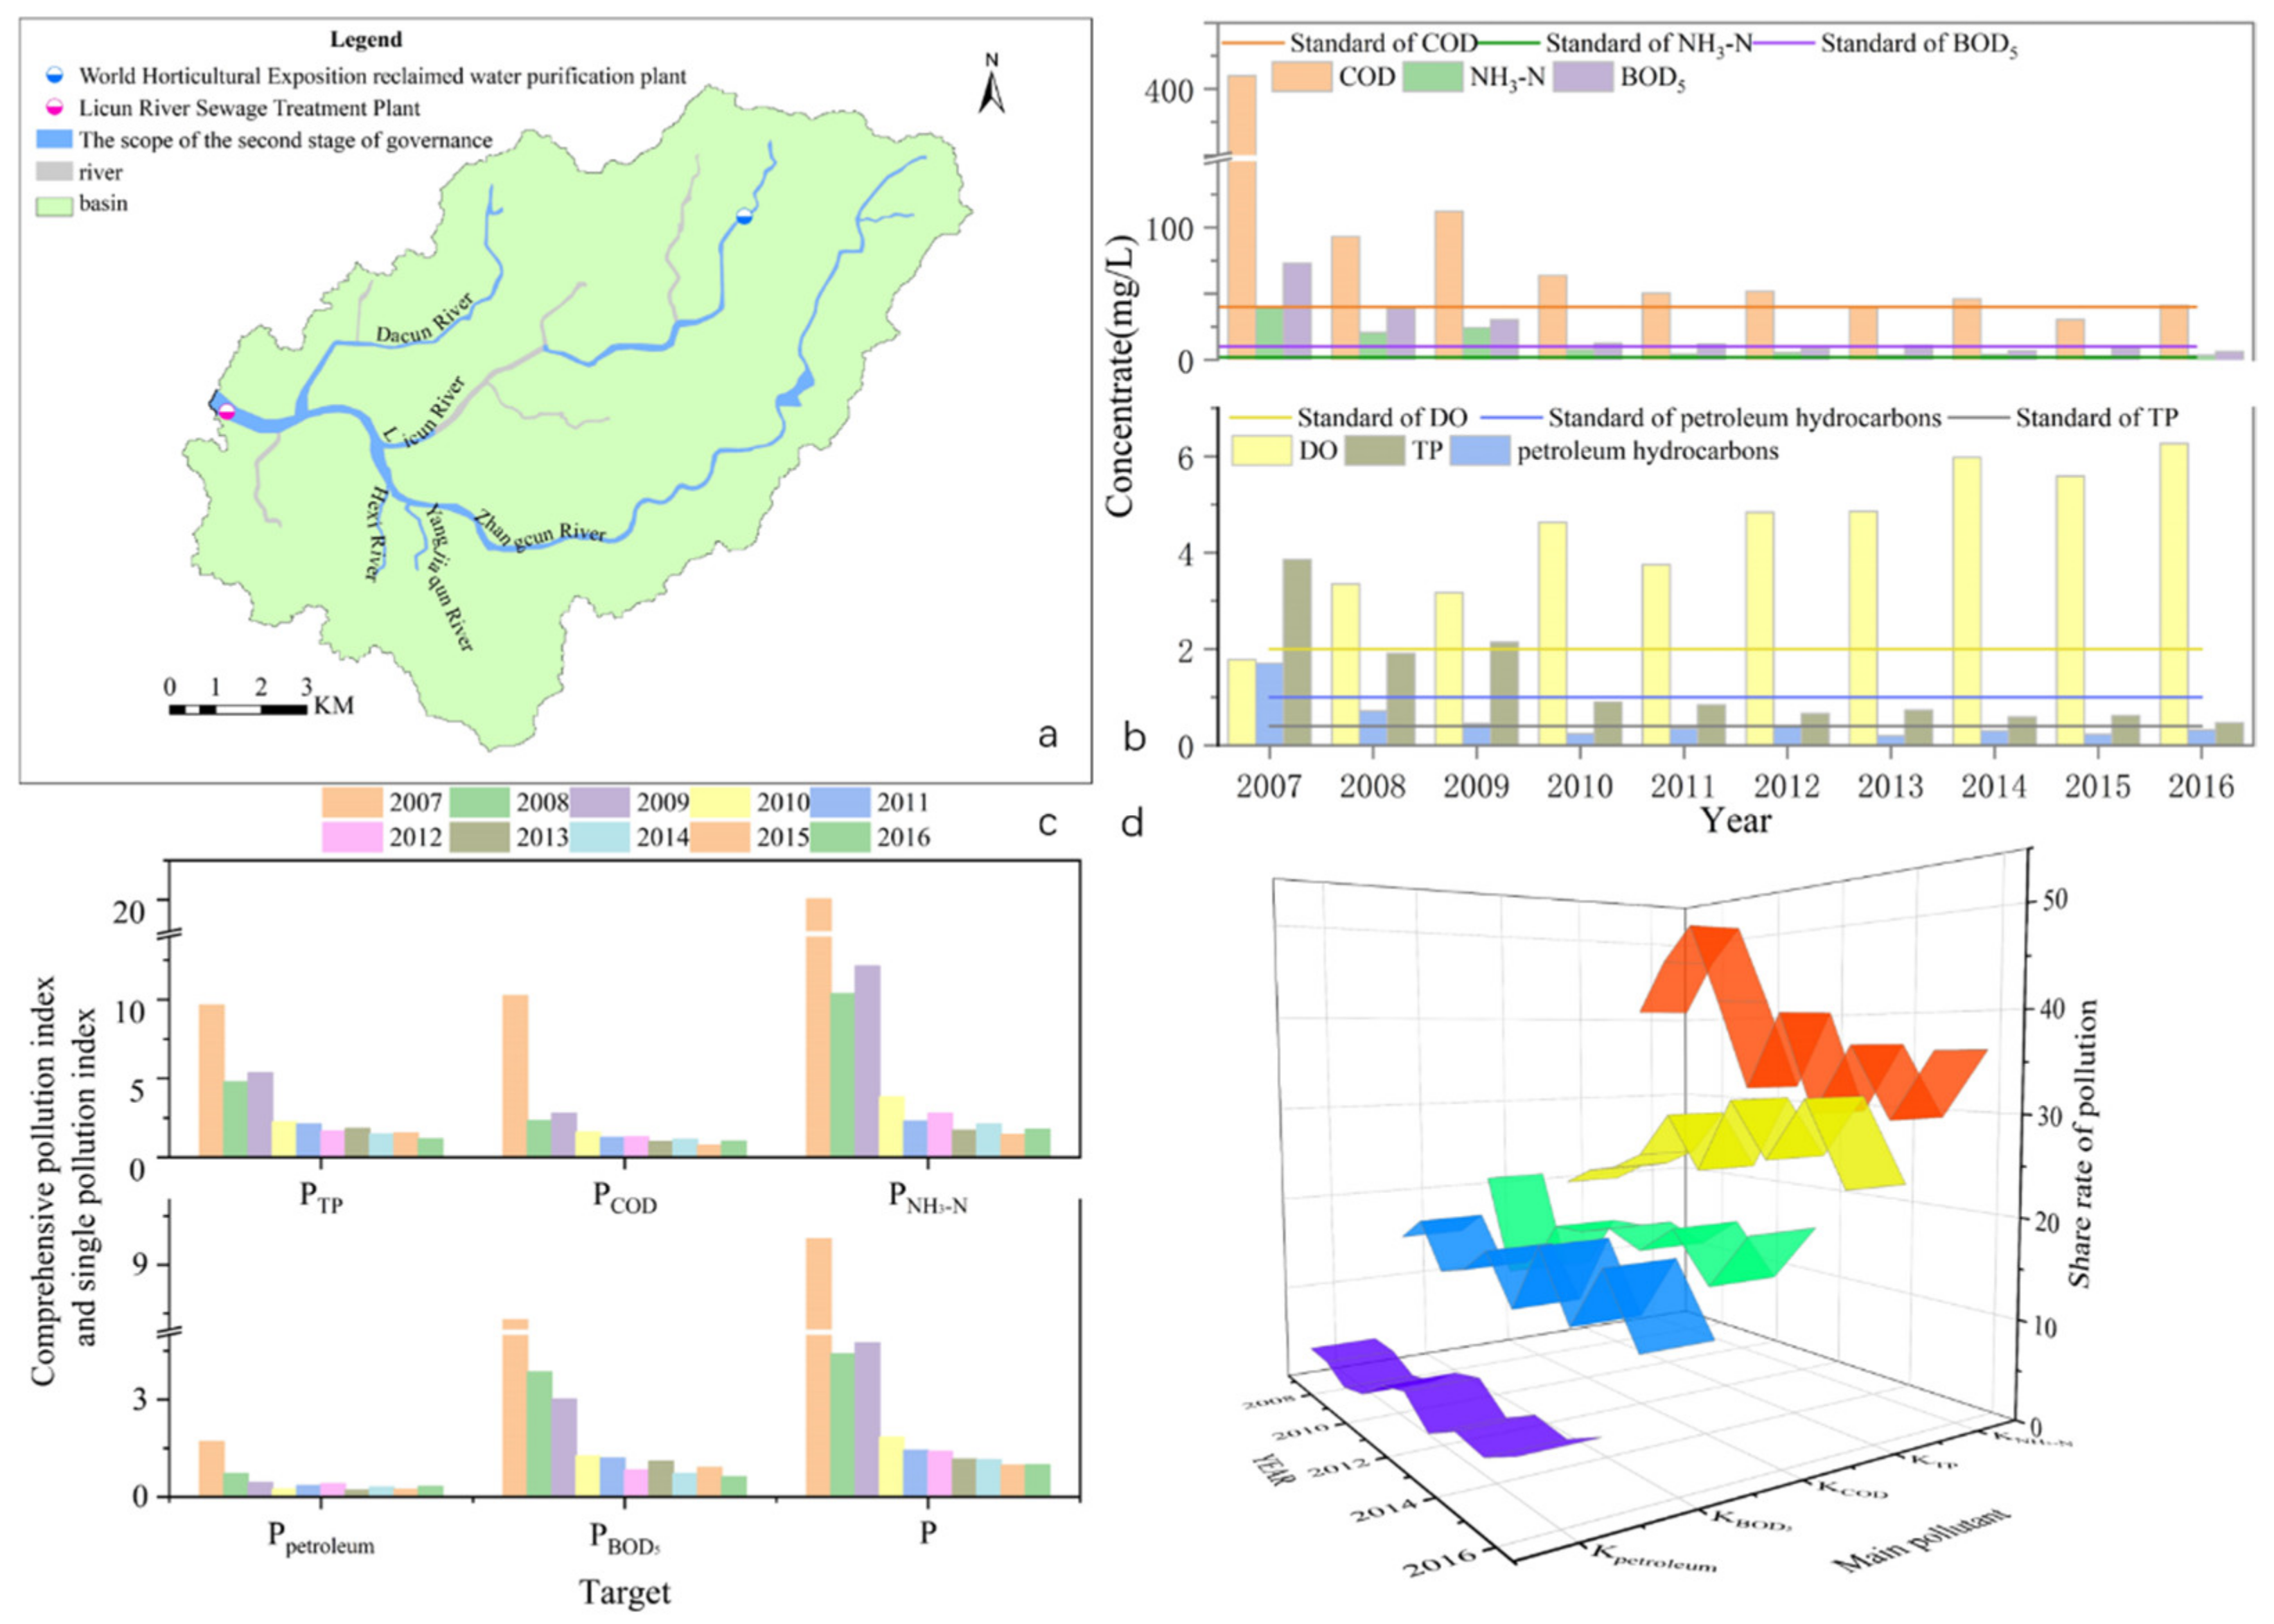
3.2. The Second Stage of Governance (2008–2016)

3.2.1. Emphasis and Main Measures in the Governance

At the second stage, the governance targets are the point source and watercourse, and the administrative region is the treatment unit. The main treatment measures aim to increase the basin sewage treatment capacity, intercept sewage, and control floods. The dredging of silt, water supply, and pipeline construction are supplementary means of governance. The scope of governance includes the Licun River, Zhangcun River, and large tributaries (Figure 3a). Bank protection, dredging, and flood control were performed in Licun River and Zhangcun River (2008–2009). Sewage interception and pipeline construction were implemented in Licun River and Zhangcun River, and water supply measures were implemented in the Zhangcun River (2010–2013). In addition, sewage interception and flood control measures were implemented in Yangjiaqun River, Dacun River, and Hexi River (2014–2016).
During this period, the sewage treatment capacity of the basin has changed greatly. The treatment capacity of the Licun River Sewage Treatment Plant has been increased to 250,000 t/d, and the drainage quality has been further improved. Furthermore, the World Ecological Exposition Reclaimed Water Purification Plant was added in 2014 with a treatment capacity of 6000 t/d, and the water was discharged into the upper reaches of the Licun River.

3.2.2. The Response of Water Quality and Pollution Indices

The trend (Figure 3b) of water quality shows that DO increases significantly after 2008, while other items experience fluctuating decreases. DO and petroleum hydrocarbons are stable and above standard. COD and BOD5 occasionally exceed the standard, while NH3-N and TP are consistently below the standard. Compared with the first stage, the water quality in the second stage has been improved dramatically and shows a tendency of yearly increase. The results indicate that the measures at the second stage have a positive effect on improving water quality. The downward trend in individual and comprehensive pollution indices also reflects the positive trend of water quality (Figure 3c).
The survey shows that the production of domestic sewage in the basin reached 300,000 t/d by 2016, while the sewage treatment capacity of the basin increased to 176,000 t/d. Compared with the first treatment stage, although the sewage treatment capacity still fell short of demand, the pollution caused by domestic sewage is significantly reduced, and the water quality is significantly improved. The discharge of industrial wastewater in the basin shows a downward trend in the first stage. Industrial wastewater discharges decreased by about 36% in 2016 relative to 2007, corresponding to the significant decrease in petroleum hydrocarbons.
In order to determine the impact of various pollutants on the Licun River during this stage, the contribution rates of various pollutants from 2008 to 2016 were calculated (Figure 3d). The contribution rate of pollution changed from KNH3-N (40.96%) > KCOD (20.94%) > KTP (19.71%) > KBOD5 (14.91%) > Kpetroleum hydrocarbons (3.47%) in 2007 to KNH3-N (36.19%) > KTP (23.89%) > KCOD (20.89%) > KBOD5 (12.52%) > Kpetroleum hydrocarbons (6.51%) in 2016. In addition, the contribution rate of NH3-N pollution decreases, while the contribution rates of TP and COD increase. The results suggest that petroleum hydrocarbons and BOD5 are no longer the main factors of current pollution, and the prevention and control of NH3-N and TP pollution should be emphasized in the next stage. Spearman’s rank correlation coefficient show that rs(DO) is 0.9636, rs(COD) is −0.9152, rs(NH3-N) is −0.9152, rs(Petroleum hydrocarbons) is −0.7212, rs(TP) is −0.9636, and rs(BOD5) is −0.9394. All correlation coefficients have absolute values greater than WP, indicating a positive trend. Moreover, the positive correlation coefficients of DO demonstrate an increasing trend, while the rest indicators with negative coefficients indicate a downward trend. The treatment effect is remarkable at this stage, and the water quality is improved. However, these measures cannot ensure that all the water quality indicators meet the standard.

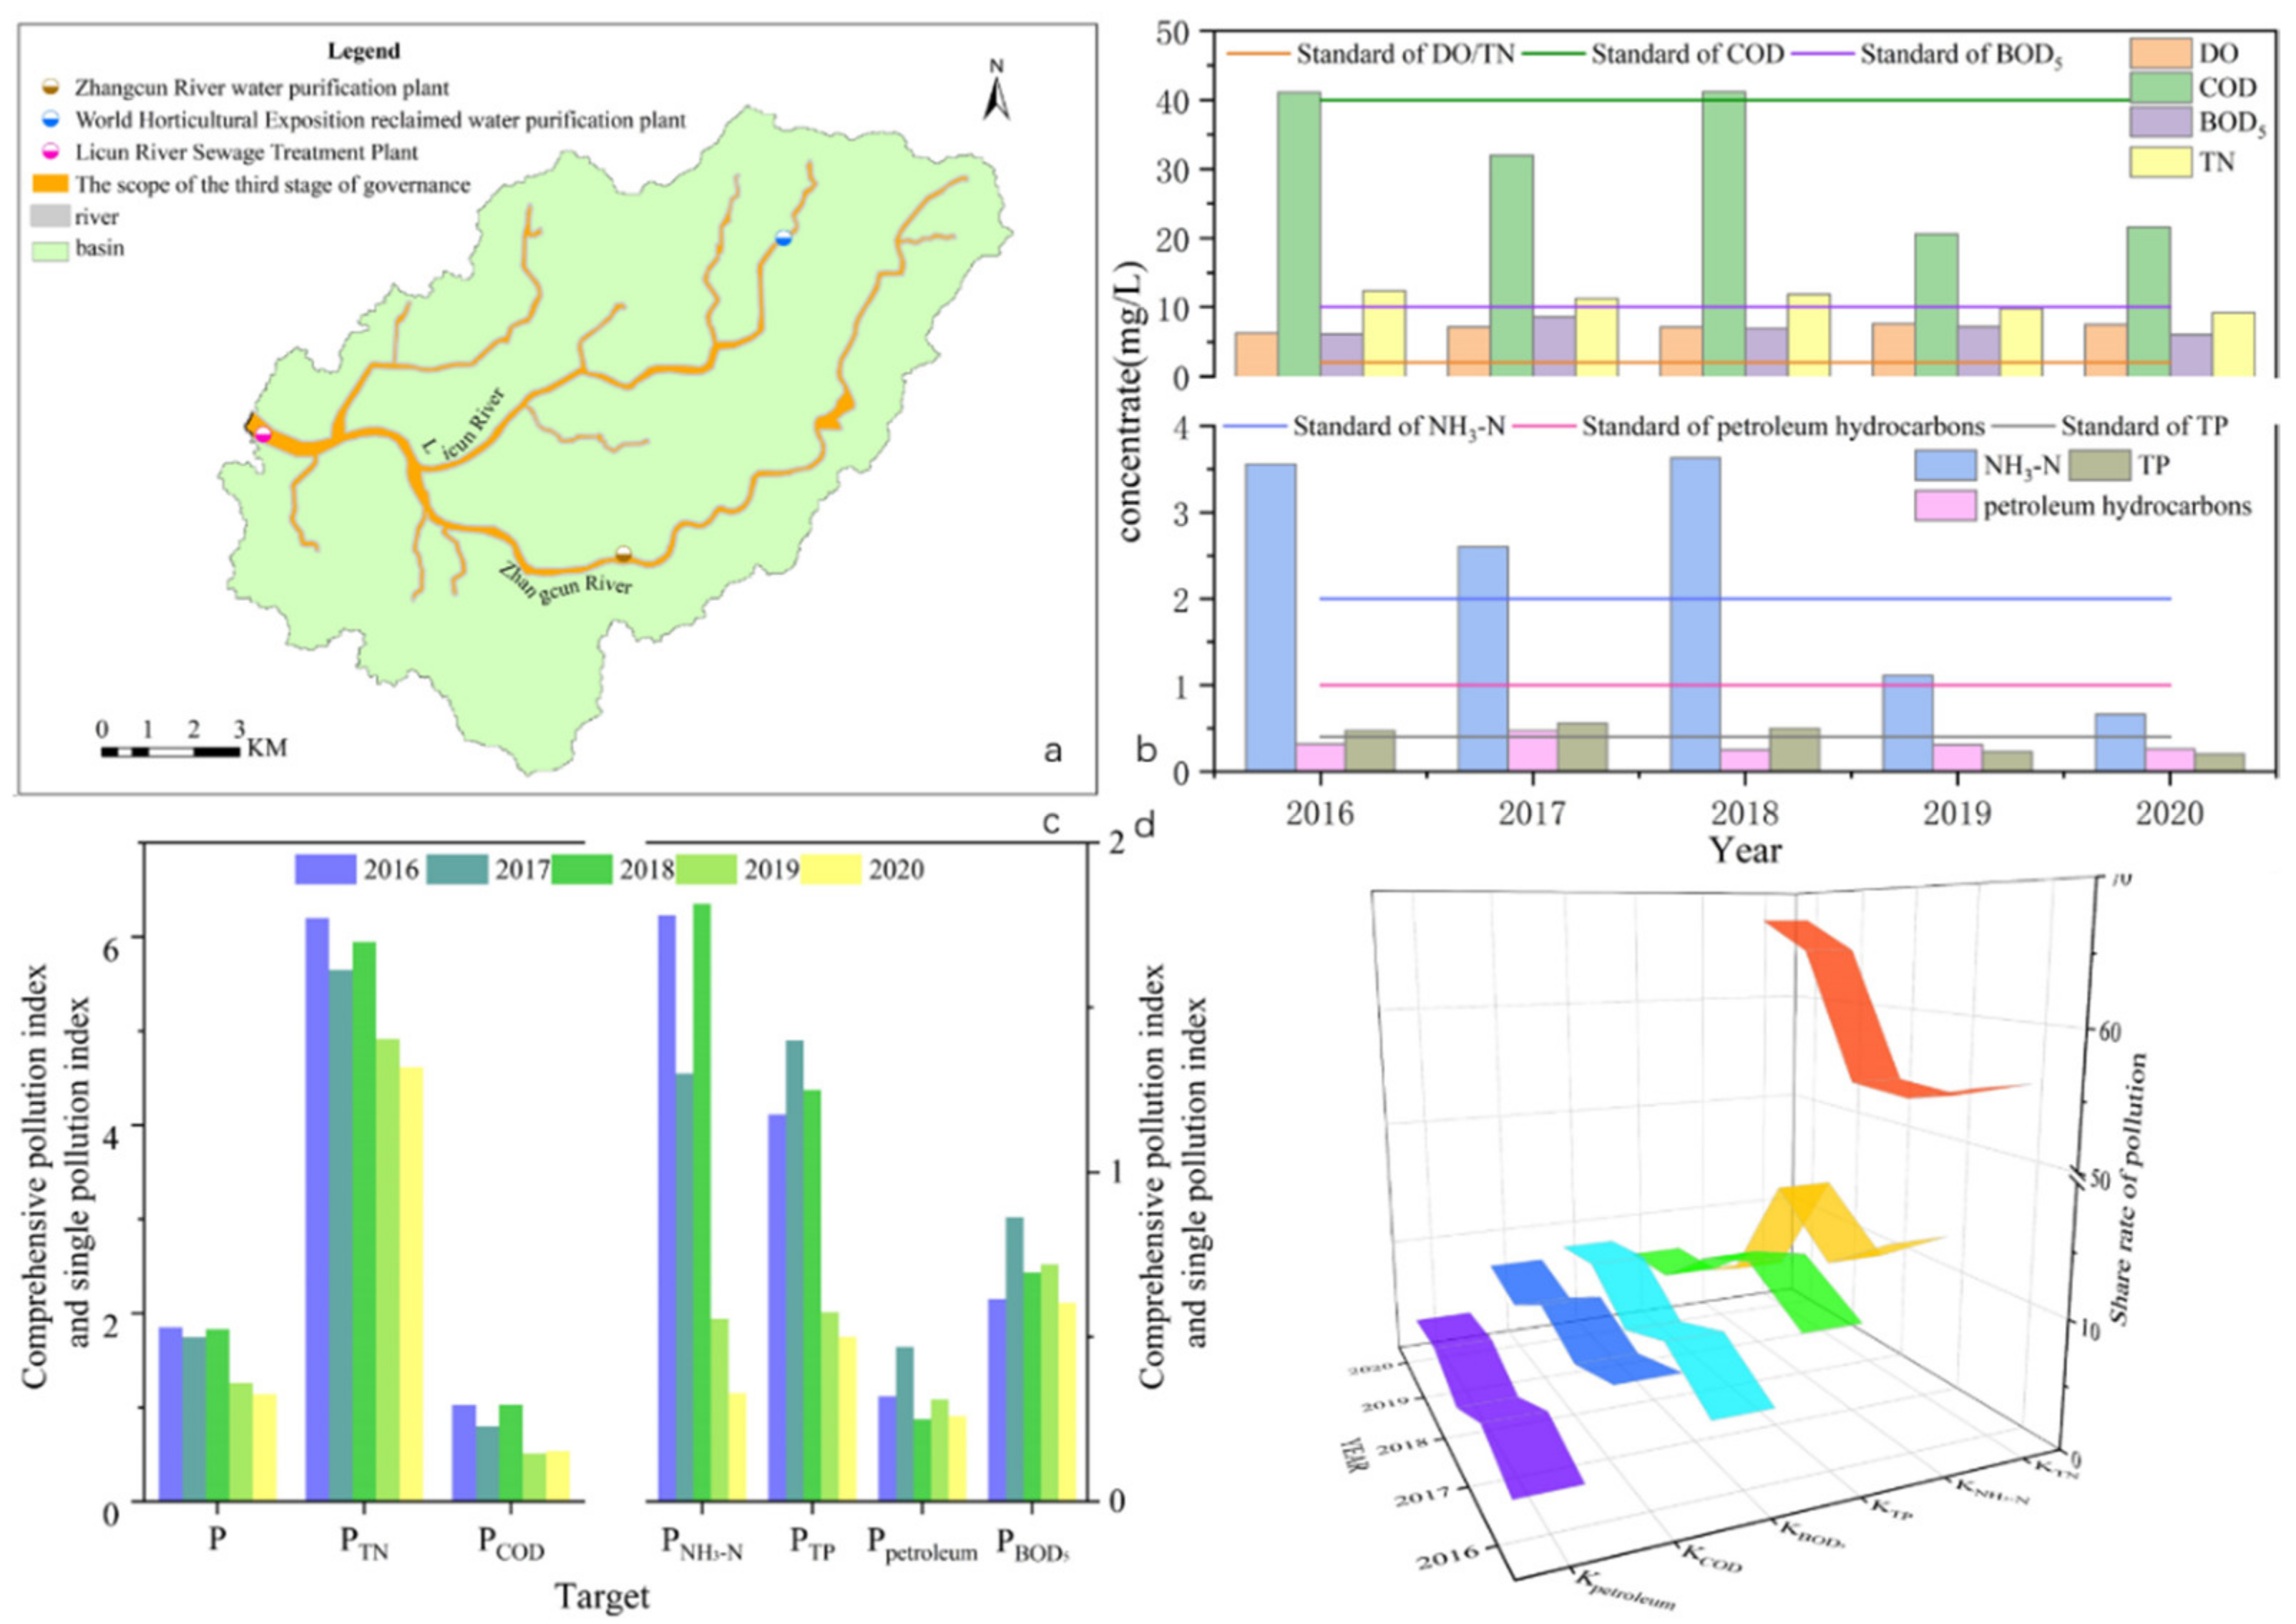
3.3. The Third Stage of Governance (2017–2020)

3.3.1. Emphasis and Main Measures in the Governance

In the third stage, the basin is treated as a whole. The governance areas are not divided by administrative regions and watercourses. In 2018, the Zhangcun River Water Purification Plant was completed with a sewage treatment capacity of 40,000 t/d, and the effluent quality was improved to Grade V of GB3838-2002. In 2019, the sewage treatment capacity of the Licun River Sewage Treatment Plant was increased to 300,000 t/d, and the effluent quality was improved to grade IV of GB3838-2002 and Grade A of GB 18918-2002.

3.3.2. The Response of Water Quality and Pollution Indices

The trend of water quality (Figure 4b) shows that COD and NH3-N fluctuate and decrease significantly from previous stages, while DO remains a stable increase. The remaining items fluctuate slightly and decrease. All items achieve the standard after 2018. Compared with the previous stage, the water quality is further improved, indicating that the new measures have additional positive effects. Both individual and composite pollution indices are decreased, reflecting the improvement in water quality (Figure 4c).
The previous analysis shows that NH3-N and TP contaminations need to be emphasized. As shown in Figure 4c, the pollution index of NH3-N and TP decreases the most during this stage. As of 2019, domestic sewage production in the basin has increased to 313,000 t/d, and sewage treatment capacity has also reached 296,000 t/d. Industrial wastewater discharges have also decreased by 16% from 2016. Domestic sewage production, sewage treatment capacity, and industrial wastewater discharges are key factors behind the significant decrease in the pollution index.
In order to quantify the pollution contribution of each pollutant, the pollution contribution rates from 2016 to 2020 were calculated (Figure 4d). The contribution rate of pollution changes from KTN (55.76%) > KNH3-N (16.01%) > KTP (10.57%) > KCOD (9.24%) > KBOD5 (5.54%) > Kpetroleum hydrocarbons (2.88%) in 2016 to KTN (67.38%) > KBOD5 (8.82%) > KCOD (7.88%) > KTP (7.3%) > KNH3-N (4.82%) > Kpetroleum hydrocarbons (3.8%) in 2020. The pollution contribution of TN increases, while that of NH3-N, TP, and COD decreases. Furthermore, the pollution contributions of BOD5 and petroleum hydrocarbons are stable. The above results indicate that TN, BOD5, and COD are the main pollution contributors. According to the analysis of water quality and standard limit value, BOD5 and COD are consistently higher than the standard limits. The increase in the pollutant contribution rates of both factors is due to the difference in the mathematical calculation caused by the sharp decrease of the pollutant contribution rates of TP and NH3-N. Therefore, treating TN pollution and preventing the rebound of TP and NH3-N pollution should be a priority in the future.
Spearman’s rank correlation coefficients for quantitative analysis are rs(DO) of 0.8, rs(COD) of −0.6, rs(NH3-N) of −0.7, rs(Petroleum oil) of −0.6, rs(TP) of −0.7, rs(BOD5) of −0.3, and rs(TN) of −0.9. The absolute value of the rank correlation coefficient of TN is greater than that of WP, indicating a significant change, while the negative coefficient indicates a downward trend. The absolute values of the rank correlation coefficients of other terms are less than WP, satisfying the standard limits with slight variation. The water quality of the Licun River basin has been further improved.

4. Potential Water Pollution Factors

4.1. The Contradiction between Sewage Collection and Treatment Capacity in Urban Development

Rapid economic development has led to a significant increase in domestic sewage production, and the domestic sewage treatment capacity is also improved. Therefore, the gap has been narrowed from 58.17% in 2000 to 5.54% in 2019. Despite the improvements in treating sewage water, the treatment capacity is still not sufficient to meet the needs of a growing population. Therefore, the Licun River Sewage Treatment Plant is selected for the following analysis.
The actual daily sewage inflow, the average daily theoretical sewage inflow and the daily design capacity of sewage treatment of the Licun River Sewage Treatment Plant are shown in Figure 5 (1 January 2012 to 31 December 2013 and 1 January 2017 to 31 December 2018). The variation in the actual daily inflow of sewage is seasonal with less in winter and more from June to October. The results show that the actual daily sewage inflow for both stages is higher than the daily design capacity of sewage treatment. The long-term high load operation of the sewage treatment plant cannot meet the current sewage treatment demand. For the normal operation of the sewage plant, the amount of sewage entering the facility is limited, resulting in the problem of high-water levels in the pipe network. In these two stages, the actual daily sewage inflow during the rainy season is higher than the average theoretical daily sewage inflow, indicating that a large amount of rainwater is intercepted into the sewage system by temporary sewage interception measures during the rainy season. If sewage treatment plants cannot manage the rapid increase in the volume of water caused by heavy rainfall, the sewage could overflow into the Licun River, resulting in additional problems. Figure 5 also shows that the daily design capacity of sewage treatment is gradually approaching the average theoretical daily sewage inflow. The number of days when the actual daily sewage inflow of the rainy season exceeds the average theoretical daily sewage inflow is decreasing. The results reflect that the third treatment stage can significantly improve water quality.

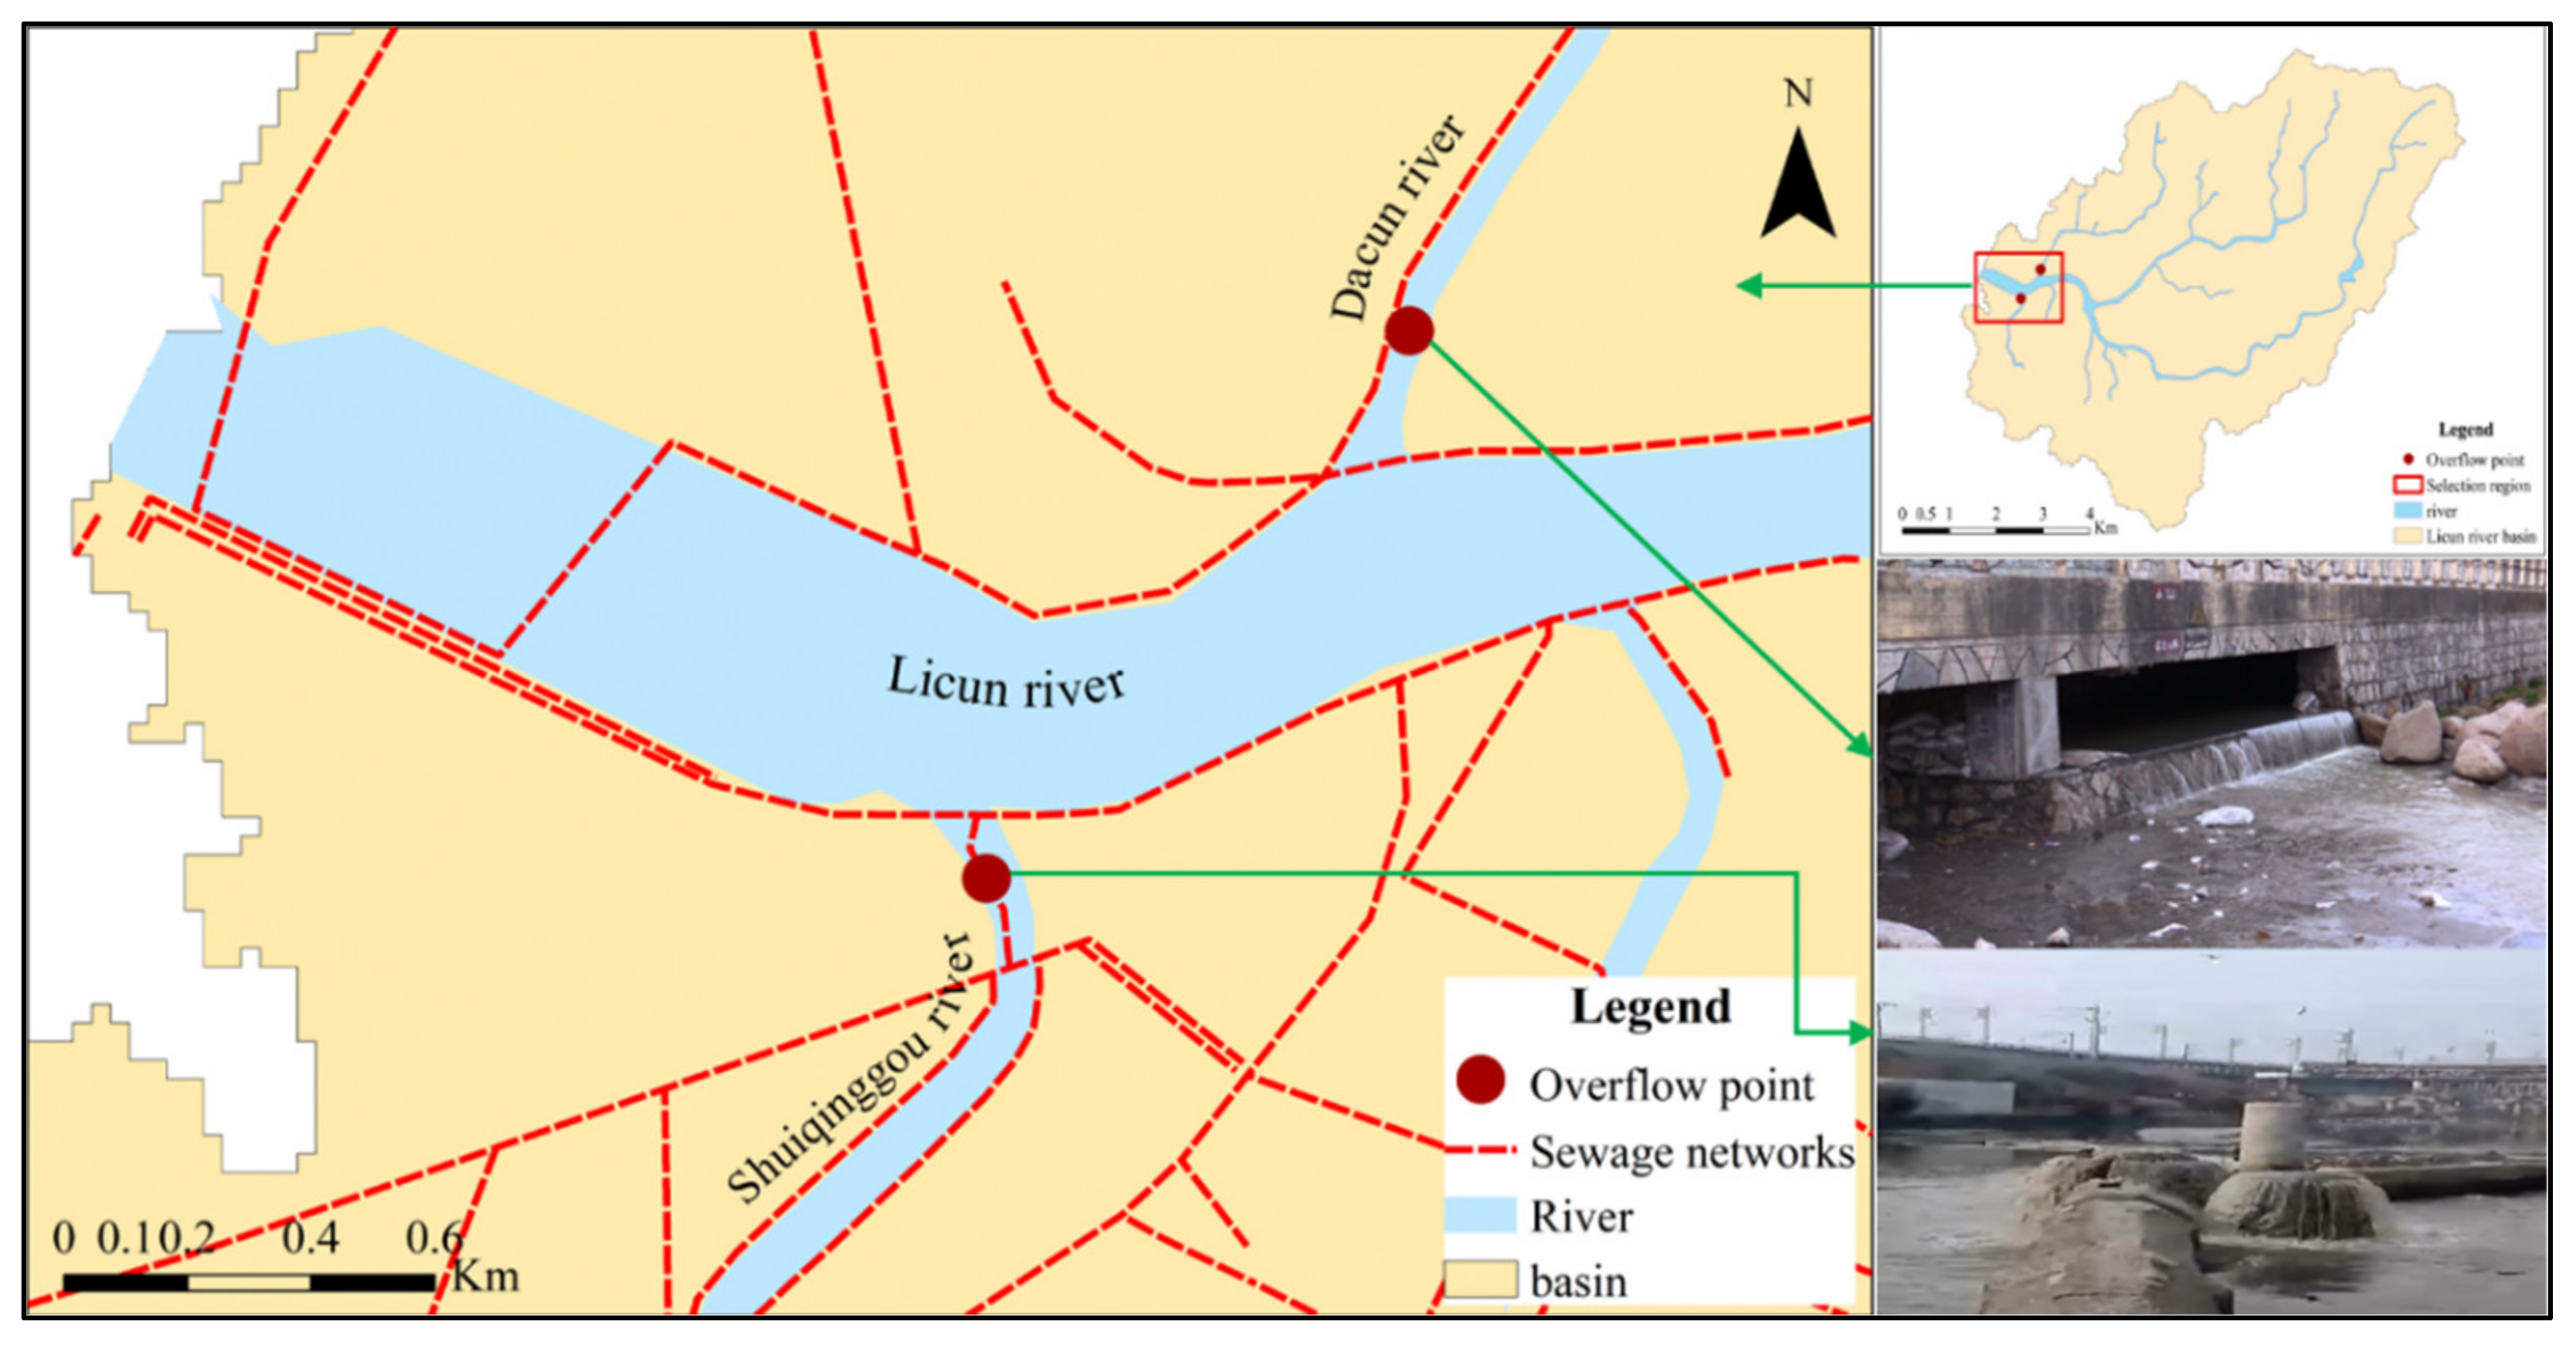
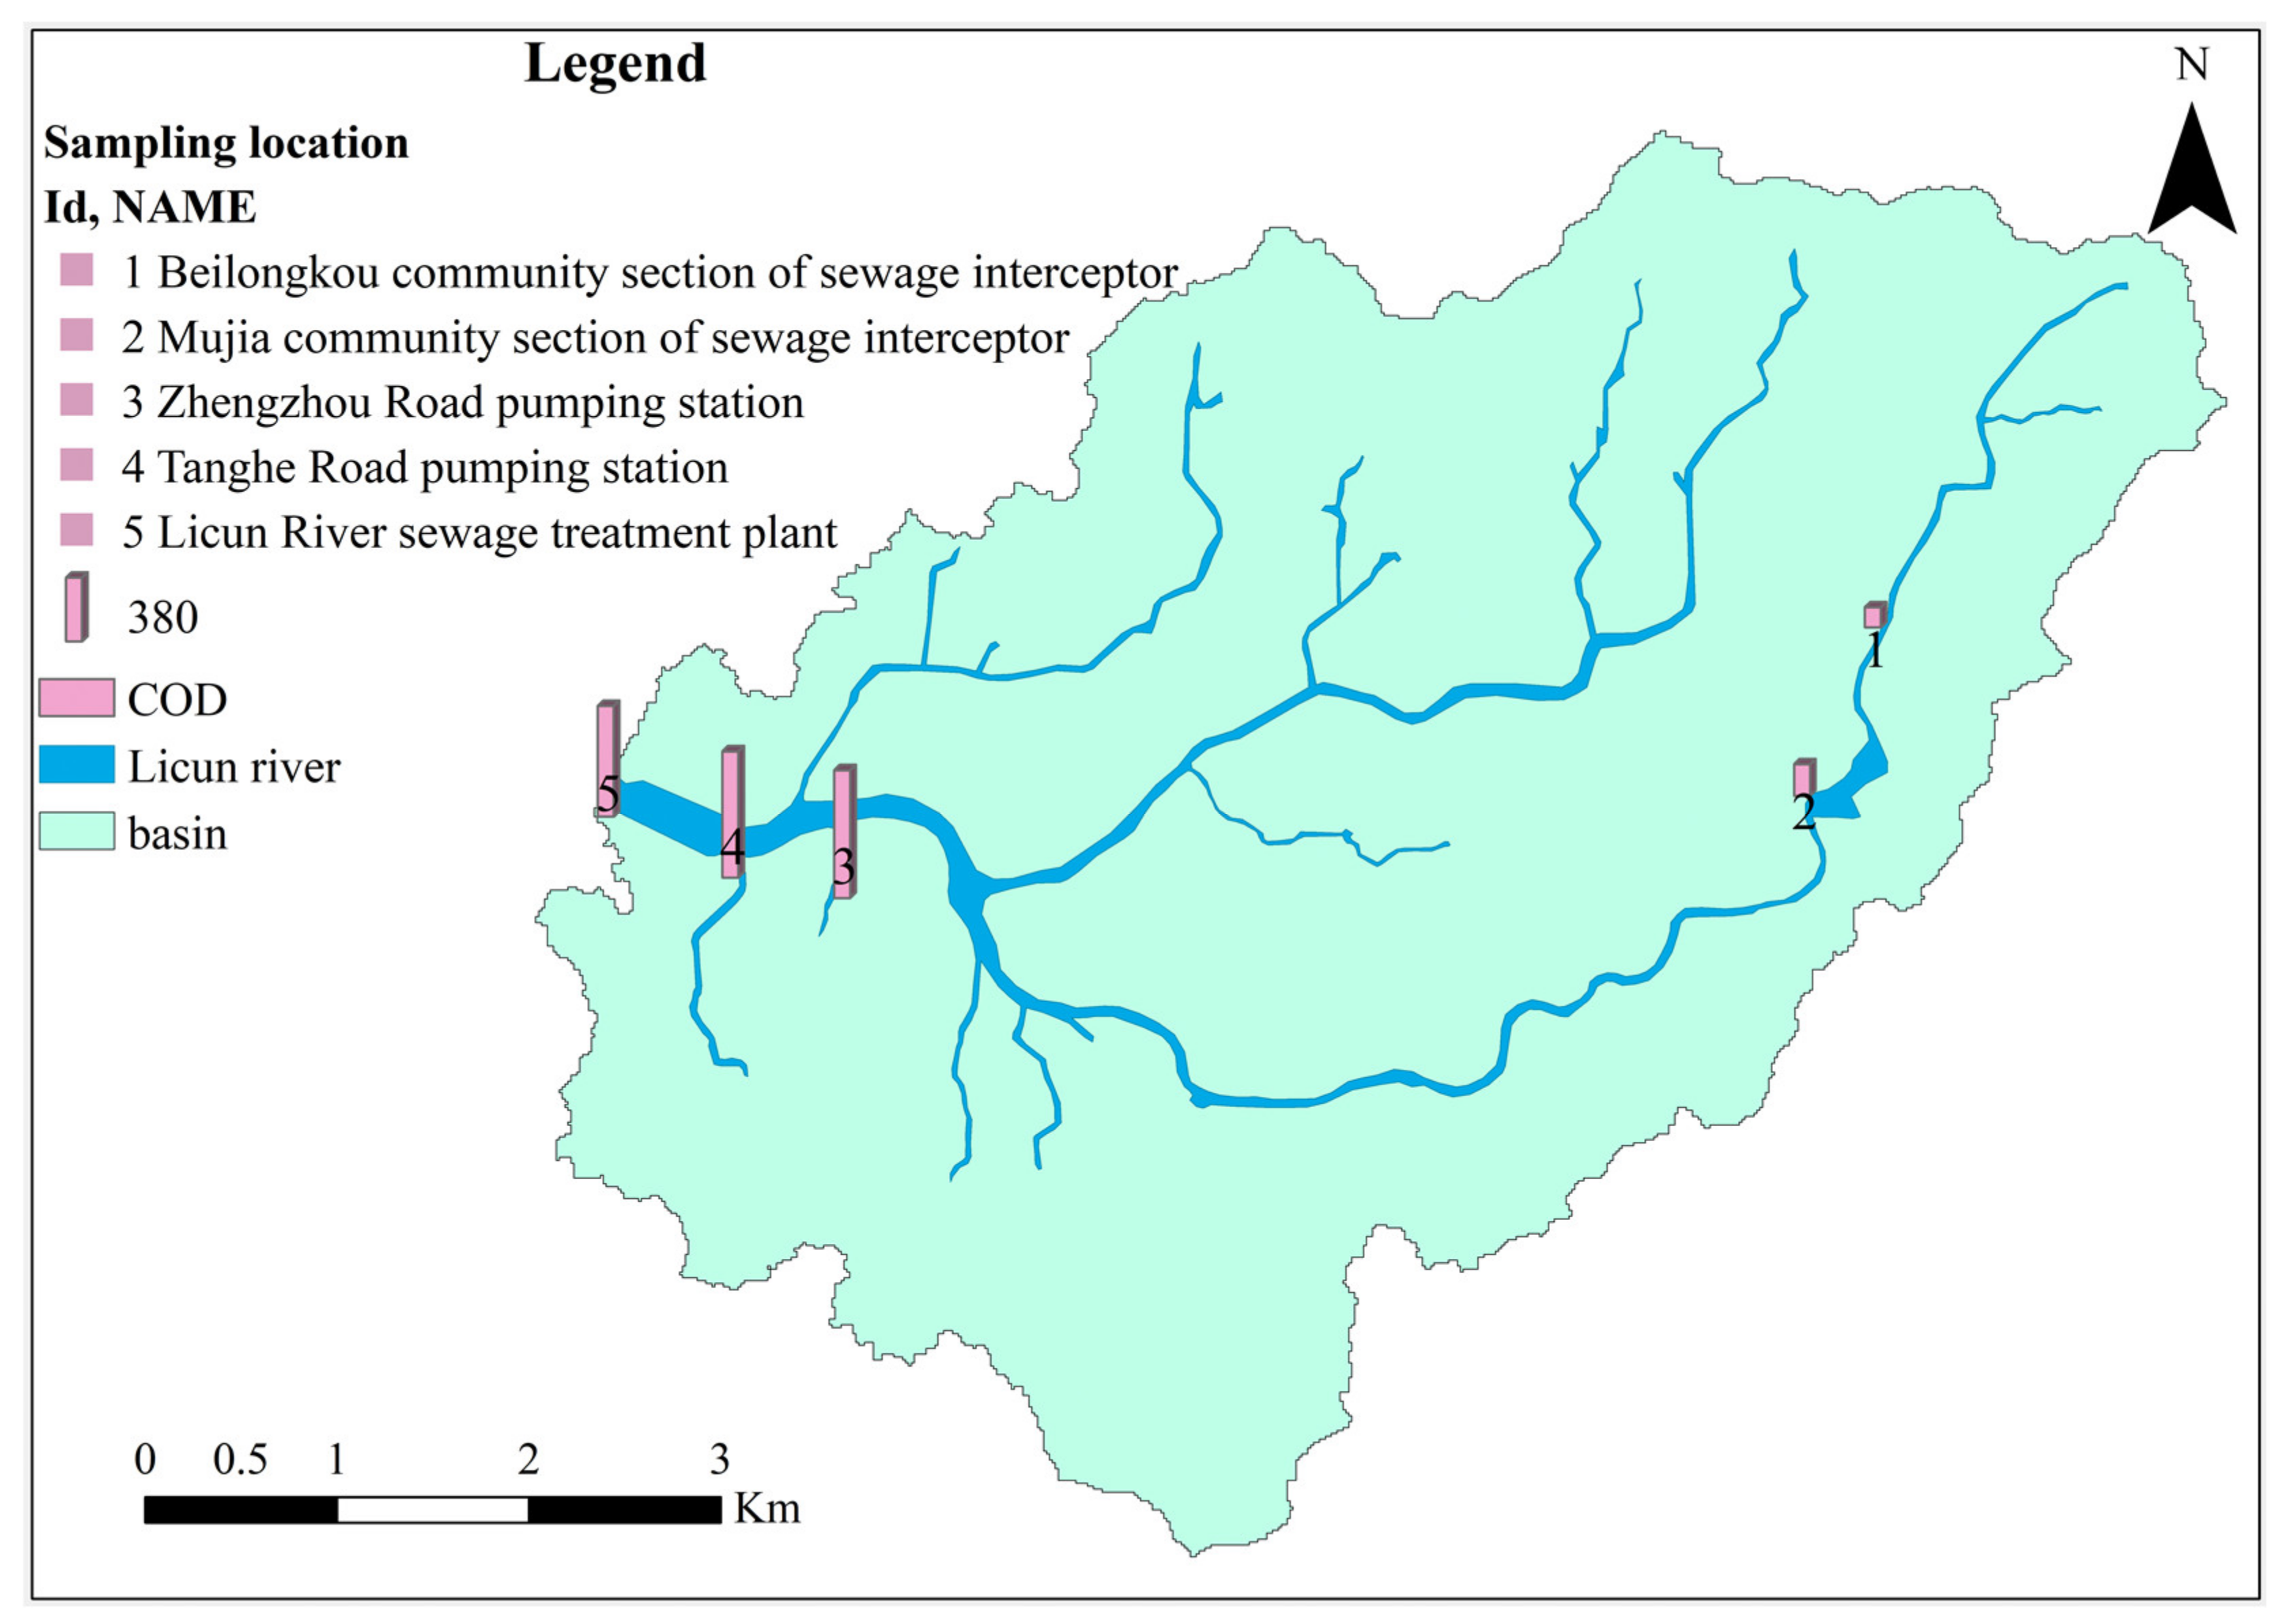
4.2. Point Source Pollution Caused by Pipe Network Problems

4.2.1. Pipeline Access Rate of Low Point Source

The construction of pipe networks has not matched the rapid development of urbanization. In the case of the Licun River downstream, the developed late with a rapid pace. The construction of drainage facilities is outdated, and the density of the pipe network is much lower than that of the upstream areas. The rapid development of the region has attracted many people. The population is dense along the river, and private sewage discharge is common. In addition, there are villages around this area. The drainage facilities of these villages are relatively poor, and these villages also hinder the implementation of drainage planning. All the above phenomena lead to inefficient sewage collection.

4.2.2. Risk of the Increased Number of Point Sources

Inadequate maintenance of drainage facilities, silting, blockage, or breakage of pipes can reduce the drainage capacity. Incoherent stormwater drainage systems, inadequate drainage systems, inconsistent design standards [19], unreasonable drainage design, and management negligence can lead to rainwater and sewage entering the same pipe, making it difficult to detect. Damaged or blocked temporary sewage treatment facilities can easily cause sewage overflow into river channels. These problems increase the point source [20], and the water quality significantly decreases after rain.
The overflow problem of the pipeline in the Licun River downstream is illustrated as follows. There are two overflow locations (Figure 6): the temporary sewage interception point at the Dacun River confluence and the sewage pipe inspection well at the Shuiqinggou River confluence. The results show that sewage overflow has remarkable regularity. When there is no rain, the overflow is greater in summer and autumn than in winter and spring and mostly at the peak of water use. In addition, the overflow continues until 2–3 days after the rainfall. The overflow decreases after the operation of the Zhangcun River Water Purification Plant, indicating that the improved efficiency of sewage collection is conducive to reducing the overflow of the pipe network.
The reasons for the overflow are as follows:
Firstly, the sewage volumes in the Shuiqinggou River and Dacun River basins in 2020 were about 8000 t/d and 32,000 t/d, respectively. The diameters of the sewage pipe in both river basins were DN800 and DN1000, respectively, and the slopes of the pipes were 0.1% and 0.15%, respectively. Furthermore, their corresponding maximum pipeline flows were 60,000 t/d and 73,000 t/d, respectively, which could fully meet the demand of the drainage basin. Secondly, the current sewage volumes on the south bank and north bank of Licun River are about 105,000 t/d and 145,000 t/d, respectively. Their corresponding pipe diameters are DN1500 and DN2000, respectively, and the pipeline gradients are 0.11%. The maximum flow rates of the two pipelines are 184,000 t/d and 396,000 t/d, respectively, which can also meet the demand for sewage discharge. The results show that the theoretical drainage capacity of the pipeline is sufficient, and the pipeline capacity is not the cause of overflow.
The imbalance between the sewage volume and the sewage treatment volume leads to the long-term high load operation of the Licun River Sewage Treatment Plant and the high-water level in sewage wells. The water level elevation in the sewage well in the Licun River Sewage Treatment Plant is 2.3–2.7 m during the peak period, while the lowest elevation in the inspection well in Shuiqinggou River is only 2.55 m, lower than that of the sewage well. Therefore, the sewage in the Shuiqinggou River pipe cannot enter the main pipe during the period, and the main pipe sewagecan return to the pipe of the Shuiqinggou River and overflow at its lowest point.
In the rainy season, the sewage concentration of the main pipeline on the south bank of the Licun River and the main pipeline of the north bank of the Zhangcun River were sampled and valuated (Figure 7). In addition, the variation of COD concentration was used as an illustration. The COD concentration of sewage at point 4 and point 3 of the main pipes on the south bank of the Licun River is close to 760 mg/L, equivalent to the actual COD concentration of domestic sewage in the basin. The COD concentration of point 2 and point 1 of the main pipes on the north bank of the Zhangcun River is about 150 mg/L, 80% lower than that of normal sewage. This result indicates that this part of sewage has been diluted about 5 times. The COD concentration in the influent pipe of the Licun River Sewage Treatment Plant (Point 5) is about 663 mg/L, which is also lower than that of point 3 and point 4. The results show that a large amount of rainwater, river water, or groundwater mistakenly enters the sewage pipe. The incoming water increases the volume and operational burden of the pipe, leading to sewage overflow. In addition, the concentration of sewage in the upstream pipe is low, but it still recovers in the downstream pipe, indicating that the effluent is also mixed with a high concentration of sewage during downstream transportation. In conclusion, the most important reason for overflow is the mixing of clean water with sewage.
Some other main sewage pipes are laid on revetment or riverbeds, which are easily damaged and difficult to maintain. This drainage system has no septic tank, the solid content of sewage is high, and the pipeline slope gradually decreases from upstream to downstream. Affected by the high-water level at the terminal, the flow rate from upstream to downstream gradually decreases, making the pipeline prone to clogging and silting, reducing the drainage capacity.

4.3. Water Shortage and Release of Silt Pollution

4.3.1. Water Shortage

The topography of the Licun River basin is high in the east, south, and north and low in the middle and west. In this context, wind speed, precipitation, and evaporation gradually decrease from west to east. This river basin is characterized by both temperate monsoon climate and maritime climate. Precipitation varies every year, and its seasonal distribution is uneven. Spring, summer, autumn, and winter rainfall account for 17%, 57%, 21%, and 5% of the annual rainfall, respectively. Moreover, the amount of water in the river varies significantly. In winter and spring, part of the river sometimes dries up. Water flow statistics of the Licun River in past years show that the water flow is 0 in spring and winter and 0.213–0.737 m3/s in summer and autumn. Therefore, the topography and climate are the main causes of water shortage in the river basin.
Domestic studies have concluded that a flow rate greater than 0.2 m/s can effectively prevent water eutrophication. Generally, a flow rate of 0.3 m/s is selected for to provide better habitat for aquatic organisms. According to the current situation of the Licun River, the slope of the downstream is about 1‰, the water depth is 0.5–1 m, the average width is 30 m, and the roughness is 0.04. The maximum monthly average daily evaporation is 5.6 mm/d, and the osmotic coefficient is 0.003 m/d. According to Zhang’s calculation [21] of ecological water demand of the Licun River by the R2-Cross method [22], the flow rate for achieving the basic ecological demand of the river is 3 m3/s [23]. Therefore, the water shortage in the Licun River weakens water flow, inevitably accelerating the deterioration of water quality.

4.3.2. Release of Silt Pollution

Small flows of water promote silting. Silt contains many oxygen-consuming organic pollutants, nitrogen, phosphorus, and other pollutants [24]. These pollutants are released into water under certain conditions, consuming a large amount of dissolved oxygen and creating conditions for water quality deterioration. The survey shows that the silt depth of the Licun River basin is 0.5–1 m upstream and 1–1.5 m downstream. The release rates of COD, NH3-N, TN, and TP pollutants in silt are 15 mg/m2•d, 8 mg/m2•d, 12 mg/m2•d, and 5 mg/m2•d, respectively [25]. Zhang [21] calculated that the pollutants of COD, NH3-N, TN, and TP in the silt of the Licun River basin are 8.03 t/a, 4.29 t/a, 6.44 t/a, and 2.68 t/a, respectively. With the gradual control of exogenous pollution, the release of silt pollutants can have an increasingly negative impact on water quality. Since there is a dynamic balance in the absorption and release between silt and river water [26], the concentration of silt pollutants is proportional to the concentration of water pollution. Once the concentration of pollutants in the river water decreases, the release of pollutants in silt will increase, causing secondary pollution to the river.

4.4. Non-Point Source Pollution

Rainfall erodes the atmosphere, roads, urban buildings, and soils. It carries pollutants into rivers through surface runoff, thus causing pollution [27]. With the further control of point source pollution, non-point source pollution is gradually emerging, becoming one of the important reasons for unstable and unqualified water quality. The non-point source pollution in the Licun River basin primarily comes from the initial rainwater. In some areas, the concentration of pollutants in the initial rainwater exceeds that of domestic sewage. There is no effective collection and treatment system for the initial rainwater in the Licun River basin, which directly enters the river and deteriorates the water quality. Most basin areas are built-up with hard underlying surfaces, large runoff coefficients, short flow-producing times, small infiltration, and strong pollutant carrying capacity, which should be given special attention. According to Zhang [21], the non-point source pollution of COD, NH3-N, TN, and TP caused by initial rainwater in the Licun River basin is 1983.14 t/a, 30.32 t/a, 159.68 t/a, and 4.67 t/a, respectively.

5. Conclusions

The river treatment is divided into three stages according to different measures: The first stage (2000–2007) focuses on river course and flood control; the second stage (2008–2016) focuses on point source, pollution interception, and the construction of sewage treatment facilities; the third stage (2017–2020) focuses on the river basin, diversion of rain and sewage water, dredging, and water replenishment. In the first stage, the water quality improvement is not satisfactory, and there is even a trend of water quality deterioration, where NH3-N and COD have the highest contribution to pollution. In contrast, water quality has been improved in the second stage, with NH3-N and TP contributing the most to pollution. In the third stage, water quality is further improved, and all water quality indices are within the standard limits. TN has the highest pollution contribution rate in this stage. Therefore, the future river pollution factors are the contradiction of the sewage system, point source pollution caused by pipe network problems, water shortage, silt pollution, and non-point source pollution.

Author Contributions

M.Z.: Conceptualization, data curation, formal analysis, methodology, software, validation, visualization, writing—original draft, writing—review and editing; L.W.: funding acquisition, project administration, resources, review and editing; X.H.: investigation, project administration, supervision, review and editing; X.Z.: review and editing. All authors have read and agreed to the published version of the manuscript.

Funding

This work was supported by the National Key Research and Development Program of China [NO.2018YFC0408000,2018YFC0408004] and the Jinan Water Science and Technology Project [JNSWKJ202103].

Informed Consent Statement

The data that support the findings of this study are available from [Qingdao Ecological Environment Bureau], but restrictions apply to the availability of these data, which were used under license for the current study and are thus not publicly available. Data are, however, available from the authors upon reasonable request and with permission of [Qingdao Ecological Environment Bureau].

Acknowledgments

The authors would like to thank Qingdao Municipal Bureau of Ecology and Environment for providing the historical data.

Conflicts of Interest

The authors declare no conflict of interest.

Appendix A

Table A1. Comparison of critical values of rank correlation coefficient test.
N-2WP
Significance Level (One-Sided Test) 0.05Significance Level (One-Sided Test) 0.1
10.99690.9877
20.95000.9000
30.87830.8054
40.81140.7293
50.74450.6694
60.70670.6215
70.66640.5822
80.63190.5494
Table A2. Reference value of pollutant load for a rainfall runoff event and area of underlying surface.
Underlying Surface TypeCODNH3-NTPArea
Pavement2001.66 0.21 30.32
Green space360.43 0.20 15.73
Roof400.55 0.12 21.83

References

  1. Gilvear, D.J.; Spray, C.J.; Casas-Mulet, R. River rehabilitation for the delivery of multiple ecosystem services at the river network scale. J. Environ. Manag. 2013, 126, 30–43. [Google Scholar] [CrossRef] [PubMed]
  2. Palmer, M.A.; Hondula, K.L.; Koch, B.J. Ecological Restoration of Streams and Rivers: Shifting Strategies and Shifting Goals. Annu. Rev. Ecol. Evol. Syst. 2014, 45, 247–269. [Google Scholar] [CrossRef] [Green Version]
  3. Bu, H.; Tan, R.; Li, R.; Zhang, R. Temporal and spatial variations of water quality in the Jinshui River of the South Qinling Mts., China. Ecotoxicol. Environ. Saf. 2010, 73, 907–913. [Google Scholar] [CrossRef] [PubMed]
  4. Huang, J.L.; Ho, M.H.; Du, P.F. Assessment of temporal and spatial variation of coastal water quality and source identification along Macau peninsula. Stoch. Environ. Res. Risk Assess. 2011, 25, 353–361. [Google Scholar] [CrossRef]
  5. Fan, X.; Cui, B.; Zhao, H.; Zhang, Z.; Zhang, H. Assessment of river water quality in Pearl River Delta using multivariate statistical techniques. Procedia Environ. Sci. 2010, 2, 1220–1234. [Google Scholar] [CrossRef] [Green Version]
  6. Gilvear, D.J.; Casas-Mulet, R.; Spray, C.J. Trends and issues in delivery of integrated catchment scale river restoration: Lessons learned from a national river restoration survey within Scotland. River Res. Appl. 2012, 28, 234–246. [Google Scholar] [CrossRef]
  7. Chang, H. Spatial and Temporal Variations of Water Quality in the Han River and Its Tributaries, Seoul, Korea, 1993–2002. Water Air Soil Pollut. 2005, 161, 267–284. [Google Scholar] [CrossRef]
  8. Kazi, T.G.; Arain, M.B.; Jamali, M.K.; Jalbani, N.; Afridi, H.I.; Sarfraz, R.A.; Baig, J.A.; Shah, A.Q. Assessment of water quality of polluted lake using multivariate statistical techniques: A case study. Ecotoxicol. Environ. Saf. 2009, 72, 301–309. [Google Scholar] [CrossRef]
  9. Spring, U.O. Aquatic systems and water security in the Metropolitan Valley of Mexico City. Curr. Opin. Environ. Sustain. 2011, 3, 497–505. [Google Scholar] [CrossRef]
  10. Ghadouani, A.; Coggins, L.X. Science, technology and policy for Water Pollution Control at the Watershed Scale: Current issues and future challenges. Phys. Chem. Earth 2011, 36, 335–341. [Google Scholar] [CrossRef]
  11. Nikolaidis, N.P. Comprehensive Water Quality and Purification; Elsevier: Amsterdam, The Netherlands, 2014; pp. 230–250. [Google Scholar]
  12. Bogardi, J.J.; Dudgeon, D.; Lawford, R.; Flinkerbusch, E.; Vrsmarty, C. Water security for a planet under pressure: Interconnected challenges of a changing world call for sustainable solutions. Curr. Opin. Environ. Sustain. 2012, 4, 35–43. [Google Scholar] [CrossRef]
  13. Romero, E.; Le Gendre, R.; Garnier, J.; Billen, G.; Fisson, C.; Silvestre, M.; Riou, P. Long-term water quality in the lower Seine: Lessons learned over 4 decades of monitoring. Environ. Sci. Policy 2016, 58, 141–154. [Google Scholar] [CrossRef] [Green Version]
  14. Havinga, H. Towards Sustainable River Management of the Dutch Rhine River. Water 2020, 12, 1827. [Google Scholar] [CrossRef]
  15. Liu, J.S.; Guo, L.C.; Luo, X.L.; Chen, F.R.; Zeng, E.Y. Impact of anthropogenic activities on urban stream water quality: A case study in Guangzhou, China. Environ. Sci. Pollut. Res. 2014, 21, 13412–13419. [Google Scholar] [CrossRef] [Green Version]
  16. Singh, K.P.; Malik, A.; Sinha, S. Water quality assessment and apportionment of pollution sources of Gomti river (India) using multivariate statistical techniques—A case study. Anal. Chim. Acta 2005, 538, 355–374. [Google Scholar] [CrossRef]
  17. Miller, A. The United Nations World Water Development Report 3. Chin. J. Reparative Reconstr. Surg. 2009, 23, 1241–1245. [Google Scholar]
  18. Pei, Y.; Zuo, H.; Luan, Z.; Gao, S. Rehabilitation and improvement of Guilin urban water environment: Function-oriented management. J. Environ. Sci. 2013, 25, 1477–1482. [Google Scholar] [CrossRef]
  19. Moglia, M.; Sharma, A.K.; Maheepala, S. Multi-criteria decision assessments using Subjective Logic: Methodology and the case of urban water strategies. J. Hydrol. 2012, 452, 180–189. [Google Scholar] [CrossRef]
  20. Garnier, J.; Ramarson, A.; Thieu, V.; Nemery, J.; Thery, S.; Billen, G.; Coynel, A. How can water quality be improved when the urban waste water directive has been fulfilled? A case study of the Lot river (France). Environ. Sci. Pollut. Res. 2018, 25, 11924–11939. [Google Scholar] [CrossRef]
  21. Zhang, M.; Wang, L.; Huang, X. Analysis on the Remediation Measures, Effects and Difficulties of the Blackodor Water in Licun River of Qingdao. China Water Wastewater 2021, 37, 23–31. [Google Scholar]
  22. Minaudo, C.; Meybeck, M.; Moatar, F.; Gassama, N.; Curie, F. Eutrophication mitigation in rivers: 30 years of trends in spatial and seasonal patterns of biogeochemistry of the Loire River (1980–2012). Biogeosciences 2015, 12, 2549–2563. [Google Scholar] [CrossRef] [Green Version]
  23. Beechie, T.J.; Sear, D.A.; Olden, J.D.; Pess, G.R.; Buffington, J.M.; Moir, H.; Roni, P.; Pollock, M.M. Process-based Principles for Restoring River Ecosystems. Bioscience 2010, 60, 209–222. [Google Scholar] [CrossRef] [Green Version]
  24. Van Vuren, S.; Paarlberg, A.; Havinga, H. The aftermath of “Room for the River” and restoration works: Coping with excessive maintenance dredging. J. Hydro-Environ. Res. 2015, 9, 172–186. [Google Scholar] [CrossRef]
  25. Ouyang, Q.L.; Gao, G.Q.; Liu, S.S.; Shi, X.L. Study on Characters of Nitrogen Adsorption and Desorption of Sediment in Ganjiang River. Appl. Mech. Mater. 2012, 212–213, 391–394. [Google Scholar] [CrossRef]
  26. Buchanan, B.P.; Walter, M.T.; Nagle, G.N.; Schneider, R.L. Monitoring and assessment of a river restoration project in central New York. River Res. Appl. 2012, 28, 216–233. [Google Scholar] [CrossRef]
  27. Azrina, M.Z.; Yap, C.K.; Ismail, A.R.; Ismail, A.; Tan, S.G. Anthropogenic impacts on the distribution and biodiversity of benthic macroinvertebrates and water quality of the Langat River, Peninsular Malaysia. EcEcotoxicol. Environ. Saf. 2006, 64, 337–347. [Google Scholar] [CrossRef] [PubMed]
Figure 1. The Licun River basin.
Sustainability 14 03547 g001
Figure 2. Governance scope and water quality analysis (2000–2007). Note: (a) Scope of the first governance stage; (b) Annual average concentration and limits of main indexes; (c) The individual pollution index and comprehensive pollution index; (d) Pollution contribution rate.
Sustainability 14 03547 g002
Figure 3. Governance scope and water quality analysis (2007–2016). Note: (a) Scope of the second governance stage; (b) Annual average concentration and limits of main indices; (c) The individual pollution index and comprehensive pollution index; (d) Pollution contribution rate.
Sustainability 14 03547 g003
Figure 4. Governance scope and water quality analysis (2016–2020). Note: (a) Scope of the third governance stage; (b) Annual average concentration and limits of main indices; (c) The individual pollution index and comprehensive pollution index; (d) Pollution contribution rate.
Sustainability 14 03547 g004
Figure 5. Daily inflow and design capacity of Licun River Sewage Treatment Plant during 1 January 2012 to 31 December 2013 (a) and 1 January 2017 to 31 December 2018 (b).
Sustainability 14 03547 g005
Figure 6. Location and phenomenon of overflow.
Sustainability 14 03547 g006
Figure 7. COD concentration in the main pipe of the Licun River basin.
Sustainability 14 03547 g007
Publisher’s Note: MDPI stays neutral with regard to jurisdictional claims in published maps and institutional affiliations.

