Article

Sustainable Development as a Driver for Customer Experience

1
School of Innovation, Design and Engineering, Mälardalen University, Hamngatan 15, 632 20 Eskilstuna, Sweden
2
EPSI Rating, 111 23 Stockholm, Sweden
*
Author to whom correspondence should be addressed.
Sustainability 2022, 14(6), 3505; https://doi.org/10.3390/su14063505
Submission received: 9 February 2022 / Revised: 28 February 2022 / Accepted: 8 March 2022 / Published: 16 March 2022
(This article belongs to the Special Issue Sustainable Customer Relations)

Abstract

:
The concept of sustainable development (SD) has become widely accepted among nations, organisations, and individuals. Recent quantitative and conceptual models have indicated relations between stakeholder perspectives of SD, brand image, and customer satisfaction. The purpose of this study is to estimate a Sustainable Development Index (SDI) as an easy applicable survey item which is used to estimate customer perceptions. By applying a PLS path model, comprising of the EPSI models variables and the suggested items of SDI, this study evaluates relationships between aspects of customer experience and customers’ perception of SD. The estimated score of SDI is further analysed as an approximate measure of universal SD items applied in the literature. As such, the study contributes to the research community by further integrating customer perception of SD in frameworks measuring customer experience. The study data comprises cross-sectional multi-industrial customer perception data, consisting of 606 final respondents. The results show empirical support of the constructed index relation as an approximate measure of universal SD items and as a driving aspect of the customer experience.

1. Introduction

The concept of sustainable development (SD) has been on the global agenda for fifty years and is now widely accepted among nations, organisations, and individuals alike [1,2,3,4,5,6]. According to the Brundtland Commission, SD is defined as a development that meets the needs of the present generation without compromising the ability of future generations to meet their needs [7]. Theoretical perspectives of SD have been broadly discussed and applied, including several different requirements for what should constitute a sustainable organisation [8,9,10,11]. However, despite decades of research, there is a need for further studies on the integration of SD with core business measurements and processes [12,13,14]. Simply put, there seems to still be a gap between SD theory and practice [2,13,14].
Elkington, Topfer, and Walker presented the concept of a triple bottom line (TBL) to compliment classical management focus with three SD dimensions [15,16,17]. Thus, a single bottom line of financial performance was extended to include economic, environmental, and social performance. The TBL approach has become well-known and widely used as a framework for SD measurement and management in organisations [1,4,5,6,18].
In short, the three TBL dimensions can be described as follows: The people or social equity bottom line refers to fair business practices towards labour and the society in which an organisation is operating [19]. The success and well-being of the organisation, its workforce, and other organisational stakeholders is interdependent. As such, organisations complying with TBL seek to contribute to the overall strength and growth of its community.
The planet or environmental bottom line refers to development where ecologically destructive practices should be avoided. Organisations which have adopted the TBL may focus on reducing its ecological footprint by managing its consumption of energy, natural resources, as well as non-renewable inputs and outputs [20,21,22].
The profit or prosperity or economic bottom line deals with the economic value created by an organisation. In the TBL concept, the economic value created, or the profit itself, needs to be evaluated from the perspective of society as whole. Therefore, in a TBL approach, the economic bottom line is arguably not to be interpreted as traditional corporate accounting measures. However, in practice, the economic TBL dimension is generally reported within the frameworks of classical financial reports [14].
There has been significant progress in mapping positive attributes from stakeholders regarding SD. Research has found that organisations which are successful in communicating adequate SD policies and initiatives may evoke several positive attributes. For example, organisations perceived as sustainable gain attractiveness and retain employees [23,24]. SD efforts have also been found to enhance reputation and brand image [25,26]. Moreover, it has been shown that customers positively affected by perceived SD show increased loyalty [8] and satisfaction [26,27], which in turn influences the organisations financial results [13,27,28,29]. Despite this progress, SD models are still complex and difficult to implement. Therefore, there is a need to make SD more understandable and workable for everyday business life [8,13,14], especially regarding customer perceptions.
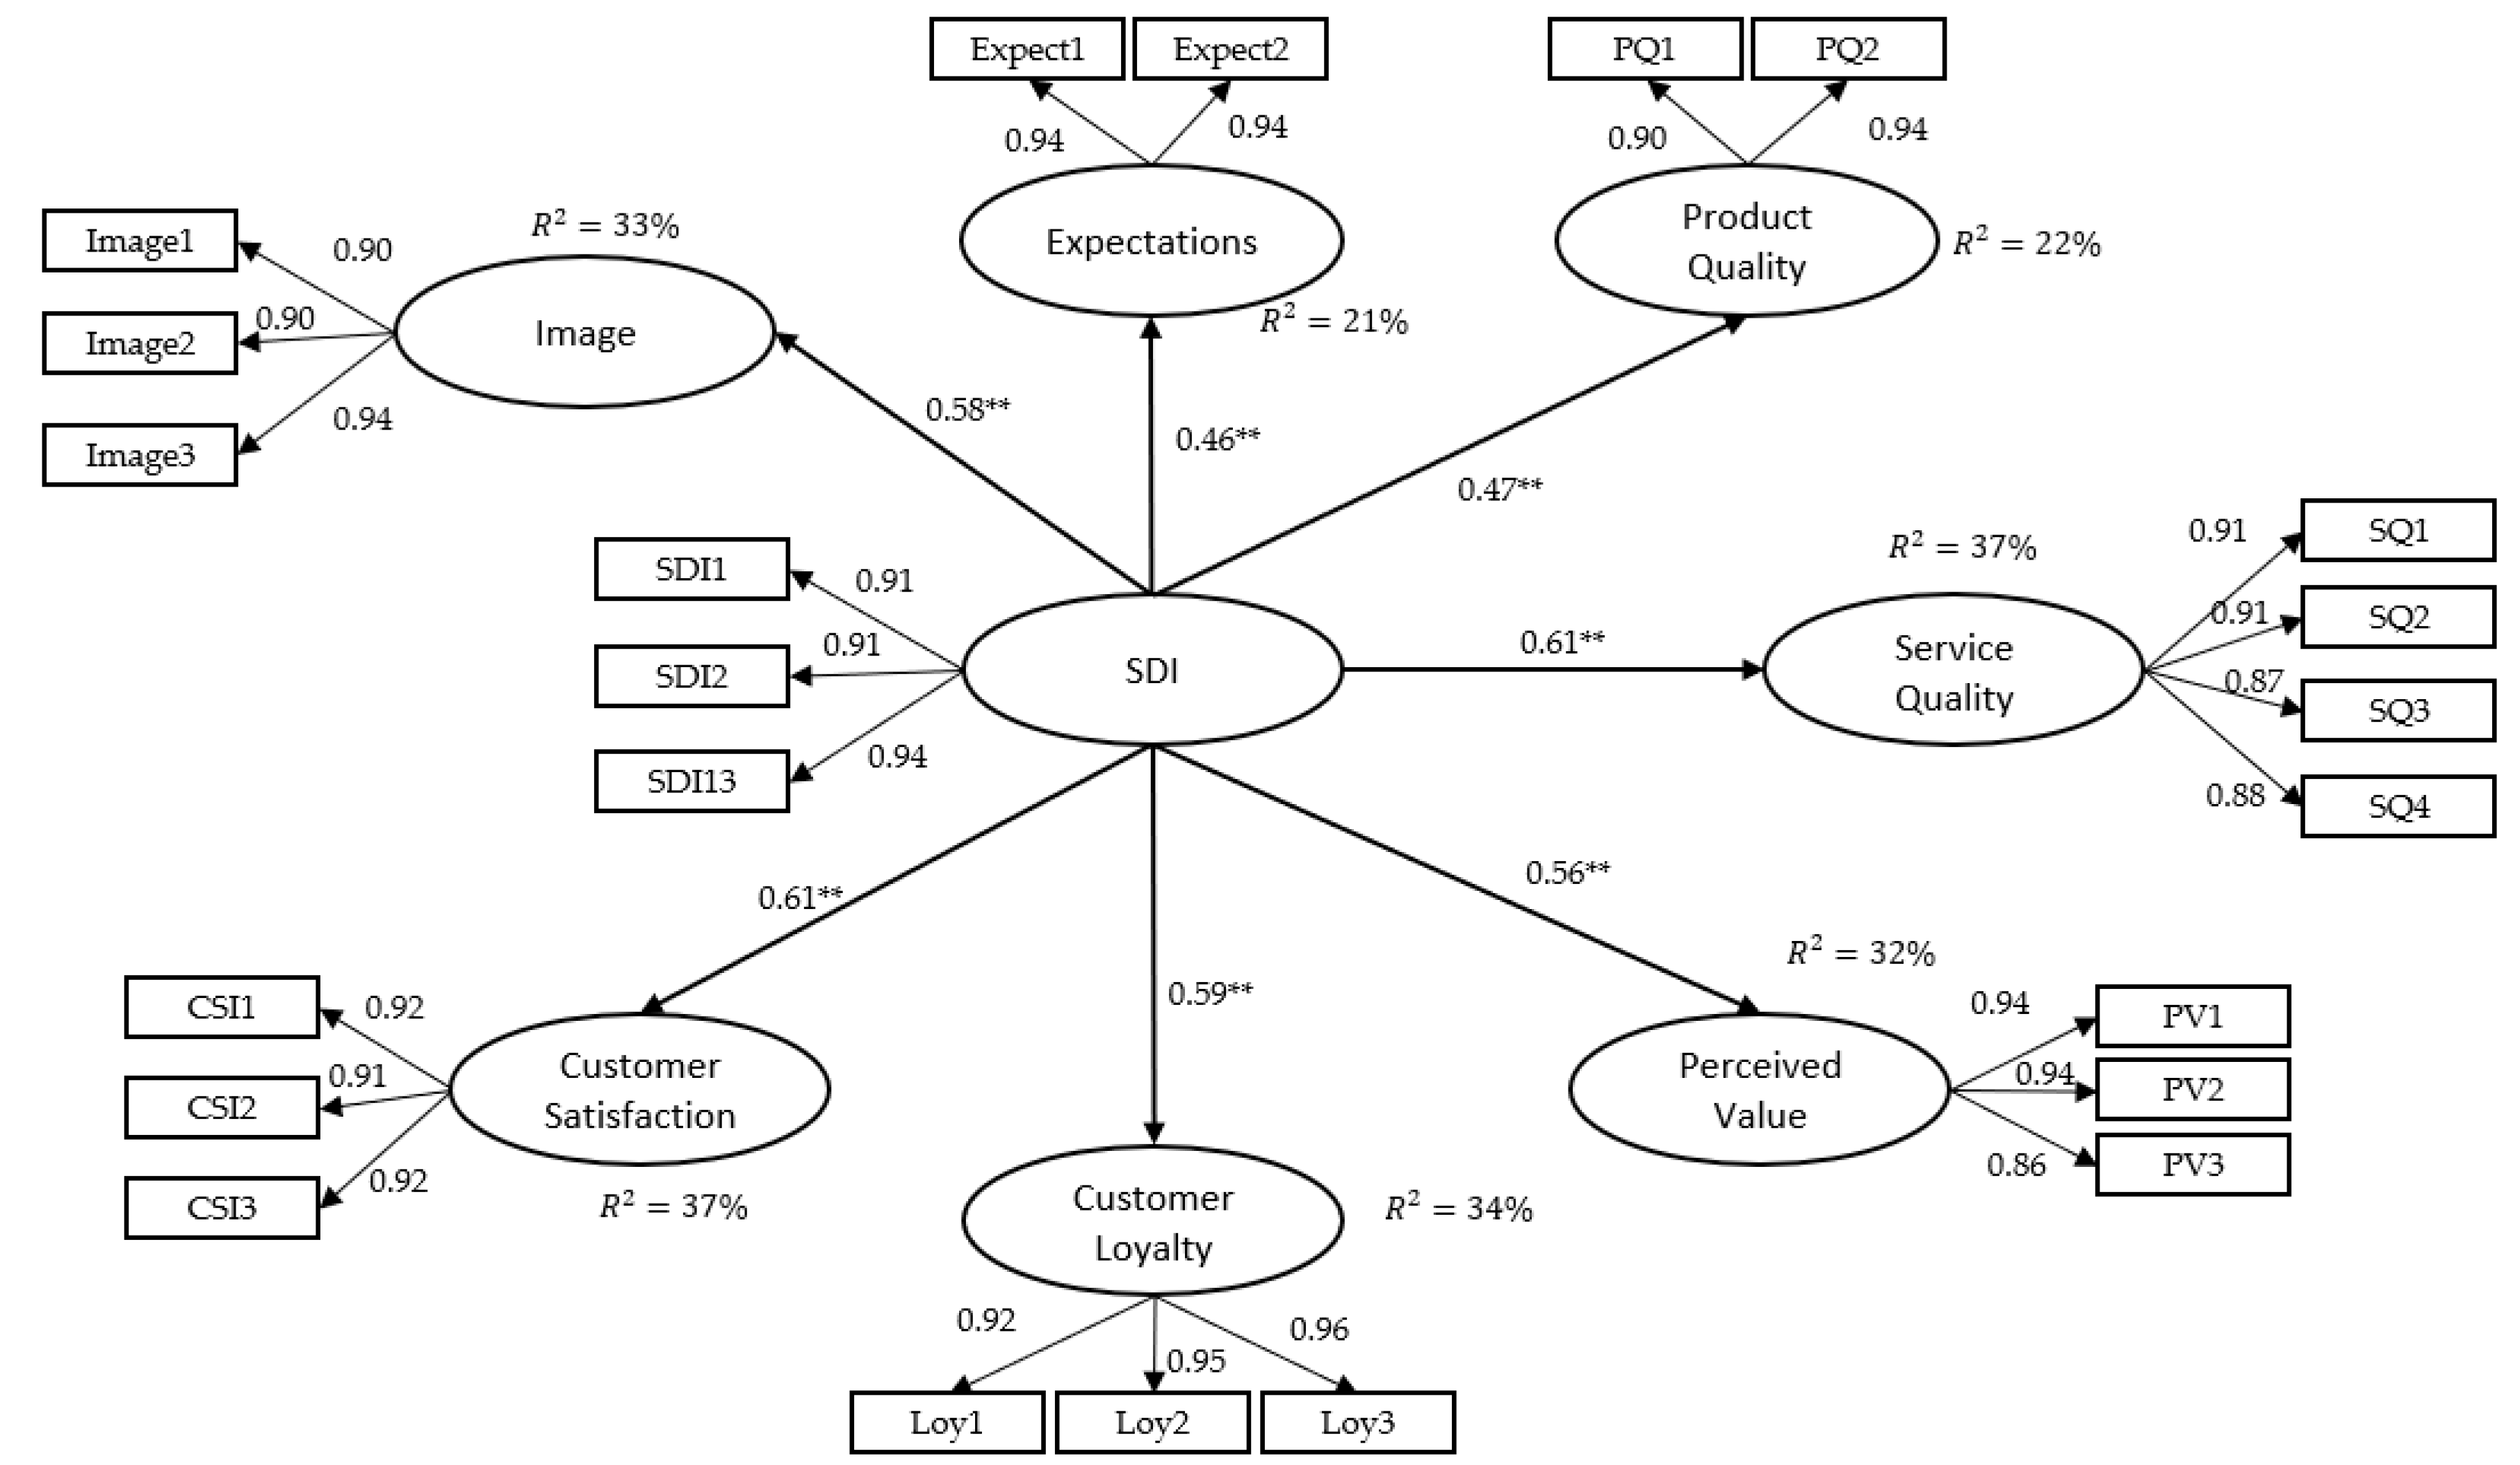
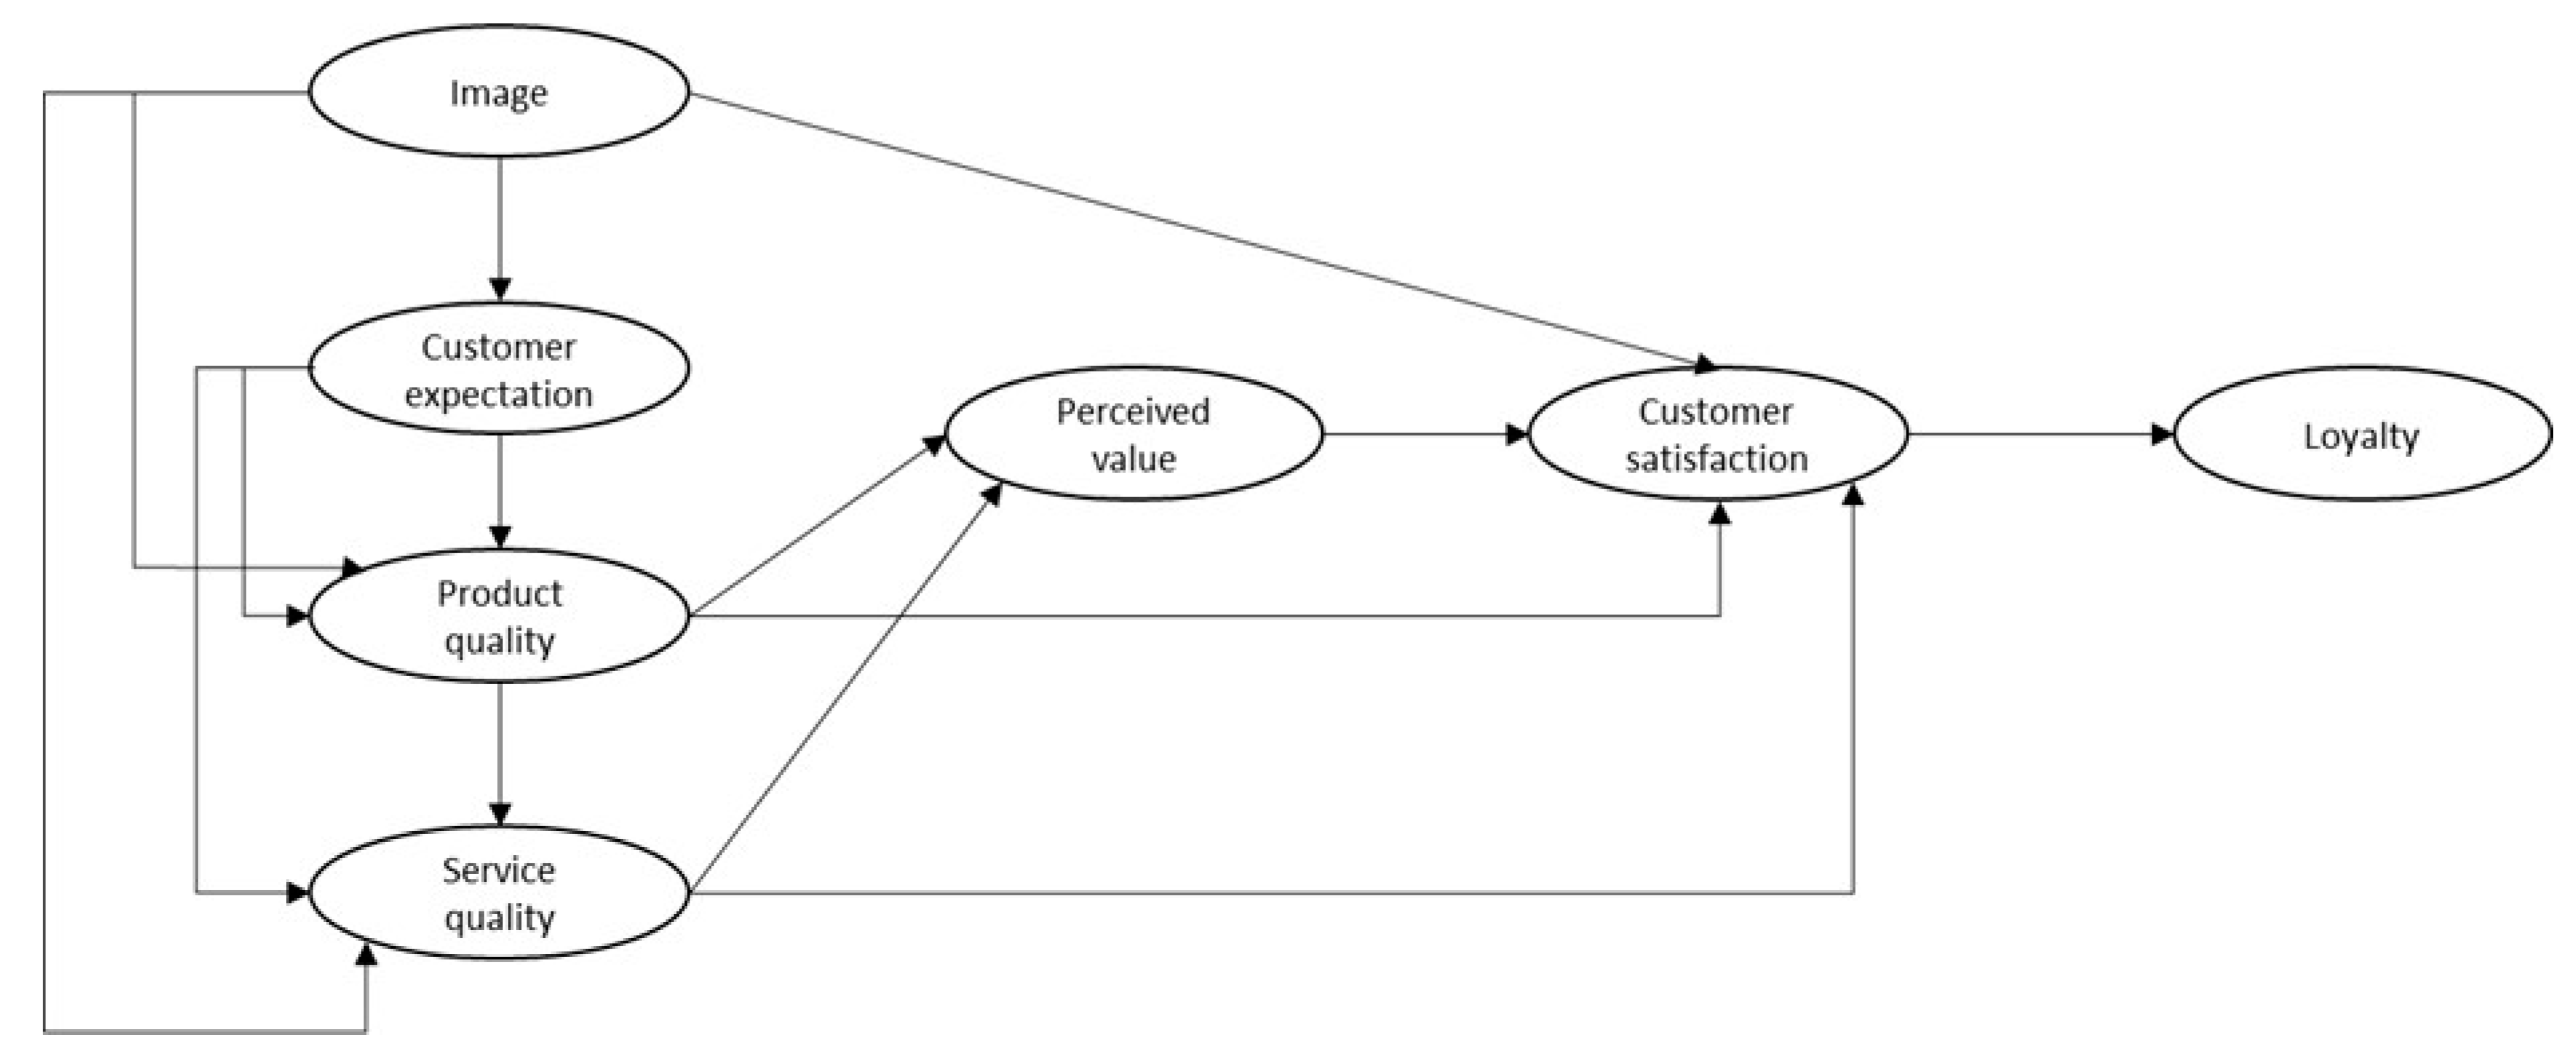
The purpose of the study is to estimate a Sustainable Development Index (SDI) as a reflective aspect capturing customer perceptions of intertwined SD dimensions and to estimate SDI effects on EPSI Rating variables. EPSI Rating, formerly known as the European Satisfaction Index, is a well-known adoption from the Swedish Customer Satisfaction Barometer [30,31]. The EPSI model framework encapsulates the customer experience into five drivers of brand image, customer expectations, product quality, service quality, and perceived value which creates customer satisfaction and loyalty. As suggested in the literature, a significant relationship between SD and other variables measuring customer experience is expected [8,25,26,27]. Thus, by using the EPSI Rating customer satisfaction model (see Appendix B) as well as earlier research measuring customer perceptions of sustainability, this paper aims to take a first step towards creating a practical index variable of SD. The relevance of including SDI in different customer segments is, from the proposed setup, evaluated by the strength in the relationships towards EPSI Rating variables. Secondly, for SDI to be considered as a measure of SD, it is also suggested that SDI should be related to several universal SD items.

2. Theoretical Frame of Reference

Theories on SD have been thoroughly reviewed and discussed throughout the years, see, for instance, reviews by [32,33,34,35,36,37,38,39,40]. A search in scientific databases shows that the literature in the field is extensive, diverse, and difficult to overlook. A simple search pattern was conducted in a variety of academical databases. Keywords such as “sustainability” or “sustainable development” yielded millions of hits. To capture the complexity of the subject, a comprehensive literature review by [19], focusing on SD in organisations, has been used as a theoretical frame of reference in this study.
This study does, as such, apply the SD conceptualisation of sustainability. However, consensus regarding meanings and content of sustainability concepts is far from universal [10,11,41]. Commonly applied academical concepts are corporate social responsibility (CSR), corporate sustainability (CS), and SD [5,41]. These concepts all share common roots and are generally denoted as similar concepts consisting of a three pillar, or a triple bottom, structural framework reflecting economic, social, and environmental sustainability [1,4,5,6,10,18,21,42,43].
Today, several different structural layouts of the three-pillar/TBL framework exist [1]. Commonly applied graphical descriptions of the relationships between the three pillars are intersecting Venn diagrams, completely intertwined Venn diagrams, and a parallel independent structure [1,10]. The three-pillar framework has been thoroughly studied and found to be dependent on both context and different stakeholders [1,2,10,13]. For instance, when studying sustainability reports, the economic dimension in TBL seems to generally be interpreted as standard financial performance [13], while in other cases as a prerequisite, or constrained by social and environmental factors [1,18].
In short, the economic pillar can be described as a production system that satisfies the present levels of consumption without compromising future needs [22]. Social sustainability seeks to improve social equity and justice, labour practices, organisational governance, etc., by economic growth with perseverance of environmental factors [6,20,22]. Finally, environmental sustainability is described as a form of governing natural capital constrained by economic input and output [20,21,22]. It concerns the balance between development and conservating a productive, resilient environment which may continue to support human life [6]. In accordance with previous listed definitions, sustainability, conceptualised by SD, in this paper, is seen as an integrated concept where each pillar is a dependant function/cost of the others.

3. Development of Instrument Measures of Perceived SD

3.1. Scale Development

Churchill proposed a procedure of eight steps to develop instrumental measures [44]. The eight steps include: (1) specify the domain of construct, (2) generate sample of items, (3) collect data, (4) purify measure, (5) collect data, (6) assess reliability, (7) assess validity, and finally, (8) establish norms. The procedure is not a straightforward process, and several iterations may be performed given non-satisfying results. This study is influenced by Churchill’s procedure but applies the standard layout as a rough baseline/inspiration for techniques. As such, this study may be said to be located at stage 4 where a practical pilot sample of data is evaluated from its relevance as a construct and relationships towards other measures. Techniques recommended by Churchill and the adaptions applied in this paper are shown in Table 1.

3.2. Customer Perceptions and SD

The relationship between customer experience measures and customer-based perceptual SD has been previously investigated by various scholars [41]. Most previous studies have developed research models around the concept of CSR [41]. As previously argued, CSR, CS, and SD may be seen as concepts demonstrating economic, social, and environmental concerns in interactions with stakeholders and business processes [1,10,21,41]. Following this theoretical frame of reference, this study builds from the conceptualisation of a customer-based perceptual sustainability framework in [41]. Each customer is here asked to evaluate a set of organisational associations which reflect to what extent an organisation is perceived to approach SD concerns in its overall strategy and interactions with its stakeholders. Brown and Dacin asserted similar perceived associations such as:
“might include perceptions, inferences, and beliefs about a company; a person’s knowledge of his or her prior behaviours with respect to the company; information about the company’s prior actions’ moods and emotions experienced by the person with respect to the company; and overall and specific evaluations of the company and its perceived attributes” [45].
Overviews of earlier scale implementations, mainly measuring perceived CSR and CS, are referred to [2,8,41]. From these studies’ extensive literature reviews, several multidimensional SD items have been summarised for use in this study.

3.3. Development of an SDI

As mentioned, the purpose of this study is to develop a Sustainable Development Index (SDI) as an applicable survey item which may further be used to predict the effect of customers’ experiences. Items summarising earlier developed multidimensional scales, as well as items capturing parts of the Sustainable Development Goals (SDGS) [46] are mainly adapted from the results of [2,8,41]. All SD items are treated independently, but a general classification based on TBL has been adopted from [2,8]. Moreover, a mixed category of two items is suggested. The SD items are outlined in Table 2.
In contrast to extracting factors from the previous applied items, as suggested by Churchill [44], this study proposes the construction of a latent score of SDI by three new holistic items (SDI items 1:3). The proposed SDI questions aim to function as an overall reflective approximation of the items in Table 2, capturing the intwined variance between the TBL dimensions. From a practical approach, three holistic items would yield a short applicable construct which could, to a greater extent, include other measures without risking bias from respondent fatigue. Construction of the SDI items has been influenced from the items retrieved in previous literature, [2,8,41], as well as consulted by experts on quality management and sustainability; for list of experts, see Appendix C.
The items have been purposefully constructed in a holistic sense to allow respondents to reflect on different parts of TBL more freely regarding their actors’ actions. This implementation is suggested to create a more dynamic view of SD. The SDI items are listed as follows:
  • Organisation XX (XX is replaced by the name of the actor in question) invests in a sustainable growth considering future generations (SDI1) is an item targeting the customer’s perception of a provider’s overall long-term thinking with regard to several dimensions of sustainability. The item is adapted from [49,50].
  • Organisation XX strives for economic success without compromising social or environmental factors (SDI2) is an item influenced by several other items probing the customer’s perception of a provider’s financial focus in relation to social and environmental dimensions of sustainability. This item is mainly adapted from [2,50].
  • Organisation XX demonstrates societal responsibility socially, environmentally, and financially (SDI3) is the third manifest item, where the respondent may zoom out and reflect on all three combined dimensions. The item is adapted from the dominant graphic literature of sustainability as an intersection between the TBL dimensions [1,2,8]. Thus, an actor excelling in sustainable development should be perceived to excel in all three aspects by its customers.

4. Methodology and Hypothesis Development

4.1. Hypothesis Development

As several conceptual measures of sustainability have been conducted, a large array of sustainability items already exists and have been applied in an explorative and confirmative setup [2,8,41]. These models often result in detailed questionnaires which, to a large extent, capture each specific dimension of SD. In contrast, and in an effort to make such SD measures more workable, this study suggests merely three holistic manifest items used to estimate an overall SDI score in relation to other customer experience measures.
The first model, the Customer model (see Section 4.2), is deployed by estimating a latent score of the SDI by a partial least square path model (PLS-PM) setup. The score of the SDI is created by weighting the holistic SDI items to estimates coefficients, which maximizes the coefficient of determination in its endogenous constructs [58]. The model provides results in forms of an SDI score as well as estimated effects between the SDI and other customer experience variables. The purpose of the Customer model may be summarised in the following hypothesis:
Hypothesis 1 (H1).
Are there any significant effects between SDI and EPSI model variables of customer experience?
The SDI score, previously obtained in the Customer model, will then be used in a subsequent analysis to evaluate the relation of the SDI score as an approximative measure of a universe of SD items, used in previous confirmatory studies (see Section 4.3 and Table 2). This analysis is conducted by estimating correlations coefficients between the universal SD items and the score of the SDI.
Hypothesis 2 (H2).
Is the SDI score a valid approximative measure of a universe of SD items?
Finally, the relationship between the SDI and the EPSI model latent variable of customer satisfaction is analysed in different industrial segments. This analysis aims to evaluate possible heterogenous preferences of SDI as a driver for customer satisfaction among customers in different industry segments.
Hypothesis 3 (H3).
Are relationships between SDI and customer satisfaction heterogenous between industry segments?

4.2. Customer Model

The Customer model is a PLS-PM approach which is used to estimate the relationships between the SDI and customer experience aspects from the ESPI model. PLS-PM is a method and technique to estimate structural equation models by a component-based estimation procedure which differs from the covariance-based LISREL-type approach. [58,59,60,61,62]. PLS-PM uses multiple regression techniques to estimate network structures between unobserved latent constructs/variables (LV) and their observed manifest items/variables (MV). Examples of similar methodological applications have been presented in research on customer satisfaction drivers [63], customer behaviour utility [64], relations between EPSI scores and financial performance [28,29], and CSR perceptions linked to EPSI model variables [26]. The choice of applying a PLS-PM setup fell on its robust and well-known usage in customer experience models, its ability to identify key drivers, and frequent use of latent variable scores in subsequent analyses [58].
The EPSI model measures customer experience from a third order hierarchical component PLS model including LVs such as brand image, customer expectations, product quality, service quality, value for money, customer satisfaction, and customer loyalty [31]; see Appendix A. Customer satisfaction and loyalty are regarded as results which are increased by being favoured in the remaining driving LVs. All underlying EPSI manifest items are included (EPSI items and the complete questionnaire is presented in Appendix B). The theoretical framework needed for including the SDI in the EPSI structural model is beyond the framework of this study. Thus, the SDI is treated as an exogenous latent variable with direct paths towards the EPSI latent variables. Estimations of all latent variables are performed by a reflective measurement allowing the internal consistency of latent variables to be evaluated [58,60]. The reflective measure aims to maximise the overlap between interchangeable factors [58], which is consistent with the view of overlapping intertwined measure of TBL and the SDI items. The PLS-PM setup uses the path weighting scheme, as suggested by [58], and calculation specifications from [30]. Each latent variable is as such obtained by the normalised weighted average of its MVs. This implementation extends the practical usability and interpretation of the structural effect relationships. The mathematical derivation of this implementation is referred to [65].
Figure 1 displays the setup of the Customer model. PLS-PM estimations are computed in R v 3.6.1 software. The goal of the Customer model may be said to estimate a holistic SD latent variable score, which can be used as a first approach to identify if SD is a driver for the customer experience. If this is the case, the specific organisation may apply the score in subsequent analyses or conduct extended SD models.

4.3. Relationship between SDI and Universal SD Items

In the Customer model, SDI is assumed to be a valid approximation of the perceived satisfaction of an actor/organisation’s SD actions by its customers. To empirically validate SDI as a predictor of SD, the estimated SDI score should arguably be related to the individual SD items, see Table 2, used in previous confirmatory sustainability scale research. Dunaetz recalls this process as a convergent validity procedure as it demonstrates that the concept is related to theoretically similar measures, which may be applied when constructing new shortened constructs [66]. We argue that for SDI to be able to work as a possible standalone approximation of the SD items, this analysis should be performed on the already estimated score previously obtained in the Customer model.
There are several possible methods which could be used for this analysis [58,67]. One method, suggested by [68], is to evaluate the bivariate correlations between the SD items and the construct of SDI. The correlations coefficients are expected to be at least 0.5 and preferably larger than 0.7 [58,69,70]. The threshold of 0.7 simply implies that the shared variance between the item and SDI is larger than the error variance [58,60]. Hence, the convergent validity between SDI and the SD items may be established. The relation between SDI and the SD items is further evaluated in comparison to the correlation between SDI and the EPSI latent variables. Preferably, to establish a weak form/indicative measure of divergent validity, the correlation coefficients between the SDI and the SD items would show stronger dependence than the coefficients found between the SDI and EPSI latent variables.

4.4. Industrial Segments Driver Analysis

The data are further divided into industrial subsets. For each industry segment, the SDI is regressed by an OLS model against the EPSI model latent score of customer satisfaction. The relationships between the SDI and the overall customer satisfaction are thus evaluated from different industrial customer segments.

4.5. Data Collection and Processing

The study data comprise computer assisted web interviews from multi-industrial private customers in Sweden, collected during 2020. The setup was chosen to represent customers distributed from banking, telecom, insurance, and energy, all present in the public domain and engaging a large national representation of private consumers. The data are retrieved from the EPSI rating database and comprised of 964 respondents, approximately uniformly distributed over the sample industries.
All items follow a Likert scale ranging from 1 to 10 combined with an additional option of do not know. Questions/items used in the analysis are transformed into a 0–100 scale which is commonly applied in EPSI model setups [65]. The full questionnaire may be found in Appendix B. To limit possible estimation biases [71], with regard to missing values (“don’t know” answers), the data are cleaned for respondents which had not answered all SDI manifest items. Moreover, a strict criterion was implemented to exclude respondents who did not have the knowledge to give a score on more than 50% of the items in Table 2. Thus, the original data, 964 interviews, were reduced by 37% making the final data consist of 606 individual observations. The largest drop of respondents occurred in the telecom and insurance industries, where around 43% of the respondents were excluded. In banking and energy industries, approximately 30% of the original data set was omitted. Remaining missing values were replaced with cross-industrial mean imputation.
Data have been processed using SPSS v 24 and R statistical software v 3.6.1 throughout the paper. The following Table 3 displays the sample profile.
As seen in Table 4, the correlation between items in different a priori TBL classifications is commonly strong. It is notable that SDI 1–3 display moderate/strong correlations against items in all prior classified TBL groups.

5. Results

5.1. Customer Model Results

The following results are based on the PLS-PM Customer model and comprise multi-industrial data.
Table 5 displays summary statistics for all constructed latent variables. SDI receives the lowest mean value score (56.2). The standard deviation varies around 20.7–24.0 units for all latent variables. Table 6 shows measures of internal consistency of the LVs. The measure of Cronbach alpha is above the suggested threshold of 0.7 [72], regarding all LV variables. The measure of composite reliability also exceeds the threshold of 0.7. Values of Cronbach and composite reliability over 0.9 are however criticised by [58,73] while regarded as a suggested standard for applied research by [69]. All LVs exceed the threshold of 0.5 regarding the Average Variance Extracted (AVE) [58]. The first eigenvalues for all LVs, in Table 6, are considerably larger than the second. This measure indicates unidimensionality among the LVs. Table 7 displays the correlation between the LVs in the Customer model as well as the Fornell–Larcker criterion in the diagonal elements. The Fornell–Larcker criterion is an estimate of the LVs discriminant validity. Several large correlations are found among the LVs. However, as the Fornell–Larcker criterion is larger than each bivariate LV correlation, discriminant validity is established [58]. The results from Table 5, Table 6 and Table 7 indicate an adequate fit which further allows analysis of path relationships.
Table 8 displays the direct effect in the final regression stage of the Customer model PLS-PM. All paths are shown to be significant and the largest effects from the SDI are found in paths towards customer satisfaction, customer loyalty, service quality, and image. Coefficients of determination are found to be weak in product quality and expectations. All other paths show moderate strength in their coefficients of determination which range from 0.32 to 0.37%. Considering this simple model, an increase in SDI is shown to have a significant positive effect towards other variables of the customer experience, thus providing support of H1.
Figure 2 provides a graphical overview of the results in the Customer model PLS setup.

5.2. Relationship between SDI and Universal SD Items

Table 9 shows the results of a correlation analysis between the score of the SDI and the SD items in Table 2. Two of the SD items fall below the threshold of 0.7. However, given a 95% confidence interval, both items include the threshold of 0.7. The highest correlations are found in the a priori classified environmental items. All correlations between SDI and SD items surpass 0.61, which is the highest correlation found between SDI and EPSI variables, see Table 7. The results indicate that the SDI score is a valid approximative measure of the universal SD items. This result further provides evidence to support H2.

5.3. Industrial Segment Results

Table 10 displays regression results from a simple regression analysis where SDI is regressed against customer satisfaction. The results are divided into segments of industrial belonging. All models show a significant positive relationship between the constructs. The largest regression coefficient is found in the energy industry with a coefficient of determination of 50%. The banking industry has a similar regression coefficient as the total multi-industrial sample but a larger coefficient of determination of 44%. Weaker relationships are found in both the insurance and telecom industries. The result indicates heterogenic customer preferences about the importance of SDI, as a driver for customer satisfaction, in the industrial segments, thus indicating support of H3.

6. Discussion

This study has evaluated a proposed framework for measuring perceived sustainability. In contrast to using an extended list of items, thoroughly reflecting each sustainability dimension, one latent construct of three underlying manifest items is proposed. The SDI presented could be seen as a practical extension of previously researched methods of measuring perceived SD. As the perception of a sustainable actor, from the viewpoint of an individual customer, may be mainly influenced by only one of the dimensions, a manifest SDI item is proposed to capture the overall perception of sustainability. Hence, the SDI does not have to strictly reflect all TBL dimensions but rather indicate a general interpretation, such as the top of mind of the customer. To further extend the use of an SDI as a managerial tool, it must also be possible to measure its effect, directly or mediating, towards other key performance measurements as well as an approximation of its tangible importance. In this study, such connections are evaluated from its effect on EPSI variables which, as previous research has shown, influences financial business performance [28,29].
Results from the Customer model show strong internal consistency of the SDI as an independent construct, but also in a combined model with the latent EPSI model variables. There are however valid concerns regarding how strong the relation between an underlying manifest item and its LV should be. Authors such as [58,73] argue that Cronbach and composite reliability values of 0.9 are satisfactory, while values above 0.9, and especially 0.95, are not desirable. Large reliability values may be indicators of redundant items and may further boost error term correlations. In contrast, Refs. [69,72] reported values between 0.9 and 0.95 as satisfactory. Especially, Ref. [69] state that measures used in applied research, where important decisions are made with respect to specific test scores, reliability values of 0.90 are a minimum and that 0.95 should be considered as a desirable standard. As this study applies a practical approach, the proposed manifest block is regarded as an adequate fit for an unobserved construct. Given concerns regarding large intercorrelations between the SDI item, as measures of similar phenomena, future applications may revise the underlying items or simply choose to exclude one of the items from the construct.
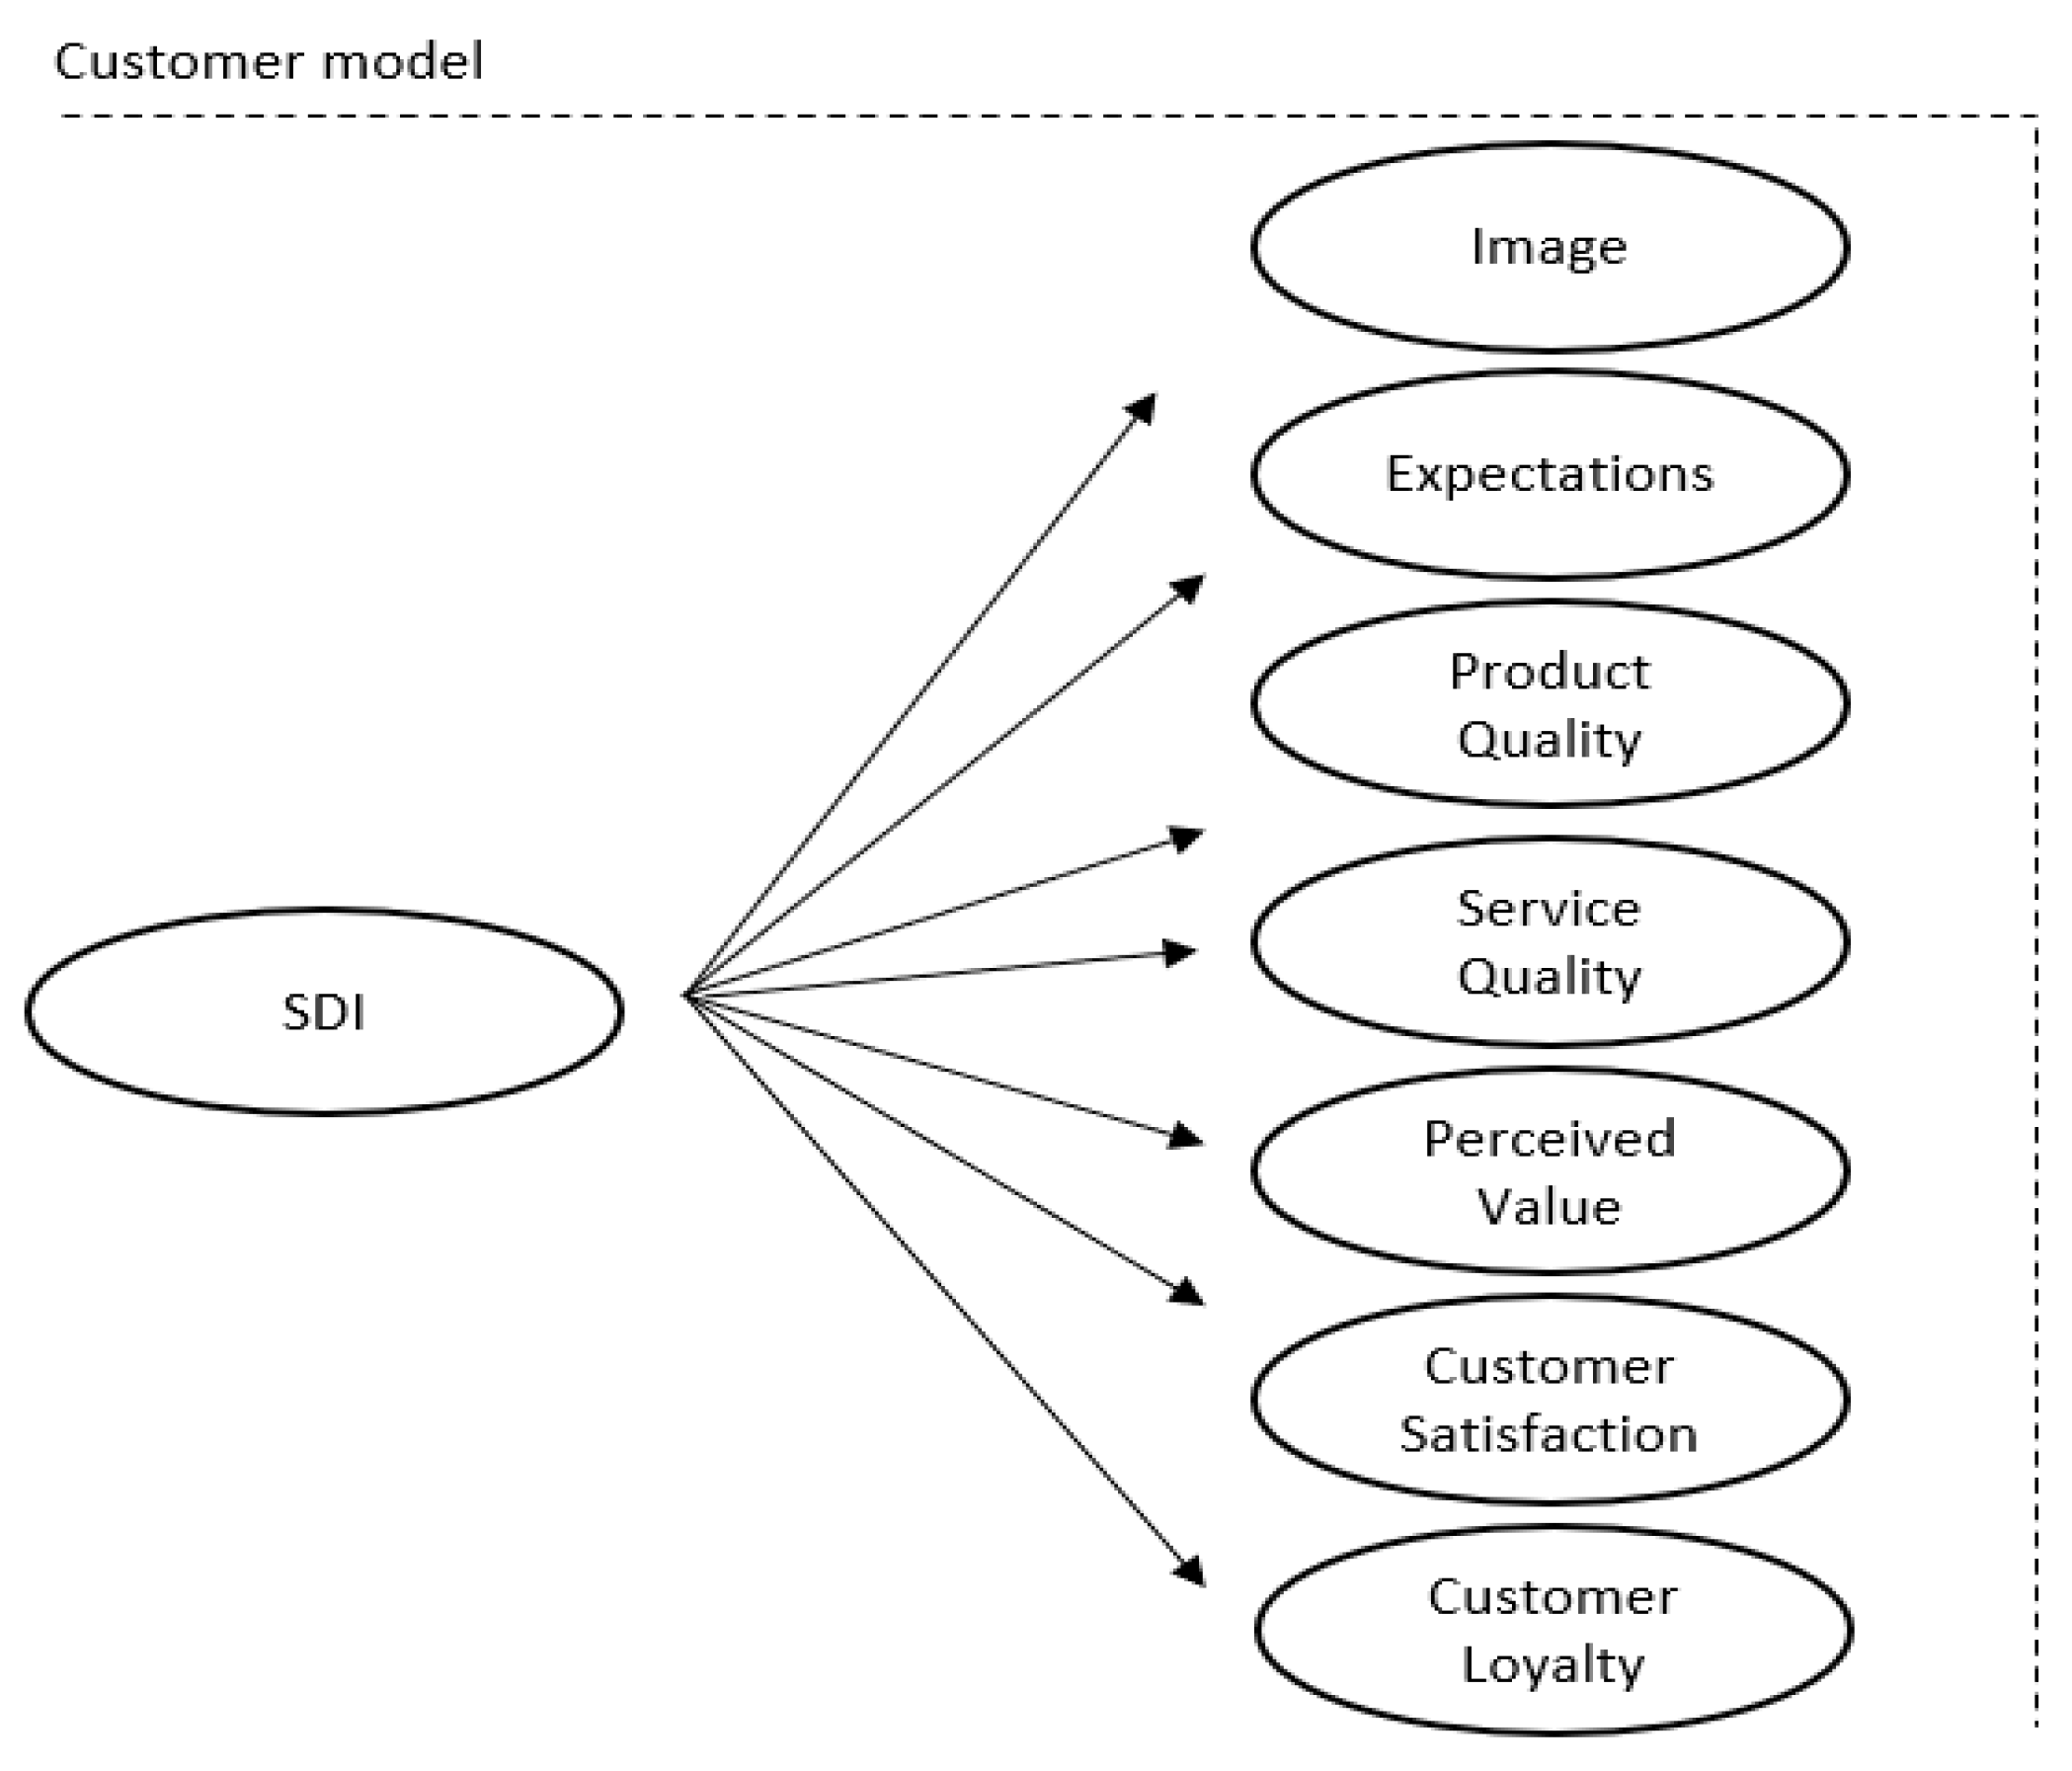
The Customer model extended the use of the SDI as an exogenous variable directly related to all EPSI model latent variables. The result yielded significant positive effects in all paths. It may be concluded that integrating an SD variable in an extended EPSI model, directly pathed towards one of the stronger drivers, would yield substantial effect on customer satisfaction and loyalty. This result may be seen as a useful extension of previous research in [13,26,65]. The Customer model shows weak to moderate coefficients of determination. The result indicates that the model might be suffering from omitted variables/information, such as the EPSI models structural relations, or heterogeneity among customer preferences. Moreover, SDI receives the lowest mean score in comparison to the EPSI model variables. This result indicates a general dissatisfaction from customers regarding their actor’s sustainability efforts. However, it may also be seen as an area of opportunity for actors wanting to distinguish themselves from other market competitors. The Customer model results should only encourage further research, possibly where a construct of SD, such as the SDI, is included in the structural model of the EPSI framework. A robust analysis may then be performed to capture the effect size and predictionary power of SD in an integrated customer experience framework.
The suggested SDI is a new construct of an SD measurement. As such, it was relevant to establish the relation between the proposed construct and a universe of SD items applied in the literature. This analysis would arguably strengthen further practical use of the SDI as an independent questionnaire construct. The results show that all SD items have moderate to strong correlations towards the score of the SDI. The SDI also displays stronger correlations with the SD items in comparison to the EPSI model latent variables. From this analysis, it is arguable that the validity of the SDI, as an approximative measure of the SD items, is established given the estimation technique of the Customer model. SD items prior classified as belonging to the TBL environmental dimension displayed the strongest correlation towards the SDI score. This result differs from [2] who found that the social dimension was the most influential aspect among customers in the tourism industry. However, since climate change and environmental concern have gained attention as a top-of-mind from society as a whole, it is reasonable to assume that the environmental factor is the most influential factor for this multi-industrial sample.
By evaluating the specific industry segments, the results from the regression analysis indicate that the prediction power and the effect upon customer satisfaction varied between different industries. Further, both banking and the energy industry had less “don’t know” answers for the manifest SDI items in comparison to both telecom and insurance. As noted in previous research [26], large proportions of “don’t know” responses might indicate insufficient and unclear market communication by the industry actors rather than faulty items—the customers actually do not know. The importance for actors, to be perceived as sustainable by its customers, is as such found to be dependent on the specific industry.
Given different preferences among industries, it might further be relevant to assume the existence of a variety of customer segments, both within industrial and societal sectors, where the interest in SD is of even greater importance for customer satisfaction and loyalty. In accordance with the methodological choice of a PLS-PM model, a Response Based Unit Segmentation (REBUS) analysis is proposed for future research. REBUS as well as other cluster methods could reveal important information about customer segments where concerns about SD have a greater impact on the overall customer experience.
It should be critically noted that the SD items in this study were only a subset of the items found in earlier literature. Especially, only one item was classified as belonging strictly to the economic dimension. This concern will be addressed in upcoming studies to further establish the relation between the proposed SDI and the economic dimension. More advanced techniques, such as factor analysis, could also be applied to both establish latent traits for each TBL dimension and further evaluate their relationships towards SDI. This type of analysis could yield greater understanding of factors which affect the score of the SDI itself. Following the process procedure outlined in [44], a continued development, comprising an extended structural model framework and a larger data sample, is suggested. This extended additional data sample analysis could further be used to establish external validity of the SDI and its relation to customer experience.

7. Conclusions

Sustainable development (SD) has been on the global agenda for decades. The concept has been thoroughly researched and discussed. Nonetheless, there is still a gap between academic theories, political rhetoric, and actual deployment in practice. As recent research indicates, issues of SD have become increasingly important for both employers, employees, and customers as well as other societal stakeholders, and the need for deeper research on the integration of SD with core business processes has also been emphasised. This study may be seen as an extension to that field of research, creating a perceptual model combining core business attributes with TBL aspects.
This paper estimates a Sustainable Development Index (SDI) by identifying three underlying manifest questions based on previous research, reflecting customer perceptions of sustainability. The analysis shows that the proposed SDI variable has an adequate internal consistency and strong explanatory characteristics from previously applied measures of sustainability. Our contribution is to now introduce a PLS-PM approach to measure the perception of SD through the customers’ eyes and hopefully make it more meaningful and workable from a practitioner’s point of view. The proposed EPSI model development could offer an effective way of capturing important customer feedback and guide organisations forward in their quest to improve their SD efforts beyond just a verbal communication or formal reporting. Future research is also suggested to explore causal relationships between the SDI score and other existing frameworks of customer experience. Such research, with a new sample of data, could further enhance the knowledge and relevance of SD measures as well as to evaluate the external validity of the framework.
The model suggested in this study could assist in decoding and selecting non-financial indicators needed to measure SD in the eyes of customers and other stakeholders. Although this research is limited to pilot testing based on a narrow data set, there are important relationships to consider as previous research has also shown. It is reasonable to assume that for organisations to achieve sustainable success, factors such as being local, close to its customers (physically and digitally), as well as being able to communicate and cocreate around relevant SD initiatives will remain important.

Author Contributions

Conceptualization, L.W. and J.H.; methodology, L.W. and J.P. All authors have read and agreed to the published version of the manuscript.

Funding

This research received no external funding.

Conflicts of Interest

The authors declare no conflict of interest.

Appendix A. The EPSI Model

Figure A1. The EPSI model of customer satisfaction 2020.
Sustainability 14 03505 g0a1

Appendix B. Questioner

Table A1. Study questionnaire. Contains information regarding the items’ category, latent group, item name, as well as the item metadata.
CategoryLatentItem NameItem
Direct item Pursues long term success/activity.
Direct item Tries to offer services that are compatible with the environment.
Direct item Does everything possible to eliminate or reduce the negative effects on the environment.
Direct item Reduces its consumption of natural resources.
Direct item Strives to minimise the consumption of resources that affect the natural environment (negative).
Direct item Working to prevent child labour and unfair working conditions.
Direct item Improving the general well-being of society.
Direct item Treat their employees without prejudice with regard to their gender, ethnicity, and religion.
Direct item Actively work to improve the equality within the organisation.
Direct item Creates and sustains jobs in the region.
Direct item Contributes to limiting poverty.
ManifestSDISDI1Organisation XX invests in a sustainable growth considering future generation.
ManifestSDISDI2Organisation XX strives for economic success without compromising social or environmental factors.
ManifestSDISDI3Organisation XX demonstrates societal responsibility socially, environmentally, and financially.
ManifestImageImage1It is easy being a customer of XX.
ManifestImageImage2XX cares about their customers.
ManifestImageImage3XX is reliable.
ManifestExpectationsExpect1Expectations of products/goods and services at actor?
ManifestExpectationsExpect2Expectations of the customer service at?
ManifestProduct qualityPQ1Products/goods and services suit your needs.
ManifestProduct qualityPQ2Technical services (app, website, online services).
ManifestService qualitySQ1To keep you well informed about what affects you as a customer.
ManifestService qualitySQ2You feel valued as a customer of XX.
ManifestService qualitySQ3You receive the help you require.
ManifestService qualitySQ4Proactivity (to take initiative and make relevant offers)?
ManifestPerceived valuePV1The customer service at XX?
ManifestPerceived valuePV2Quality of the products and services XX offered?
ManifestPerceived valuePV3Quality of the products and services XX offered?
ManifestCustomer satisfactionCSI1Overall satisfaction of XX.
ManifestCustomer satisfactionCSI2Fulfilment of expectations.
ManifestCustomer satisfactionCSI3How well do you think XX compares with your ideal provider?
ManifestLoyaltyLoy1If you would need to choose a provider, how likely is it that you would choose XX again?
ManifestLoyaltyLoy2 How do you usually talk about your provider? In a negative or positive way?
ManifestLoyaltyLoy3 If a friend or colleague asks you for advice, how likely is it that you would recommend XX?
Table A2. Introduction text to each item by latent and categorical group.
CategoryIntroduction Text
ImageBased on what you have seen and heard, how do you agree with the following statements…
ExpectationsHow are your…
Product qualityHow are your experiences with regard to your actors...
Service qualityHow do you experience your actor in terms of...
Perceived valueGiven the fees and prices that you pay, how would you rate the…
Customer satisfactionGiven all your experience with your actor, how would you rate…
SDI and direct itemsTo what extent do you agree with the following statements…

Appendix C. Experts Considered in the Process of Developing SDI Items

Table A3. Panel of experts used to evaluate the practical usability of the SDI items.
ExpertAffiliationArea of Expertise
Professor Mats DelerydMälardalen UniversityQuality, environmental, and sustainability management.
Professor Anders FundinMälardalen UniversityQuality technology and management, operations management, and change management.

References

  1. Purvis, B.; Mao, Y.; Robinson, D. Three pillars of sustainability: In search of conceptual origins. Sustain. Sci. 2019, 14, 681–695. [Google Scholar] [CrossRef] [Green Version]
  2. Martínez García de Leaniz, P.; Pérez, A.; Rodríguez-del-Bosque, I. Measuring Corporate Social Responsibility in tourism: Development and validation of an efficient scale in the hospitality industry. J. Travel Tour. Mark. 2013, 30, 365–385. [Google Scholar] [CrossRef]
  3. Ranängen, H.; Cöster, M.; Isaksson, R.; Garvare, R. From global goals and planetary boundaries to public governance—A framework for prioritizing organizational sustainability activities. Sustainability 2018, 10, 2741. [Google Scholar] [CrossRef] [Green Version]
  4. Poveda, C.A. The theory of dimensional balance of needs. Int. J. Sustain. Dev. World Ecol. 2017, 24, 97–119. [Google Scholar] [CrossRef]
  5. Ashrafi, M.; Adams, M.; Walker, T.; Magnan, G. How corporate social responsibility can be integrated into corporate sustainability: A theoretical review of their relationships. Int. J. Sustain. Dev. World Ecol. 2018, 25, 671–681. [Google Scholar] [CrossRef]
  6. Mensah, J. Sustainable development: Meaning, history, principles, pillars, and implications for human action: Literature review. Cogent Soc. Sci. 2019, 5, 1653531. [Google Scholar] [CrossRef]
  7. WCED. Our Common Future: The Brundtland Report; Oxford University Press: Oxford, UK, 1987. [Google Scholar]
  8. Moisescu, O. Development and Validation of a Measurement Scale for Customers’ Perceptions of Corporate Social Responsibility. Manag. Mark. 2015, 13, 311–332. [Google Scholar]
  9. Dahlsrud, A. How corporate social responsibility is defined: An analysis of 37 definitions. Corp. Soc. Responsib. Environ. Manag. 2008, 15, 1–13. [Google Scholar] [CrossRef]
  10. van Marrewijk, M. Concepts and Definitions of CSR and Corporate Sustainability: Between Agency and Communion. J. Bus. Ethics 2003, 44, 95–105. [Google Scholar] [CrossRef]
  11. Amini, M.; Bienstock, C.C. Corporate sustainability: An integrative definition and framework to evaluate corporate practice and guide academic research. J. Clean. Prod. 2014, 76, 12–19. [Google Scholar] [CrossRef]
  12. Asif, M.; Searcy, C.; Garvare, R.; Ahmad, N. Including sustainability in business excellence models. Total Qual. Manag. 2011, 22, 773–786. [Google Scholar] [CrossRef]
  13. Hallencreutz, J.; Deleryd, M.; Fundin, A. Decoding sustainable success. Total Qual. Manag. Bus. Excell. 2020. [Google Scholar] [CrossRef]
  14. Isaksson, R. Excellence for sustainability—Maintaining the license to operate. Total Qual. Manag. Bus. Excell. 2021, 32, 489–500. [Google Scholar] [CrossRef] [Green Version]
  15. Elkington, J. Cannibals with Forks: Triple Bottom Line of 21st Century Business; Capstone Publishing: Oxford, UK, 1999. [Google Scholar]
  16. Topfer, K. The triple bottom line economic. Soc. Nat. Cap. UN Chron. 2000, 36, 39–40. [Google Scholar]
  17. Walker, D.H.T. Client/customer or stakeholder focus? ISO 14000 EMS as a Construction Industry Case study. TQM Mag. 2000, 12, 18–26. [Google Scholar] [CrossRef]
  18. Hahn, T.; Pinkse, J.; Preuss, L.; Figge, F. Tensions in Corporate Sustainability: Towards an Integrative Framework. J. Bus. Ethics 2015, 127, 297–316. [Google Scholar] [CrossRef]
  19. Åhlfeldt, E. Hållbart Utvecklingsarbete i Organisationer—Användbart Begrepp eller Meningslös Floskel?: En Kunskapsöversikt och Begreppsanalys; Linköping University Electronic Press: Linköping, Sweden, 2019. [Google Scholar]
  20. Goodland, R.; Daly, H. Environmental Sustainability: Universal and Non-Negotiable. Ecol. Appl. 1996, 6, 1002–1017. [Google Scholar] [CrossRef]
  21. Dyllick, T.; Hockerts, K. Beyond the business case for corporate sustainability. Bus. Strategy Environ. 2002, 11, 130–141. [Google Scholar] [CrossRef]
  22. Basiago, A.D. Economic, social, and environmental sustainability in development theory and urban planning practice. Environmentalist 1998, 19, 145–161. [Google Scholar] [CrossRef]
  23. Kim, S.Y.; Park, H. Corporate Social Responsibility as an Organizational Attractiveness for Prospective Public Relations Practitioners. J. Bus. Ethics 2011, 103, 639–653. [Google Scholar] [CrossRef]
  24. Story, J.; Story, J.; Castanheira, F.; Castanheira, F.; Hartig, S.; Hartig, S. Corporate social responsibility and organizational attractiveness: Implications for talent management. Soc. Responsib. J. 2016, 12, 484–505. [Google Scholar] [CrossRef]
  25. Vishwanathan, P.; van Oosterhout, H.J.; Heugens, P.; Duran, P.; van Essen, M. Strategic CSR: A concept building meta-analysis. J. Manag. Stud. 2020, 57, 314–350. [Google Scholar] [CrossRef] [Green Version]
  26. Westin, L.; Parmler, J. Inclusion of CSR in the extended performance satisfaction index—New development. Total Qual. Manag. Bus. Excell. 2020. [Google Scholar] [CrossRef]
  27. Luo, X.; Bhattacharya, C.B. Corporate Social Responsibility, Customer Satisfaction, and Market Value. J. Mark. 2006, 70, 1–18. [Google Scholar] [CrossRef]
  28. Eklöf, J.; Hellström, K.; Malova, A.; Parmler, J.; Podkorytova, O. Customer perception measures driving financial performance: Theoretical and empirical work for a large decentralized banking group. Meas. Bus. Excell. 2017, 21, 239–249. [Google Scholar] [CrossRef]
  29. Eklöf, J.; Podkorytova, O.; Malova, A. Linking customer satisfaction with financial performance: An empirical study of Scandinavian banks. Total Qual. Manag. Bus. Excell. 2020, 31, 1684–1702. [Google Scholar] [CrossRef] [Green Version]
  30. Fornell, C. A National Customer Satisfaction Barometer: The Swedish Experience. J. Mark. 1992, 56, 6–21. [Google Scholar] [CrossRef]
  31. Eklof, J.; Westlund, A. The Pan-European Customer Satisfaction Index Programme-Current Work and the Way Ahead. Total Qual. Manag. 2002, 11, 1099–1106. [Google Scholar] [CrossRef]
  32. Ambec, S.; Lanoie, P. Does it pay to be green? A systematic overview. Acad. Manag. Perspect. 2008, 22, 45–62. [Google Scholar]
  33. Boons, F.; Montalvo, C.; Quist, J.; Wagner, M. Sustainable innovation, business models and economic performance: An overview. J. Clean. Prod. 2013, 45, 1–8. [Google Scholar] [CrossRef]
  34. Dixon-Fowler, H.; Slater, D.; Johnson, J.; Ellstrand, A.; Romi, A. Beyond “Does it Pay to be Green?” A Meta-Analysis of Moderators of the CEP–CFP Relationship. J. Bus. Ethics 2013, 112, 353–366. [Google Scholar] [CrossRef] [Green Version]
  35. Haffar, M.; Searcy, C. Classification of Trade-offs Encountered in the Practice of Corporate Sustainability. J. Bus. Ethics 2017, 140, 495–522. [Google Scholar] [CrossRef]
  36. Rodríguez-Olalla, A.; Avilés-Palacios, C. Integrating Sustainability in Organisations: An Activity-Based Sustainability Model. Sustainability 2017, 9, 1072. [Google Scholar] [CrossRef] [Green Version]
  37. Geisendorf, S.; Pietrulla, F. The circular economy and circular economic concepts—A literature analysis and redefinition. Thunderbird Int. Bus. Rev. 2018, 60, 771–782. [Google Scholar] [CrossRef]
  38. Lozano, R. Proposing a Definition and a Framework of Organisational Sustainability: A Review of Efforts and a Survey of Approaches to Change. Sustainability 2018, 10, 1157. [Google Scholar] [CrossRef] [Green Version]
  39. Muñoz, P.; Cohen, B. Sustainable Entrepreneurship Research: Taking Stock and looking ahead. Bus. Strategy Environ. 2018, 27, 300–322. [Google Scholar] [CrossRef]
  40. Wang, T.; Bansal, P. Social responsibility in new ventures: Profiting from a long-term orientation. Strateg. Manag. J. 2012, 33, 1135–1153. [Google Scholar] [CrossRef]
  41. Moisescu, O. From perceptual corporate sustainability to customer loyalty: A multi-sectorial investigation in a developing country. Econ. Res.-Ekon. Istraživanja 2018, 31, 55–72. [Google Scholar] [CrossRef]
  42. Wilson, M. Corporate Sustainability: What Is It and Where Does It Come from? Ivey Bus. J. 2003, 67, 1–5. Available online: http://wwwold.iveybusinessjournal.com/view_article.asp?intArticle_ID=405 (accessed on 8 February 2022).
  43. Schwartz, M.S.; Carroll, A.B. Integrating and unifying competing and complementary frameworks. Bus. Soc. 2008, 47, 148–186. [Google Scholar] [CrossRef]
  44. Churchill, G.A. A Paradigm for Developing Better Measures of Marketing Constructs. J. Mark. Res. 1979, 16, 64–73. [Google Scholar] [CrossRef]
  45. Brown, T.J.; Dacin, P.A. The Company and the Product: Corporate Associations and Consumer Product Responses. J. Mark. 1997, 61, 68–84. [Google Scholar] [CrossRef] [Green Version]
  46. UN General Assembly. Transforming Our World: The 2030 Agenda for Sustainable Development. A/RES/70/1. 21 October 2015. Available online: https://www.refworld.org/docid/57b6e3e44.html (accessed on 23 February 2022).
  47. Maignan, I. Consumer perception of corporate social responsibilities: A cross cultural comparison. J. Bus. Ethics 2001, 30, 57–72. [Google Scholar] [CrossRef]
  48. García de los Salmones, M.; Crespo, A.; Rodríguez del Bosque, I. Influence of corporate social responsibility on loyalty and valuation of services. J. Bus. Ethics 2005, 61, 369–385. [Google Scholar] [CrossRef]
  49. Turker, D. Measuring corporate social responsibility: A scale development study. J. Bus. Ethics 2009, 85, 411–427. [Google Scholar] [CrossRef]
  50. Öberseder, M.; Schlegelmilch, B.B.; Murphy, P.E.; Gruber, V. Consumers’ Perceptions of Corporate Social Responsibility: Scale Development and Validation. J. Bus. Ethics 2014, 124, 101–115. [Google Scholar] [CrossRef] [Green Version]
  51. Wagner, T.; Bicen, P.; Hall, Z.R. The dark side of retailing: Towards a scale of corporate social irresponsibility. Int. J. Retail Distrib. Manag. 2008, 36, 124–142. [Google Scholar] [CrossRef] [Green Version]
  52. Pérez, A.; del Bosque, I.R. Measuring CSR image: Three studies to develop and to validate a reliable measurement tool. J. Bus. Ethics 2013, 118, 265–286. [Google Scholar] [CrossRef]
  53. Knowles, T.; Macmillan, S.; Palmer, J.; Grabowski, P.; Hashimoto, A. The development of environmental initiatives in tourism: Responses from the London hotel sector. Int. J. Tour. Res. 1999, 1, 255–265. [Google Scholar] [CrossRef]
  54. Singh, J.; del Bosque, I.R. Understanding corporate social responsibility and product perceptions in consumer markets: A cross-cultural evaluation. J. Bus. Ethics 2008, 80, 597–611. [Google Scholar] [CrossRef]
  55. Maignan, I.; Ferrell, O.C.; Hult, G.T.M. Corporate citizenship: Cultural antecedents and business benefits. J. Acad. Mark. Sci. 1999, 27, 455–469. [Google Scholar] [CrossRef]
  56. Mobin, F.; Zillur, R.; Imran, K. Multi-Item Stakeholder Based Scale to Measure CSR in the Banking Industry. Int. Strateg. Manag. Rev. 2014, 2, 9–20. [Google Scholar] [CrossRef] [Green Version]
  57. Mandhachitara, R.; Poolthong, Y. A model of customer loyalty and corporate social responsibility. J. Serv. Mark. 2011, 25, 122–133. [Google Scholar] [CrossRef]
  58. Hair, J.; Hult, G.T.M.; Ringle, C.M.; Sarstedt, M. A Primer on Partial Least Squares Structural Equation Modeling (PLS-SEM), 2nd ed.; SAGE Publications: Thousands Oaks, CA, USA, 2016. [Google Scholar]
  59. Tenenhaus, M. Component-based Structural Equation Modelling. Total Qual. Manag. Bus. Excell. 2008, 19, 871–886. [Google Scholar] [CrossRef]
  60. Sanchez, G. PLS Path Modeling with R Trowchez Editions; UC Berkeley: Berkeley, CA, USA, 2013. [Google Scholar]
  61. Bollen, K.A. Structural Equations with Latent Variables; Wiley: New York, NY, USA, 1989. [Google Scholar]
  62. Kaplan, D. Structural Equation Modeling: Foundations and Extensions; Sage: Thousands Oaks, CA, USA, 2000. [Google Scholar]
  63. Hallencreutz, J.; Parmler, J. Important drivers for customer satisfaction—From product focus to image and service quality. Total Qual. Manag. Bus. Excell. 2019, 32, 1–10. [Google Scholar] [CrossRef]
  64. Morard, B.; Simonin, D. Partial Least Squares Modeling in Marketing Research: A Tailor-Made Model of Wine e-Commerce Consumers in Switzerland. J. Econ. Bus. Manag. 2016, 4, 410–417. [Google Scholar] [CrossRef]
  65. Bayol, M.; de la Foye, A.; Tellier, C.; Tenenhaus, M. Use of PLS Path Modelling to estimate the European Consumer Satisfaction Index (ECSI) model. Stat. Appl.-Ital. J. Appl. Stat. 2000, 12. Available online: https://www.researchgate.net/publication/267718888_Use_of_PLS_Path_Modelling_to_estimate_the_European_Consumer_Satisfaction_Index_ECSI_model/citation/download (accessed on 8 February 2022).
  66. Dunaetz, D. Research Methods and Survey Applications: Outlines and Activities from a Christian Perspective; Martel Press: Kalisz, Poland, 2017. [Google Scholar]
  67. Hair, J.; Howard, C.; Nitzl, C. Assessing measurement model quality in PLS-SEM using confirmatory composite analysis. J. Bus. Res. 2020, 109, 101–110. [Google Scholar] [CrossRef]
  68. Trochim, W. The Research Methods Knowledge Base. Available online: https://conjointly.com/kb/ (accessed on 4 February 2022).
  69. Nunnally, J.C. Psychometric Theory, 2nd ed.; McGraw-Hill: New York, NY, USA, 1978. [Google Scholar]
  70. Kock, N.; Lynn, G.S. Lateral collinearity and misleading results in variance-based sem: An illustration and recommendations. J. Assoc. Inf. Syst. 2012, 13, 546–580. [Google Scholar] [CrossRef] [Green Version]
  71. Greene, W. Econometric Analysis, 7th ed.; Prentice Hall: Upper Saddle River, NJ, USA, 2012. [Google Scholar]
  72. Taber, K. The Use of Cronbach’s Alpha When Developing and Reporting Research Instruments in Science Education. Res. Sci. Educ. 2018, 48, 1–24. [Google Scholar] [CrossRef]
  73. Rossiter, J.R. The C-OAR-SE procedure for scale development in marketing. Int. J. Res. Mark. 2002, 19, 305–335. [Google Scholar] [CrossRef] [Green Version]
Figure 1. Conceptual layout of the PLS-PM setup in the Customer model. Circles indicate latent variables and arrows display the direction of the proposed casual structure. The manifest model is found in Appendix B.
Sustainability 14 03505 g001
Figure 2. Displays the estimated loadings as well as structural path model results in the Customer model PLS setup. Circles indicate latent variables and manifest items are shown by boxes. ** indicates significance paths at p-value < 0.01.
Sustainability 14 03505 g002
Table 1. Churchill’s techniques for developing measures of market constructs and adoptions used in the paper.
Procedure StepTechniques RecommendedTechniques Used in Paper
1. Specify the domain of constructLiterature searchLiterature search
2. Generate sample of itemsLiterature search, focus group, critical incidents, insight-simulating examplesLiterature search, panel of experts
3. Collect data Survey data from the EPSI database
4. Purify measureFactor analysis, coefficient alphaConvergent reliability, composite reliability, coefficient alpha
Table 2. SD item, source of its adaptation, and proposed TBL dimension.
DimensionItemAdaptation
EconomicPursues long term success/activity.[2,8,47,48]
EnvironmentalTries to offer services that are compatible with the environment.[49,50,51,52,53]
EnvironmentalDoes everything possible to eliminate or reduce the negative effects on the environment.[49,50,54]
EnvironmentalReduces its consumption of natural resources.[2,53]
EnvironmentalStrives to minimise the consumption of resources that affect the natural environment (negative).[8,41,49]
SocialWorking to prevent child labour and unfair working conditions.[51,54]
SocialImproving the general well-being of society.[47,48,55,56]
SocialTreat their employees without prejudice with regard to their gender, ethnicity, and religion.[2,46,50,51,52,54]
SocialActively work to improve the equality within the organisation.[47,50,57]
Economic/SocialCreates and sustains jobs in the region.[2,8,50]
Economic/SocialContributes to limiting poverty.[46,50,51]
Table 3. Sample profile.
Age
18–29 years8%
30–44 years27%
45–59 years33%
60+ years33%
Gender
Woman46%
Man54%
Education
Basic/elementary/secondary4%
Upper secondary school/high school35%
Post-secondary education15%
University45%
Don’t know/Do not want to answer0%
Table 4. Pearson correlation table over all SD items used in the paper. All correlations coefficients are significant and have p-value < 0.01.
Pursues Long Term Success/Activity.1
Tries to offer services that are compatible with the environment.0.641
Does everything possible to eliminate or reduce the negative effects on the environment.0.710.771
Reduces its consumption of natural resources.0.600.830.801
Strives to minimise the consumption of resources that affect the natural environment (negative).0.630.850.810.881
Working to prevent child labour and unfair working conditions.0.560.700.630.720.731
Improving the general well-being of society.0.750.750.860.720.740.611
Treat their employees without prejudice with regard to their gender, ethnicity, and religion.0.530.600.500.590.610.720.541
Actively work to improve the equality within the organisation.0.570.690.610.660.700.840.620.811
Creates and sustains jobs in the region.0.530.680.580.650.650.660.590.630.691
Contributes to limiting poverty.0.510.770.690.760.730.690.640.530.660.691
SDI 10.690.830.790.840.880.720.760.610.710.660.731
SDI 20.650.750.720.760.770.690.690.590.640.630.740.821
SDI 30.700.830.790.820.840.730.790.660.710.680.760.870.851
Table 5. Summary statistics of latent variables in the Customer model.
Latent VariableMeanStandard DeviationRangeStandard Error of Mean
SDI56.220.81000.8
Image68.220.71000.8
Expectations74.220.21000.8
Service quality58.522.41000.9
Product quality72.119.51000.8
Perceived value64.321.41000.9
Customer satisfaction63.920.41000.8
Customer loyalty66.224.01001.0
Table 6. Validity and reliability analysis of latent variables in the Customer model.
Latent VariableItem NameLoadingCronbach AlphaComposite ReliabilityAVE1st Eigenvalue2nd Eigenvalue
SDI10.910.910.940.852.560.26
SDISDI20.91
SDI30.94
Image10.900.900.930.832.480.30
ImageImage20.90
Image30.93
ExpectationsExpect10.940.870.930.892.480.30
Expect20.94
SQ10.910.920.940.803.220.35
Service qualitySQ20.92
SQ30.87
SQ40.88
Product qualityPQ10.940.810.900.841.680.32
PQ20.90
PV10.940.900.940.832.500.34
Perceived valuePV20.94
PV30.86
CSI10.920.910.940.852.540.25
Customer satisfactionCSI20.91
CSI30.92
Loy10.920.930.960.892.670.22
Customer loyaltyLoy20.95
Loy30.96
Table 7. Correlation table combined with bold marked values of the Fornell–Larcker criterion in the diagonal.
SDI0.92
Image0.580.91
Expectations0.460.640.94
Service quality0.610.790.570.90
Product quality0.470.770.570.690.92
Perceived value0.560.810.580.800.770.91
Customer satisfaction0.610.870.610.820.770.860.92
Customer loyalty0.580.790.560.760.690.820.870.94
Table 8. Customer model path results.
Pathβ95 CIR2T-Valuep-Value
SDI -> Image0.58(0.51, 0.64)33%17.30.00
SDI -> Expectations0.46(0.38, 0.53)21%12.60.00
SDI -> Product quality0.47(0.40, 0.54)22%13.00.00
SDI -> Service quality0.61(0.55, 0.68)37%18.90.00
SDI -> Perceived value0.56(0.50, 0.63)32%16.70.00
SDI -> Customer satisfaction0.61(0.54, 0.67)37%18.80.00
SDI -> Customer loyalty0.59(0.52, 0.65)34%17.70.00
Table 9. Bivariate correlation table of SD items towards the score of SDI.
DimensionVariablesPearson Correlation <-> SDI95 CIR2p-Value
EconomicPursues long term success/activity.0.71(0.66, 0.75)50%0.00
EnvironmentalTries to offer services that are compatible with the environment.0.84(0.81, 0.86)71%0.00
EnvironmentalDoes everything possible to eliminate or reduce the negative effects on the environment.0.80(0.76, 0.83)64%0.00
EnvironmentalReduces its consumption of natural resources.0.84(0.81, 0.87)71%0.00
EnvironmentalStrives to minimise the consumption of resources that affect the natural environment (negative).0.87(0.85, 0.89)76%0.00
SocialWorking to prevent child labour and unfair working conditions.0.75(0.71, 0.78)56%0.00
SocialImproving the general well-being of society.0.78(0.74, 0.81)60%0.00
SocialTreat their employees without prejudice with regard to their gender, ethnicity, and religion.0.65(0.60, 0.70)43%0.00
SocialActively work to improve the equality within the organisation.0.72(0.68, 0.76)52%0.00
Economic/SocialCreates and sustains jobs in the region.0.69(0.64, 0.73)47%0.00
Economic/SocialContributes to limiting poverty.0.78(0.74, 0.81)61%0.00
Table 10. Regression results divided by industrial segments. SDI is treated as the independent variable regressed against the dependent variable, customer satisfaction.
IndustrySDI -> Customer Satisfaction
β
95 CIR2p-Value
Total0.61(0.54, 0.66)37%0.00
Bank0.60(0.50, 0.70)44%0.00
Telecom0.45(0.29, 0.60)19%0.00
Insurance0.63(0.49, 0.76)37%0.00
Energy0.74(0.62, 0.84)50%0.00
Publisher’s Note: MDPI stays neutral with regard to jurisdictional claims in published maps and institutional affiliations.

