1. Introduction
The outbreak of COVID-19 disease has necessitated a high demand of online learning techniques. It means that Information Technology (IT) will continue to play a vital role in our lives, and education is one of the major industries that has been impacted by IT [
1]. As a result, e-learning has become one of the most popular approaches, with academic institutions and universities increasingly utilizing it. E-learning is a method of supporting and facilitating learning that uses computer and communication technologies [
2]. In this study, we analyze how the Modular Object-Oriented Dynamic Learning Environment (Moodle) and Learning Analytics Plug-ins are used to analyze students’ learning performance. This paper discusses Learning Management Systems, Moodle LMS and how it affects the learning culture in Muscat College. The details of LA after analyzing the data collected, along with the benefits of Learning Analytics and its different types, are also discussed briefly. The description of how Moodle logs support Learning Analytics is shown. Furthermore, brief details of LA plug-Ins like SmartKlass, local plug-ins, and log stores are provided. This paper applied Object-Oriented Programming to the course as a case study. After integrating the plug-ins, different analytics reports taken from Moodle are discussed in the Results and Discussion sections. The contributions made in this study are as follows:
This paper discusses learning management systems, moodle and Learning Analytics (LA).
We have used logs in Moodle to support LA along with LA plug-ins.
The research demonstrates students’ interaction in the courses using two courses as samples from 50 students.
Finally, the analysis has been done, proving that the learning management system described in this paper can be used by teachers and departments for better academic progression.
The outline of the rest of the article is as follows: in
Section 2, we have discussed the literature review which encompasses the Learning Management Systems. In
Section 3, we presented the methodology that analyzed two sample courses of 50 students. In
Section 4, we have itemized and presented our Findings through Learning Analytics.
Section 5 details our discussion on actual implementation and results. Finally,
Section 6 concludes the study.
2. Literature Review
2.1. Learning Management System
Learning Management System (LMS) is a software application designed to manage, track, report, and deliver educational courses and materials [
3]. As an extension of learning, LMS allows users to retrieve details from any location [
4]. With the steady growth in online learning activities, it is becoming increasingly important for educators to collect relevant data to monitor their students’ progress. LMS improves the efficiency of educational processes in higher education institutions. LMS are software systems designed to assist learners in courses, whether in traditional face-to-face (physical) classrooms or virtual classrooms [
5]. There are two categories of LMS, namely: Commercial Software and Open-Source Software. Moodle comes under the open-source category, while Blackboard is an example of commercial software. Commercial software systems are extremely powerful, but they come with exorbitant licensing fees [
6], which most academic institutions and universities cannot afford. Open-source software is free on the other hand, and thus, cost-effective.
2.2. Moodle
Moodle is one of the most popular open-source LMS. Moodle is designed with PHP programming language under the GNU General Public License. Martin Dougiamas created Moodle to assist educators in creating online courses. It is focused on interaction and associated content creation. It is an opponent to Commercial LMS. It is generally the first LMS selected when an integrated, stable e-learning system requires no license costs. Moodle records all information regarding the interactions of students who use it. This log data provides information on how and when students accomplish tasks such as visits, quizzes, assignments, forum conversations, course perspectives, etc. Moodle LMS offers a great degree of flexibility and scalability, allowing it to be adapted to meet the needs of small, medium, and large academic institutions, which vary from school to university [
7].
2.3. Learning Analytics
With more online learning activities, it is becoming increasingly necessary for educators to collect relevant and reliable data from these activities to evaluate their students’ progress. However, several existing analytics mechanisms on the market may not provide educators with reliable and relevant data to help them assess the interactions of their students. The LA mechanism is intended to reflect the learners’ achievement of outcomes and rapid continuous development in the delivery and assessment technique [
8]. As a result, it is crucial to create a mechanism that shows accurate data to learners, educators, and other stakeholders, thereby improving overall learning outcomes.
The process of examining raw data to determine its knowledge is known as Data Analytics. Learning Analytics may provide valuable insights to users to help them plan and take action [
9]. There are four types of Learning Analytics: Descriptive Analytics, Diagnostic Analytics, Predictive Analytics, and Prescriptive Analytics [
10].
Descriptive Analytics supports the demonstration of the worth of assessed metrics and its occurrence during a particular phase. It also analyzes raw data from many sources to provide historical context. By including Descriptive Analytics into the LA mechanism, instructors will better recognize the interactions of learners and perceive any problems.
Diagnostic Analytics is the next level of data analysis intricacy. It allows the analyst to dig down and find the fundamental cause while analyzing descriptive data. It provides thorough perception of a specific problem and the reasons for its occurrence.
Predictive Analytics is a type of advanced analytics that offers several benefits, including sophisticated machine learning and deep learning as performed in [
11,
12,
13,
14]. It is a proactive strategy that allows forecasts, i.e., it aids in predicting what will most likely occur. Predictive analytics uses descriptive and diagnostic analytics findings to discover clusters to predict a future event.
Prescriptive Analytics is a type of advanced analytics that uses machine learning and algorithms to recommend a course of action for preventing a future problem.
2.4. Moodle Logs to Support Learning Analytics
Logs in Moodle are activity reports. Moodle creates a lot of data when staff and students engage with it. Some of this information is publicly available and may be downloaded for additional analysis to better understand student motivation and performance. Moodle allows you to download many sorts of reports for this purpose. Users can see and download these reports with permission to edit or perform higher tasks on them. Moodle keeps track of the site and course activity [
15].
Course Activity Log: An instructor could keep track of the activity in a course. The teacher can see what pages the users visited, when and how they visited them, their IP address, and their behaviors (view, add, update, and delete).
Site Activity Log: A site administrator can create a site activity log. All actions, site news, or site problems, such as unsuccessful login attempts, may be seen in this log at all levels.
Even though Moodle’s log data may be filtered using the reporting function, the resulting information is insufficient to offer helpful information about the course and the student’s performance. As a result, extracting this log data and turning it into usable knowledge is necessary, which is a challenging process.
2.5. Learning Analytics Plug-Ins
To add more functionality to Moodle, separate Plug-Ins software can be added as per requirement. Different Plug-ins are available in various versions of Moodle for other purposes (
https://docs.moodle.org/dev/Plugin_types accessed on 24 December 2021). Plug-ins help get an overview of relevant metrics such as student engagement time and student interaction with specified activities. Learner satisfaction, academic progression insight, and preferences of learning activities, etc., can be derived from this analysis. Many Plug-ins are available for integrating with Moodle. The most popular plug-ins are IntelliBoard, SmartKlass, My Feedback, Log Store, etc.
2.6. SmartKlass Plug-In
SmartKlass is a Moodle dashboard for Learning Analytics [
16] that could be incorporated into the Moodle virtual learning platform to allow teachers monitor their students’ learning journeys. An external contributor named IntelliBoard [
17] created this Learning Analytics plug-in for analytic and reporting services to education communities by analyzing students’ behavioral data. This Moodle local add-on works with Moodle 2.4 to 3.0 and collects user interactions with the platform using the xAPI 1.0 standard. The technology analyzes the statements using machine learning algorithms and builds dashboard analysis with consolidated user information. It enables students to view their performances, see the evolution of the course, and receive or send alert messages.
SmartKlass consists of a strategic management module for professors, students, and institutions. Indeed, the objective of this plug-in is to transmit to the students their progress and help the professors in the analysis of the behavior of a group or a particular student to improve and personalize the activities of the course training. The institution will be able to consult this data to obtain an overview of the evolution of the various training paths. Although this dashboard transmits some information on the use of the LMS platform, such as the number of statements generated per day, showing the busy days on the platform, or the total number of courses, it is not however not oriented towards an analysis of relevant metrics for the administrator part, but more towards a form of analysis on the evolution of the learning of the learners.
This plug-in allows a rich picture of the evolution of students in an online course by studying their behavioral data:
It assists teachers in identifying students who are falling behind.
It helps teachers identify students for whom the topic is not demanding enough.
It assists teachers in comparing participation and outcomes across courses.
This plug-in gives information to the teacher so that they can make direct contact with the students, assign specific content, promote engagement, or provide extra instruction.
It assists teachers by assisting students, i.e., students can learn about their performance and compare it to the group.
2.7. IntelliBoard
Even though IntelliBoard is not specially built for Moodle, this reporting plug-in works with the most popular LMS. The single dashboard provides graphical views of data and custom reports [
17]. Admin reports, notifications, learner access rate, etc. are supplied from the analysis. The learner can use this for self-assessment by comparing their progress against course completion. Teachers and admins can track the course activities and acceptance among learners. Role-based reports and customization options are the features of this plug-in, although it is expensive.
2.8. My Feedback
A free plug-in, My Feedback, lets students overview their grades and view feedback on assignments. It is a simple plug-in aimed at improving student learning by helping them understand their possible areas of improvement. Teachers, admins, and personal tutors can also see student feedback reports on Moodle or Turnitin assignments, workshops, quizzes, and grade items in the Gradebook.
2.9. Log Store Learning Analytics for Moodle
This LA consists of two plug-ins: Local Learning Analytics are used for user interface and Log Store Analytics, which logs the events to the database.
3. Methodology
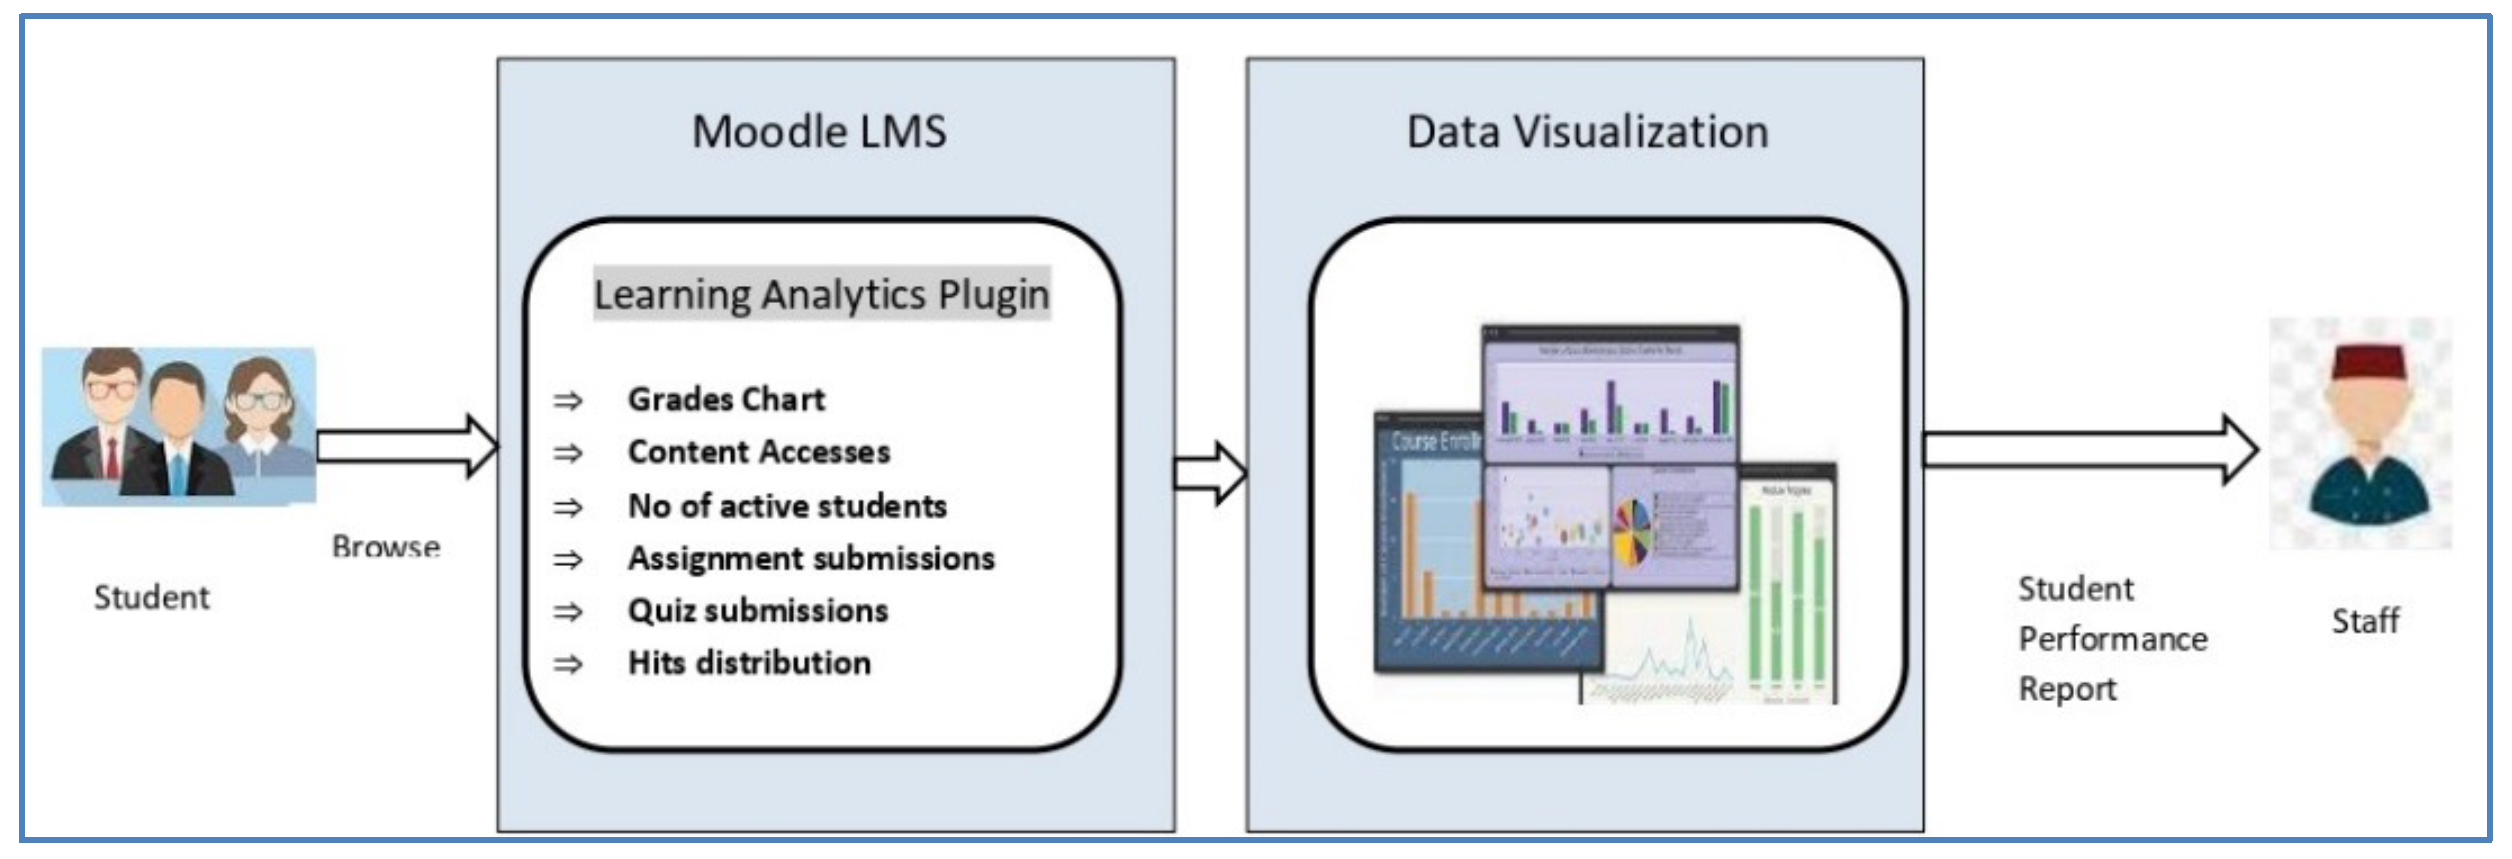
Muscat College introduced the Moodle Mobile App for learning as a part of the Virtual Learning Environment (VLE) during the COVID-19 pandemic. Initially, the student community had complaints with the usage of Moodle LMS when learning started off-campus. The main reason this has been reported to concern teachers/mentors by students is that they find difficulty in browsing Moodle through a mobile browser instead of PCs. Due to the insufficiency of laptops at home for each family member, they faced obstacles in the student learning process, despite educators giving them repeated attempts at quizzes and other assignments. Hence, this study is the increased interest of our students in learning by using Logstore Learning Analytics for Moodle. This plug-in helps identify students that are lagging, as well as students for which the course content is not challenging enough. Our motivation is thus to provide a higher quality of study conditions and materials for our students as per their interaction. We aim for a constant improvement of academic progress through these mechanisms. This methodology is depicted in
Figure 1.
Data Collection
This table consists of the time the action was performed, the user and name of the user, types of action, the course the user acted on, origin of the login (Browser/App), and the computer’s IP address the user used, etc. This table is of utmost importance for understanding the interface of student login and what the users are doing with the system. Moreover, the Course Activity Report (Object-oriented programming) of the Bachelor’s degree program has been analyzed to understand the activities of students, such as how many times they have accessed Moodle, which action is most interacted by the students, etc.
4. Results: Findings through Learning Analytics
- 1.
The number of users was analyzed to understand student interaction with Moodle LMS. We have considered two courses for observation. The course Object-oriented Programming is with 12 students, and another course Data Communication Network has 38 students. It was observed that students prefer video materials than the test files. Another observation is that folders are lesser accessed than files.
- 2.
Students’ login attempt were analyzed based on the type of assessment used by students to interact with Moodle LMS.
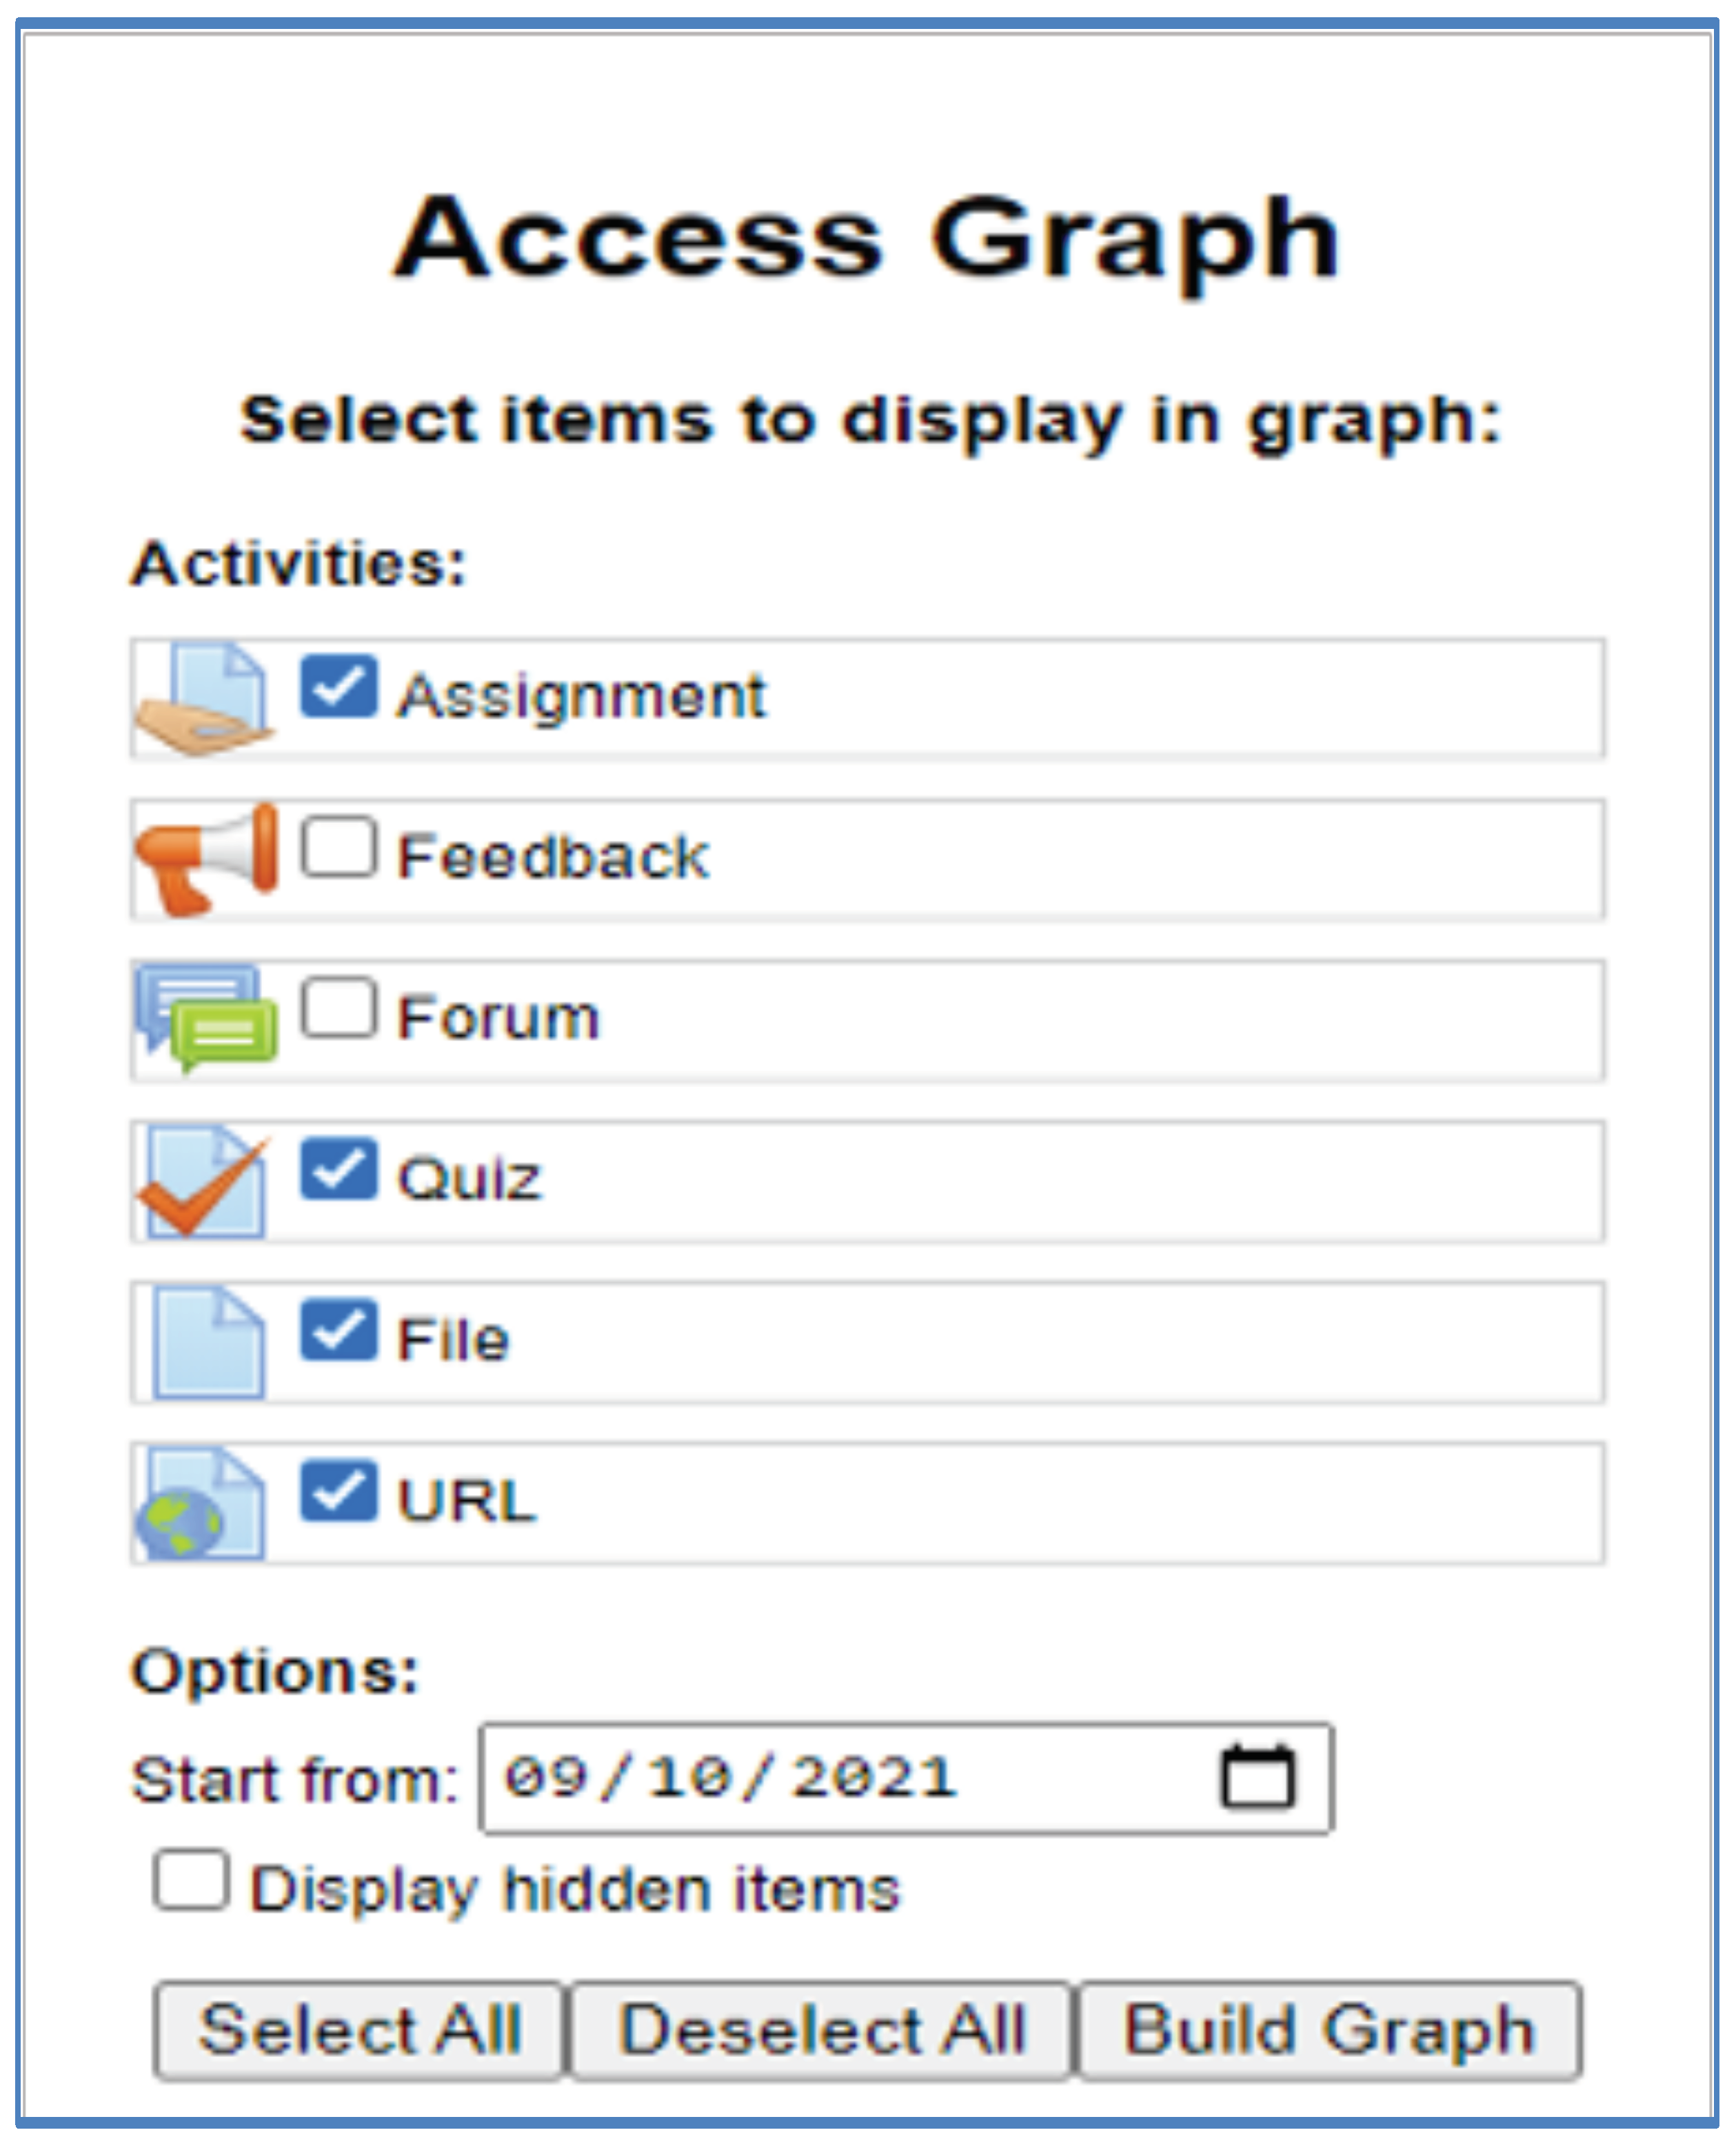
Figure 2 demonstrates the distribution of access to the contents graph, which shows the distribution of quantitative data. The course activity log clearly shows the distribution of access to different contents such as assessments, lecture notes, forums, other URLs, etc. The overall graph explains what type of content the students are interested in. In addition to that, the distribution of access to each content also can be taken using the ‘Build the Graph’ option in the Plug-in. This implies the acceptability rate of each range. As per this analysis, teachers can provide more simple and easily accessed supporting activities. In one observation, forums give more opportunity for student-teacher interaction. This analysis helps teachers identify students’ interests and improve the quality of teaching and academic progression of that class.
- 3.
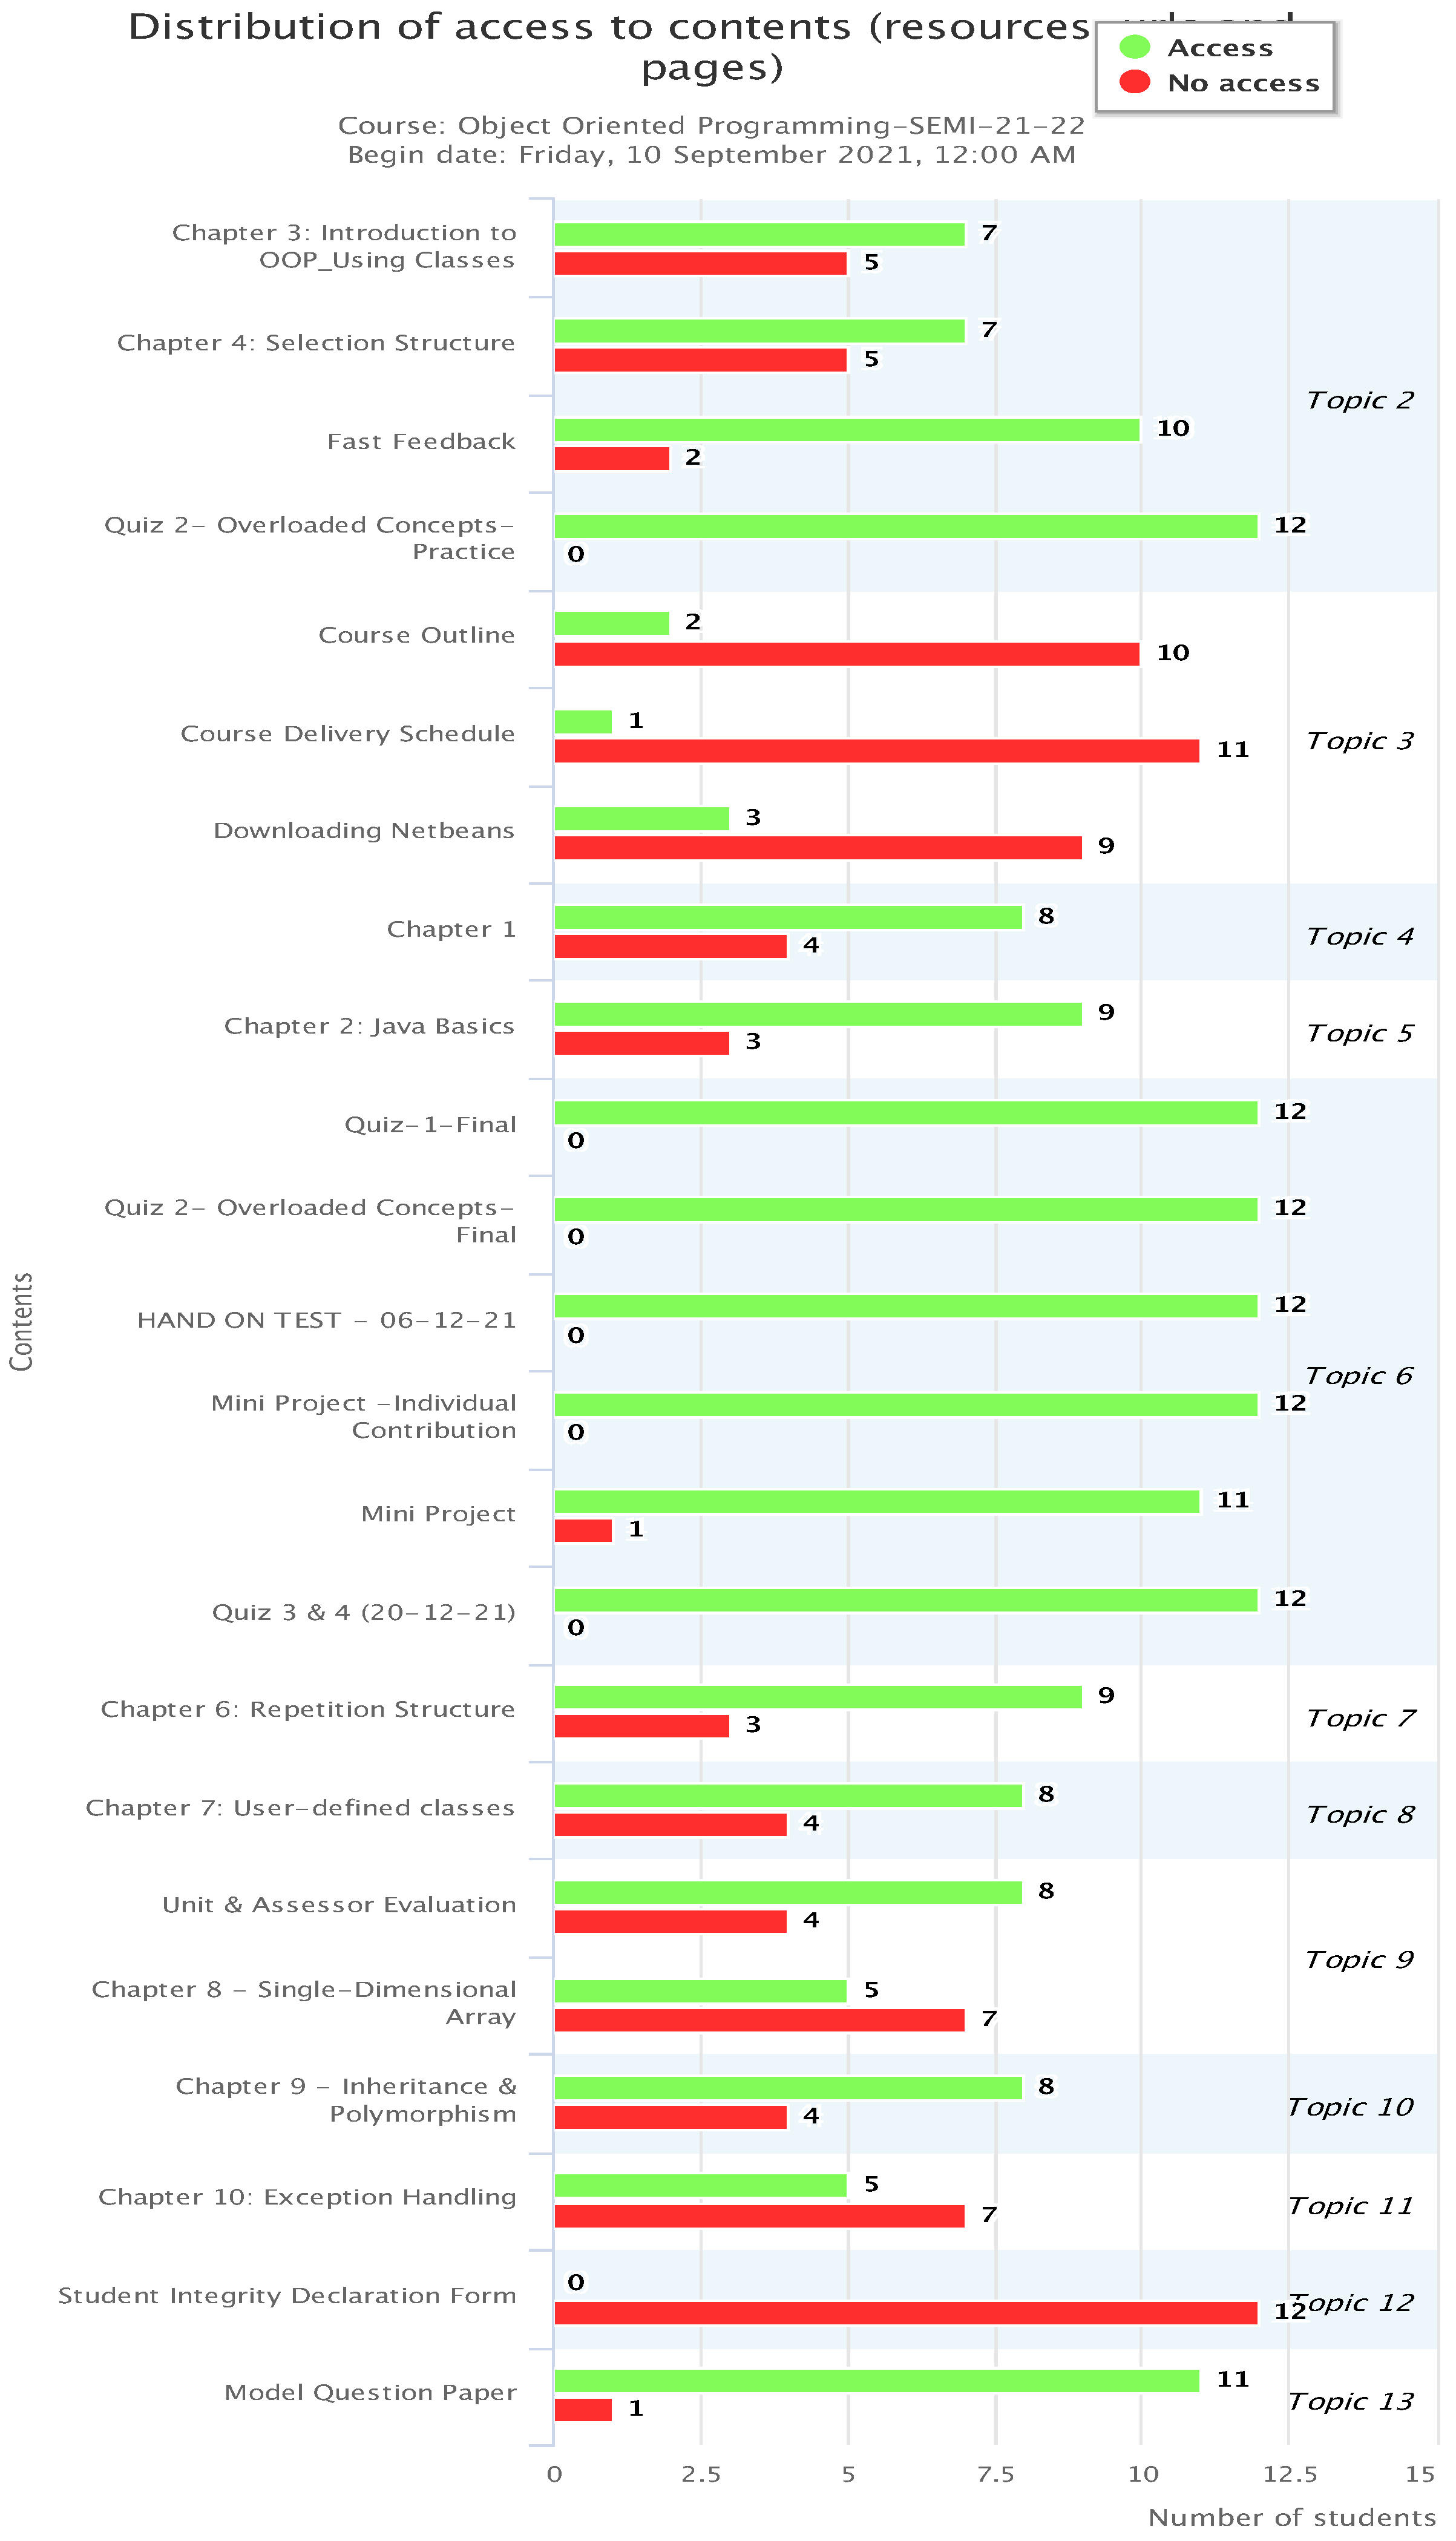
The distribution of access to the contents is shown in
Figure 3. This analysis indicates that the distribution of entries is different for various ranges; 10 students access the course outline, while 11 students access the course delivery schedule, only 9 students downloaded Netbeans, and 8 students compiled Java programming. All students have participated in Quizs and accessed Chapters 9 and 10. In the course DCN, it is observed that 22 students out of 38 had accessed the course outline while 20 students accessed the course delivery schedule. All students in DCN download the chapters. All students in DCN attempted the assessment. The teachers and department can conclude that class of DCN is a good team of students, and their academic progression will be very good. In contrast, the academic progression of the class Object-oriented Programming will need more students’ efforts. Accordingly, departments and teachers can plan improved mechanisms to increase academic progression.
- 4.
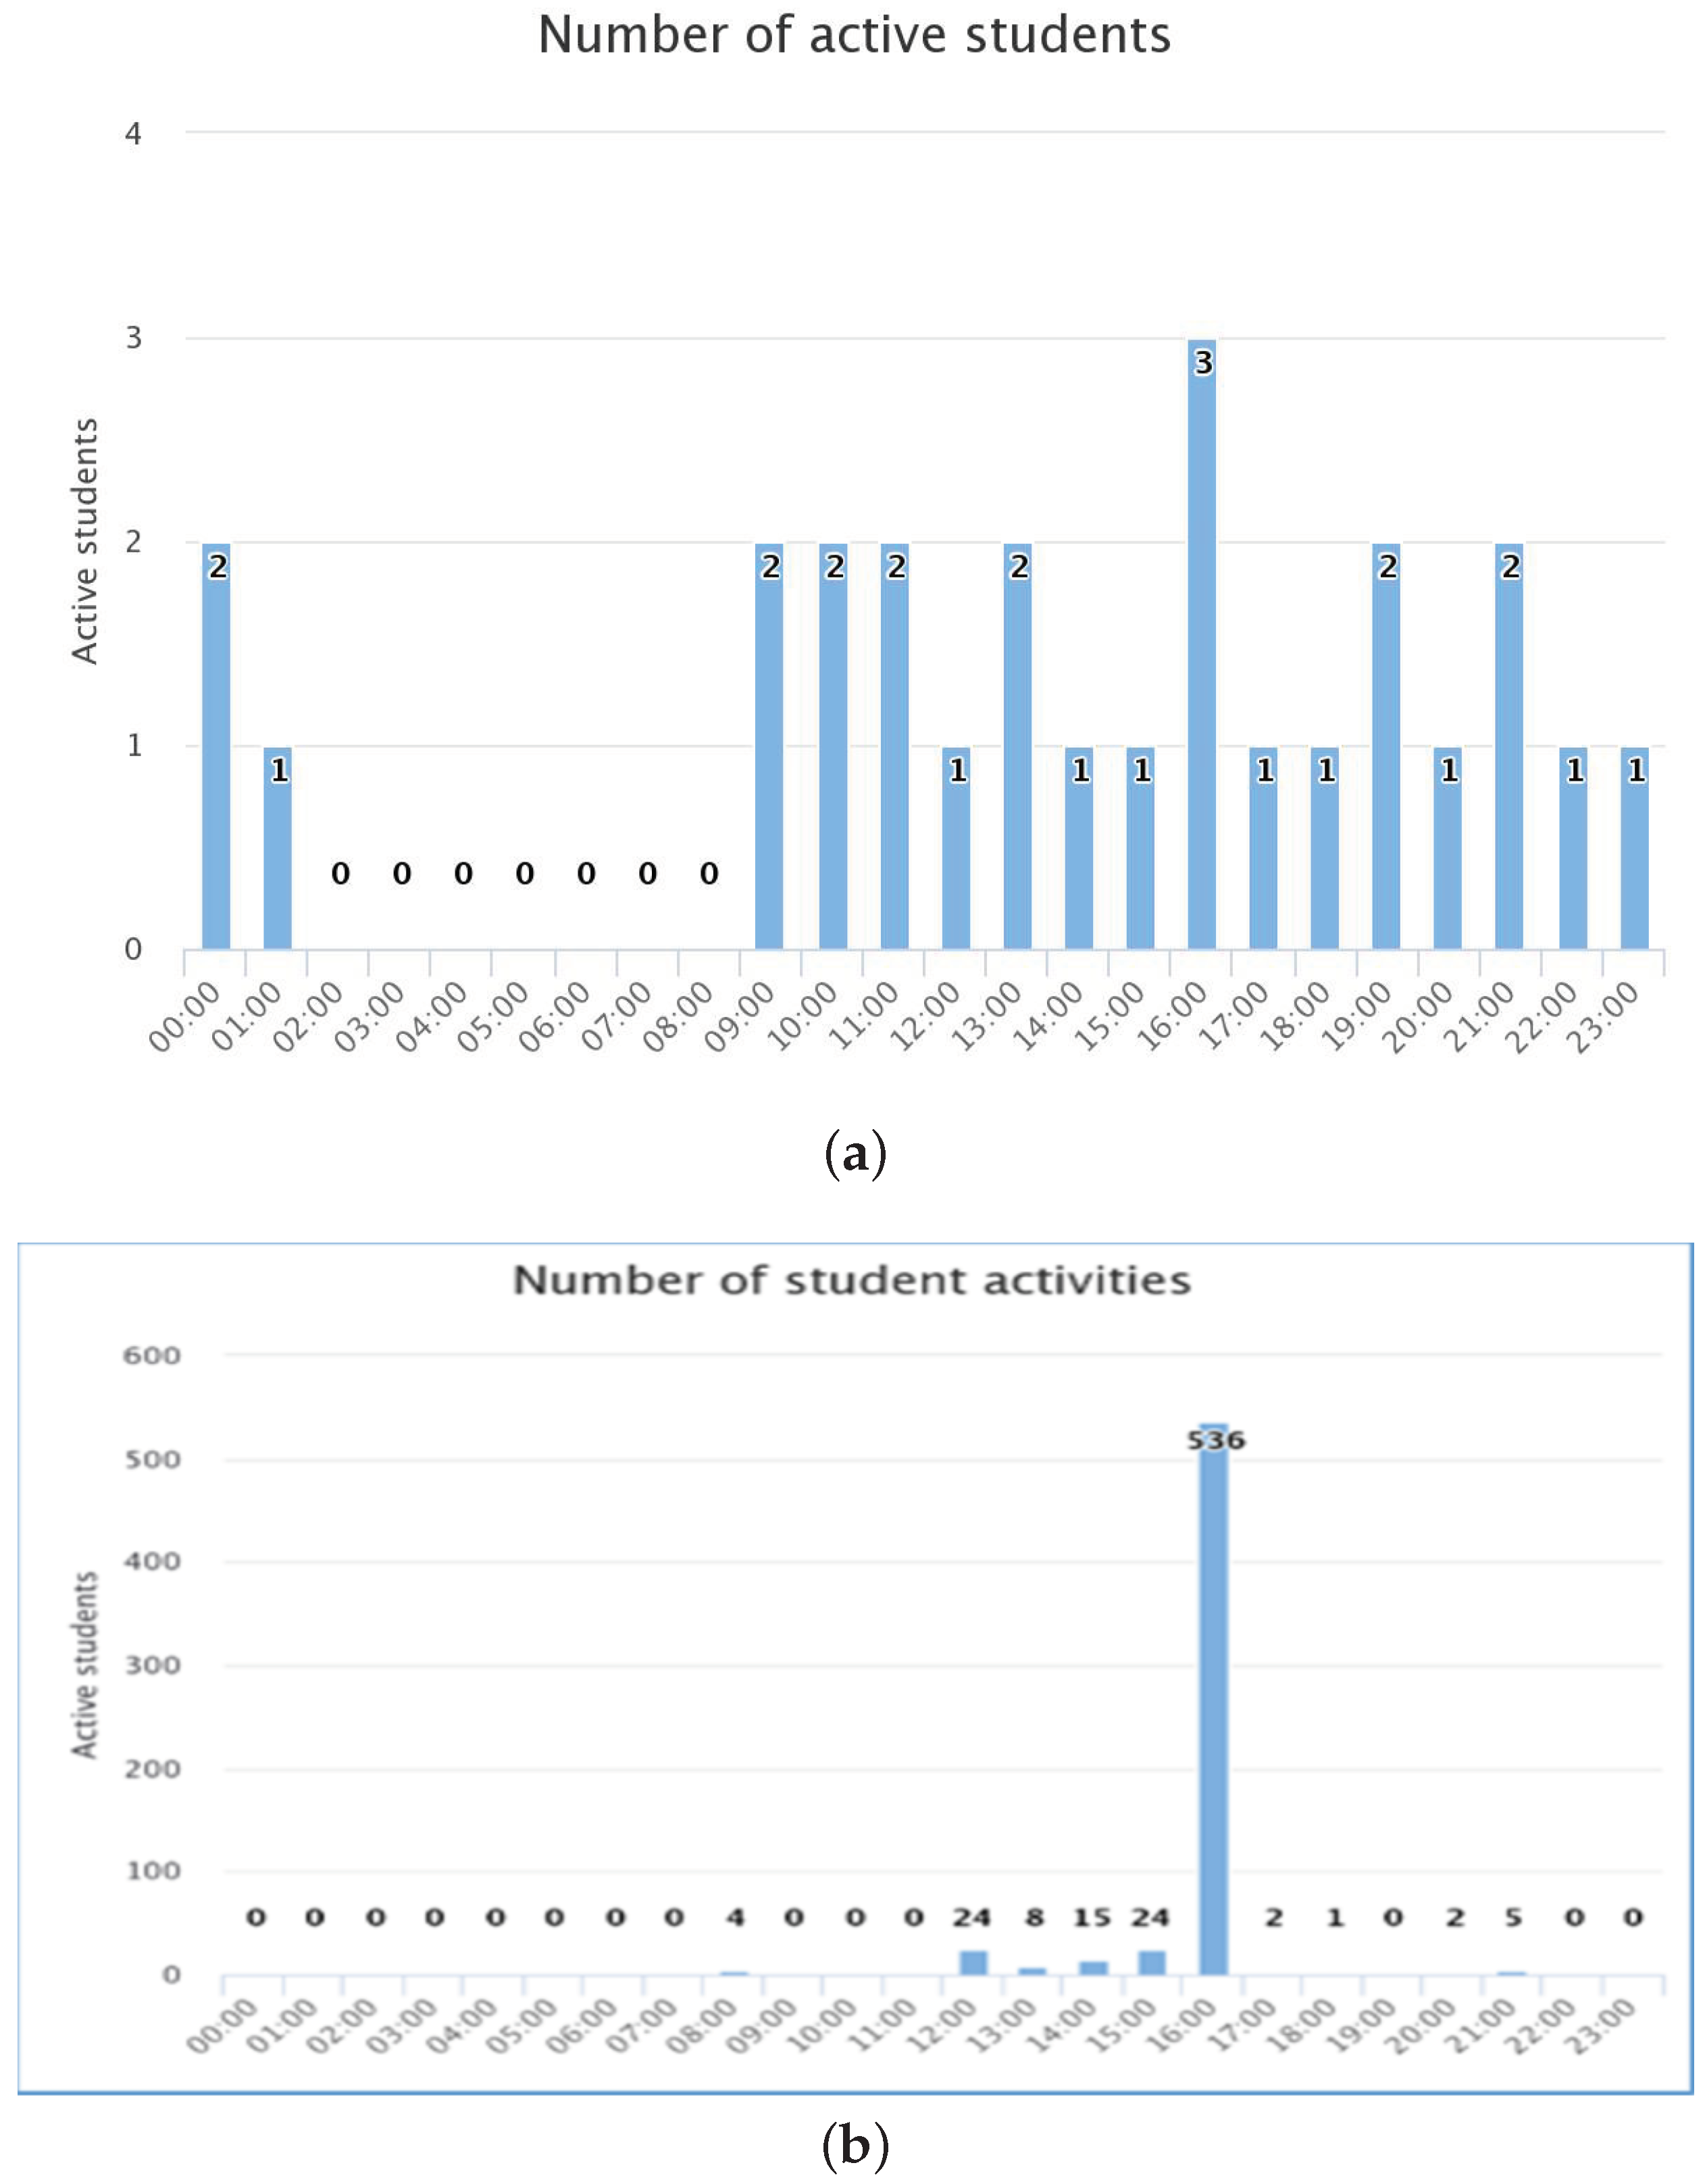
Also, Based on the Course Activity log, student interaction with courses has been measured for two months, starting from September 2021 to November 2021. The regression analysis using plots was conducted separately for the course with Moodle LMS.
Figure 4 shows the number of students who have accessed Moodle.
Figure 4a shows the number of active students who accessed the Moodles and
Figure 4b shows the number of student activities in the Moodle. The observation was made on two courses, Object-Oriented Programming and Data Communication Network. Getting an idea about the number of active students in a class helps teachers and departments plan the improvement needed for better academic progression.
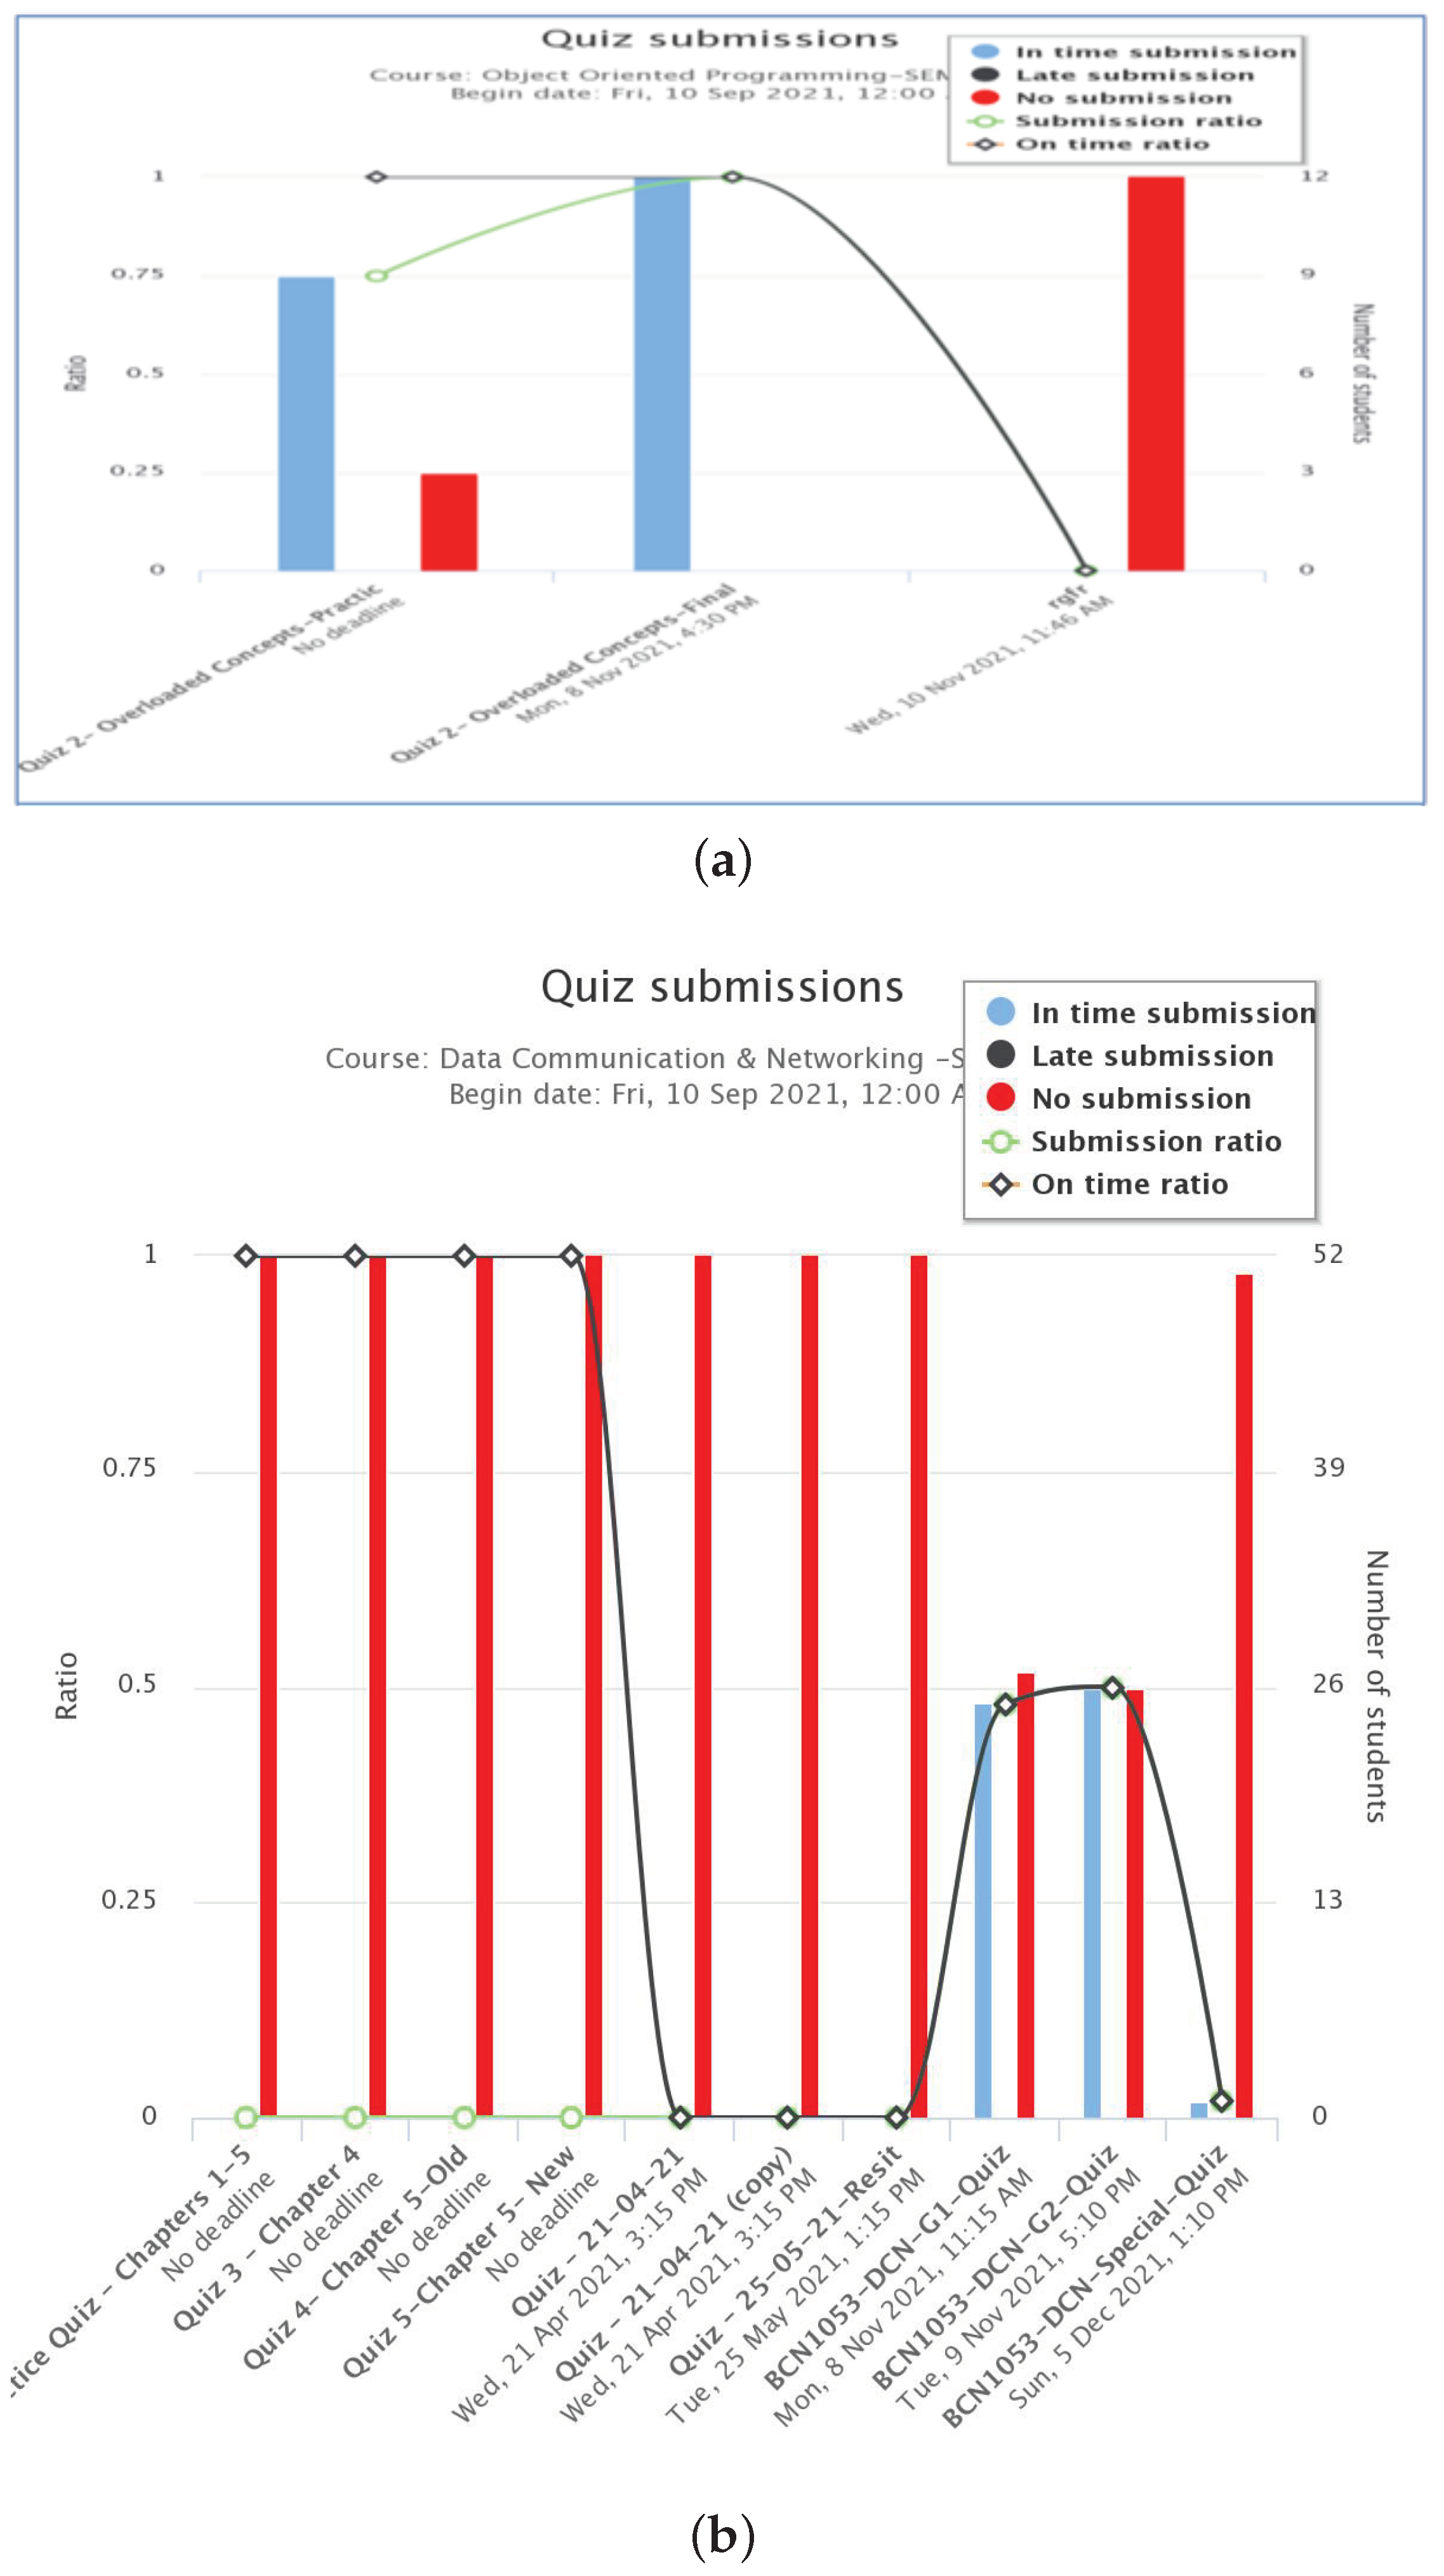
- 5.
This plug-in can also analyze different types of accessing rates per assessment.
Figure 5 reveals how many quiz submissions are on time, and how many have submitted late.
Figure 5a shows the quizzes submitted, while
Figure 5b reveals the ratio of those submitted on time as well as late submissions. This analysis helps to put proper grades for course work. Different assessment’s submission graphs can be analyzed, which allows teachers to understand the trend of submission of the class so that they can plan the schedule of further deadlines of the assessments. This helps teachers and departments take precautions from students being absent for the evaluations.
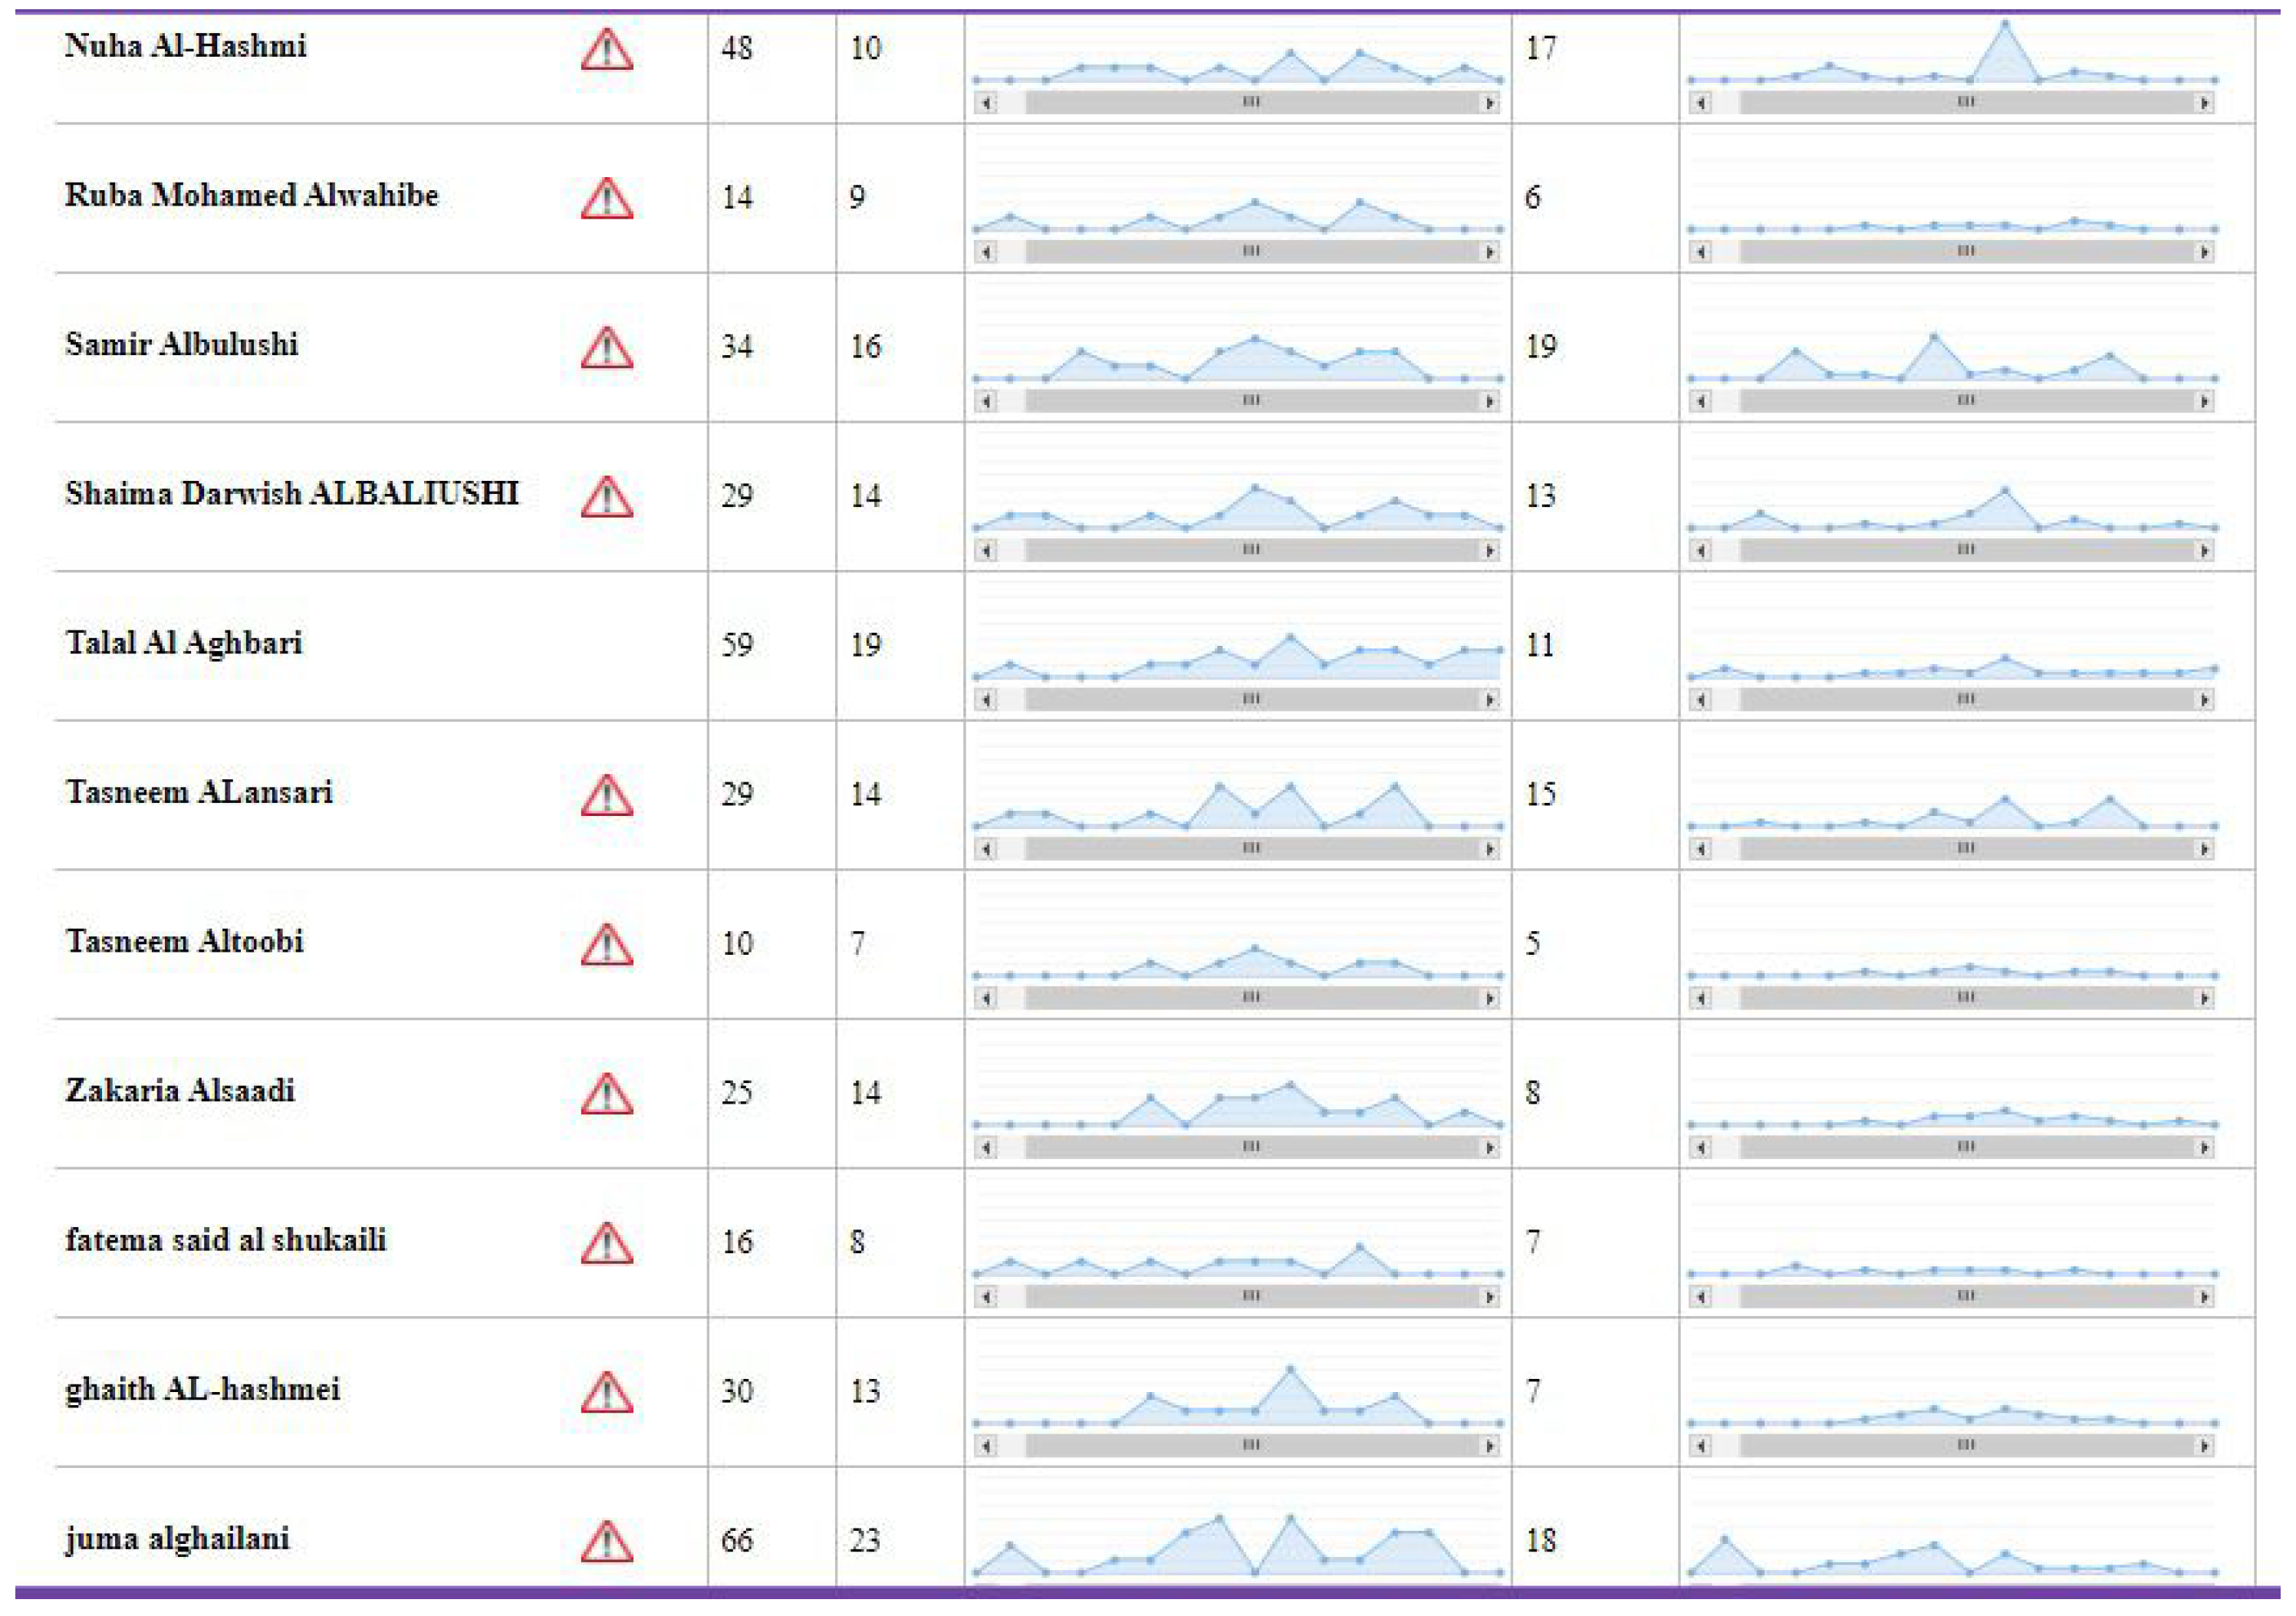
- 6.
In addition, the number of activities made by each student also can be noted through the hit report as shown in
Figure 6. This helps to understand each student’s academic performance in the class. Individual attention can be given at the proper time and appropriately, which supports academic progression. Analysis report about hits distribution provides a picture of how many hits by each student, the pattern of hits by each student, and the number of attended resources. Teachers can infer which is the proper time to give assessments, how many assessments can be given per week, and the most exciting assessments.
5. Discussions
The study was conducted at Muscat College, with the course Object-oriented programming having 12 students and Data Communication Network with 38 students. With the adoption of Moodle LMS during the COVID-19 pandemic off-campus and self-study mode, the Moodle Mobile App was introduced for flexible and convenient use of LMS using Android and iOS mobile phones. Its aim is to overcome the various challenges faced by students during off-campus. This was done with the use of Learning Analytics methods in Python with the support of Seaborn, a Python data visualization library based on matplotlib. Extracted data from Moodle LMS Activity Log (students and courses) provide a lot of information about students’ activities in the system. Such data can measure the improvement of student learning patterns, effectiveness, and comfort using Moodle Mobile App for LMS.
Learning Analytics statistics, interestingly, have revealed a considerable improvement in the course learning performance of students. This indicates that students’ activities were analyzed in detail with the help of the LA plug-in. As per the analysis, teachers can understand the acceptance of the assessments by students. This will help them design new assessments or change the pattern of the current evaluation. The quality of the assessment design will be improved through this.
Teachers can identify how many students were active in the class, and if the activities are more interactive. This gives an idea to teachers and management about course delivery and more interactive activities. The quality of teaching can be improved by analyzing this. Another analysis report reveals the ratio of on-time assessment submissions and late submissions. Teachers can do better planning based on this in the case of online submissions of assessments and avoid late submission or no submission.
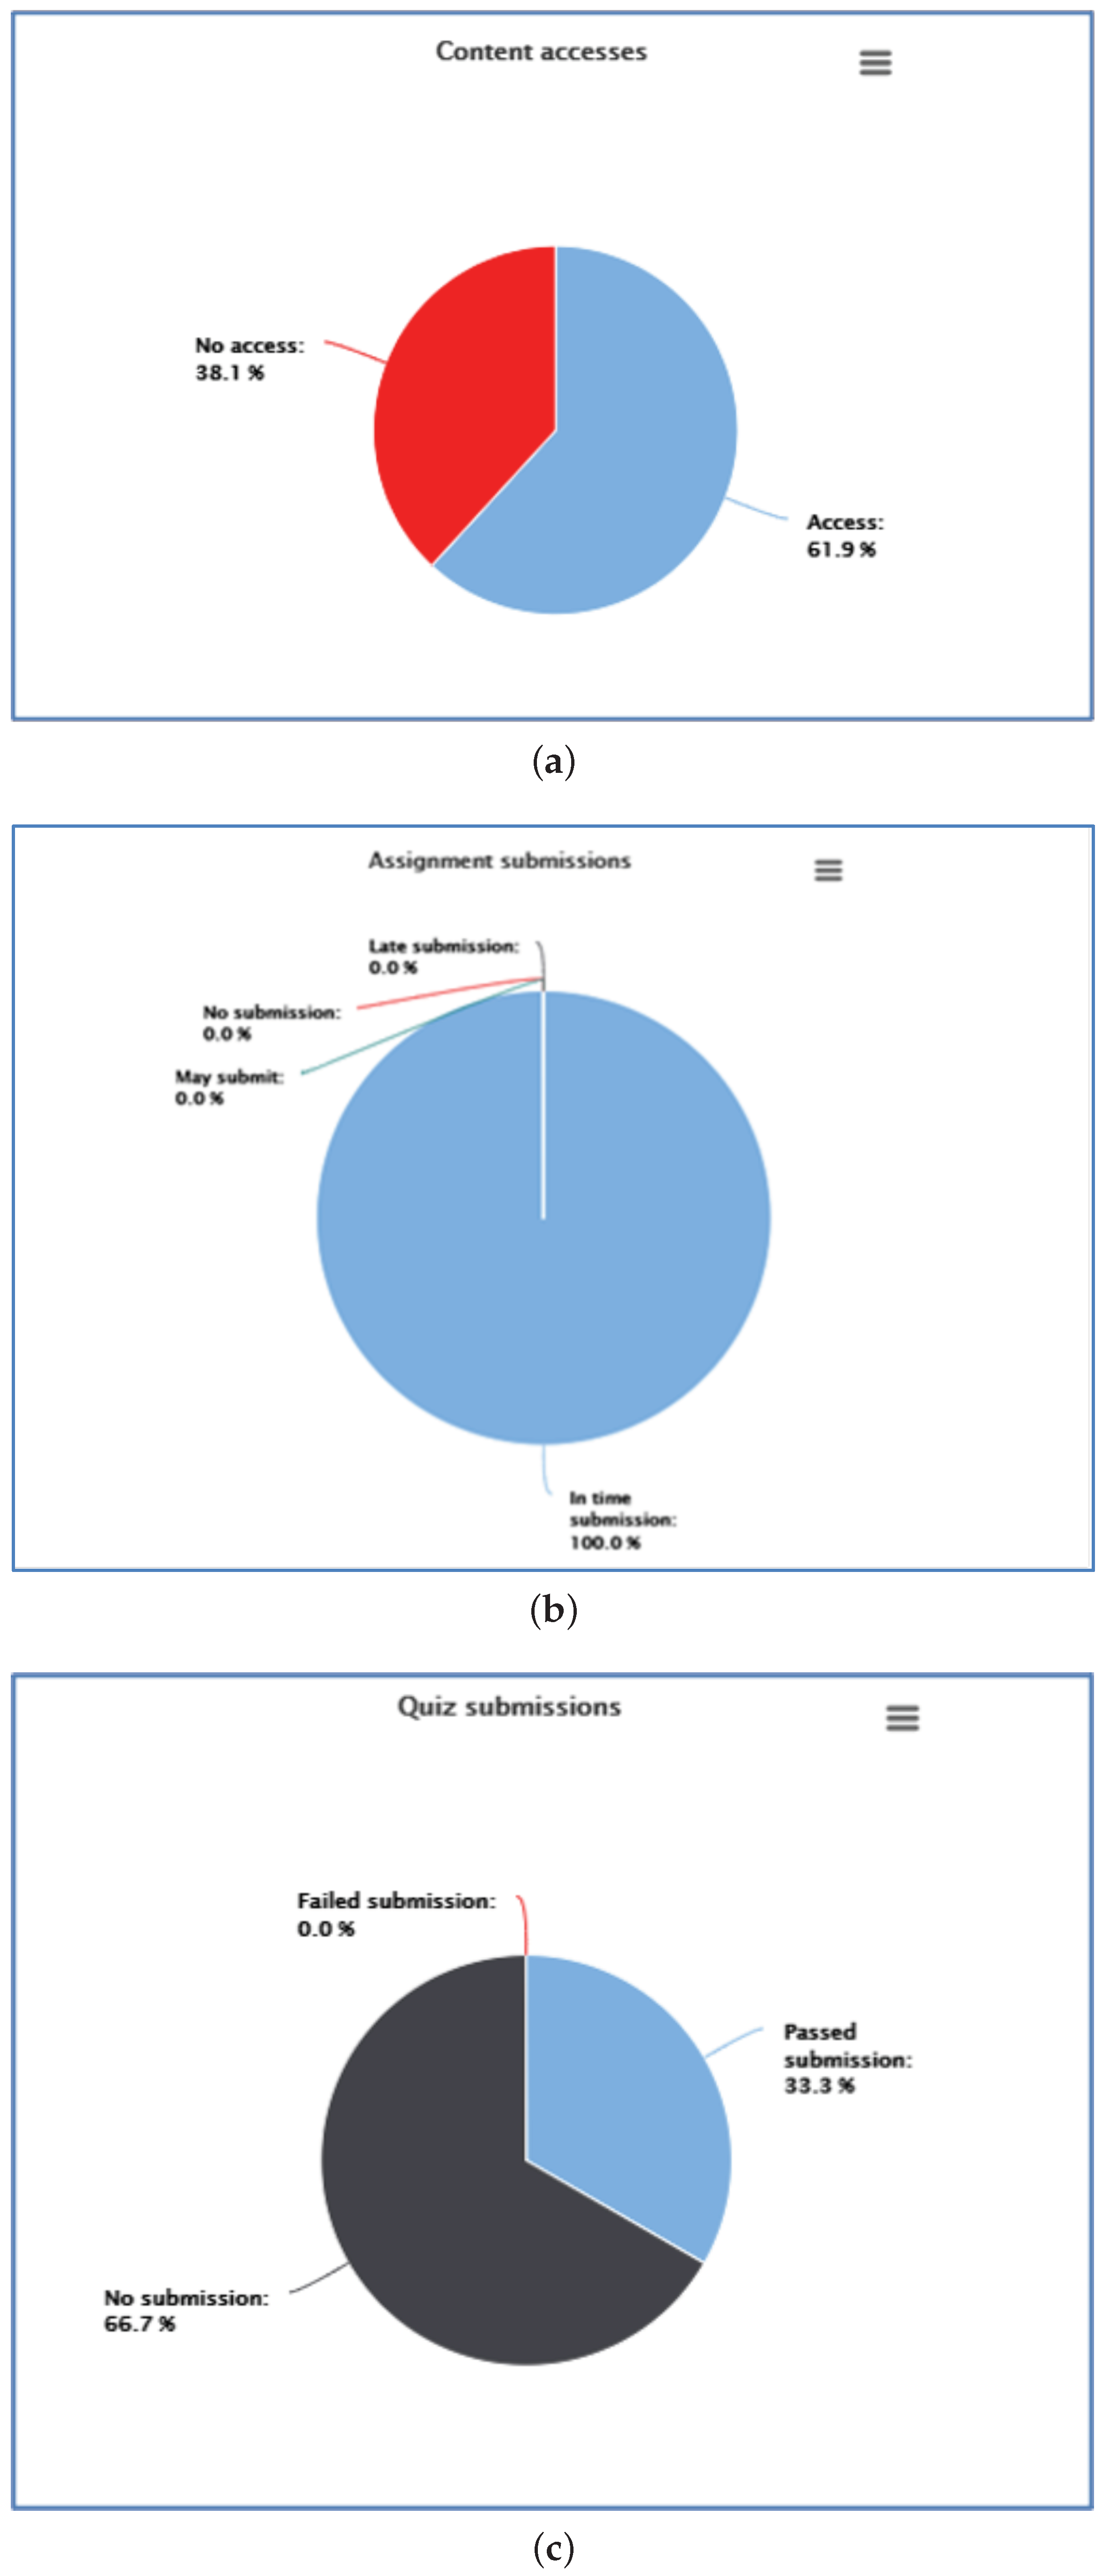
Figure 7a shows that 61.9% of the students accessed the Moodle,
Figure 7b shows that 100% submitted their assignments on time while
Figure 7c indicates that only 33.3% submitted their quiz. All these analyses lead to the inference about students’ performance during the course delivery, which helps teachers and management improve student academic progression. This has a long-term positive impact on the passing rate of graduates from an educational institution.
6. Conclusions and Future Work
In this paper, Learning Management System and its role in tracking learners’ activities for courses are discussed. The relevance of LA is discussed elaborately, along with different types of LA plug-ins used in Moodle. Various learning activities of learners are analyzed with the help of LA plug-ins in two sample courses such as Object-Oriented Programming and Data Communication Network. A total of 50 student samples were taken for data analysis. Two 12 plug-ins, local and log store plug-ins, are added to the sample courses, and reports are observed. Different reports like access graph to content, resource distribution, distribution of access to contents, number of active students and student activities, assessment submission ratio, individual hits distribution are observed. The analysis has reflected that these reports can be used as indicators for tracking students’ academic progression. Since the mode of study is changed to direct in between, some of the assessments are conducted physically in the classroom. In such cases, student interaction could not be taken and analyzed. In future, all assessments will be conducted in online mode and analysis can be taken based on more parameters.
Author Contributions
Author Contributions: Conceptualization, R.K. and S.J.; methodology, R.K. and B.S.S.; software, R.K. and C.I.; validation, C.I., C.B. and E.I.; formal analysis, C.I. and E.I.; investigation, S.N. and B.S.S.; resources, R.K. and C.B.; data curation, C.I.; writing—original draft preparation, C.I., R.K. and E.I.; writing—review and editing, C.B. and S.J.; visualization, C.I., R.K. and E.I.; supervision, C.I.; project administration, B.S.S. and S.N.; funding acquisition, C.B. All authors read and agreed to the published version of the manuscript.
Funding
This research is partly funded by the ‘Construction and Retrieval of Ontology based Semantic Learner Profile’ project from the Ministry of Higher Education, Research and Innovation (MoHERI), Sultanate of Oman, in call 2018 and University of Gavle Sweden.
Institutional Review Board Statement
Not applicable.
Informed Consent Statement
Not applicable.
Data Availability Statement
Conflicts of Interest
The authors declare no conflict of interest.
References
- Hariharasudan, A.; Kot, S. A scoping review on Digital English and Education 4.0 for Industry 4.0. Soc. Sci. 2018, 7, 227. [Google Scholar] [CrossRef] [Green Version]
- Ugochukwu-Ibe, I.M.; Ibeke, E. E-Learning and COVID-19: The Nigerian Experience: Challenges of Teaching Technical Courses in Tertiary Institutions; CEUR Workshop Proceedings: Tirana, Albania, 2021. [Google Scholar]
- Husain, S.A. The Effectiveness of CANVAS Learning Management System for Teaching Undergraduate Mathematics during COVID-19 Pandemic. In Engineering and Sciences Teaching and Learning Activities; Springer: Berlin/Heidelberg, Germany, 2022; pp. 53–59. [Google Scholar]
- Alias, N.A.; Zainuddin, A.M. Innovation for better teaching and learning: Adopting the learning management system. Malays. Online J. Instr. Technol. 2005, 2, 27–40. [Google Scholar]
- Sumardi, D.; Suryani, N.; Musadad, A.A. The Development of Website-based Learning Management System (LMS) as A Tool for Learning in the COVID-19 Pandemic Period for Junior High Schools. J. Educ. Technol. 2021, 5, 346–355. [Google Scholar] [CrossRef]
- Chan, H.K.; Griffin, J.; Lim, J.J.; Zeng, F.; Chiu, A.S. The impact of 3D Printing Technology on the supply chain: Manufacturing and legal perspectives. Int. J. Prod. Econ. 2018, 205, 156–162. [Google Scholar] [CrossRef]
- da Silva, L.M.; Dias, L.P.S.; Rigo, S.; Barbosa, J.L.V.; Leithardt, D.R.; Leithardt, V.R.Q. A literature review on intelligent services applied to distance learning. Educ. Sci. 2021, 11, 666. [Google Scholar] [CrossRef]
- Sedrakyan, G.; Malmberg, J.; Verbert, K.; Järvelä, S.; Kirschner, P.A. Linking learning behavior analytics and learning science concepts: Designing a learning analytics dashboard for feedback to support learning regulation. Comput. Hum. Behav. 2020, 107, 105512. [Google Scholar] [CrossRef]
- Viberg, O.; Hatakka, M.; Bälter, O.; Mavroudi, A. The current landscape of learning analytics in higher education. Comput. Hum. Behav. 2018, 89, 98–110. [Google Scholar] [CrossRef]
- Uhomoibhi, J.; Azevedo, A.I.R.L.; Azevedo, J.M.M.L.; Ossiannilsson, E. Learning analytics in theory and practice: Guest editorial. Int. J. Inf. Learn. Technol. 2019, 36, 286–287. [Google Scholar] [CrossRef] [Green Version]
- Iwendi, C.; Bashir, A.K.; Peshkar, A.; Sujatha, R.; Chatterjee, J.M.; Pasupuleti, S.; Mishra, R.; Pillai, S.; Jo, O. COVID-19 patient health prediction using boosted random forest algorithm. Front. Public Health 2020, 8, 357. [Google Scholar] [CrossRef] [PubMed]
- Iwendi, C.; Mahboob, K.; Khalid, Z.; Javed, A.R.; Rizwan, M.; Ghosh, U. Classification of COVID-19 individuals using adaptive neuro-fuzzy inference system. Multimed. Syst. 2021, 1–15. [Google Scholar] [CrossRef] [PubMed]
- Iwendi, C.; Ibeke, E.; Eggoni, H.; Velagala, S.; Srivastava, G. Pointer-Based Item-to-Item Collaborative Filtering Recommendation System Using a Machine Learning Model. Int. J. Inf. Technol. Decis. Mak. 2022, 21, 463–484. [Google Scholar] [CrossRef]
- Ngabo, D.; Dong, W.; Ibeke, E.; Iwendi, C.; Masabo, E. Tackling pandemics in smart cities using machine learning architecture. Math. Biosci. Eng. 2021, 18, 8444–8461. [Google Scholar] [CrossRef] [PubMed]
- Dolak, R. Using process mining techniques to discover student’s activities, navigation paths, and behavior in lms moodle. In International Conference on Innovative Technologies and Learning; Springer: Berlin/Heidelberg, Germany, 2019; pp. 129–138. [Google Scholar]
- SmartKlass™ Learning Analytics Moodle. Available online: https://moodle.org/plugins/local_smart_klass (accessed on 10 November 2021).
- Create Better Learning Experiences. Available online: https://intelliboard.net (accessed on 10 November 2021).
| Publisher’s Note: MDPI stays neutral with regard to jurisdictional claims in published maps and institutional affiliations. |
© 2022 by the authors. Licensee MDPI, Basel, Switzerland. This article is an open access article distributed under the terms and conditions of the Creative Commons Attribution (CC BY) license (https://creativecommons.org/licenses/by/4.0/).


 ,
, 
