
Combination Layout of Traffic Signs and Markings of Expressway Tunnel Entrance Sections: A Driving Simulator Study


Abstract
:1. Introduction
2. Literature Overview
2.1. Studies on Types of Traffic Signs and Markings
2.2. Studies on Driving Simulators Used to Assess Safety
3. Methods
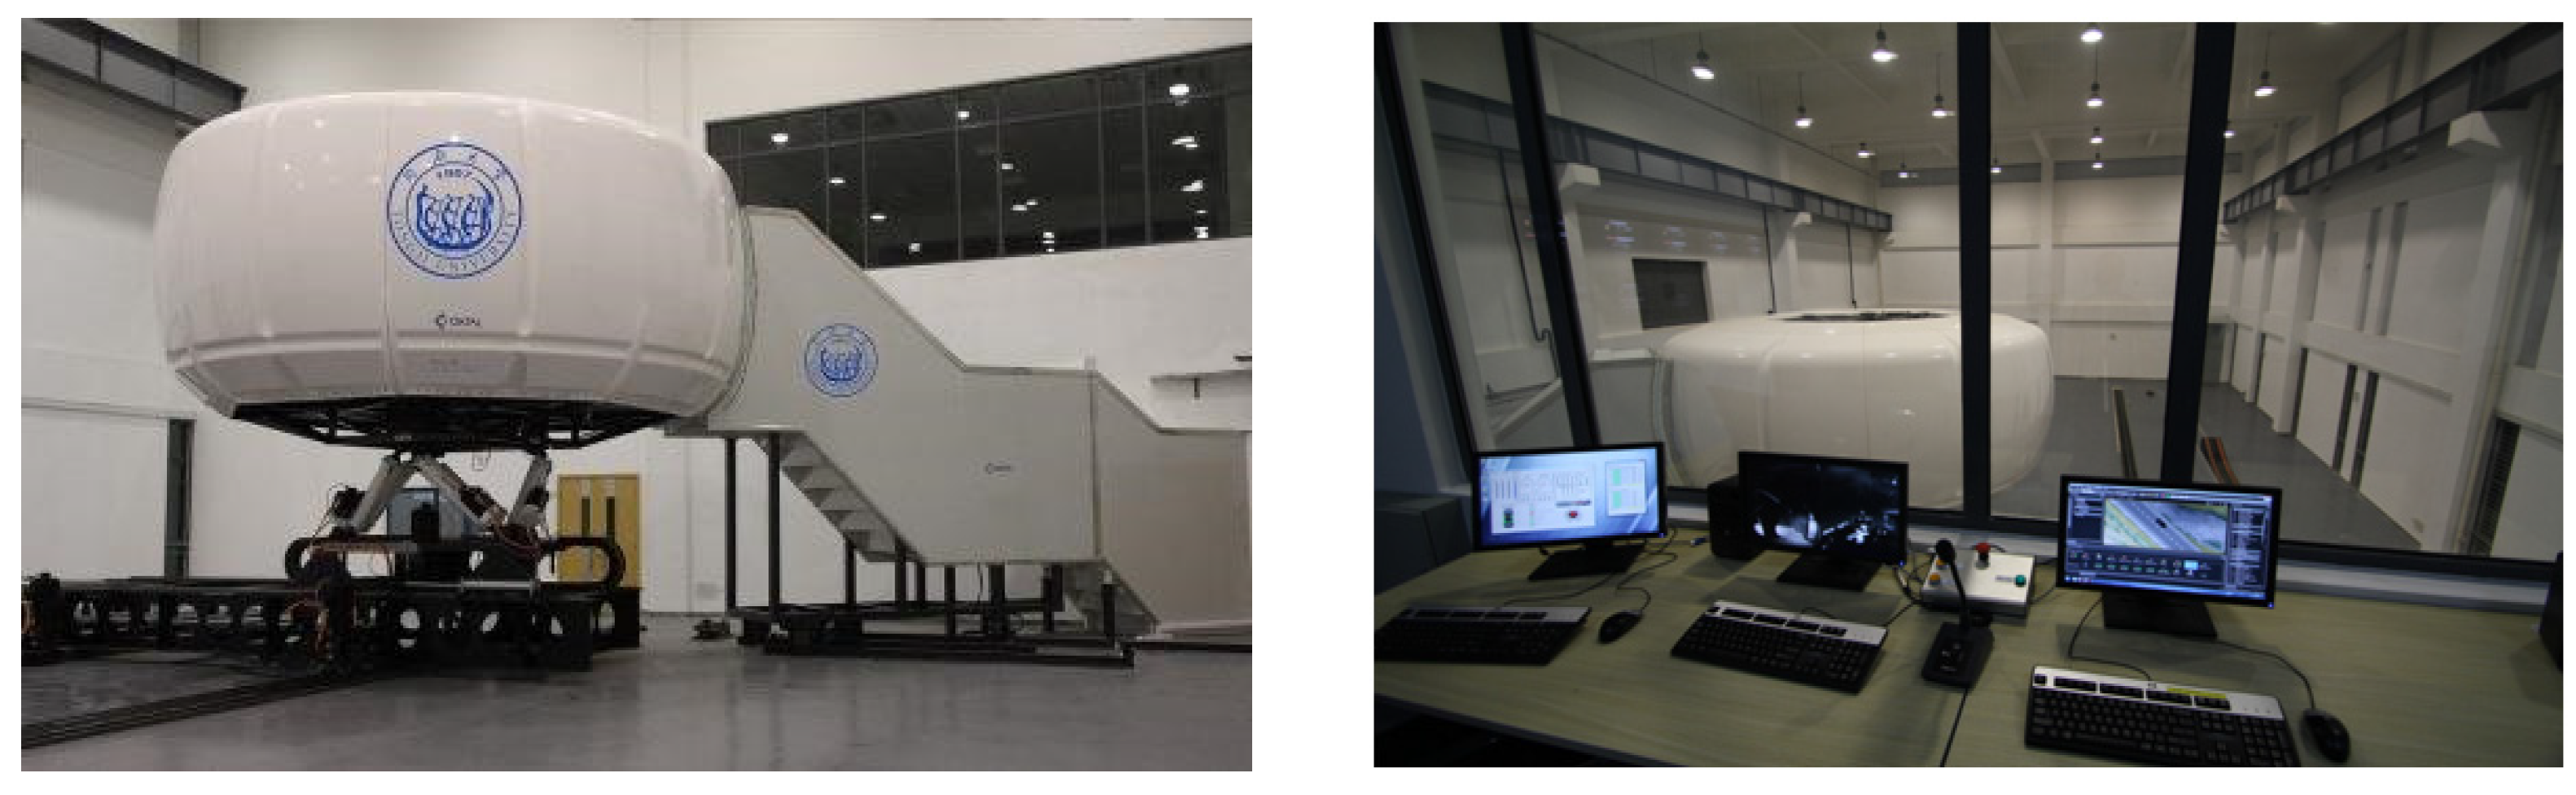
3.1. Driving Simulator
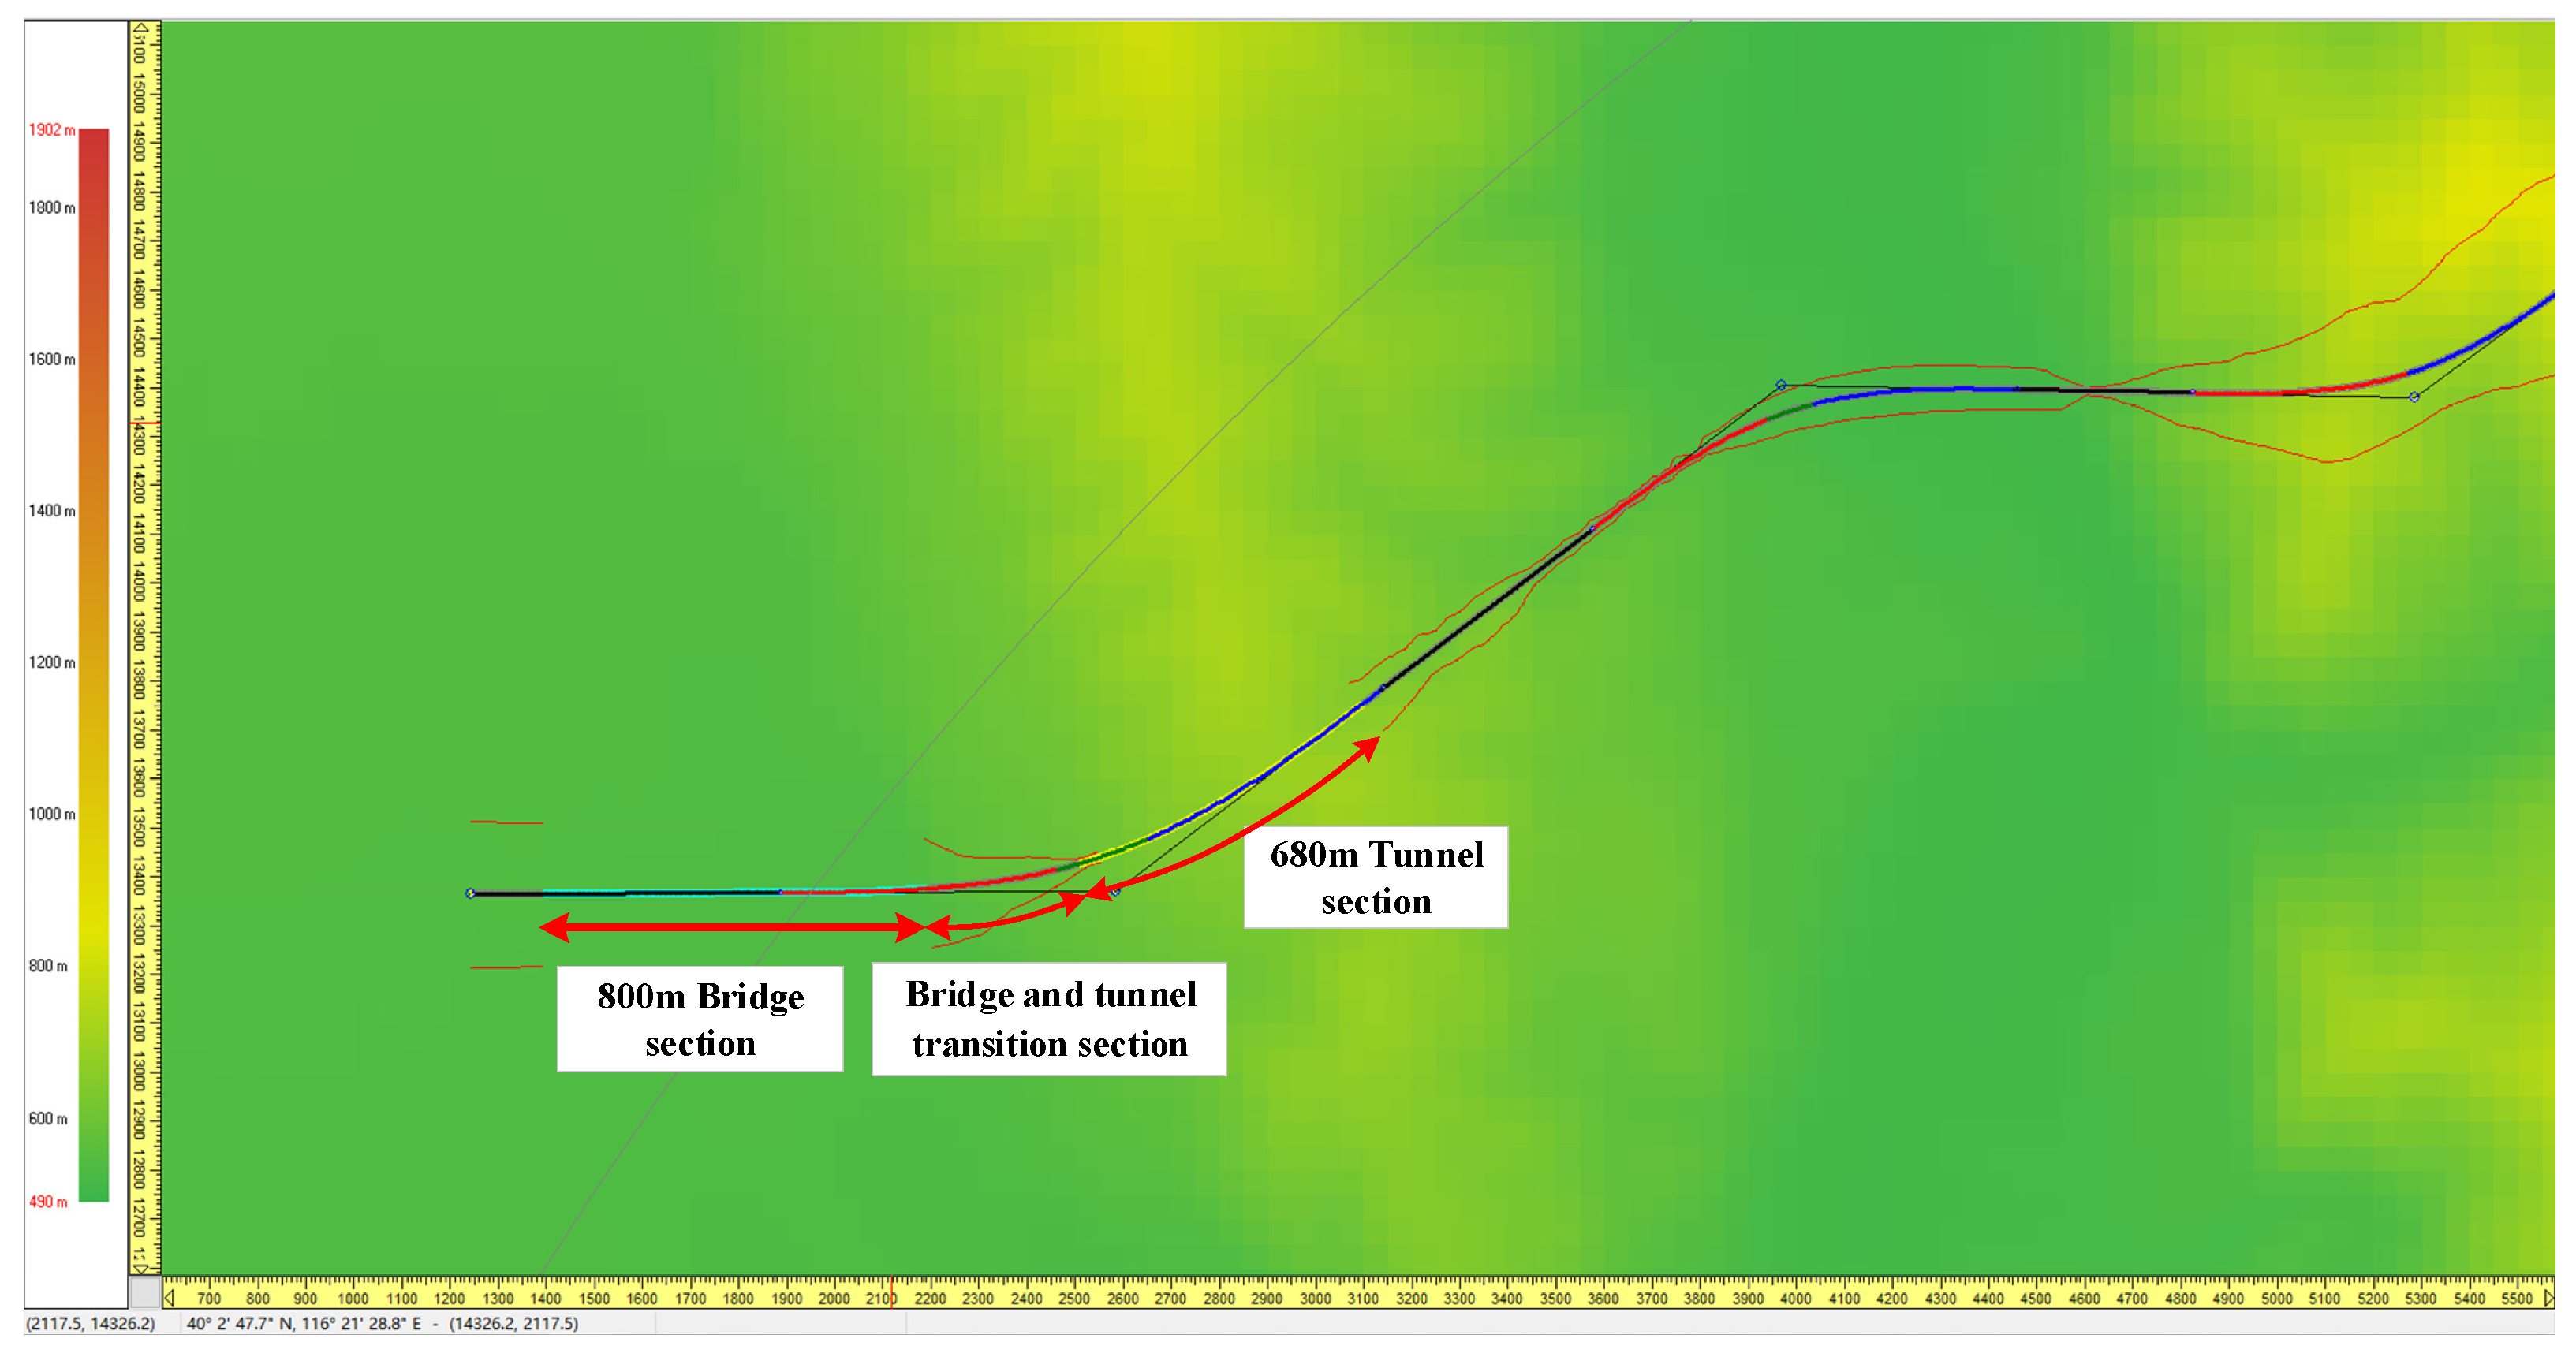
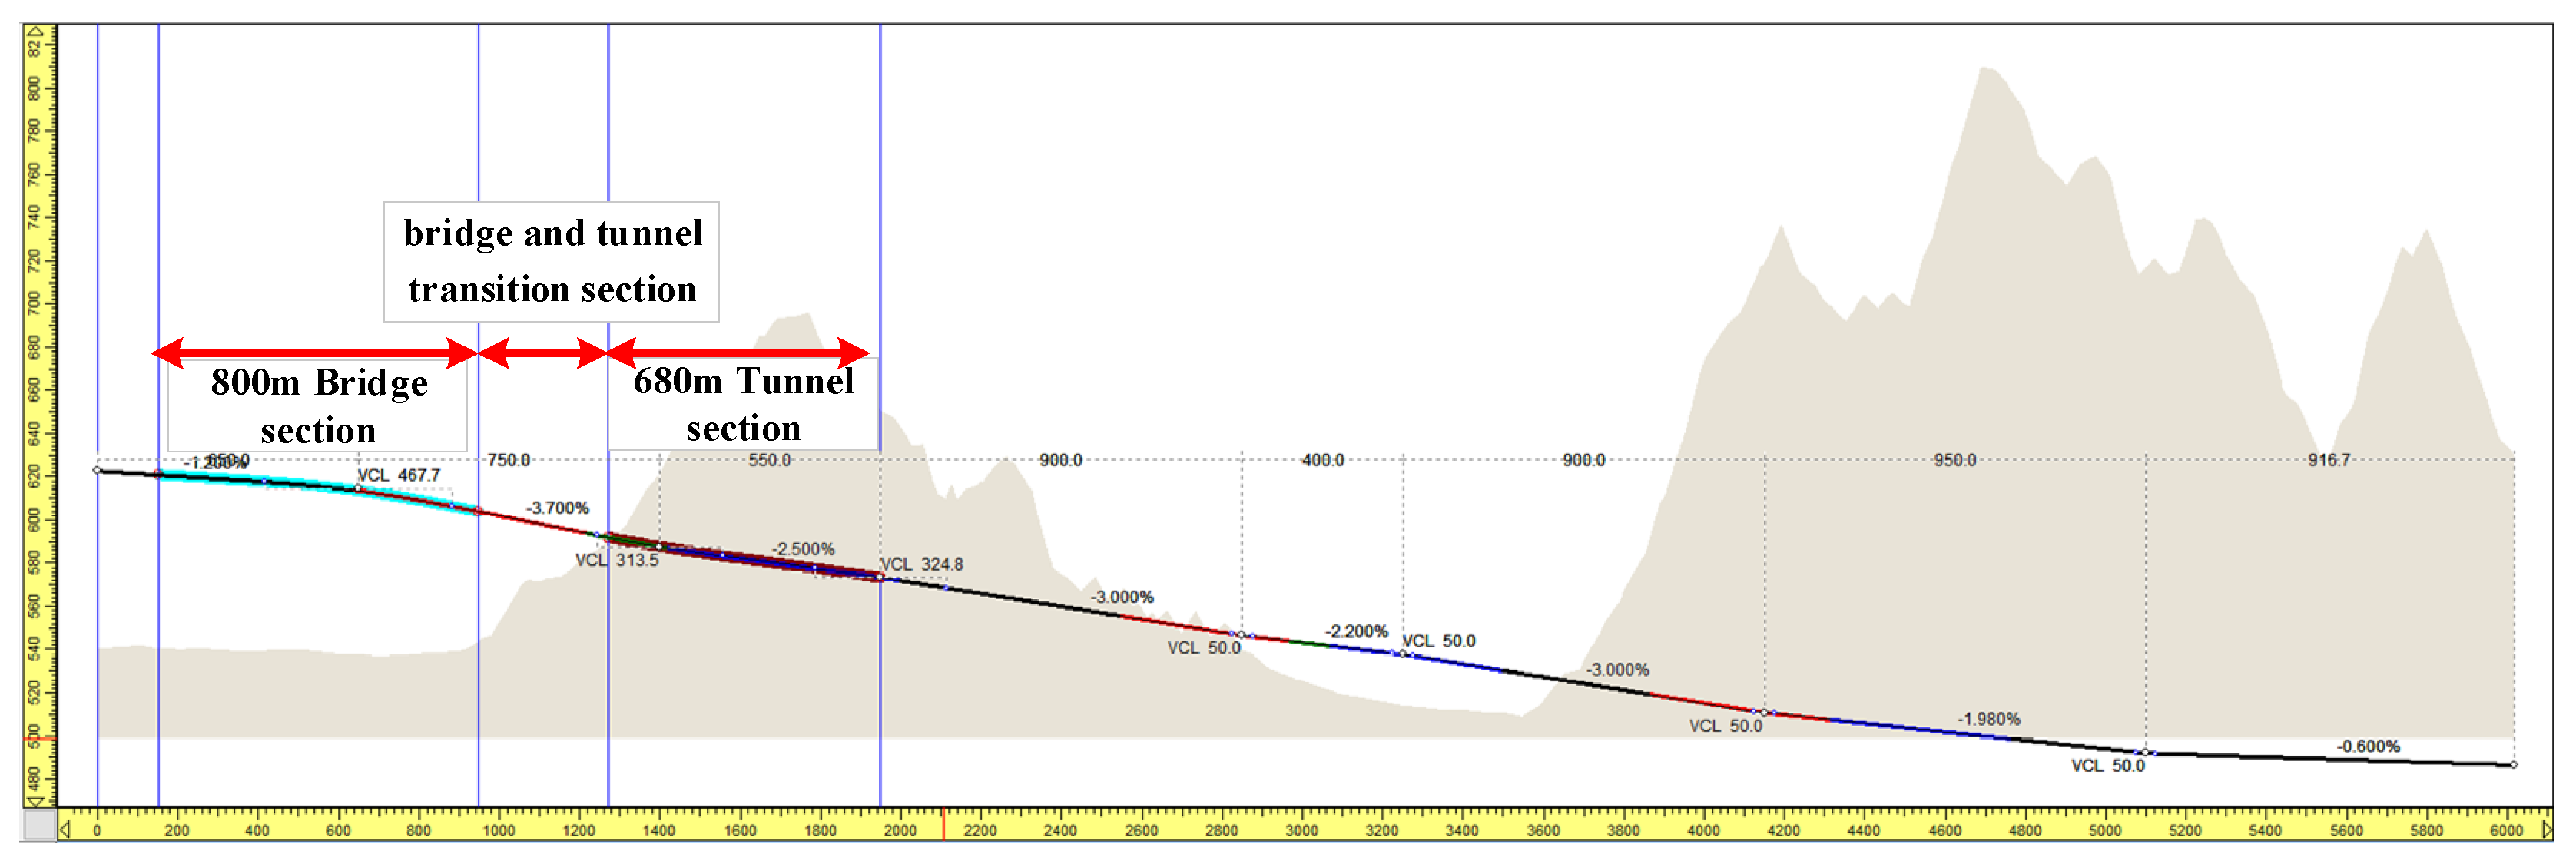
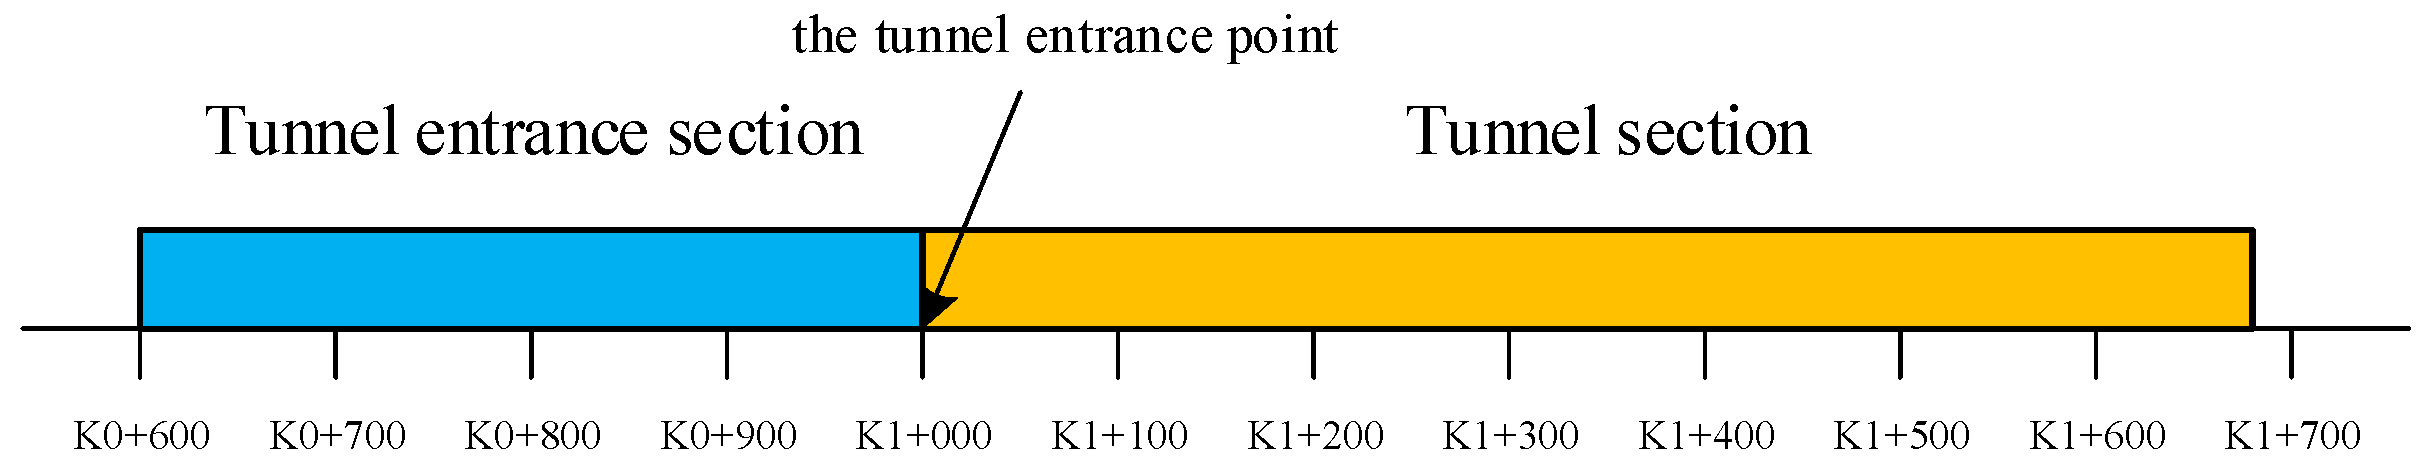
3.2. Experimental Design
3.3. Participants
3.4. Experimental Procedure
3.5. Data Analysis Method
4. Results
4.1. Driving Characteristics
4.1.1. Speed Indicator
4.1.2. Lane Offset Indicators
4.1.3. Lane Change Behavior Indicator
4.2. Drivers’ Eye Movement Behavior Characteristics
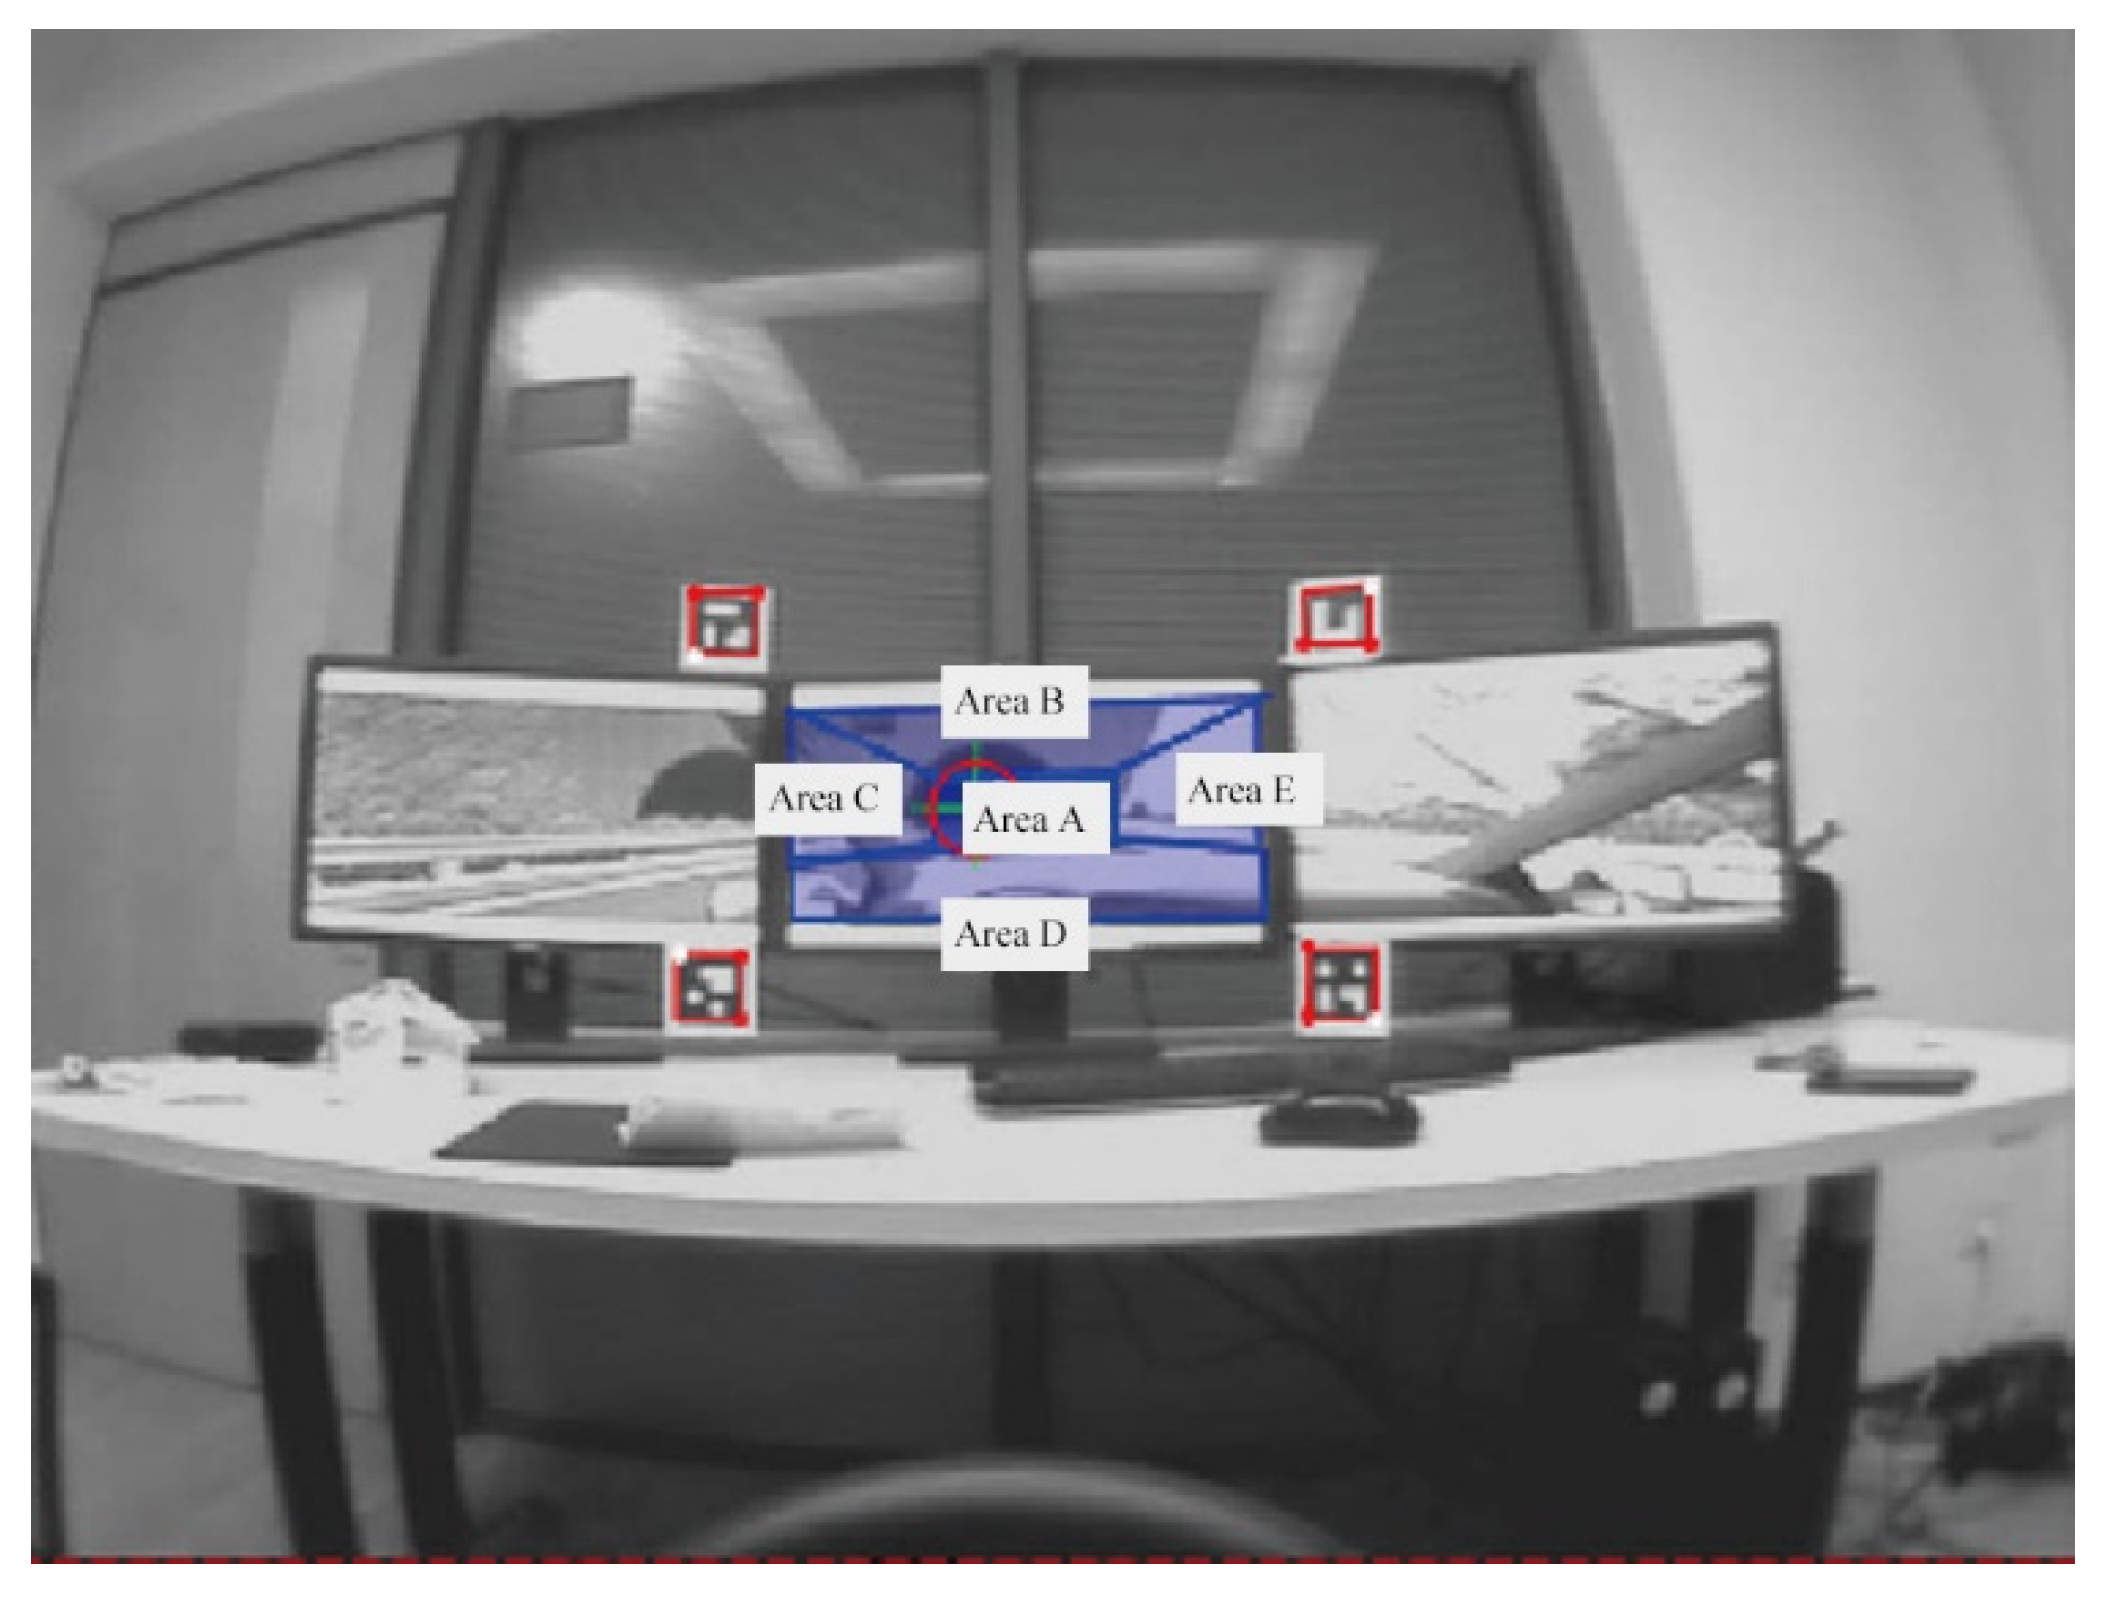
4.2.1. Fixation Area
4.2.2. Fixation Time
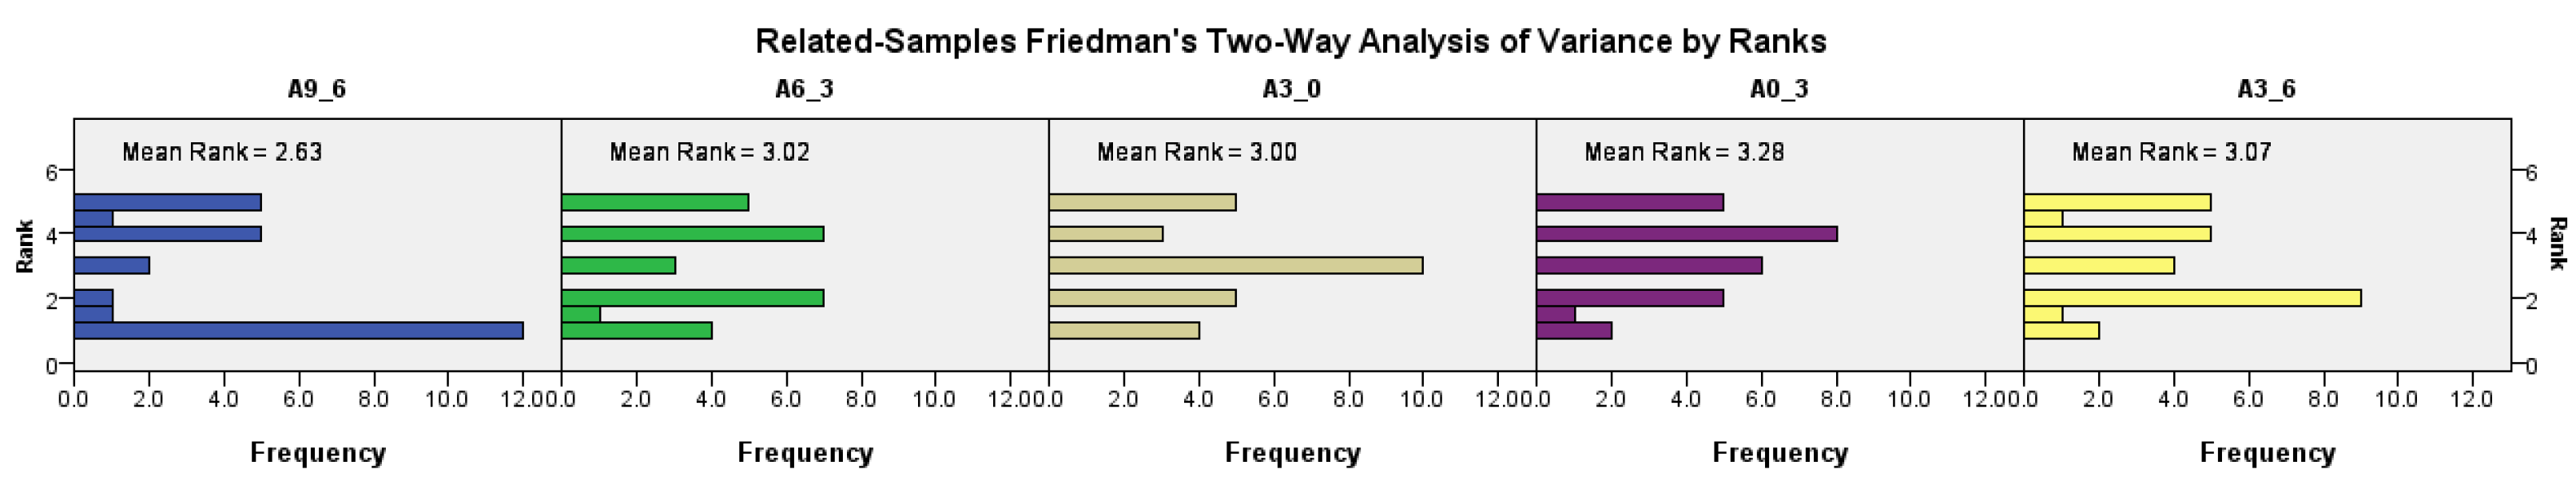
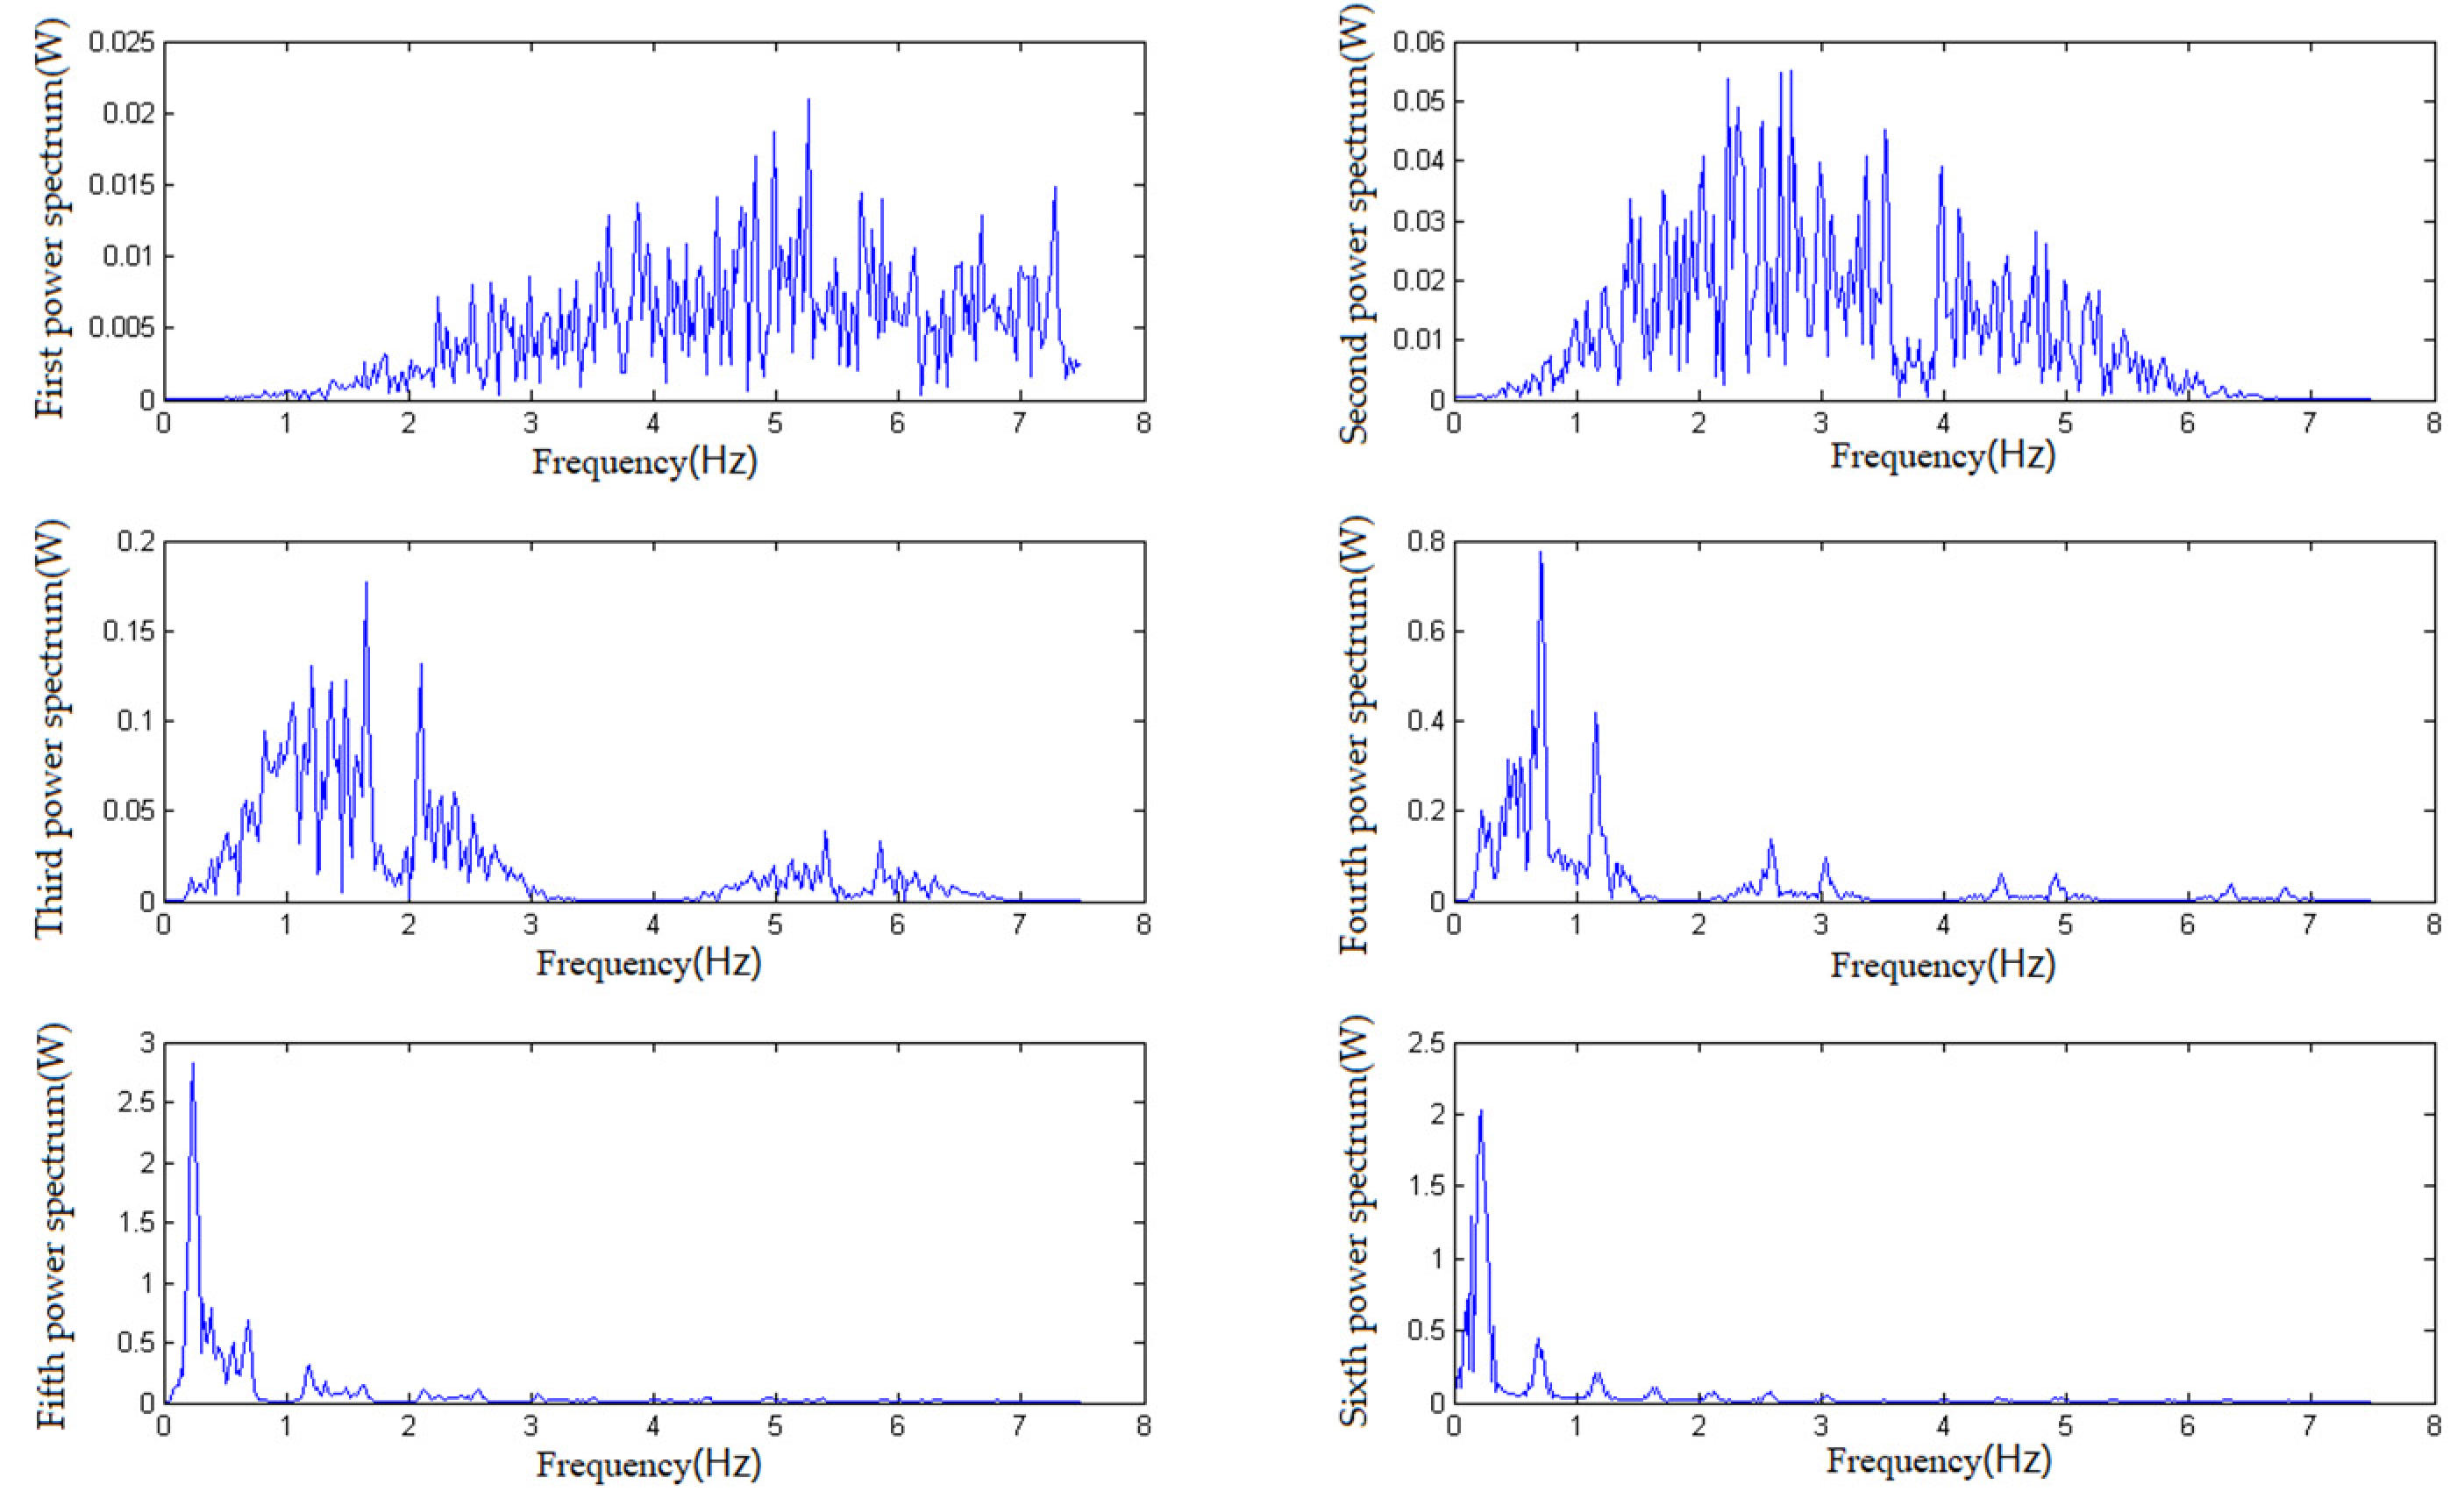
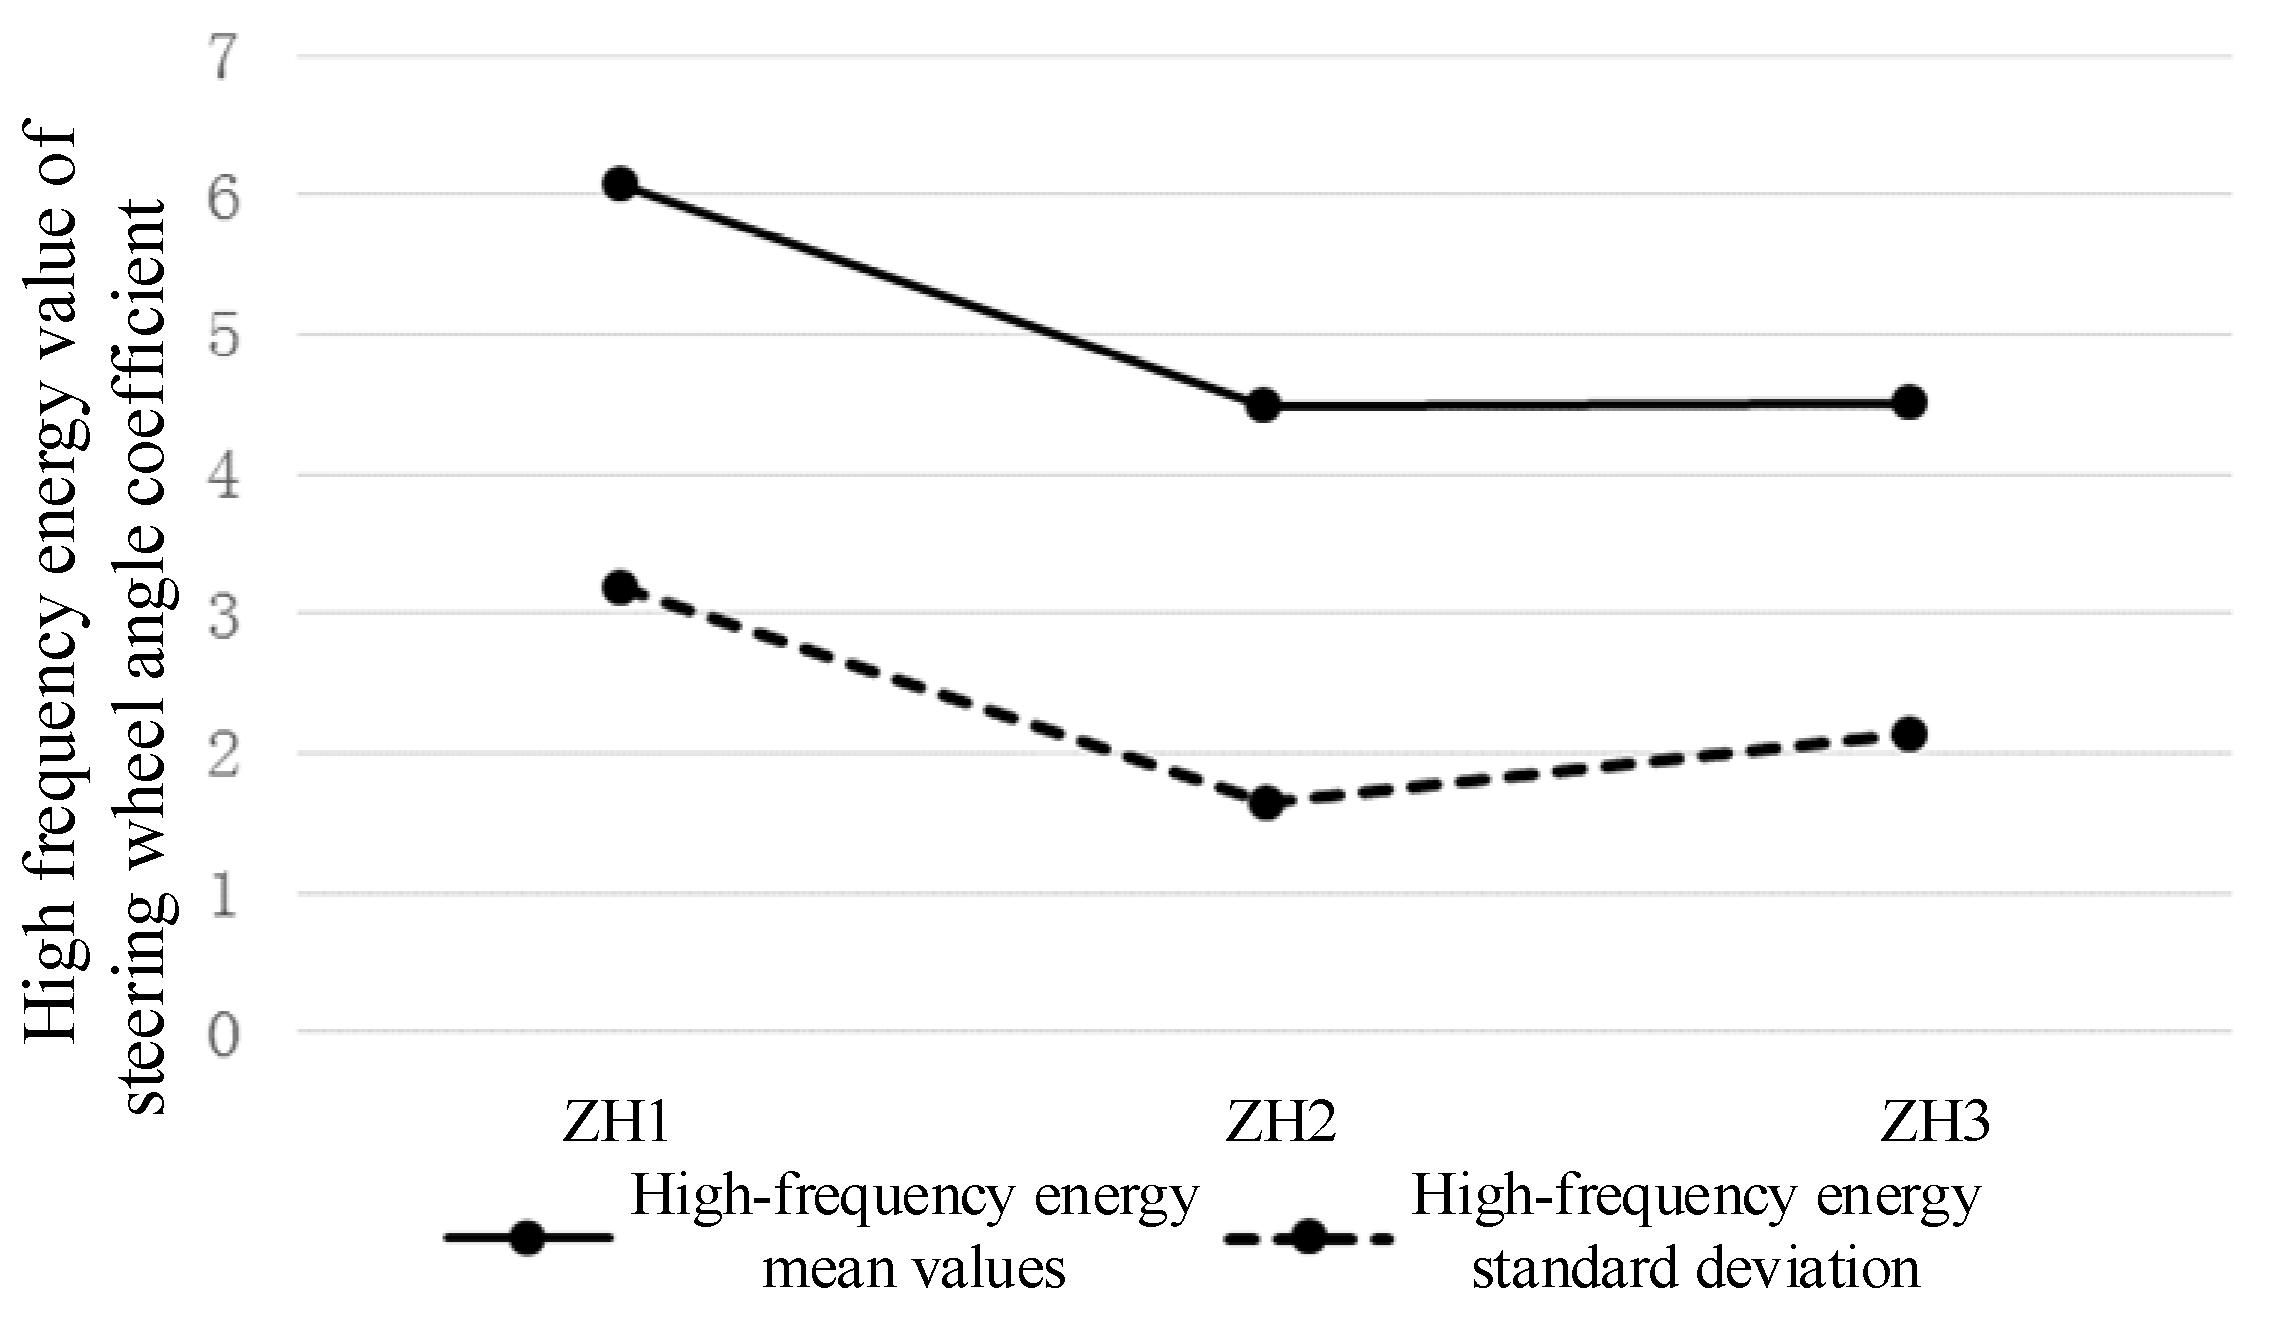
4.3. Operating Load
5. Conclusions
Author Contributions
Funding
Institutional Review Board Statement
Informed Consent Statement
Data Availability Statement
Conflicts of Interest
References
- Sun, H.; Wang, Q.; Zhang, P.; Zhong, Y.; Yue, X. Spatialtemporal Characteristics of Tunnel Traffic Accidents in China from 2001 to Present. Adv. Civ. Eng. 2019, 2019, 4536414. [Google Scholar] [CrossRef] [Green Version]
- Amundsen, F.H.; Ranes, G. Studies on Traffic Accidents in Norwegian Road Tunnels. Tunn. Undergr. Space Technol. 2000, 15, 3–11. [Google Scholar] [CrossRef]
- Beard, A.N. Tunnel Safety, Risk Assessment and Decision-making. Tunn. Undergr. Space Technol. 2010, 25, 91–94. [Google Scholar] [CrossRef]
- Orsini, F.; Tagliabue, M.; De Cet, G.; Gastaldi, M.; Rossi, R. Highway Deceleration Lane Safety: Effects of Real-Time Coaching Programs on Driving Behavior. Sustainability 2021, 13, 9089. [Google Scholar] [CrossRef]
- Charlton, S.G. The Role of Attention in Horizontal Curves: A Comparison of Advance Warning, Delineation, and Road Marking Treatments. Accid. Anal. Prev. 2007, 39, 873–885. [Google Scholar] [CrossRef] [PubMed]
- Vest, A.; Stamatiadis, N. Use of Warning Signs and Markings to Reduce Speeds on Curves. In Proceedings of the 3rd International Symposium on Expressway Geometric Design, Chicago, IL, USA, 29 June–1 July 2005. [Google Scholar]
- Chen, Z.J.; Li, Y.; Zhang, S.B. Design of Traffic Signs and Markings in France Road Traffic Engineering. J. Railw. Eng. Soc. 2011, 28, 59–63. [Google Scholar]
- Ding, H.; Zhao, X.; Rong, J.; Ma, J. Experimental Research on the Effectiveness of Speed Reduction Markings Based on Driving Simulation: A Case Study. Accid. Anal. Prev. 2013, 60, 211–218. [Google Scholar] [CrossRef] [PubMed]
- Zhao, X.H.; Guan, W.; Huang, L.H.; Rong, J. Research on Influence of Warning Sign Position in Sharp Curve on Driving Behavior. J. Highw. Transp. Res. Dev. 2014, 31, 101–107. [Google Scholar]
- Shinta, N.L.P.; Linggasari, M.D.; Limawan, H. Cipularang Toll Road Safety Audit of Traffic Signs and Road Markings. In IOP Conference Series: Materials Science and Engineering; IOP Publishing: Bristol, UK, 2019. [Google Scholar]
- Shinar, D.; Dewar, R.E.; Summala, H.; Zakowska, L. Traffic Sign Symbol Comprehension: A Cross-cultural Study. Ergonomics 2003, 46, 1549–1565. [Google Scholar] [CrossRef] [PubMed]
- Ben-Bassat, T.; Shinar, D. Ergonomic Guidelines for Traffic Sign Design Increase Sign Comprehension. Hum. Factors 2006, 48, 182–195. [Google Scholar] [CrossRef] [PubMed] [Green Version]
- Ng, A.W.; Chan, A.H. The Effects of Driver Factors and Sign Design Features on the Comprehensibility of Traffic Signs. J. Saf. Res. 2008, 39, 321–328. [Google Scholar] [CrossRef] [PubMed]
- Shinar, D.; Vogelzang, M. Comprehension of Traffic Signs with Symbolic Versus Text Displays. Transp. Res. Part F Traffic Psychol. Behav. 2013, 18, 72–82. [Google Scholar] [CrossRef]
- Yan, X.; Wu, J. Effectiveness of Variable Message Signs on Driving Behavior Based on a Driving Simulation Experiment. Discret. Dyn. Nat. Soc. 2014, 2014, 206805. [Google Scholar] [CrossRef] [Green Version]
- Godley, S.T.; Triggs, T.J.; Fildes, B.N. Driving Simulator Validation for Speed Research. Accid. Anal. Prev. 2002, 34, 589–600. [Google Scholar] [CrossRef]
- Jamson, S.; Lai, F.; Jamson, H. Driving Simulators for Robust Comparisons: A Case Study Evaluating Road Safety Engineering Treatments. Accid. Anal. Prev. 2010, 42, 961–971. [Google Scholar] [CrossRef] [PubMed]
- Chen, F.; Peng, H.; Ma, X.; Liang, J.; Hao, W.; Pan, X. Examining the safety of trucks under crosswind at bridge-tunnel section: A driving simulator study. Tunn. Undergr. Space Technol. 2019, 92, 103034. [Google Scholar] [CrossRef]
- Chen, P.; Chen, F.; Zhang, L.; Ma, X.; Pan, X. Examining the influence of decorated sidewaall in road tunnels using fMRI technology. Tunn. Undergr. Space Technol. 2020, 99, 103362. [Google Scholar] [CrossRef]
- Wu, Z.; Dong, A. Setting of Traffic Sign in Tunnel Based on the Visual Continuity. Rail. Sci. Eng. J. 2016, 13, 369–374. [Google Scholar]
- Manser, M.P.; Hancock, P.A. The Influence of Perceptual Speed Regulation on Speed Perception, Choice, and Control: Tunnel Wall Characteristics and Influences. Accid. Anal. Prev. 2007, 39, 69–78. [Google Scholar] [CrossRef] [PubMed]
- Biancardo, S.A.; Avella, F.; Di Lisa, E.; Chen, X.; Abbondati, F.; Dell’Acqua, G. Multiobjective Railway Alignment Optimization Using Ballastless Track and Reduced Cross-Section in Tunnel. Sustainability 2021, 13, 10672. [Google Scholar] [CrossRef]


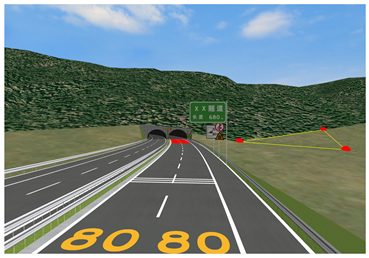
| Scene | Signs and Markings Features | Driving Simulation Scene |
|---|---|---|
| ZH 1 |
| 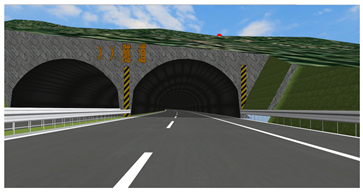 |
| ZH 2 |
|  |
| ZH 3 |
|  |
| Inspection Parameters | Rank | Significance | Inspection Parameters | Rank | Significance |
|---|---|---|---|---|---|
| ZH 1 section 85-bit speed | 2.7 | p < 0.05, significant difference | ZH 1 standard deviation of section speed | 2.7 | p < 0.05, significant difference |
| ZH 2 section 85-bit speed | 1.0 | ZH 2 standard deviation of section speed | 1.0 | ||
| ZH 3 section 85-bit speed | 2.3 | ZH 3 standard deviation of section speed | 2.3 |
| Scene | Average Number of Lane Changes (m/Person) | Average Driving Length on the Line (m/Person) |
|---|---|---|
| ZH 1 | 0.50 | 30.63 |
| ZH 2 | 0.00 | 16.71 |
| ZH 3 | 0.14 | 35.00 |
| Combination of Static Facilities | Average Distance from Lane Change Action Point to the Entrance(m) | Average Distance from Lane Change Completion Point to the Entrance(m) | Average Lane Change Distance(m) |
|---|---|---|---|
| ZH 1 | 232.338 | 181.589 | 50.749 |
| ZH 2 | 269.297 | 201.057 | 68.240 |
| ZH 3 | 249.565 | 193.016 | 56.549 |
| ZH 1 | ZH 2 | ZH 3 | |
|---|---|---|---|
| 1 | N/A | 3.08 | 1.44 |
| 2 | 1.52 | 0.88 | 0.8 |
| 4 | 0.72 | 1.6 | N/A |
| 5 | 1.32 | 2.13 | 2.36 |
| 6 | N/A | 0.96 | 1.04 |
| 9 | N/A | 2.84 | 2.32 |
| Fixation frequency | 50% | 100% | 83.30% |
| Average fixation time | 0.59 | 1.92 | 1.33 |
Publisher’s Note: MDPI stays neutral with regard to jurisdictional claims in published maps and institutional affiliations. |
© 2022 by the authors. Licensee MDPI, Basel, Switzerland. This article is an open access article distributed under the terms and conditions of the Creative Commons Attribution (CC BY) license (https://creativecommons.org/licenses/by/4.0/).
Share and Cite
Fang, Y.; Zhou, J.; Hu, H.; Hao, Y.; Xiao, D.; Li, S. Combination Layout of Traffic Signs and Markings of Expressway Tunnel Entrance Sections: A Driving Simulator Study. Sustainability 2022, 14, 3377. https://doi.org/10.3390/su14063377
Fang Y, Zhou J, Hu H, Hao Y, Xiao D, Li S. Combination Layout of Traffic Signs and Markings of Expressway Tunnel Entrance Sections: A Driving Simulator Study. Sustainability. 2022; 14(6):3377. https://doi.org/10.3390/su14063377
Chicago/Turabian StyleFang, Yong, Jiayi Zhou, Hua Hu, Yanxi Hao, Dianliang Xiao, and Shaojie Li. 2022. "Combination Layout of Traffic Signs and Markings of Expressway Tunnel Entrance Sections: A Driving Simulator Study" Sustainability 14, no. 6: 3377. https://doi.org/10.3390/su14063377
APA StyleFang, Y., Zhou, J., Hu, H., Hao, Y., Xiao, D., & Li, S. (2022). Combination Layout of Traffic Signs and Markings of Expressway Tunnel Entrance Sections: A Driving Simulator Study. Sustainability, 14(6), 3377. https://doi.org/10.3390/su14063377