Article

Early Risk Warning of Highway Soft Rock Slope Group Using Fuzzy-Based Machine Learning

1
School of Civil Engineering, Sun Yat-sen University, Guangzhou 510275, China
2
Guangdong Engineering Research Centre for Major Infrastructure Safety, Guangzhou 510275, China
3
Department of Infrastructure Engineering, The University of Melbourne, Melbourne 3010, Australia
*
Author to whom correspondence should be addressed.
Sustainability 2022, 14(6), 3367; https://doi.org/10.3390/su14063367
Submission received: 8 February 2022 / Revised: 8 March 2022 / Accepted: 11 March 2022 / Published: 13 March 2022

Abstract

:
Maintaining the stability of highway soft rock slopes is of critical importance for ensuring the safety of road networks. Although much research has been carried out to assess the stability of individual soft rock slope, the goal of efficient and effective risk management focusing on multiple highway soft rock slopes has not been fully achieved due to the many complex factors involved and the interactions among these factors. In the present study, a machine learning algorithm based on a fuzzy neural network (FNN) and a comprehensive evaluation method based on the FNN is developed, in order to identify and issue early warnings regarding the risks induced by soft rock slopes along highways, in an efficient and effective way. Using a large amount of collected soft rock slope information as training and validation data, an FNN-based risk identification model is first developed to identify the risk level of individual soft rock slope based on the meteorological conditions, topographical and geomorphological factors, geotechnical properties, and the measured horizontal displacement. An FNN-based comprehensive evaluation method is then developed, in order to quantify the risk level of a soft rock slope group according to the slope, road and external factors. The results show that the risk level identification accuracy obtained based on validation of the FNN model was higher than 90%, and the model showed a good training effect. On this basis, we further made early warnings of the risks of soft rock slope groups. The proposed early-warning model can quickly and accurately evaluate the risk posed by multiple soft rock slopes to a highway, thereby ensuring the safety of the highway.

1. Introduction

The safety of soft rock slopes plays an important role in the construction of large-scale transport infrastructure, such as highways. The instability of soft rock slopes that are close to highways has an important influence on traffic safety when affected by adverse external conditions, such as rainfall [1]. As mitigation of the risks posed by soft rock slopes to highways is one of the most important factors in appraisal projects [2], the management and early warning of soft rock slope risk have become increasingly important for ensuring the safe operation of highways [3,4,5,6,7,8,9,10,11]. To this end, various ground improvement methods for soft rock slopes have been proposed, including the use of piles [12] and geofoam [13,14,15]. However, the current risk-control mode used to address soft rock slopes is relatively singular, and case-by-case management and research methods are usually adopted. This management and control mode is associated with high costs and low efficiency. This mode often cannot give full play to the ability of managers. In particular, it is especially difficult to use this mode to effectively manage a large number of soft rock slopes composing a slope group.
Few risk analyses have been performed on soft rock slope groups [16,17], both in China and abroad. Generally, a soft rock slope group is regarded as multiple independent soft rock slopes, and the risk of a soft rock slope group is described by studying the risk level of each slope individually. Therefore, a soft rock slope group risk study can refer to single-slope risk analysis methods. In the last few decades, many slope risk analysis models have been developed [18,19,20]. Qualitative methods based on past experience and expert opinion have been used to identify the risks posed by individual slopes [21,22,23,24,25,26,27,28], while quantitative methods, such as the limit equilibrium method [29,30,31], finite element method [29], numerical analysis method, statistical approaches [32,33,34], and the failure probability graph [35], theoretically quantify the risks of individual slopes. Most of these quantitative methods calculate the evaluation results based on simplified models with various assumptions and seldom consider the actual uncertainty factors. Additionally, the calculation results often cannot truly reflect the reliability of the analysis object, as the influence factors of the soft rock slope risk analysis have complex fuzzy and nonlinear relationships. However, there are still challenges in fully capturing the soft rock slope conditions in engineering practice as the risks posed by soft rock slopes to highways are governed by a range of factors, such as geotechnical conditions, extreme weather conditions, and the distance of the soft rock slope from the highway.
Machine learning methods are good at automatically analyzing and obtaining laws from data. Then, such laws can be used to predict unknown data. These methods are especially suitable for dealing with non-linear problems. There are generally complex non-linear relationships among the risk factors of slopes, which are characterized by strong randomness and fuzziness. Thus, machine learning techniques [36,37,38], such as the group method of data handling (GMDH) and multivariate adaptive regression splines (MARS) [39], gravitational search algorithm [40], ant colony optimization [41], tree-based techniques [42], fuzzy theory, artificial neural networks (ANN), and FNNs, have been widely used in the field of slope analysis recently. Pradhan et al. [43] have analyzed landslide risk using an ANN-based model. Koopialipoor et al. [44] used various hybrid intelligent systems to evaluate and predict slope stability under static and dynamic conditions. Asteris et al. [45] used several Tree-Based intelligent techniques to study slope stability classification. Chen et al. [46] used the imperialist competitive algorithm (ICA)-ANN and the genetic algorithm (GA)-ANN for the forecasting of SF values. Xiong et al. [47] used a back-propagation neural network method to assess the individual landslide risk along a long-distance multi-product oil pipeline (82 km) in China. Kanungo [48] and Leonardi [49] used fuzzy methods to evaluate the individual landslide risk. Zhou et al. used an FNN to analyze the stability of an individual soft rock slope [50]. Generally, the above studies were performed on individual soft rock slopes, and the overall risk of a soft rock slope group composed of multiple soft rock slopes cannot be evaluated. It seems that, with an increase in the number of soft rock slopes in a group, the control of the soft rock slope group cannot meet the actual demand.
As a machine learning method, an FNN combines fuzzy theory and neural network techniques. FNNs can develop upon the advantages of fuzzy theory and neural networks, while overcoming their shortcomings, and can greatly improve the model analysis and evaluation ability. However, FNNs are more suitable for the risk study of a single soft rock slope, due to the limitation at the input level. Meanwhile, a comprehensive evaluation method can conduct an overall evaluation of multiple individual elements affected by many factors, and can be used for early risk warning of a soft rock slope group. However, there are often unreasonable judgments in the comprehensive evaluation, and it is difficult to determine the weights and single-factor evaluation matrix. The FNN has the advantage of determining the index weights and evaluating matrix for comprehensive evaluation [51]. If an FNN and comprehensive evaluation method are combined, the influence of human factors can be avoided, to a large extent, and the problem of soft rock slope group risk early warning can be addressed. Therefore, this is a very worthy method for improving soft rock slope group risk management.
Therefore, for the purpose of this study, we adopt a comprehensive evaluation method based on an FNN model for the identification and early warning of risks considering multiple soft rock slopes associated to a highway. First, an FNN-based model is developed for the risk identification of an individual soft rock slope. On this basis, we use a comprehensive evaluation method based on the FNN to build an early-warning model, in order to determine the soft rock slope group risk. The model is trained and validated using a large amount of highway soft rock slope data collected on a highway located in southern China.

2. Methods

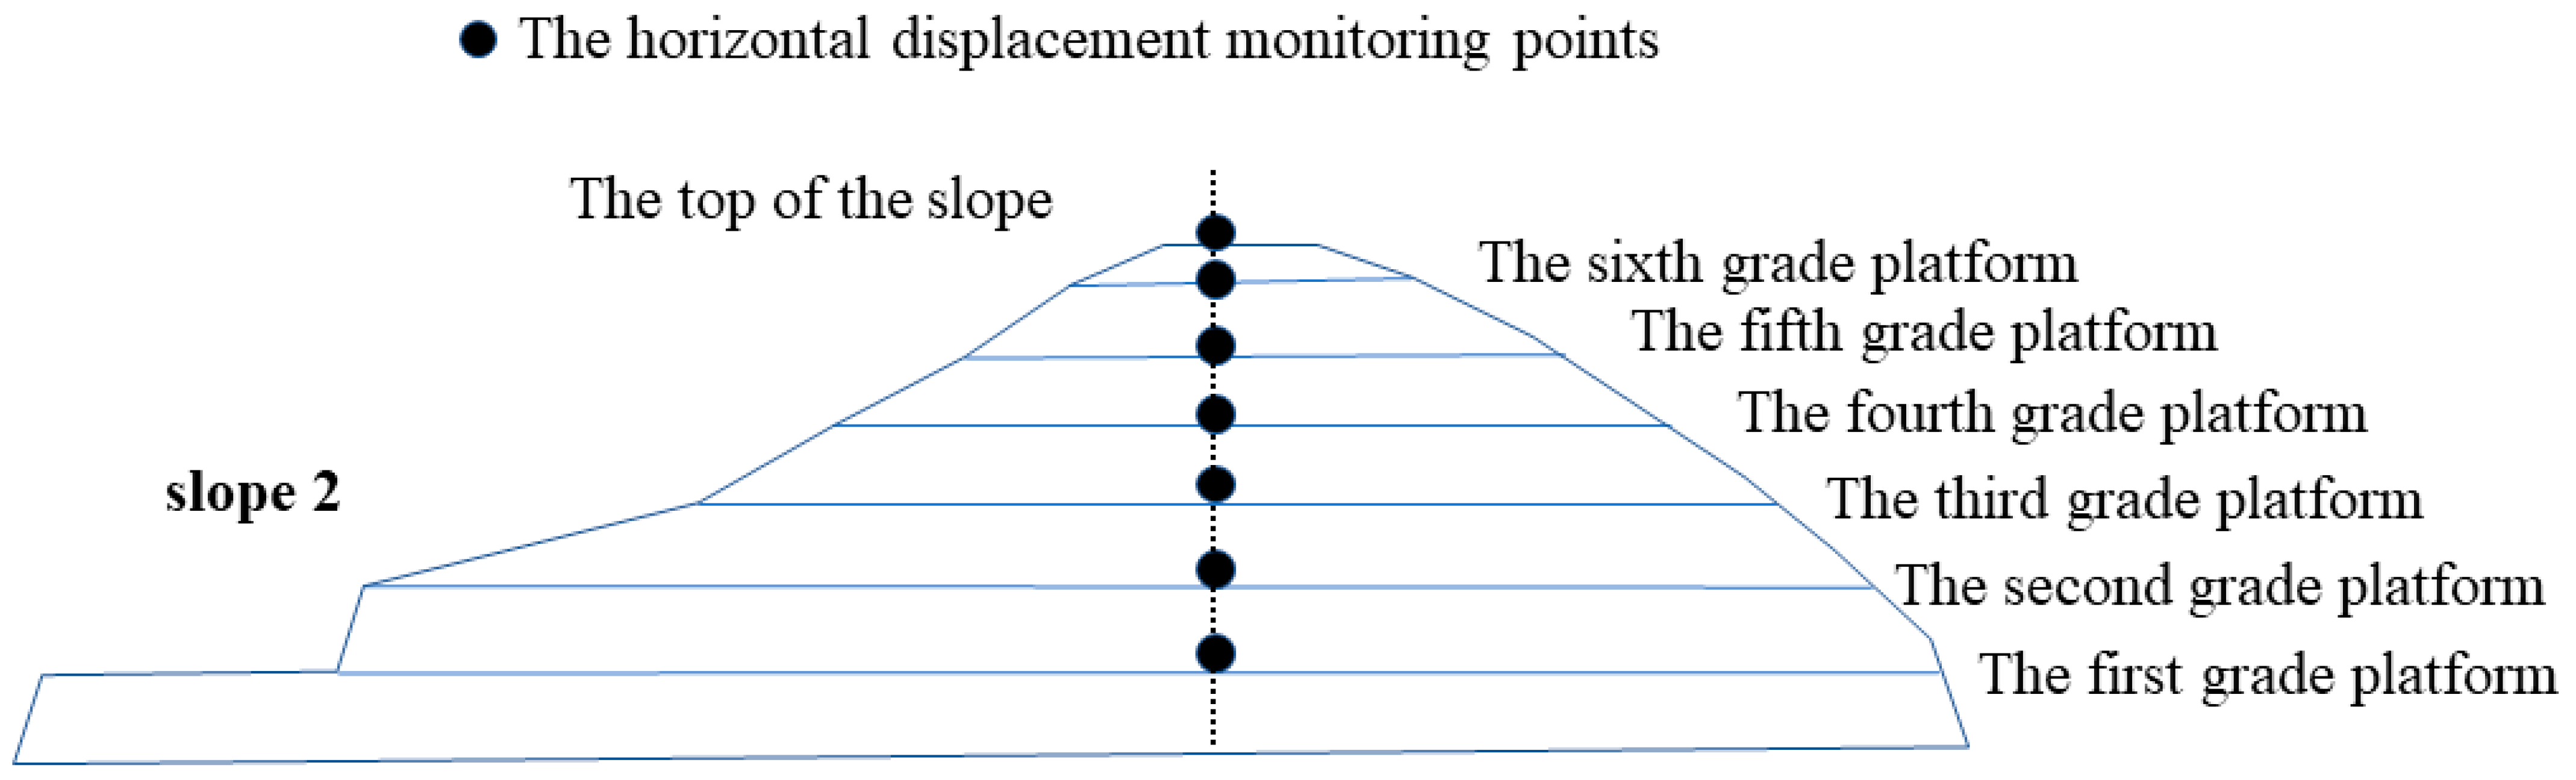
2.1. The Establishment of a Soft Rock Slope Group

According to the definition given in [52], a soft rock slope refers to a kind of slope which is mainly composed of soft and weak rock strata with low strength, high porosity, poor cementation, significant impact of structural surface cutting and weathering, and/or containing a lot of expansive clay minerals (e.g., mudstone, shale, siltstone, and argillaceous sandstone). The soft rock slope group is established based on a so-called “geo-domain”, which represents multiple soft rock slopes with similar geotechnical characteristics that are located in the same geological region [52]. In the present study, the soft rock slopes along a highway are grouped based on the distance between the soft rock slope and the road. The closer the soft rock slope is to the road, the greater the impact of a landslide on the road. As previous research work on soft rock slope engineering [53,54] has suggested that the impact of a landslide is generally seen up to 30 m from a soft rock slope, we mainly focus on a group of soft rock slopes with distance less than 30 m from a highway.

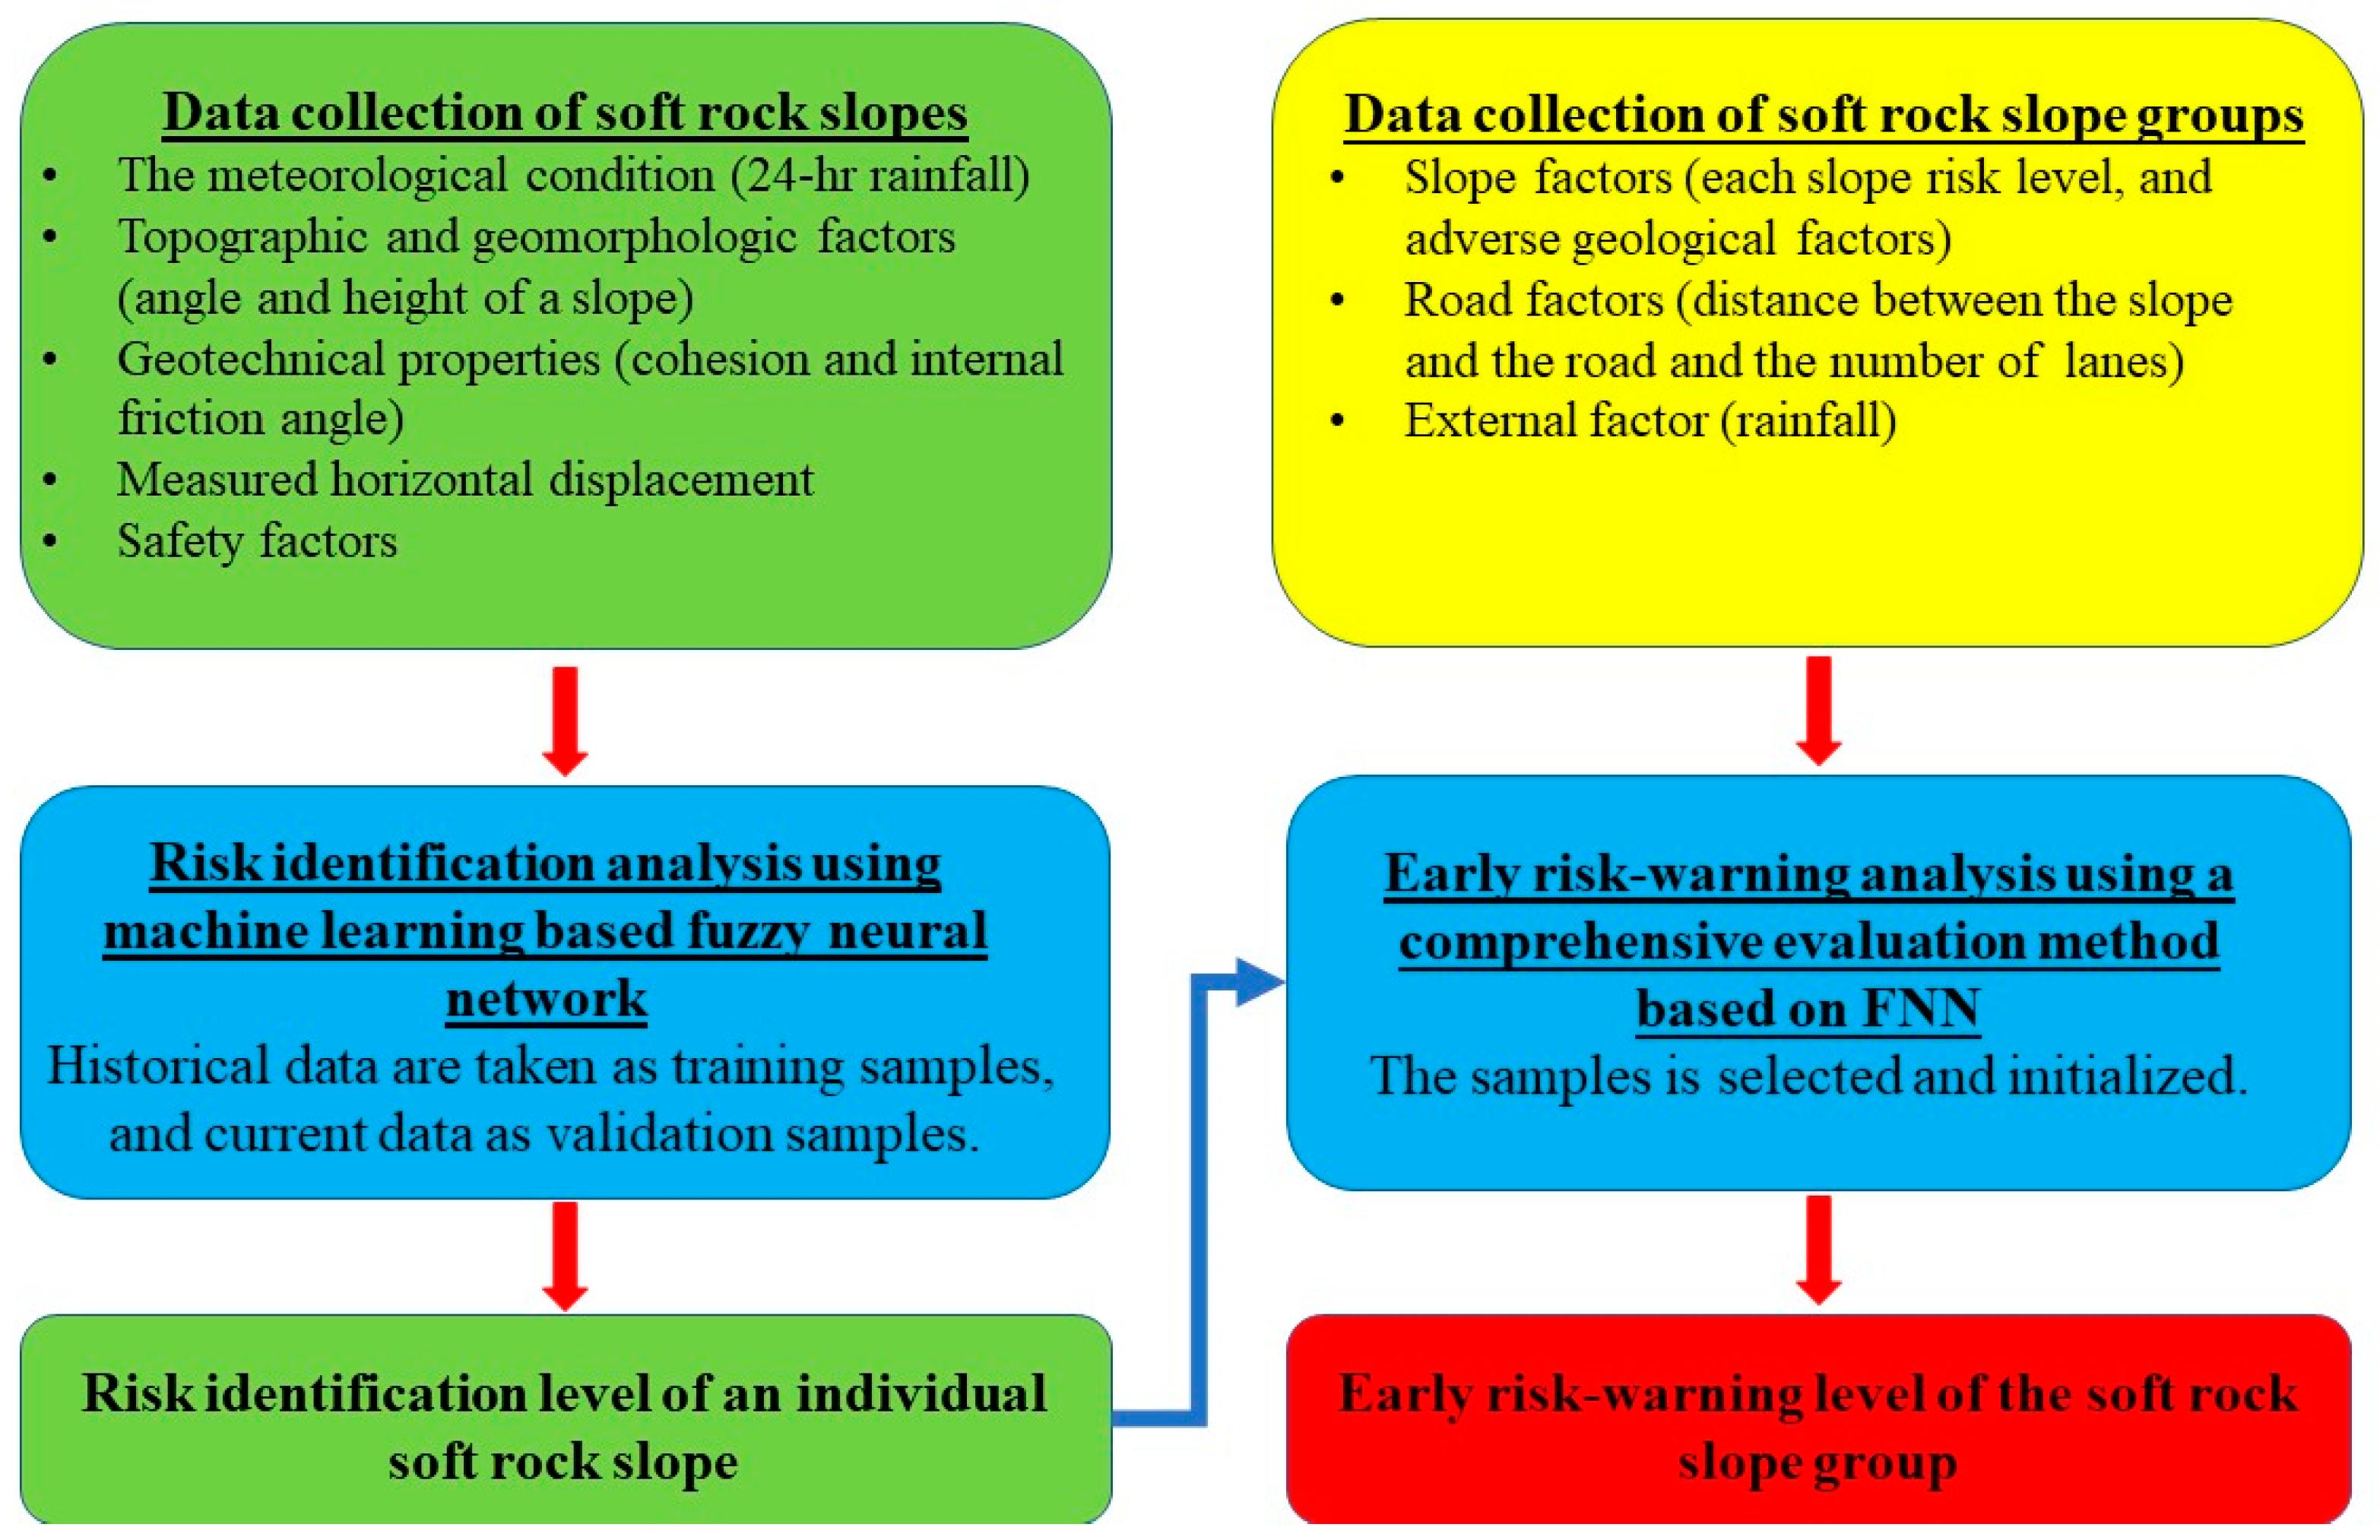
2.2. The Development of the Soft Rock Slope Risk Early-Warning Framework

As shown in Figure 1, an FNN-based machine learning model was first developed to perform risk identification for an individual soft rock slope. The model was then trained using relevant data collected from selected soft rock slopes (such data can be collected from the practical engineering report data). On this basis, a comprehensive evaluation method based on an FNN was adopted to perform risk early warning analysis for the soft rock slope group, from which the risk early warning results for the soft rock slope group can be obtained.

3. Proposed Model

3.1. Risk Identification of an Individual Soft Rock Slope Using FNN

The relationships between the critical factors that govern the safety of a soft rock slope group are complex and nonlinear. Although artificial neural networks (ANNs) possess strong self-learning capabilities, they have limited ability in processing fuzzy and empirical information. Meanwhile, fuzzy theory has various advantages for conducting qualitative soft rock slope risk analysis. FNN combines fuzzy theory [55] with neural network [56] techniques, and can make full use of the advantages of both. An FNN can make the physical meaning of a neural network clear, has self-learning and self-adaptability characteristics, and is suitable for simulating the nonlinear relationships between a soft rock slope’s risk and its influencing factors. Thus, an FNN was adopted for risk identification for an individual soft rock slope in this study.
Figure 2 shows the details of the FNN model developed to analyze the risk of an individual soft rock slope. It consists of data collection, model training, model validation, and model outputs.

3.1.1. Establishment of the Risk Identification Index

An important project appraisal aspect is the accurate collection of reliable input data. Theoretically, the more comprehensive an identification index is, the more it can describe the state of the soft rock slope. However, it is extremely difficult to collect data in practice. In addition, the more indices there are, the more complicated the nonlinear relationships of soft rock slope stability are. Therefore, as early warning indices cannot be treated equally, we must analyze different situations [57,58]. Based on analysis of the many factors affecting soft rock slope risk, the availability of relevant data for the study area and the degree of difficulty in selecting each index and the collected data, we selected soft rock slope risk indices related to the meteorological condition, topographic and geomorphologic factors, geotechnical properties, and the measured horizontal displacement.
(1) The meteorological condition mainly refers to rainfall. Rainfall over a 24-h period was selected as the evaluation index for rainfall. Rainfall may affect slope stability and erode soft rock [59] which, in turn, may affect the temperature of underground structures, and, ultimately, the crack width [60]. Soft rock slopes are prone to collapsing abruptly during or after a rainstorm. This is the most significant and active natural factor that causes landslides. Under the conditions of sustained rainfall, the pore-water pressure increases and the effective stress decreases. These changes reduce the shear strength of the soft rock slope and lead to soft rock slope failure. As rainfall has been identified as an important factor in soft rock slope risk, we mainly discuss the identification of soft rock slope risk under rainfall conditions in this paper.
(2) Topographic and geomorphologic factors include the slope height and slope angle, while geotechnical properties include cohesion and the internal friction angle. These factors directly affect anti-sliding and sliding forces on the sliding surface of the soft rock slope, and these forces then influence the soft rock slope stability and the failure risk of the soft rock slope.
(3) Measured horizontal displacement is another factor affecting the identification of soft rock slope risk failure. To a certain extent, the horizontal displacement of a soft rock slope can reflect the stable state of the soft rock slope, thus importantly affecting the risk of soft rock slope failure.
These indicators were then further divided into five levels, according to the actual collected data in the study area.

3.1.2. Establishment of the Risk Levels of the Individual Soft Rock Slope

The slope stability safety factor of is an important index for evaluation slope risk level. The basic principle of safety factor calculation is to determine the ratio of the anti-sliding force and the sliding force along the failure surface. When the ratio is greater than 1, the soft rock slope body is stable. When it is equal to 1, the soft rock slope is in the limit equilibrium state. Failure occurs when the soft rock slope ratio is less than 1. Thus, the safety factor was selected as the basis for dividing the risk levels of an individual soft rock slope.
According to the safety factor value for the latest technical code for building slope engineering (GB 50330-2013) [61] and the modeling needs for risk identification, the risk level of a soft rock slope is divided into five levels: I (negligible), II (minor), III (mild), IV (major), and V (severe), as shown in Table 1. Risk level I indicates that the soft rock slope is safe and stable, and it does not deform easily. Risk level II indicates that the soft rock slope is moderately safe and in a relatively stable state: it is loose, but will not lead to significant deformation in the future. Risk level III indicates that the soft rock slope is generally in a state of low security, and that large deformations may occur under the influence of external factors. Risk level IV indicates that the soft rock slope is potentially dangerous and in an unstable state: serious soft rock slope damage may occur under certain conditions. Risk level V indicates that the soft rock slope is dangerous and in an extremely unstable state. Its significant deformation and failure may occur at any time.

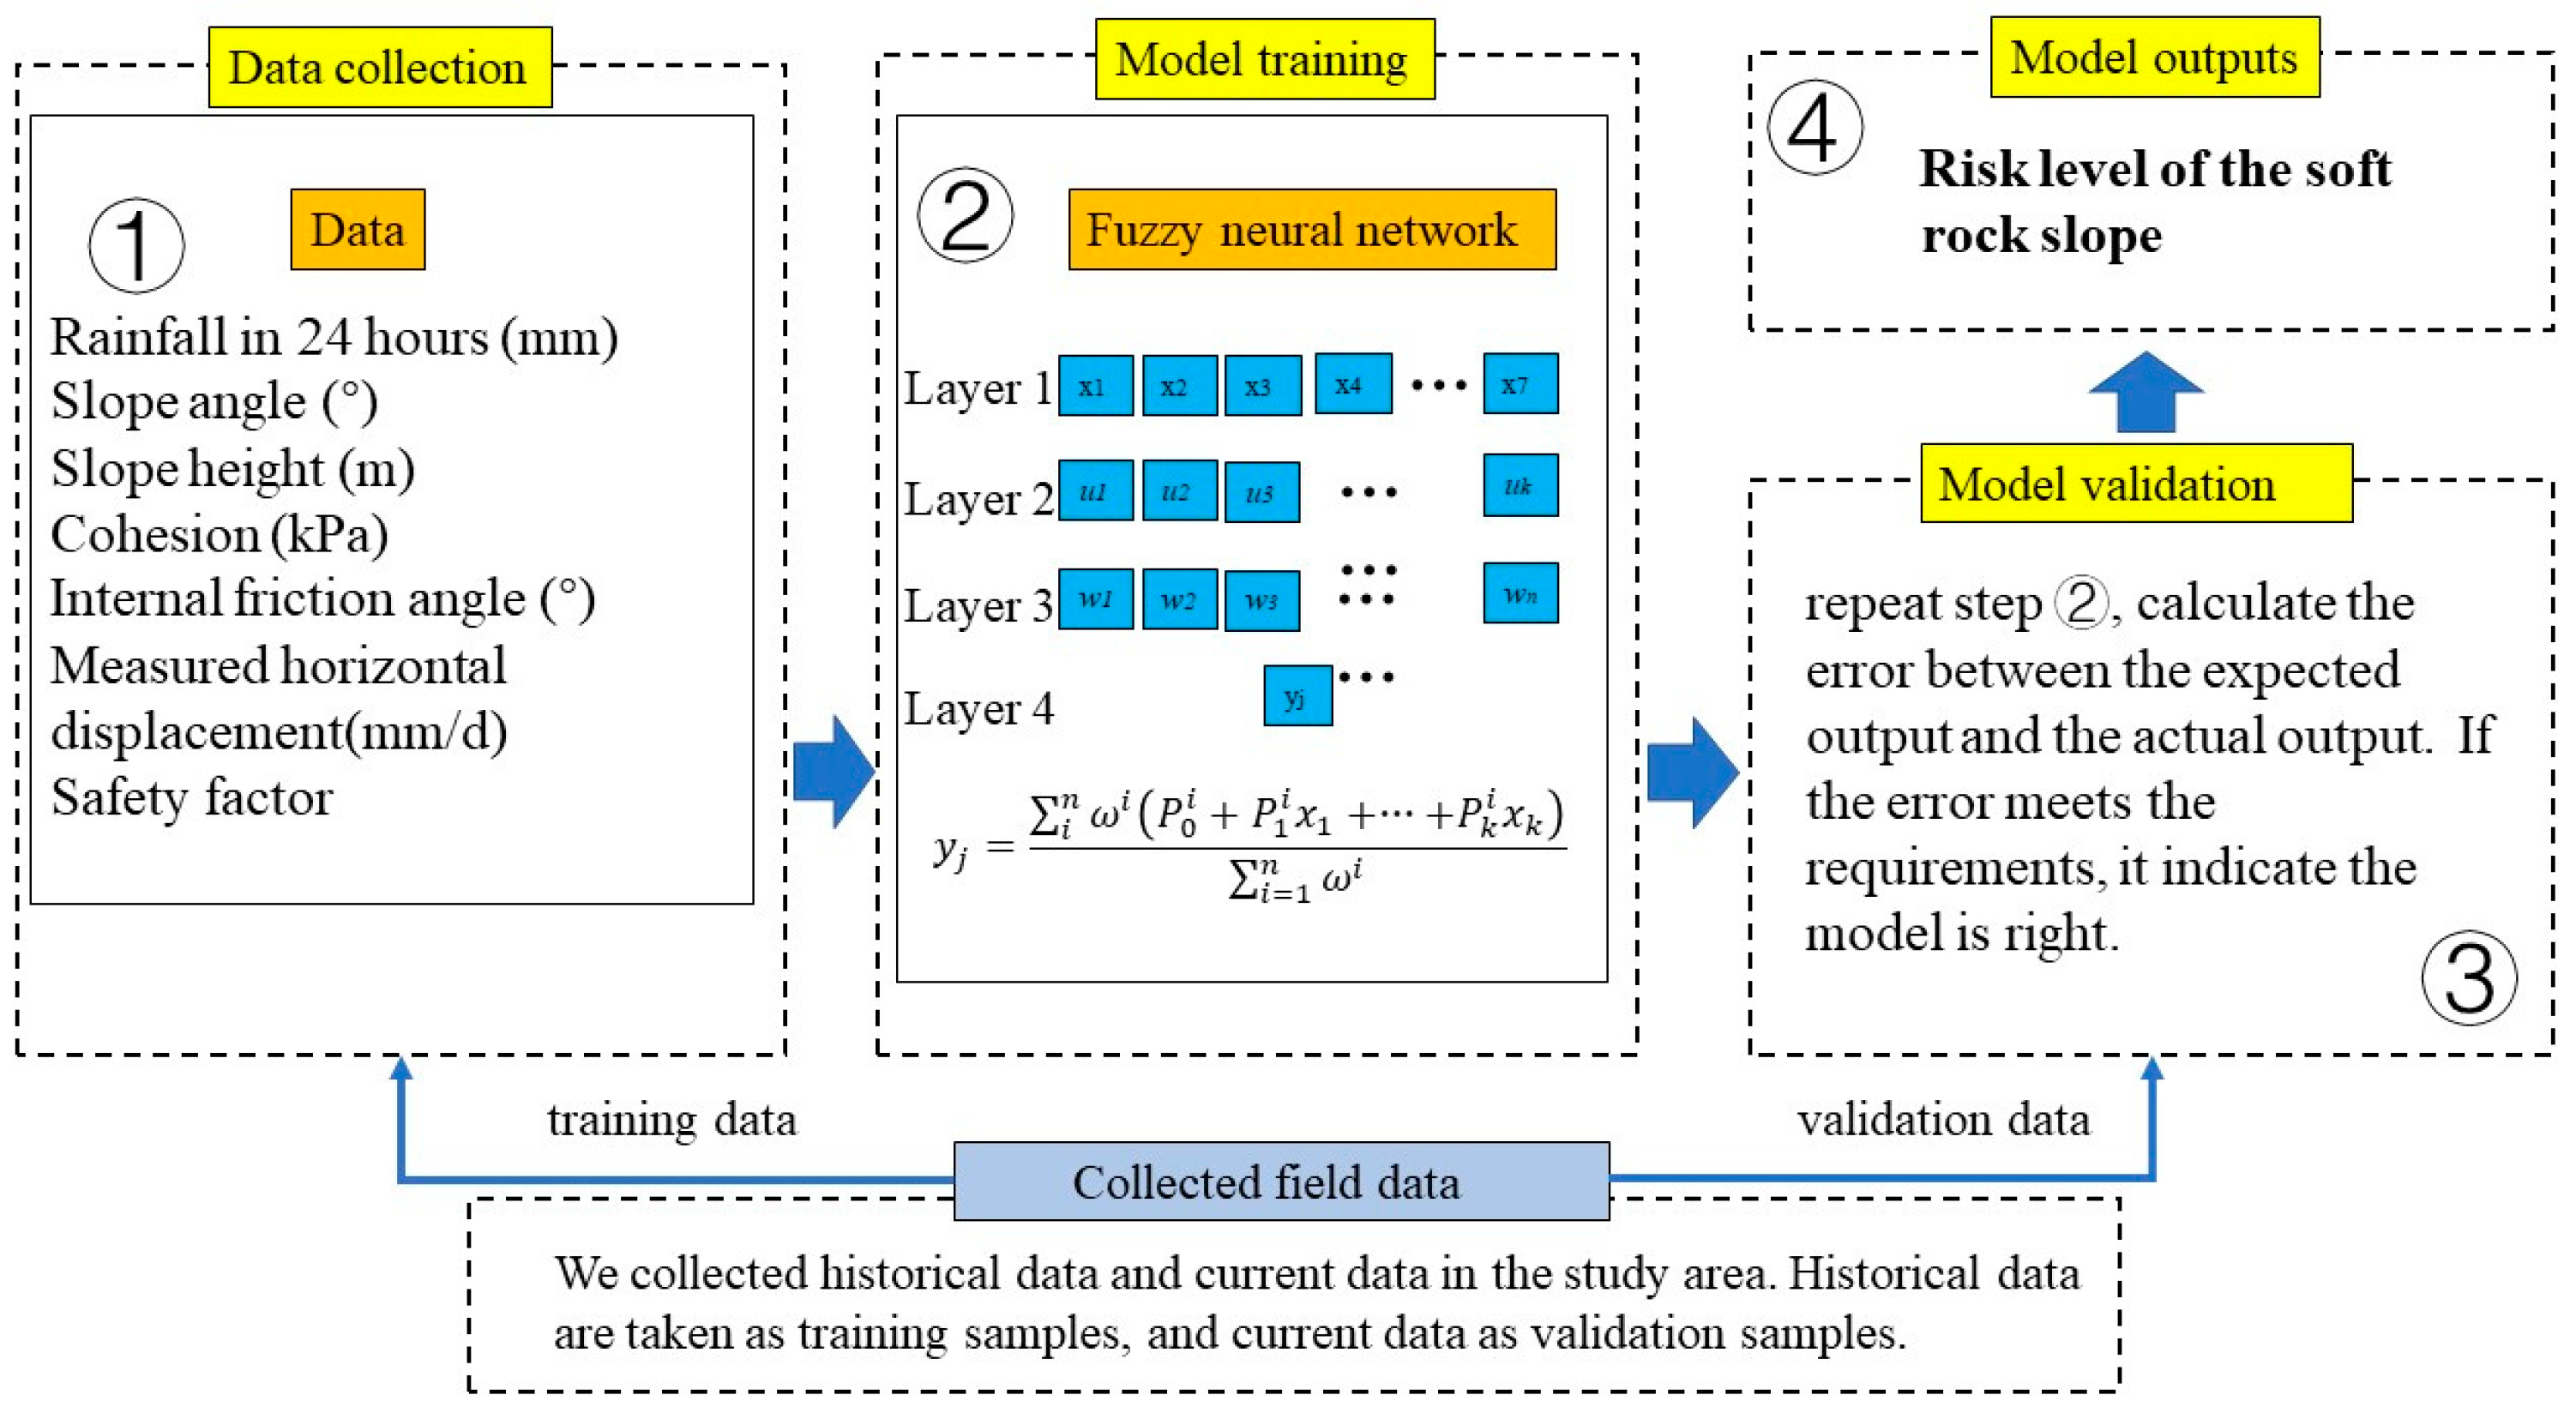
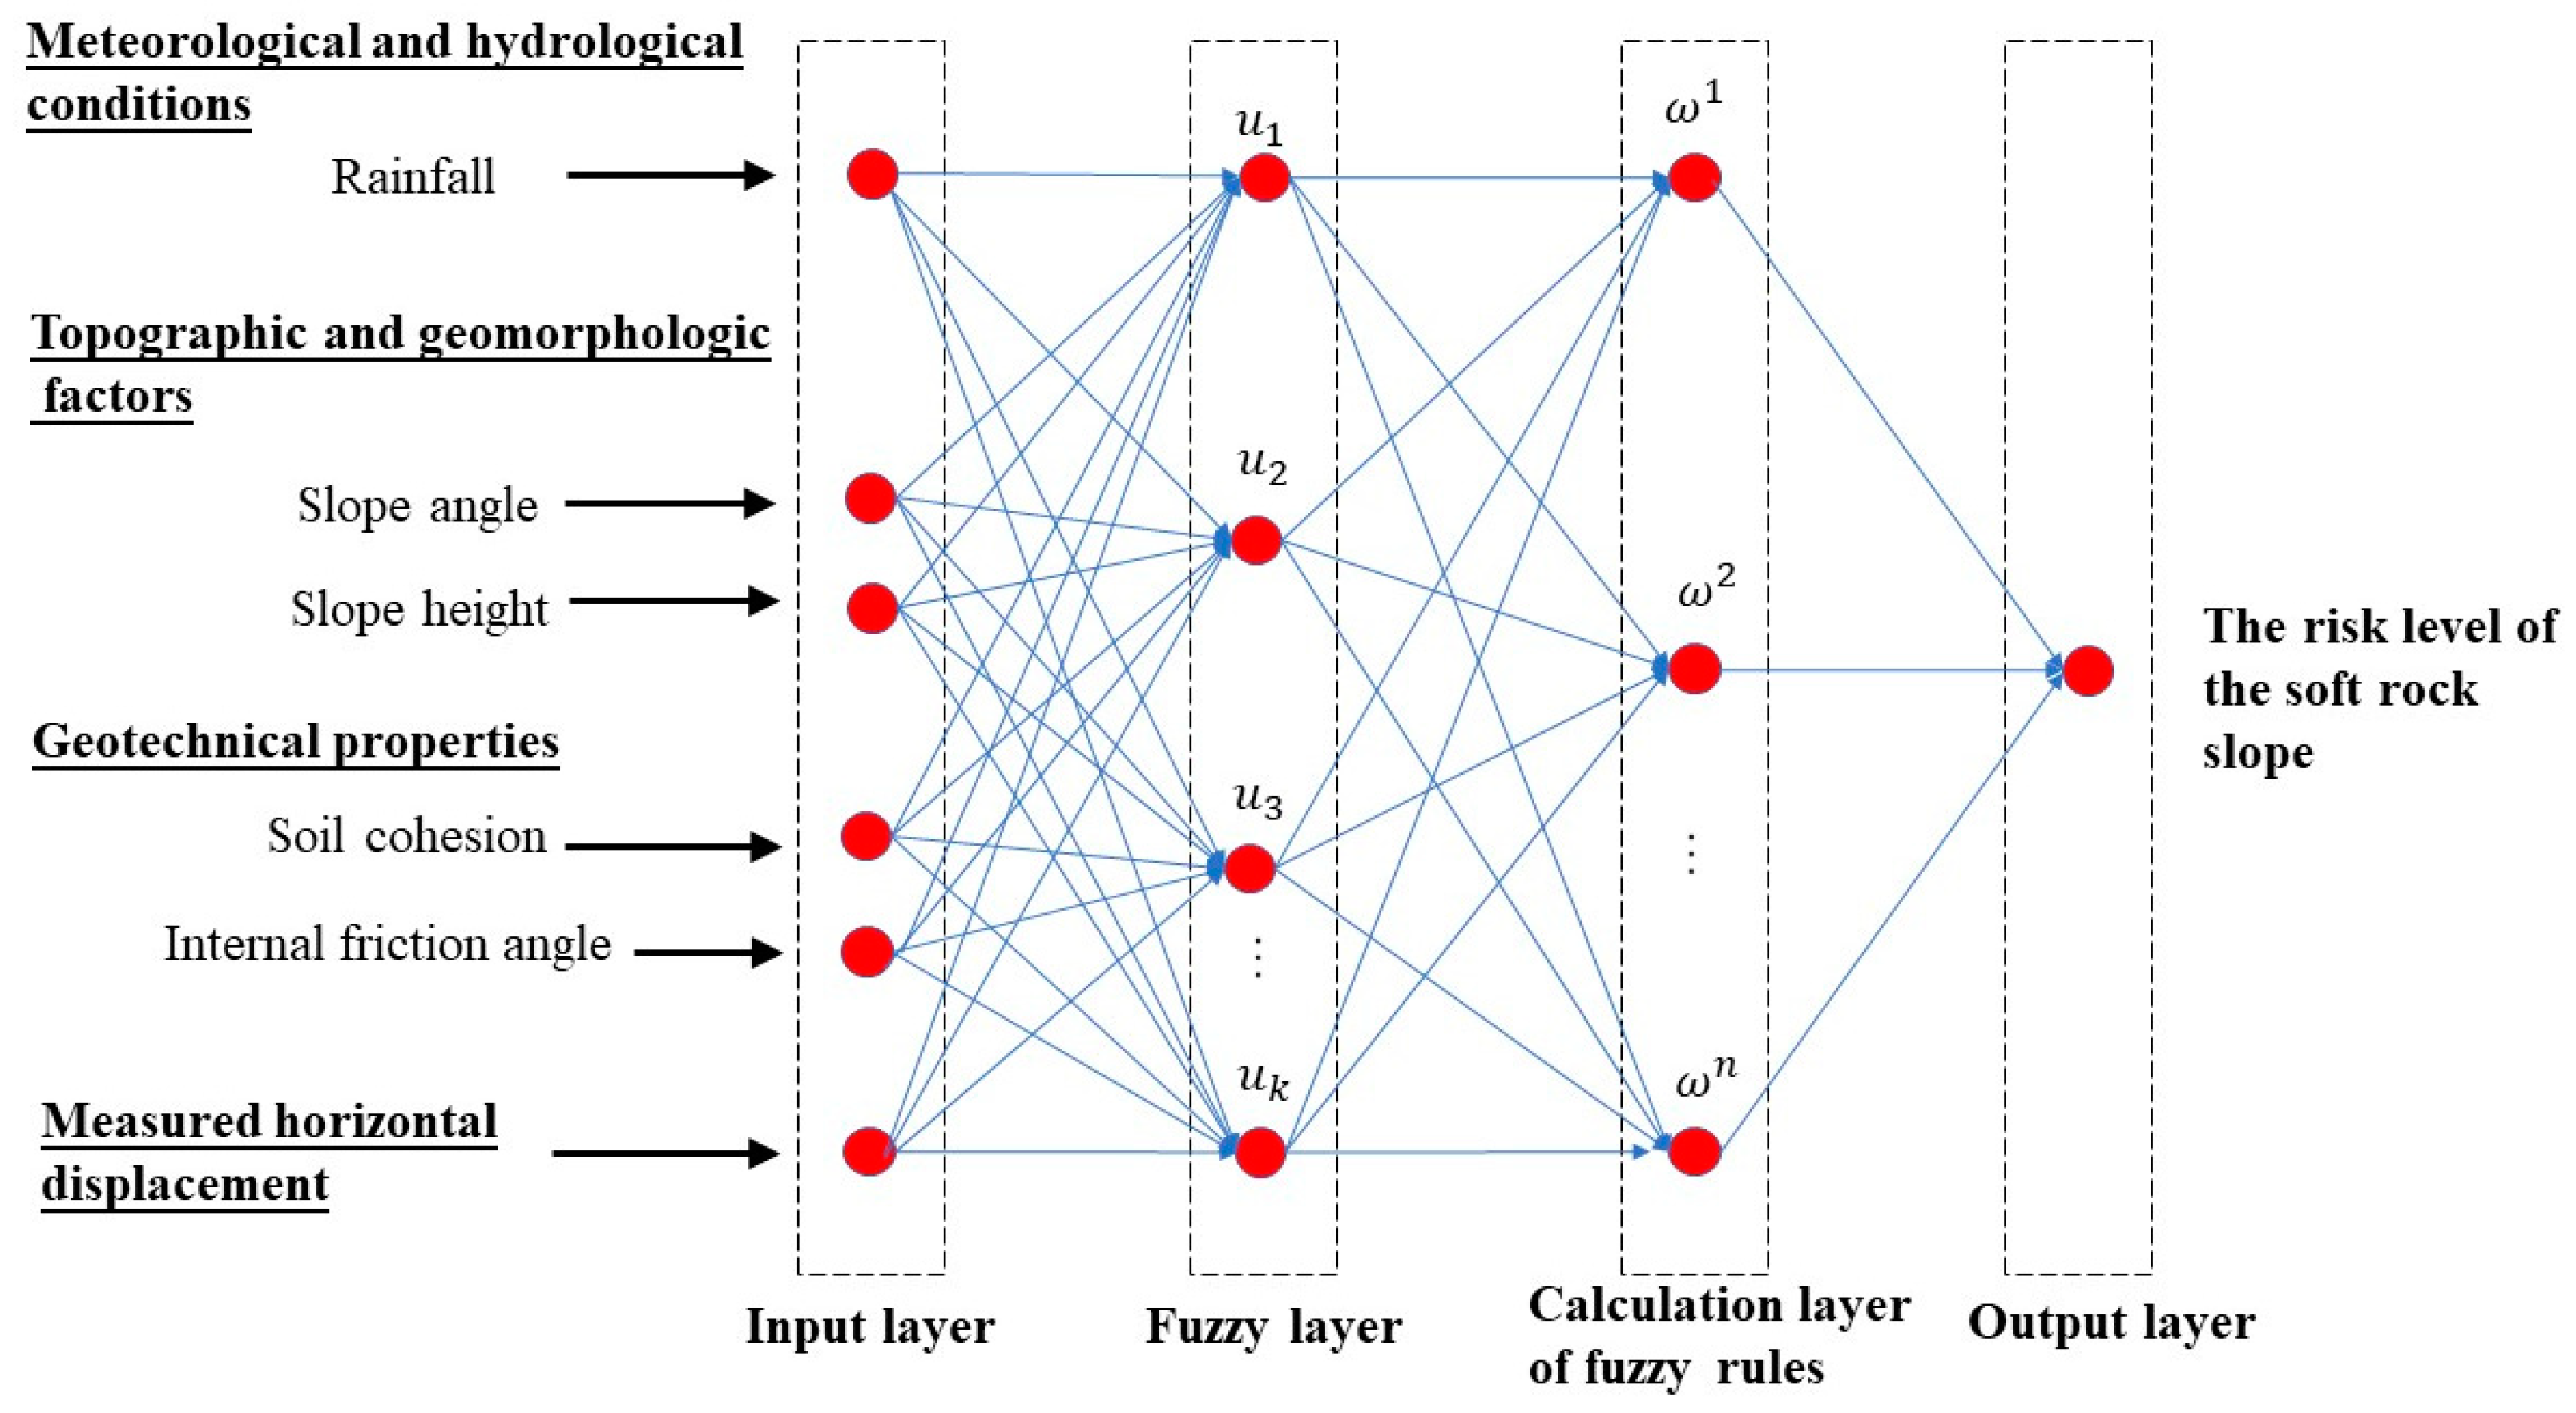
3.1.3. Establishment of FNN model

As shown in Figure 3, the FNN used to identify the soft rock slope risk is composed of four layers: an input layer, a fuzzy layer, a of fuzzy rules calculation layer, and an output layer.
(1) The input layer has six neuron nodes corresponding to the identification indices: rainfall, slope angle, slope height, cohesion, internal friction angle, and measured horizontal displacement.
(2) The fuzzy layer is used to calculate the membership of each input component. The input value is fuzzy in order to obtain a fuzzy membership value. The membership refers to the degree of membership of an element μ to a certain fuzzy subset f, usually expressed as μf(μ) in the interval [0, 1]. The closer the number μf(μ) is to 1, the greater the degree to which μ belongs to f. The closer the number μf(μ) is to 0, the lower the degree to which μ belongs to f. The Gaussian membership function is used here, and the membership of an element in a subset is calculated using Equation (1):
u j i = e x p [ ( x j c j i ) 2 b j i ]             j = 1 , 2 , k ; i = 1 , 2 , , n .
where j refers to the node index of the input layer; c j i and b j i are the center and width of the membership function, respectively; k is the dimension of the input vector; and n is the number of fuzzy subsets. For explanation of each parameter of Gaussian membership function, one can refer to the literature [62].
(3) Calculation layer of the fuzzy rules. Each node of this layer represents a fuzzy rule, and all nodes in this layer constitute a fuzzy rule library. Formula (2) is used to calculate the applicability of each rule.
ω i = u j 1 ( x 1 ) u j 2 ( x 2 ) u j k ( x k )         i = 1 , 2 , , n .
(4) The output layer. The output layer only contains one neuron node. The output layer can calculate the predicted safety factor of the soft rock slope, and outputs the risk level of the soft rock slope (with value according to Table 1). The output value for the predicted safety factor obtained by FNN is calculated using Formula (3):
y = i n ω i ( p 0 i + p 1 i x 1 + + p k i x k ) i n ω i
where p 0 i is the subsequent parameter vector under the fuzzy rules.

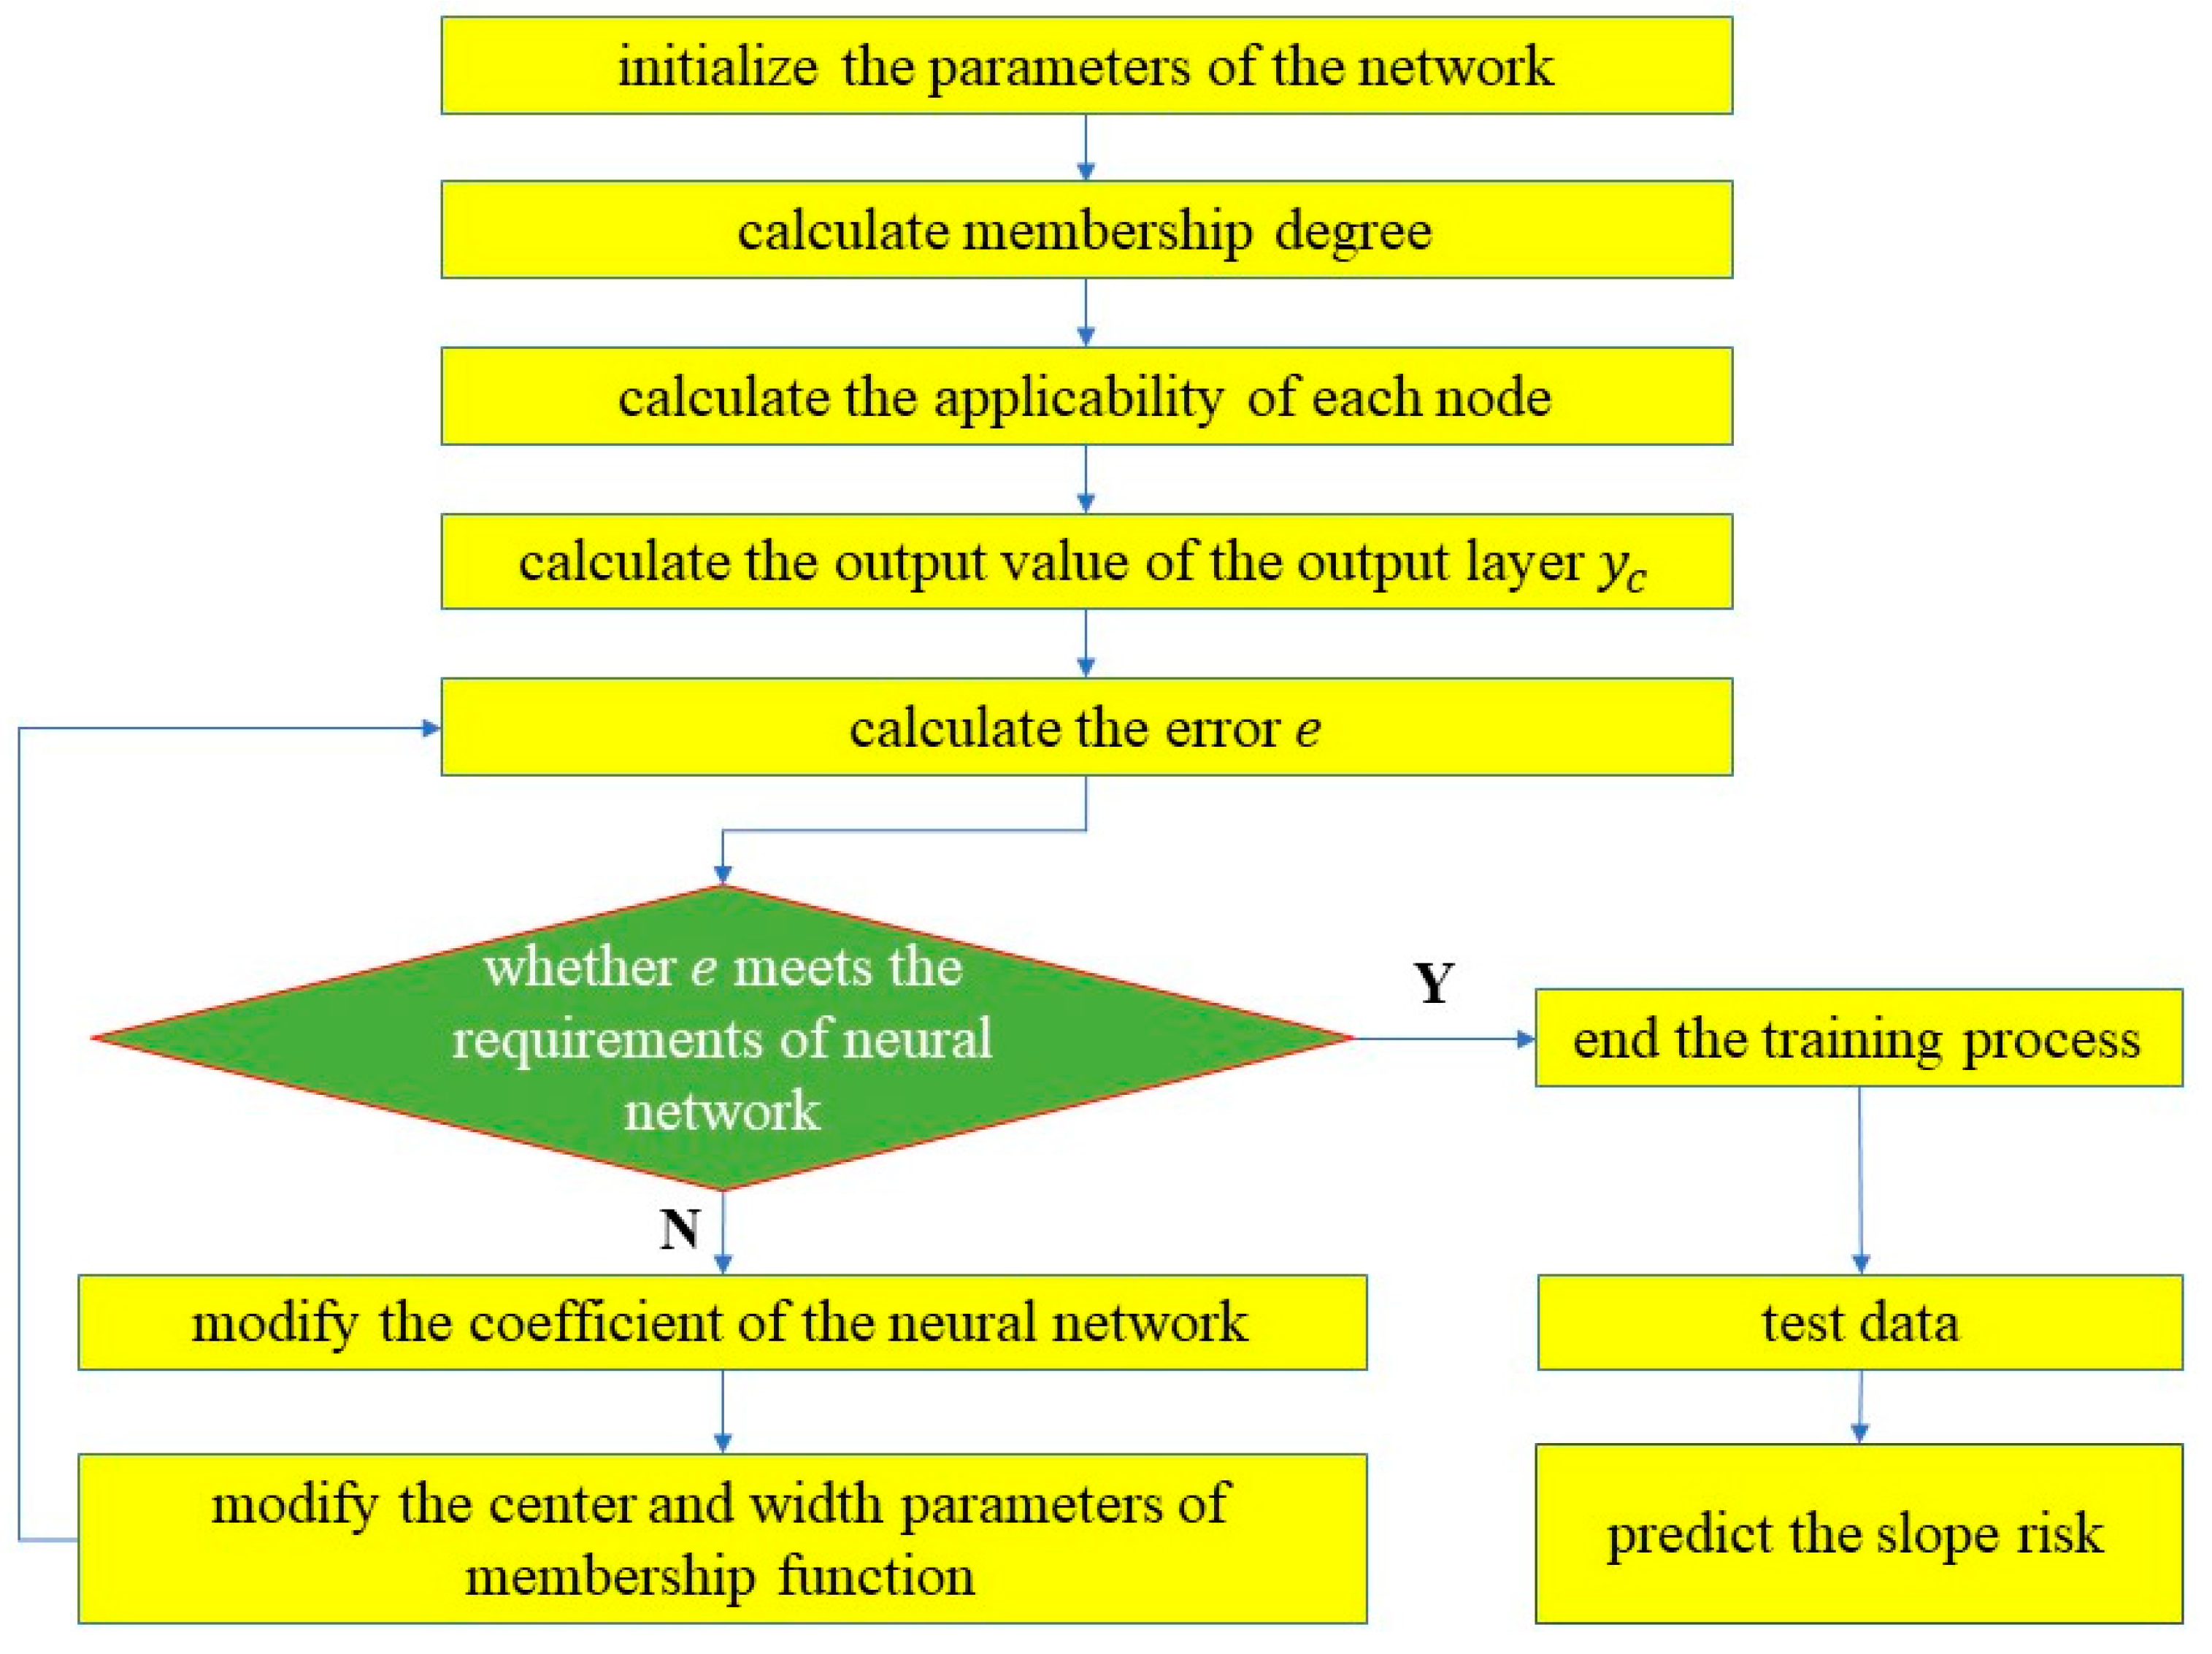
3.1.4. Model Training

Soft rock slope samples data (including rainfall, slope height, slope angle, cohesion, friction angle, measured horizontal displacement, and the safety factor) needed for the model training.
The steps taken to train the FNN were as follows.
(1) Initialize the FNN. We used the FNN structure that was described in Section 3.1.3 for risk identification of the soft rock slope. In the neural network model, the number of training samples is generally required to be larger than the number of validation samples. The number of training samples generally accounts for 2/3 to 9/10 of all samples, or even larger. The proportion of training samples can be adjusted, according to the actual situation. We divided the collected sample data into training samples and validation samples according to our actual needs. Before training, all samples were pre-processed by normalization [63]. The fuzzy membership parameter was then obtained using a random function.
(2) Train the FNN. The FNN was trained using the training samples, and the training process was mainly completed through loop iterations. Subordination functions and fuzzy subordination functions were revised in each iteration. Therefore, each iteration led to evolution of the network. The FNN implemented in this study involved an iterative process which adjusted the weights and threshold values of the network through trial and error. The details of the iterative process are described in Figure 4.
(1) Initialize the parameters of the network.
(2) Make each input value fuzzy in order to calculate the membership degree using a Gaussian membership function based on the structure of the outlined FNN.
(3) Calculate the applicability of each node in the fuzzy reasoning layer.
(4) Calculate the output value of the output layer y c .
(5) Input data and start training the network. The value e refers to error between the expected output and the actual output. The error e is calculated using the equation e = 1 2 ( y d y c ) 2 , where y d is the expected output and y c is the actual output.
(6) Judge whether e meets the requirements of the neural network. If e meets the requirements, end the training process; if not, continue to Steps 7 and 8.
(7) Modify the coefficient of the neural network by P j i ( k ) = P j i ( k 1 ) α e P i i and e P i i = ( y d y c ) ω i / i = 1 m ω i x i , where P j i is the coefficient of the neural network, α is the learning ratio, xj is the input vector of the FNN, and ωi is the continued product of input vector membership degree.
(8) Modify the center and width parameters of the membership function using the equations c j i ( k ) = c j i ( k 1 ) β e c j i and b j i ( k ) = b j i ( k 1 ) β e b j i .
(9) Repeat Step 5.

3.1.5. Model Validation Using the Collected Soft Rock Slope Data

To verify the accuracy of the developed soft rock slope risk identification model, validation samples are required. The validation samples were used as input to the model, in order to predict the results on the validation sample using the trained FNN. Once the prediction results for the risk level and safety factor were obtained, we compared them against the original risk level and safety factor. After the FNN model was verified as being correct, we then used the model to predict the soft rock slope risks.

3.2. Early Risk Warning of a Soft Rock Slope Group Using the Comprehensive Evaluation Method Based on FNN

With an increase in the number of soft rock slopes in a soft rock slope group, it becomes difficult to meet the demands relating to controlling the soft rock slopes in the group. A comprehensive evaluation method can make an overall evaluation of multiple individuals affected by many factors. However, general comprehensive evaluation methods suffer from unreasonable judgment phenomena, and have difficulty in determining weights and single factors. The comprehensive evaluation method based on FNN makes full use of the advantages of the FNN to determine the evaluation matrix, thus avoiding human factors to a large extent and making the results more objective and reliable [51]. Therefore, a comprehensive evaluation method based on FNN is adopted here to explore soft rock slope group risk.

3.2.1. Establishment of the Early Risk-Warning Index

To make the index system more practical, the selection of the index system should positively affect the related data statistics and calculation to the greatest extent possible. Based on analysis of the risk factors of the highway soft rock slope group and the available data, the early risk-warning index for the highway soft rock slope group was constructed in terms of the three aspects of soft rock slope, road, and external factors.
The soft rock slope factors include three evaluation indices for each soft rock slope risk level, the horizontal displacement, and adverse geological factors.
(1) Soft rock slope risk level. According to risk identification for the individual soft rock slope, each soft rock slope risk’s level takes into considered the influence of the soft rock slope angle, soft rock slope height, cohesion, internal friction angle, and measured horizontal displacement. The risk level of each soft rock slope in the group has an important influence on the risk level of the soft rock slope group.
(2) Adverse geological factors. The type and scale of adverse geological phenomena, such as collapses, debris flow, and earthquakes, directly impact the stability of the foundation of the soft rock slope and have an important impact on the risk of the soft rock slope group.
The road factors include the distance between the soft rock slope and the road, as well as the number of lanes:
(1) Distance between the soft rock slope and the road. The closer a soft rock slope is to a road, the greater the landslide damage to the road structure. Therefore, the distance between the soft rock slope and the road was taken as an important index for the early warning of soft rock slope risk.
(2) Number of lanes. The number of lanes included in the study was considered, according to the fact that a road may have some capacity left after it is damaged by a landslide. Under the same damage level, the more lanes there are, the more remaining traffic lanes can be used. This means that the potential risk of the soft rock slope group is relatively reduced. This factor is very important for the emergency treatment in response to soft rock slope group disasters.
The external factor considers the evaluation index of rainfall. Rainfall is the most important and active natural factor causing landslides. In this paper, we mainly discuss the risk early warning of the soft rock slope group under the condition of rainfall, and rainfall is listed as an important factor.
Then we divided these early warning indices into the levels I–V, as shown in Table 2.
(1) Adverse geological conditions. According to the influence of factors such as groundwater, ground fissures, special soil, the influence on the project, etc., the adverse geological conditions are classified and scored in the study area. Here, we refer to the levels and scores used in engineering reports by front-line engineers [63]. The influence of adverse geological was divided into 5 levels: weaker (0.1), weak (0.3), average (0.5), strong (0.7), and stronger (0.9).
(2) Distance between the soft rock slope and road. According to the needs of the model, we divided the distance between a soft rock slope and a road into standards I–V, (i.e., five standards). According to the establishment principle of a soft rock slope group, a distance between a soft rock slope and a road being greater than 30 m is taken as a separate level, and distances less than 30 m were divided into four levels.
(3) Number of lanes. In an actual project, eight is close to the upper limit for the number of lanes, so no fewer than eight lanes were taken as a separate level. Moreover, lanes are often even. According to the needs of group risk modeling, the lanes were divided into 5 levels, ≥8, 6, 4, 2, and 1.
(4) Rainfall. The quantitative indices for the influence of rainfall on landslides mainly include maximum hourly rainfall, accumulative rainfall, and 24-h rainfall. In order to facilitate the analysis, 24-h rainfall was selected as the early-warning index, and the 24-h rainfall affecting the landslide was divided into five levels: I (weaker impact), II (weak impact), III (moderate impact), IV (strong impact), and V (stronger impact). To facilitate the unified analysis of the models, the determination of rainfall classification threshold in the soft rock slope group early risk-warning model was consistent with that in the risk identification model.
The overall highway soft rock slope group early risk-warning index system is detailed in Table 2.
According to the determined index system of the soft rock slope group early risk warning, we considered all five early warning indices above and determined the relevant parameters for the soft rock slope group risk early warning model.

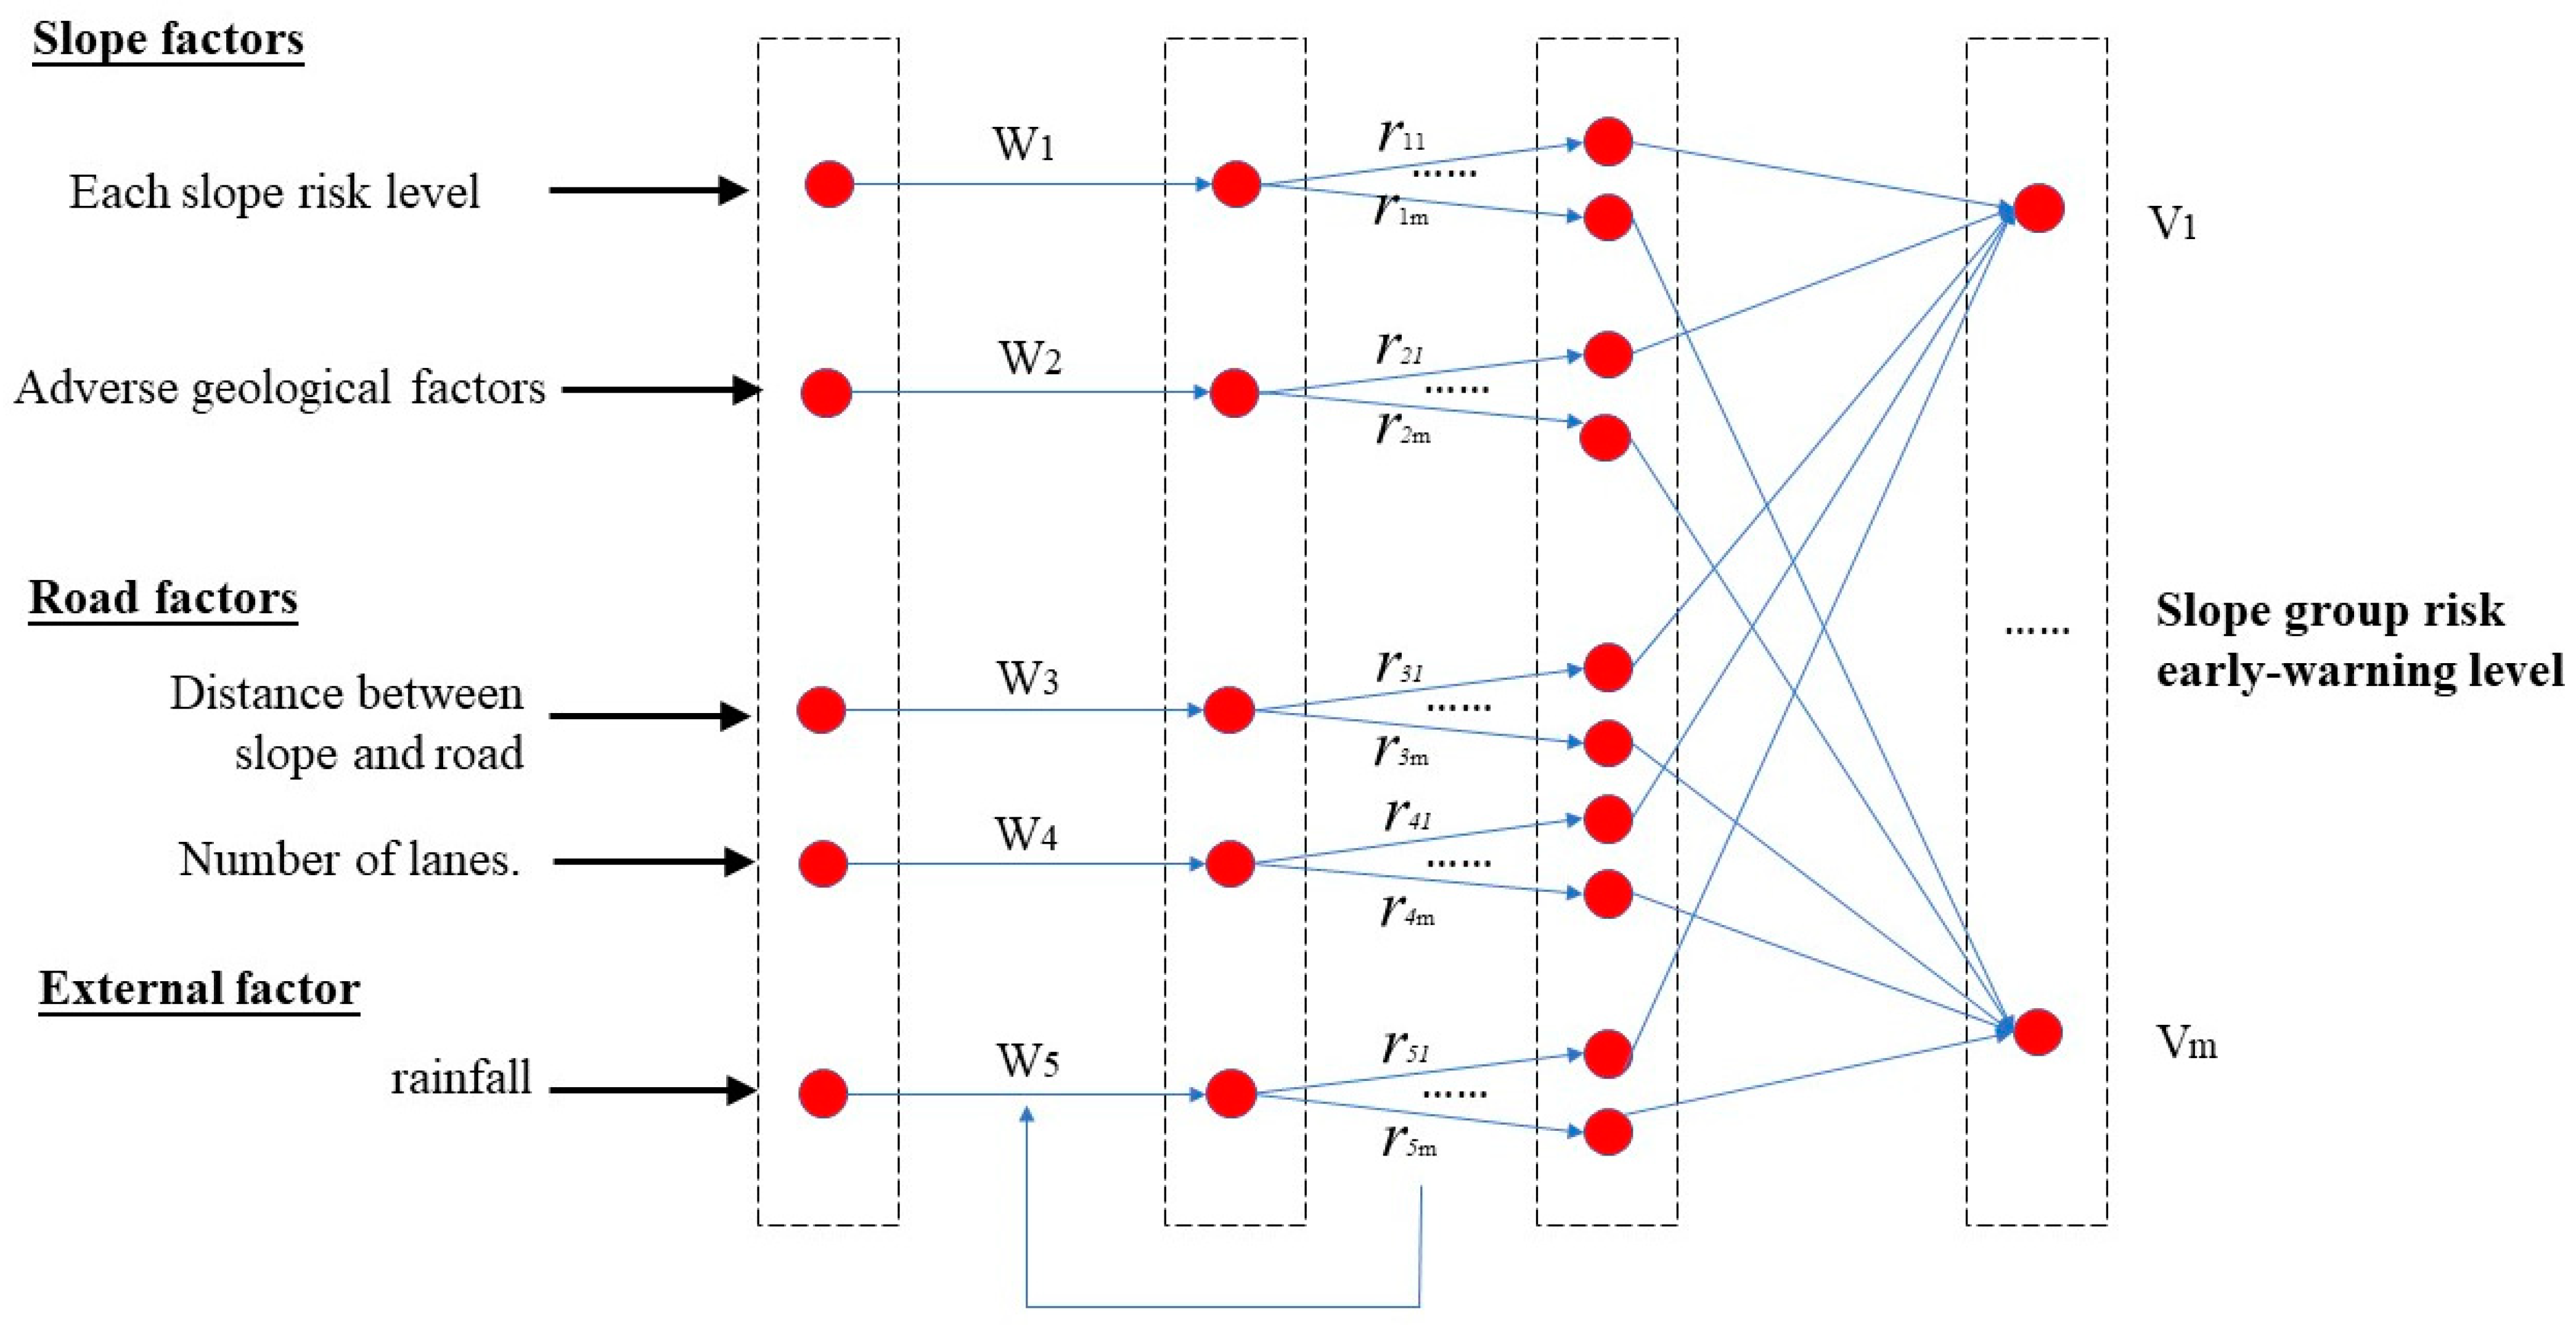
3.2.2. The Comprehensive Evaluation Method Based on FNN

(1) Comprehensive evaluation
The flow of the comprehensive evaluation method is shown in Figure 5.
① Establishing the early-warning factor set
The factor set refers to the set of all factors affecting the evaluated object, denoted as follows:
U = { u 1 , u 2 , , u n }
where u i   ( i = 1 , 2 , , n ) is each influencing factor and n is the total number of influence factors. In this paper, U includes each soft rock slope risk level, the distance between the soft rock slope and road, the number of lanes, the 24-h rainfall, and the adverse geological condition.
② Establishing the early-warning result factor set
The early-warning set refers to the set composed of all possible early-warning results of evaluated objects, denoted as follows:
P = { p 1 , p 2 , , p n }
where P is the early-warning result set. According to the needs of a soft rock slope risk evaluation model, the soft rock slope risk early warning level can be divided into five levels. Here, P = (I (extremely low), II (low), III (medium), IV (high), V (extremely high)). Level I means that the soft rock slope group is safe and in a stable state, and that the road can operate normally. Level II means that the soft rock slope group is moderately safe and in a relatively stable state: there are unstable factors in the soft rock slope group, but it will not affect road functions in the future. Level III means that the soft rock slope group is generally low in safety: under the influence of external factors, the occurrence of unstable changes can affect the road’s functions and utility. Level IV indicates that the soft rock slope group is in a potentially dangerous and unstable state: under certain conditions, damage to the soft rock slope can affect its functions. Level V indicates that the soft rock slope group is in a dangerous and extremely unstable state: large deformations and failure may occur at any time, and the road is likely to become seriously damaged.
③ Establishing the subordination degree matrix
Suppose that the evaluated object is assessed according to the evaluated element i (namely, u i   ( i = 1 , 2 , , n ) ) in the factor set. The early-warning result for element i with respect to the subordination degree of element j in the early-warning set (namely u i   ( i = 1 , 2 , , n ) ) can be expressed as follows:
R i = { r i 1 , r i 2 , , r i k }
If n early-warning elements are comprehensively evaluated, the result is a matrix with n rows and k columns, denoted as the subordination degree matrix R:
R = [ r 11 r 1 k r n 1 r n k ]
④ Establishing the factor weight set
W = ( w 1 , w 2 , , w n )
where w i ( i = 1 , 2 , , n ) is the weight number, which refers to the degree of influence of each influencing factor u i   ( i = 1 , 2 , , n ) on the evaluated target, and W is the factor weight set. The factor weight set considered here is the weight set for each soft rock slope risk level, the distance between the soft rock slope and the road, the monitoring data of the horizontal displacement, the number of lanes, the 24-h rainfall, and the adverse geological influence in the soft rock slope group early risk warning.
⑤ Obtaining the early warning results
The early warning result reflects the comprehensive influence of all the influencing factors. It can be obtained by multiplying the weight factor set by the subordination degree matrix, as follows:
V = W × R = ( w 1 , w 2 , , w n ) × [ r 11 r 1 k r n 1 r n k ] = ( v 1 , v 2 , , v k )
(2) A comprehensive evaluation method based on FNN
The soft rock slope group risk early warning model adopts a comprehensive evaluation method based on an FNN [51], as shown in Figure 6. The input layer of the model of the soft rock slope group risk early warning should have five neuron nodes: the risk level of each soft rock slope, the distance between the soft rock slope and the road, the number of lanes, the 24-h rainfall, and the adverse geological factors. The output layer also has five neuron nodes, which respectively correspond to the soft rock slope group early risk-warning levels: I (extremely low), II (low), III (medium), IV (high), V (extremely high). For more information on the determination of the index weights and evaluation matrix, they have been previously detailed in the literature [51]. To achieve a unified purpose, the evaluated matrix and weight coefficients are taken as the input weights of the neural network, and the existing sample data are used to train the network. Then, the evaluated matrix is modified, according to the error back-propagation method. Finally, the weights are adjusted using the modified evaluated matrix.
The specific solution steps are as follows [51]:
(1) Set the initial judgment matrix R ( 0 ) , the expected output vector B * , and the error ε ; assume R ( t ) is the evaluation matrix at time t .
(2) Calculate the maximum membership degree of each factor G ( t ) .
(3) Calculate the bias of the evaluation matrix R ( t ) .
(4) Calculate weight vector W ( t ) .
(5) According to the equation B ( t ) = W ( t ) R ( t ) , calculate the output of the actual network B ( t ) .
(6) According to the equation ε = B ( t ) B * , calculate the error ε between the output of the actual network and the expected output. If the error ε is less than the set error ε , go to the next step, otherwise return to Step 2.
(7) Modified evaluation matrix, denoted as R ( t + 1 ) .
(8) Repeat steps 2–5 according to the revised evaluation matrix R ( t + 1 ) , and calculate the output of the actual network B ( t + 1 ) . If the result meets the equation B ( t + 1 ) B * < ε , go to the next step; otherwise, go back to Step 2.
(9) Comparing R ( t + 1 ) with R ( t ) . If the equation m a x { ( r i j ( t + 1 ) r i j ( t ) ) } < ε is met, stop iterating, and R ( t + 1 ) is what we want; otherwise, go back to Step 2. ( r i j ( t ) is an element of the matrix R ( t ) ;   r i j ( t + 1 ) is an element of the matrix R ( t + 1 ) ).

3.2.3. Model Training and Output

According to the early risk-warning index system for a soft rock slope group, we collected samples from a soft rock slope group in the research area and determined the training samples. According to the soft rock slope group risk early warning model, the early risk warning index system data were taken as input to the neuron nodes of the input layer, while the early risk-warning level was taken as the output of the nodes of the output layer. We then initialized and trained the FNN in the same manner as for individual soft rock slope risk identification. When the FNN model training ended, the soft rock slope group early risk-warning model based on the fuzzy comprehensive evaluation method was obtained. Based on the established risk early warning model, we input the risk early warning index data of the predicted soft rock slope group, then obtained the associated risk warning level.

4. Case Study

4.1. Dataset Collection and Preparation

The study area was located in the Nanling mountain areas, in Guangdong province, southern China, as shown in Figure 7. The highway is wide and passes through a hilly area that is dense, with a river network and greatly undulating terrain. Most of the highway has sections that are highly filled or dug in. The geology along the project is complex, and there are many bad geological areas. In particular, the lines with complex geological environment in this area are long and pass through a variety of geological units (e.g., soft rock, karst, soft soil, and so on) having the characteristics of concealment and complexity. Among them, there are many soft rock slopes, and the data types involved in stability monitoring and control are various, complex and large, which leads to difficulties to in risk control and safety guarantee for the project, to a certain extent.
According to the stratum information of slopes in this region (as shown in Table 3), there were many layers of weak rock in the slopes of the study region, mainly consisting of mild clay, siltstone, and mixed gneiss, which are characterized by low strength, high porosity, and poor cementation. According to previous definitions, the slopes in this area are soft rock slopes.
The used data (slope angle, slope height, friction angle, weight, cohesion, measured horizontal displacement, safety factors) can be found in a detailed engineering geological survey report [64]. According to the engineering report data, the sample selection was based on the latest technical code for building slope engineering (GB 50330-2013) [61], and specific measurements of the data (i.e., slope angle, slope height, friction angle, weight, cohesion, measured horizontal displacement) were based on standard test methods for engineering rock mass [65]: soft rock slope angle and height were measured using a total station instrument; internal friction angle and cohesion were measured through a triaxial compression test; weight was measured by balance; and the horizontal displacement was measured using a fixed inclinometer. For safety factor data, the basic principle of calculation is to determine the ratio of the anti-sliding force and the sliding force along the failure surface. The calculation method and formula for the slope safety factor with different sliding surface morphology are given in the technical code for building slope engineering (GB 50330-2013) [61]. These data can be obtained directly, as the value of the safety factor is provided in the engineering geological survey report. The 24-h rainfall was collected based on shared data released by the National Meteorological Administration in the study region [66].
By sorting out the above data of the study area, Table 4 and Table 5 were finally obtained.
Soft rock slopes 1, 2, 3, and 4, with similar geotechnical characteristics, were located in the same geological region. The distances of these soft rock slopes from the highway were all less than 30 m. These slopes satisfy the establishment principle of slope group, so soft rock slopes 1, 2, 3, and 4 in this region were regarded as a highway soft rock slope group. This group was called the object soft rock slope group, which is depicted in Figure 8.
Using the project data [64], the distance between each soft rock slope and the highway (with reference to the foot of the slope), the number of lanes and the monitoring contents were obtained. In order to gain a clear understanding of the risk status of the soft rock slope group, site monitoring and manual inspection of the soft rock slope group was carried out. Monitoring contents included the actual monitoring results for the slope group, such as the horizontal displacement, the slope grade ditch, the frame beam, and cracks. Among them, the horizontal displacement was mainly measured using a fixed inclinometer. The horizontal displacement monitoring was arranged on all platforms and the top of the slopes. Taking slope 2 as an example, the horizontal displacement monitoring points were respectively arranged at the position of the first platform, the second platform, the third platform, the fourth platform, the fifth platform, the sixth platform, and the top of the slope on the same axis of the slope, as shown in Figure 9. The same method was used to monitor the horizontal displacement of the other slopes. The horizontal displacement of the slope was obtained by taking the average of the detection results at all monitoring points on the slope; that is, the horizontal displacement was not based on a single monitoring point.
The relative information is shown in Table 6 and Table 7. The method used to select the sampling points was a conventional method based on the latest technical code for building slope engineering (GB 50330-2013) [61]. The slope angle, slope height, friction angle, weight, cohesion, measured horizontal displacement, and safety factors also can be found in the detailed engineering geological survey report [64]. The 24-h rainfall data were collected from shared data released by the National Meteorological Administration for the study region [66]. The monitoring data were obtained from the expressway slope engineering monitoring report [67]. In addition, the distances between the soft rock slope and road, as well as various lengths, were measured using a total station instrument. The soft rock slopes were steep, with large filling and excavation heights. This area easily softens and collapses when saturated with water, easily causing landslides and other adverse geological phenomena. During rainfall, the rock properties of the soft rock slope change rapidly due to the infiltration of rainwater, including a rapid increase of moisture content, decrease in cohesion, increase in the rock bulk, and softening of the rock mass. Therefore, the soft rock slope is faced with a high risk of a landslide under certain rainfall conditions. Rainfall occurred in this area from 20 to 24 June in 2005, and the 24-h rainfall value recorded on 23 June 2005 was taken as 65 mm, which is one of the early warning indices. Now we begin to identify and determine the risk of the soft rock slope group on the highway.

4.2. Risk Identification of an Individual Soft Rock Slope Using FNN

According to the risk identification index, we first needed to further determine the classification parameters of the soft rock slope angle, soft rock slope height, cohesive, internal friction angle, rainfall, and measured horizontal displacement.

4.2.1. Risk Identification Index

Analyses of the soft rock slope samples (see Table 4) in the study area provided the statistical value ranges for the slope angle, slope height, cohesive, internal friction angle, and rainfall values as 20–50 (°), 30–120 (m), 18–72 (KPa), 15–45 (°), and 10–64 (mm), respectively. According to the value ranges, these indices were divided into five levels, as shown in Table 8. Based on the analysis of a soft rock slope report [64] for the study area, monitoring and early warning standards were established for high soft rock slope engineering. The standards were divided into three warning levels; namely, the warning level, danger level, and high danger level. The corresponding standards for horizontal displacement were 3–5 mm/d, 5–8 mm/d, and >8 mm/d, respectively. To meet the requirements for modeling, we divided the horizontal displacement warning with less than or equal to 3 mm/d into two further levels, resulting in five levels of warning, as shown in Table 8.

4.2.2. Model Training and Validation

According to the principle of FNN, the soft rock slope risk identification model based on FNN was realized by programming in the commercial software MATLAB 9.2 (MathWorks, Natick, MA, USA). The 80 soft rock slope data presented in Table 4 were taken as training samples, and the soft rock slope data in Table 5 were used as validation samples. The training samples accounted for 84% of the total number of historical and current data. We needed to initialize the samples data. The sample data were normalized through transformation by linear functions, while the parameters for the fuzzy subordination degree were obtained using a random function.
(1) Training the FNN. The training sample data were input into the soft rock slope group risk identification model, according to the FNN structure outlined in Section 2.2. The training process mainly occurred through looped iteration. The number of iteration steps was set to 300. When the error of the training target reached a specified accuracy (0.1), training iteration was considered to have converged. As shown in Figure 10, the error decreased with the number of iterations. This occurred when the number of iterations reached 253 steps, whereupon the network training was ended.
(2) Validate the FNN. The validation sample data (i.e., rainfall, slope height, slope angle, cohesion, friction angle, moisture content of soft rock, and measured horizontal displacement) were input into the trained FFN model. The predicted safety factor of each soft rock slope sample was then obtained, as shown in Figure 11, while the original safety factor for each soft rock slope sample was obtained from the engineering data. To verify the accuracy of the established model after the fuzzy neural network training had ended, the predicted safety factor for each validation samples was compared with the associated original safety factor. Figure 11 shows a comparison between the predicted safety factor and the original safety factor for each soft rock slope sample. In terms of the specific numerical values, there were some errors between the predicted and original safety factors.
Then, according to the original safety factors of the slope samples, combined with the relationship between the safety factors and risk level described in Table 1, the original risk levels of the slope samples were obtained. According to the predicted safety factor of each validation sample, the validation results of the risk level predictions were obtained, as shown in Figure 12.
We focused on the risk level of the soft rock slope, and predicted that the safety factor was within the range required by the risk level. Therefore, from the perspective of the risk level, the predicted risk level of each sample was consistent with the original risk level (except for that of slope 4–2), and the sample risk levels prediction accuracy was 93.3%, as shown in Figure 12. FNNs have the characteristics of self-learning, self-organization, good fault tolerance, and excellent nonlinear approximation ability, but there are inevitably some errors in the prediction results. The results indicate that the model showed a good training effect, and can meet the accuracy requirement for prediction. Therefore, the learning and generalization ability of the FNN model for soft rock slope risk identification were verified.

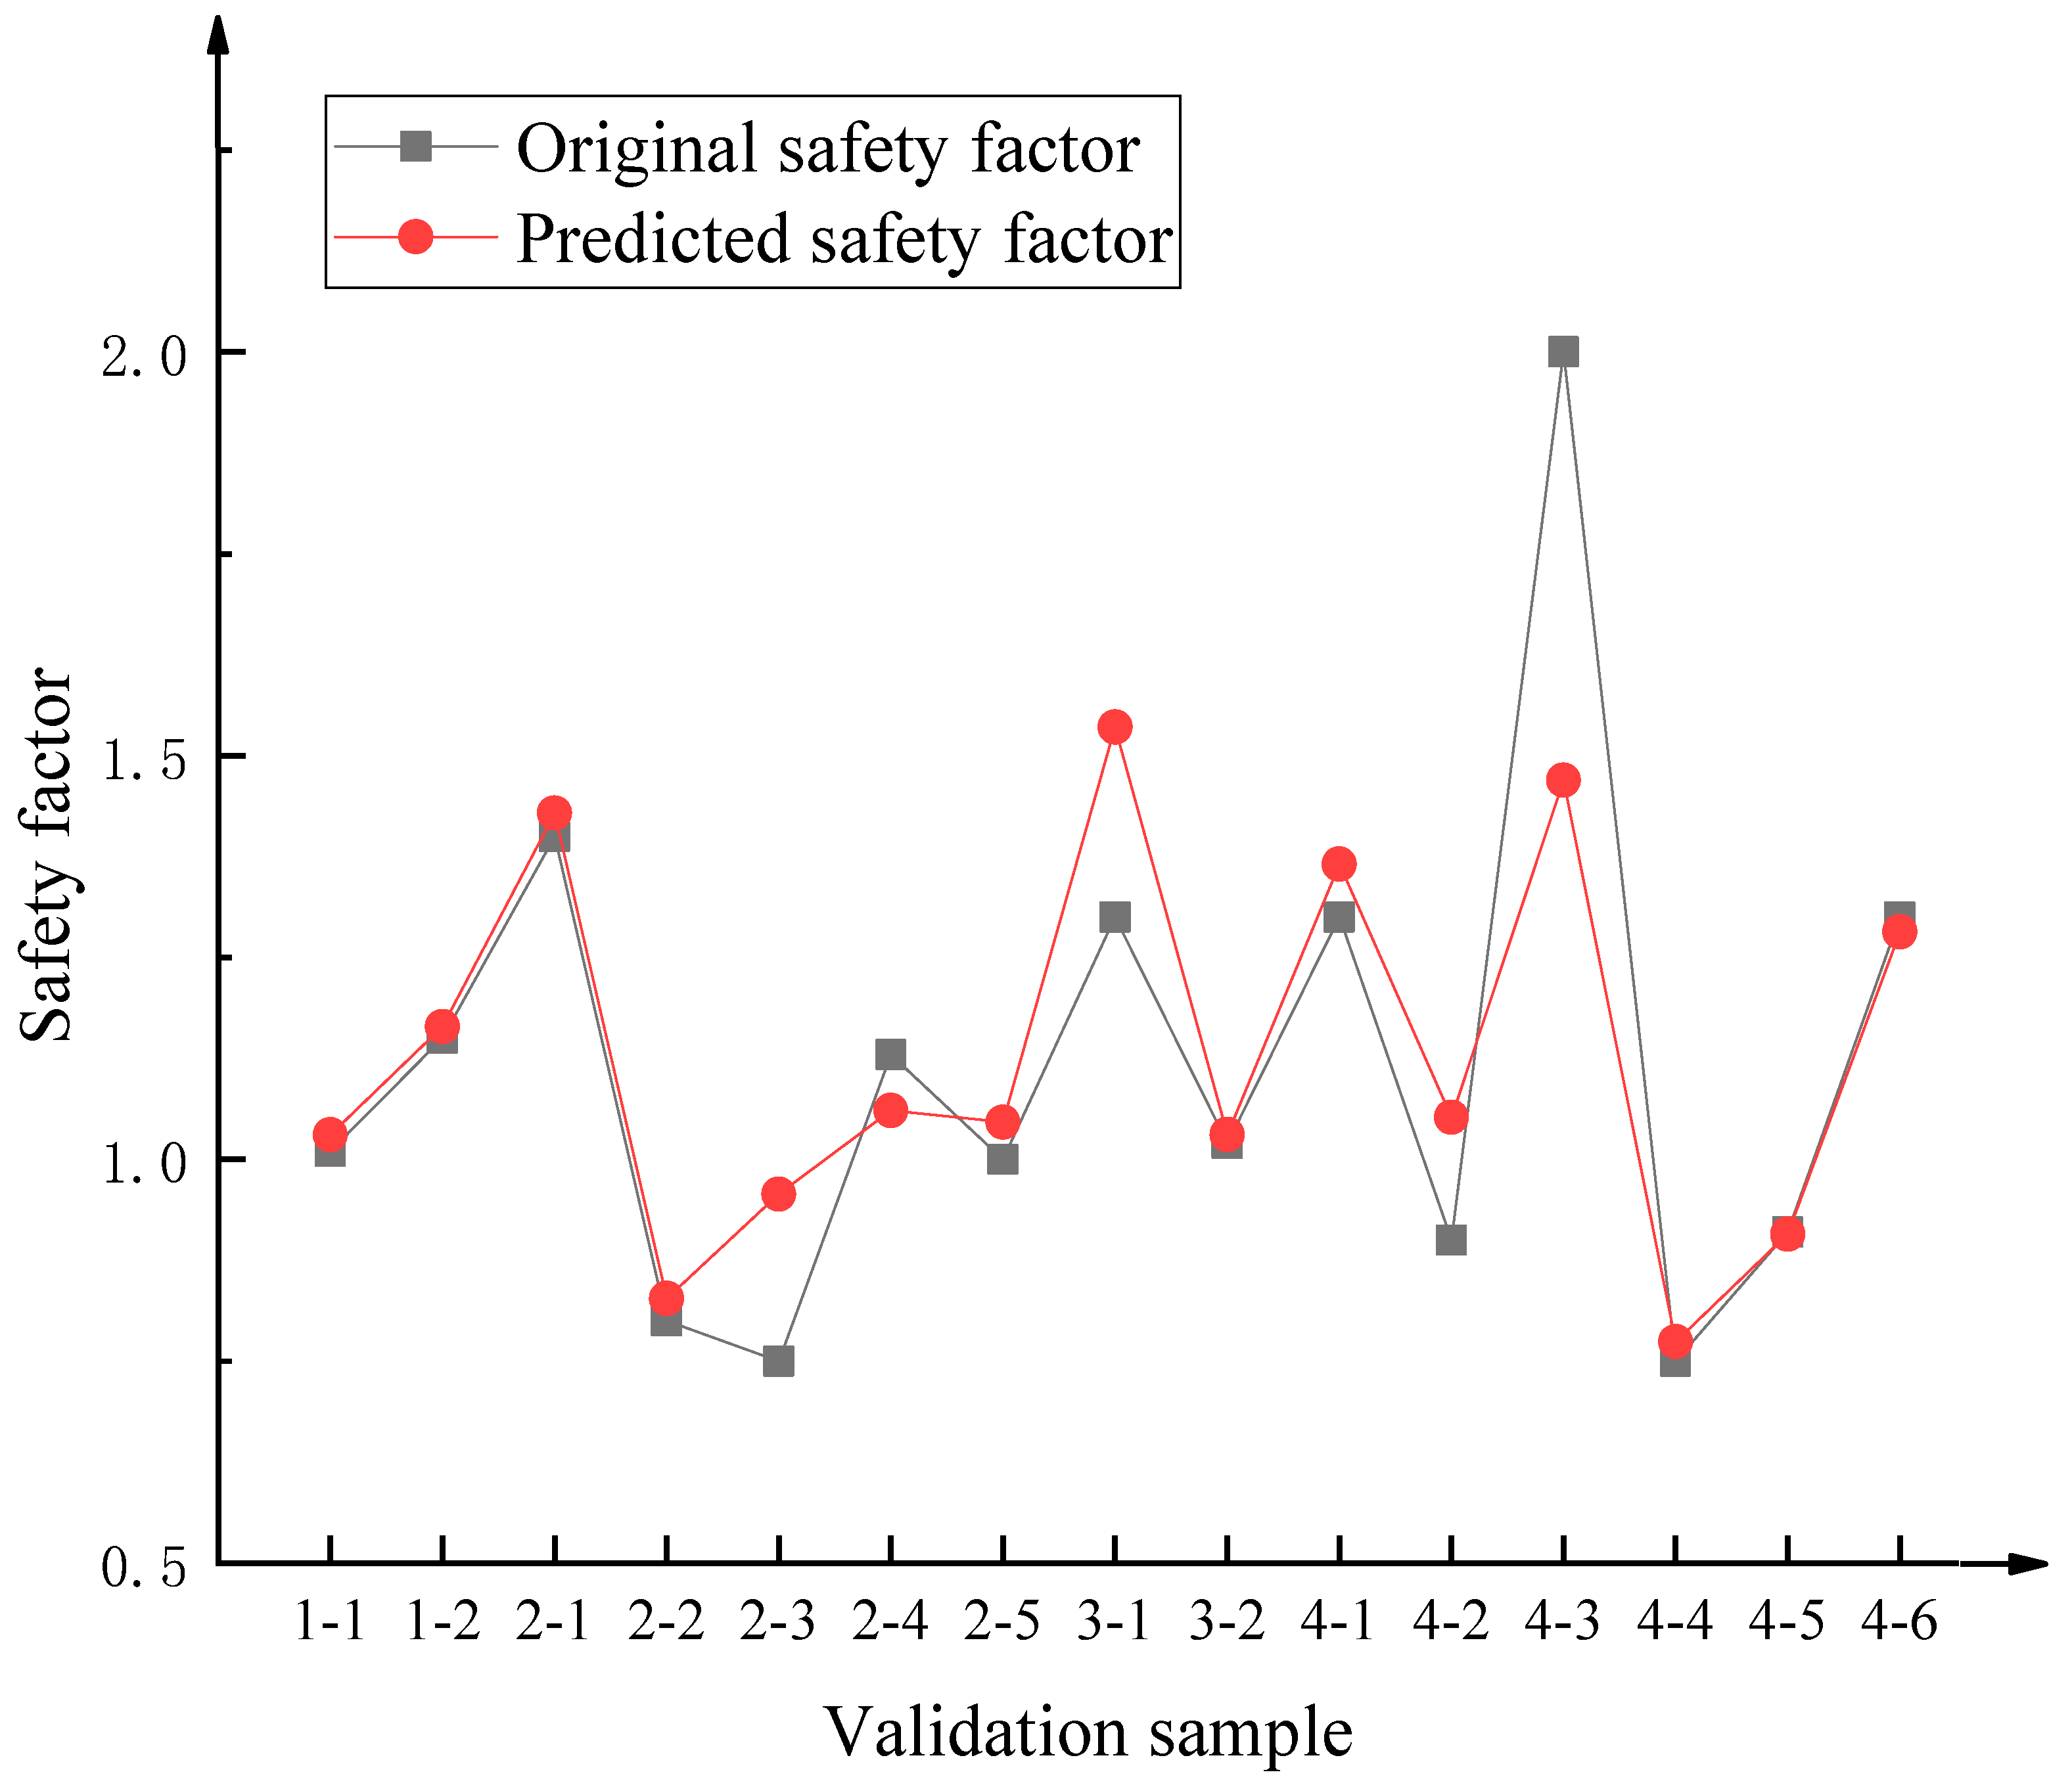
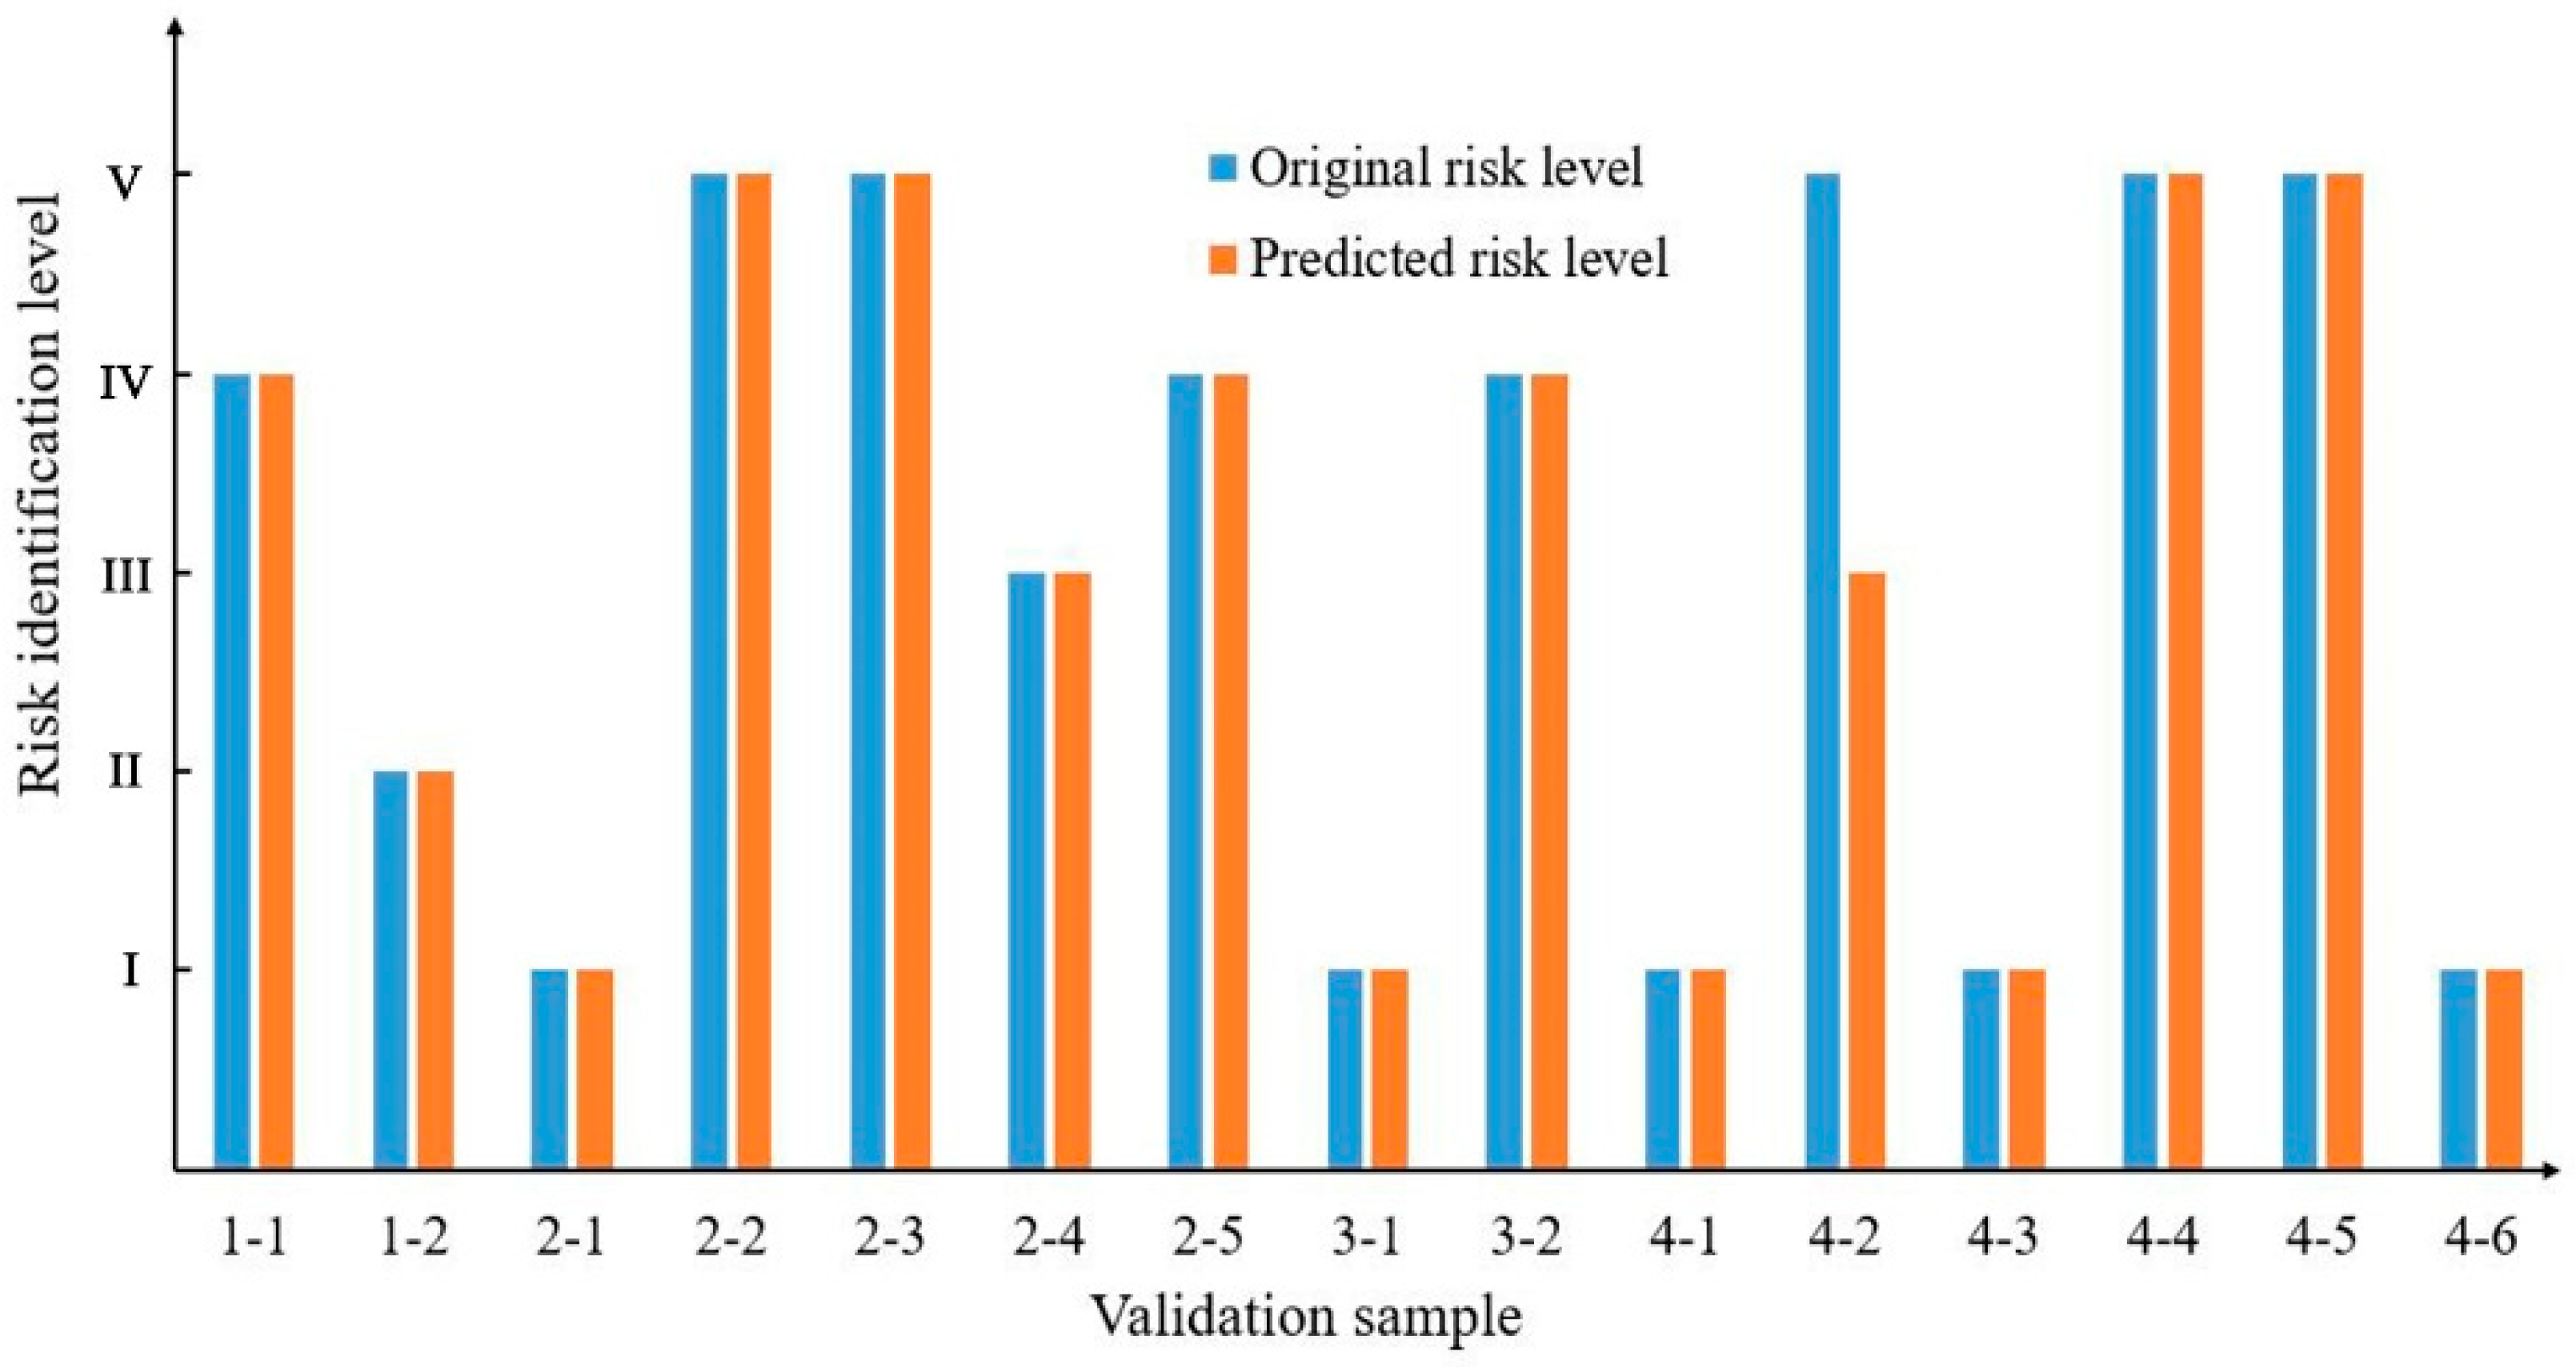
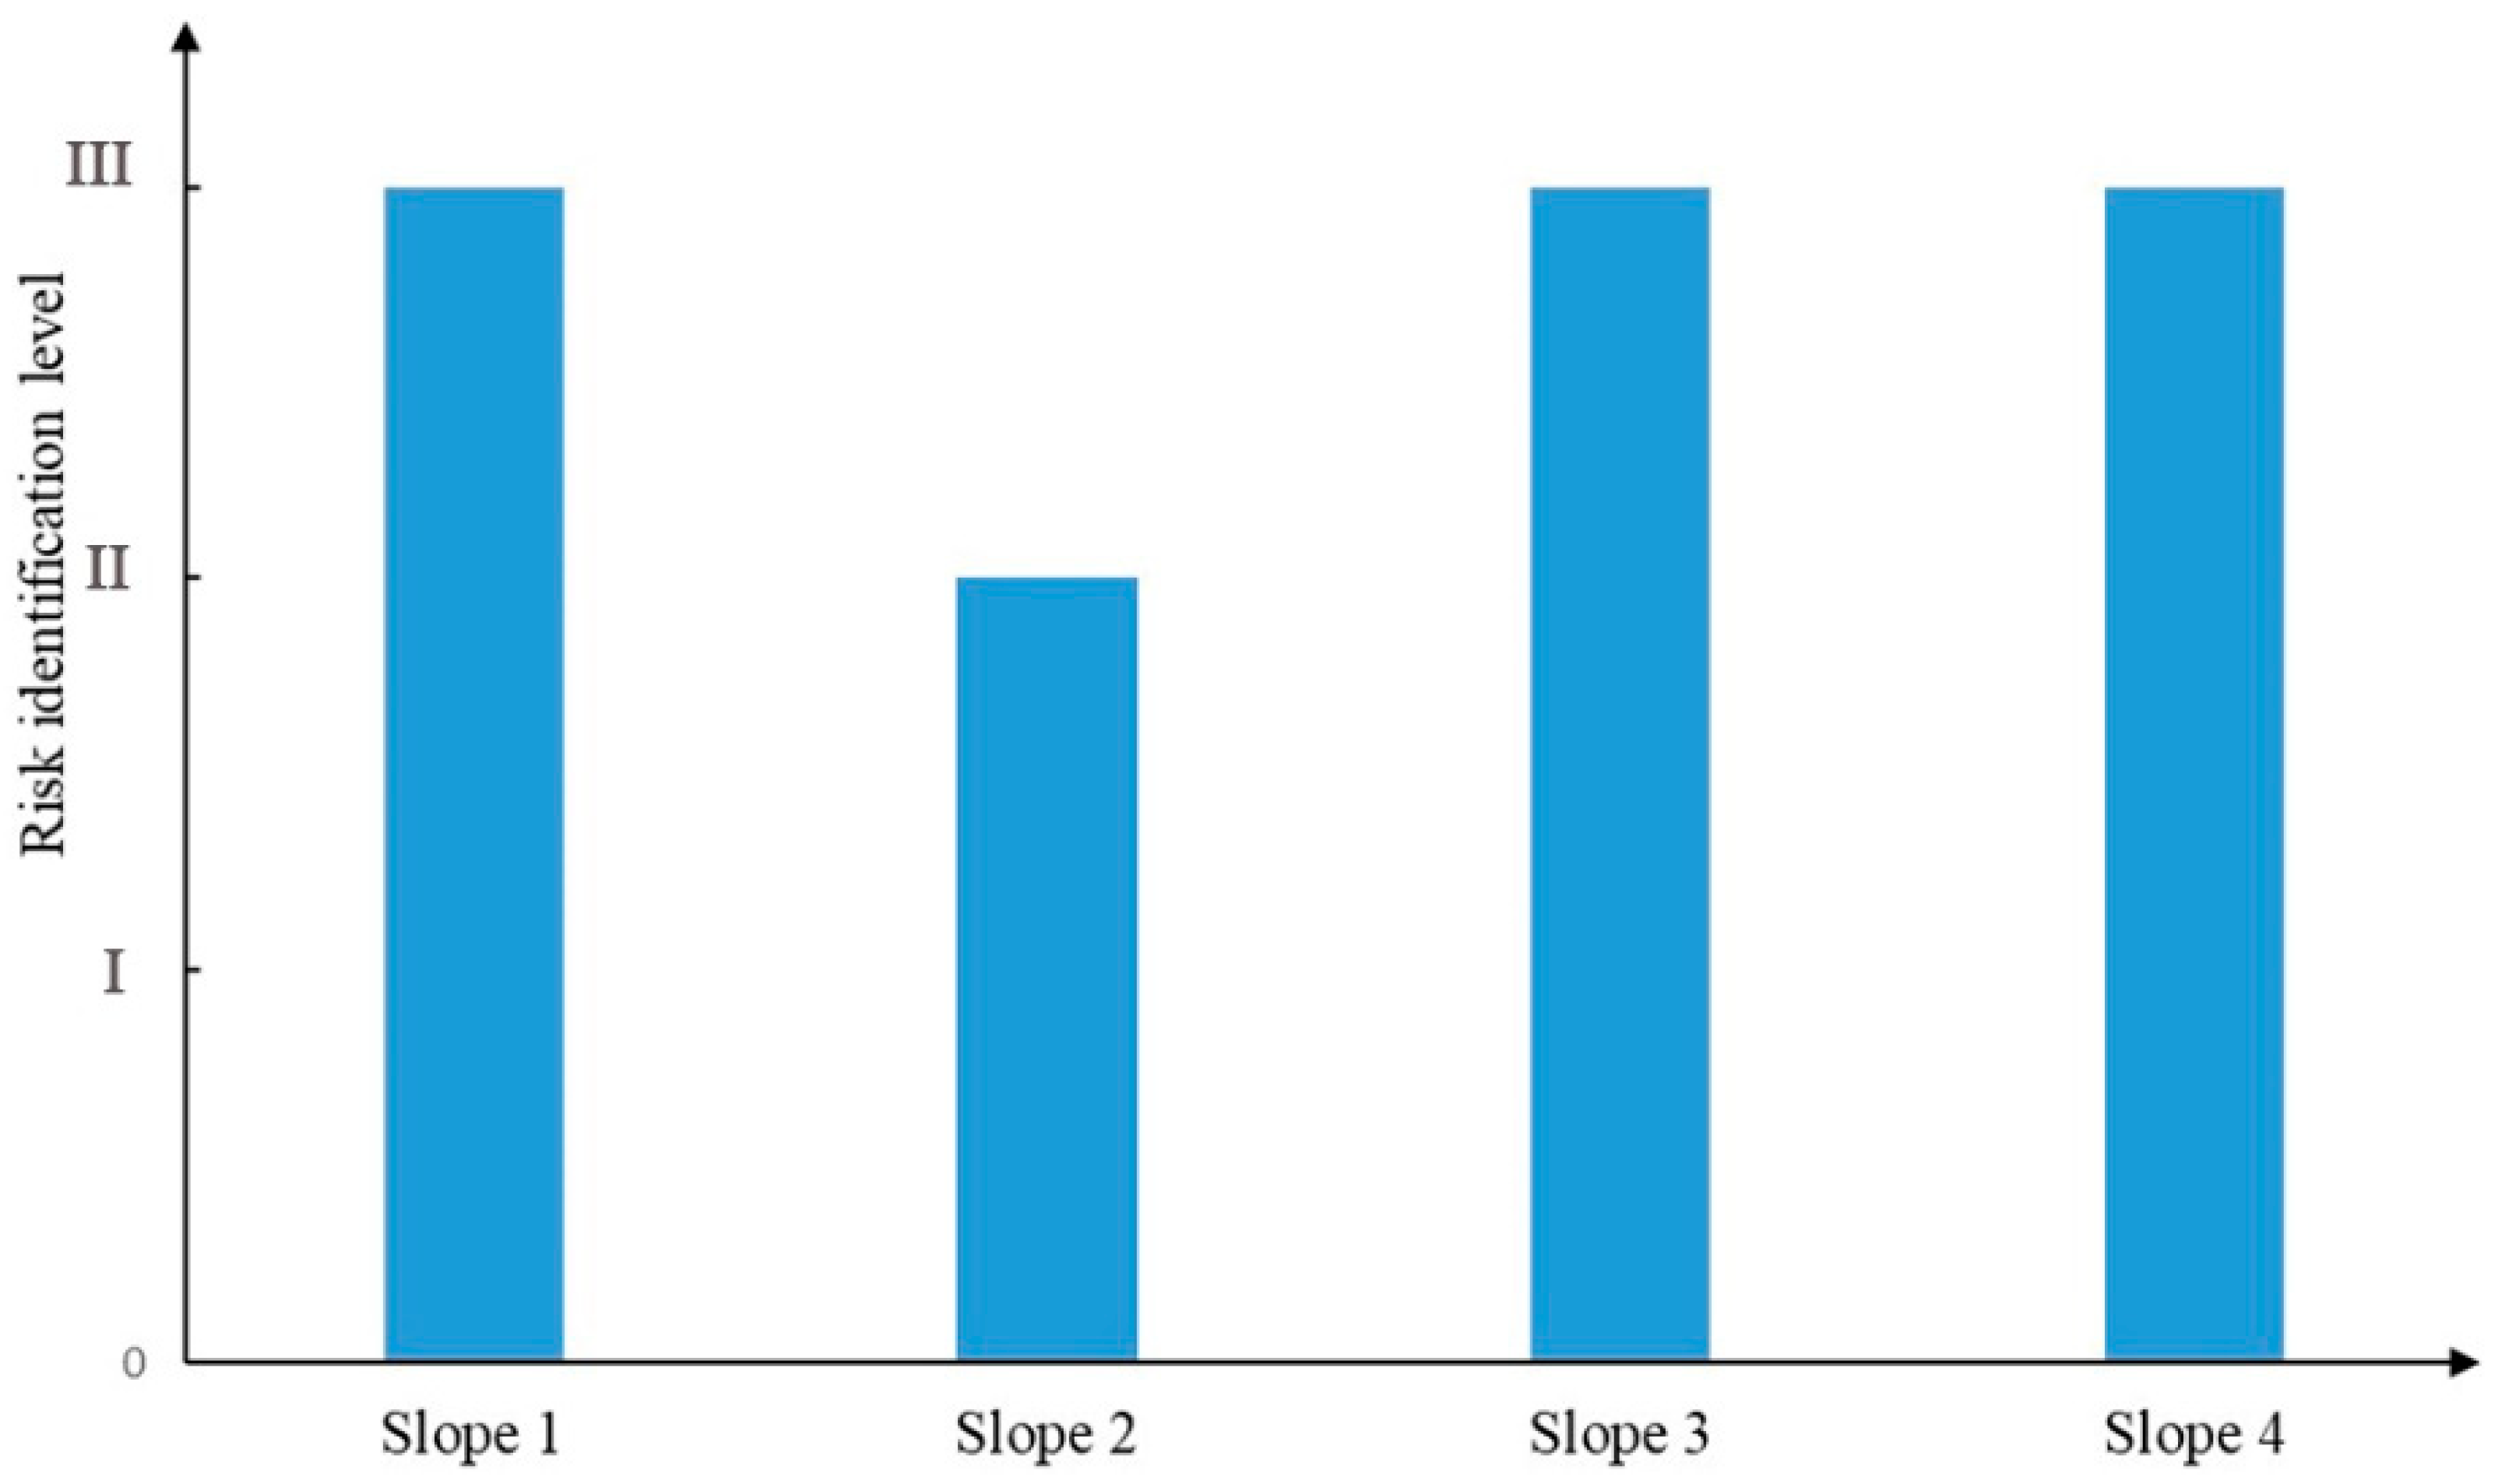
4.2.3. Risk Identification Results and Discussion for Risk Identification of an Individual Soft Rock Slope Using FNN

Once the validation samples and test data were verified as correct using the FNN model, the model was used to predict the risk of each soft rock slope in the object soft rock slope group. We input the data from the object soft rock slope group, in order to identify its level of risk, as shown in Figure 13.
It can be seen, from Figure 13, that the risk levels of soft rock slopes 1, 3, and 4 were all III (mild). A risk level of III indicates that these slopes were generally in a state of low security, and that a large deformation may occur under the influence of external factors. Therefore, slopes 1, 3, and 4 need early warning and attention. These identification results are consistent with monitoring and early warning results for these soft rock slopes (see Table 7). Meanwhile, the risk level of slope 2 was II (minor). A risk level of II indicates that this slope was in a relatively stable state, and will not lead to a significant deformation in the future.

4.3. Early Risk Warning of a Soft Rock Slope Group Using the Comprehensive Evaluation Method Based on FNN

According to the risk identification index, we first needed to further determine the classification parameters for rainfall.

4.3.1. Early Risk-Warning Index

The five levels of 24-h rainfall were the same as those in the identification model, as shown in Table 9.

4.3.2. Model Training

According to the establishing principle of the soft rock slope group, we collected engineering data [64] and rainfall data [66], and sorted the samples of the highway soft rock slope group (namely, the sample soft rock slope group), as shown in Table 10, Table 11, Table 12 and Table 13. The data listed in Table 10, Table 11, Table 12 and Table 13 were used as the training samples, and the training sample data were normalized to initialize the neural network. The soft rock slope group risk early warning model was trained until the training criteria were met. Then, we obtained the FNN-based soft rock slope group risk early warning model.

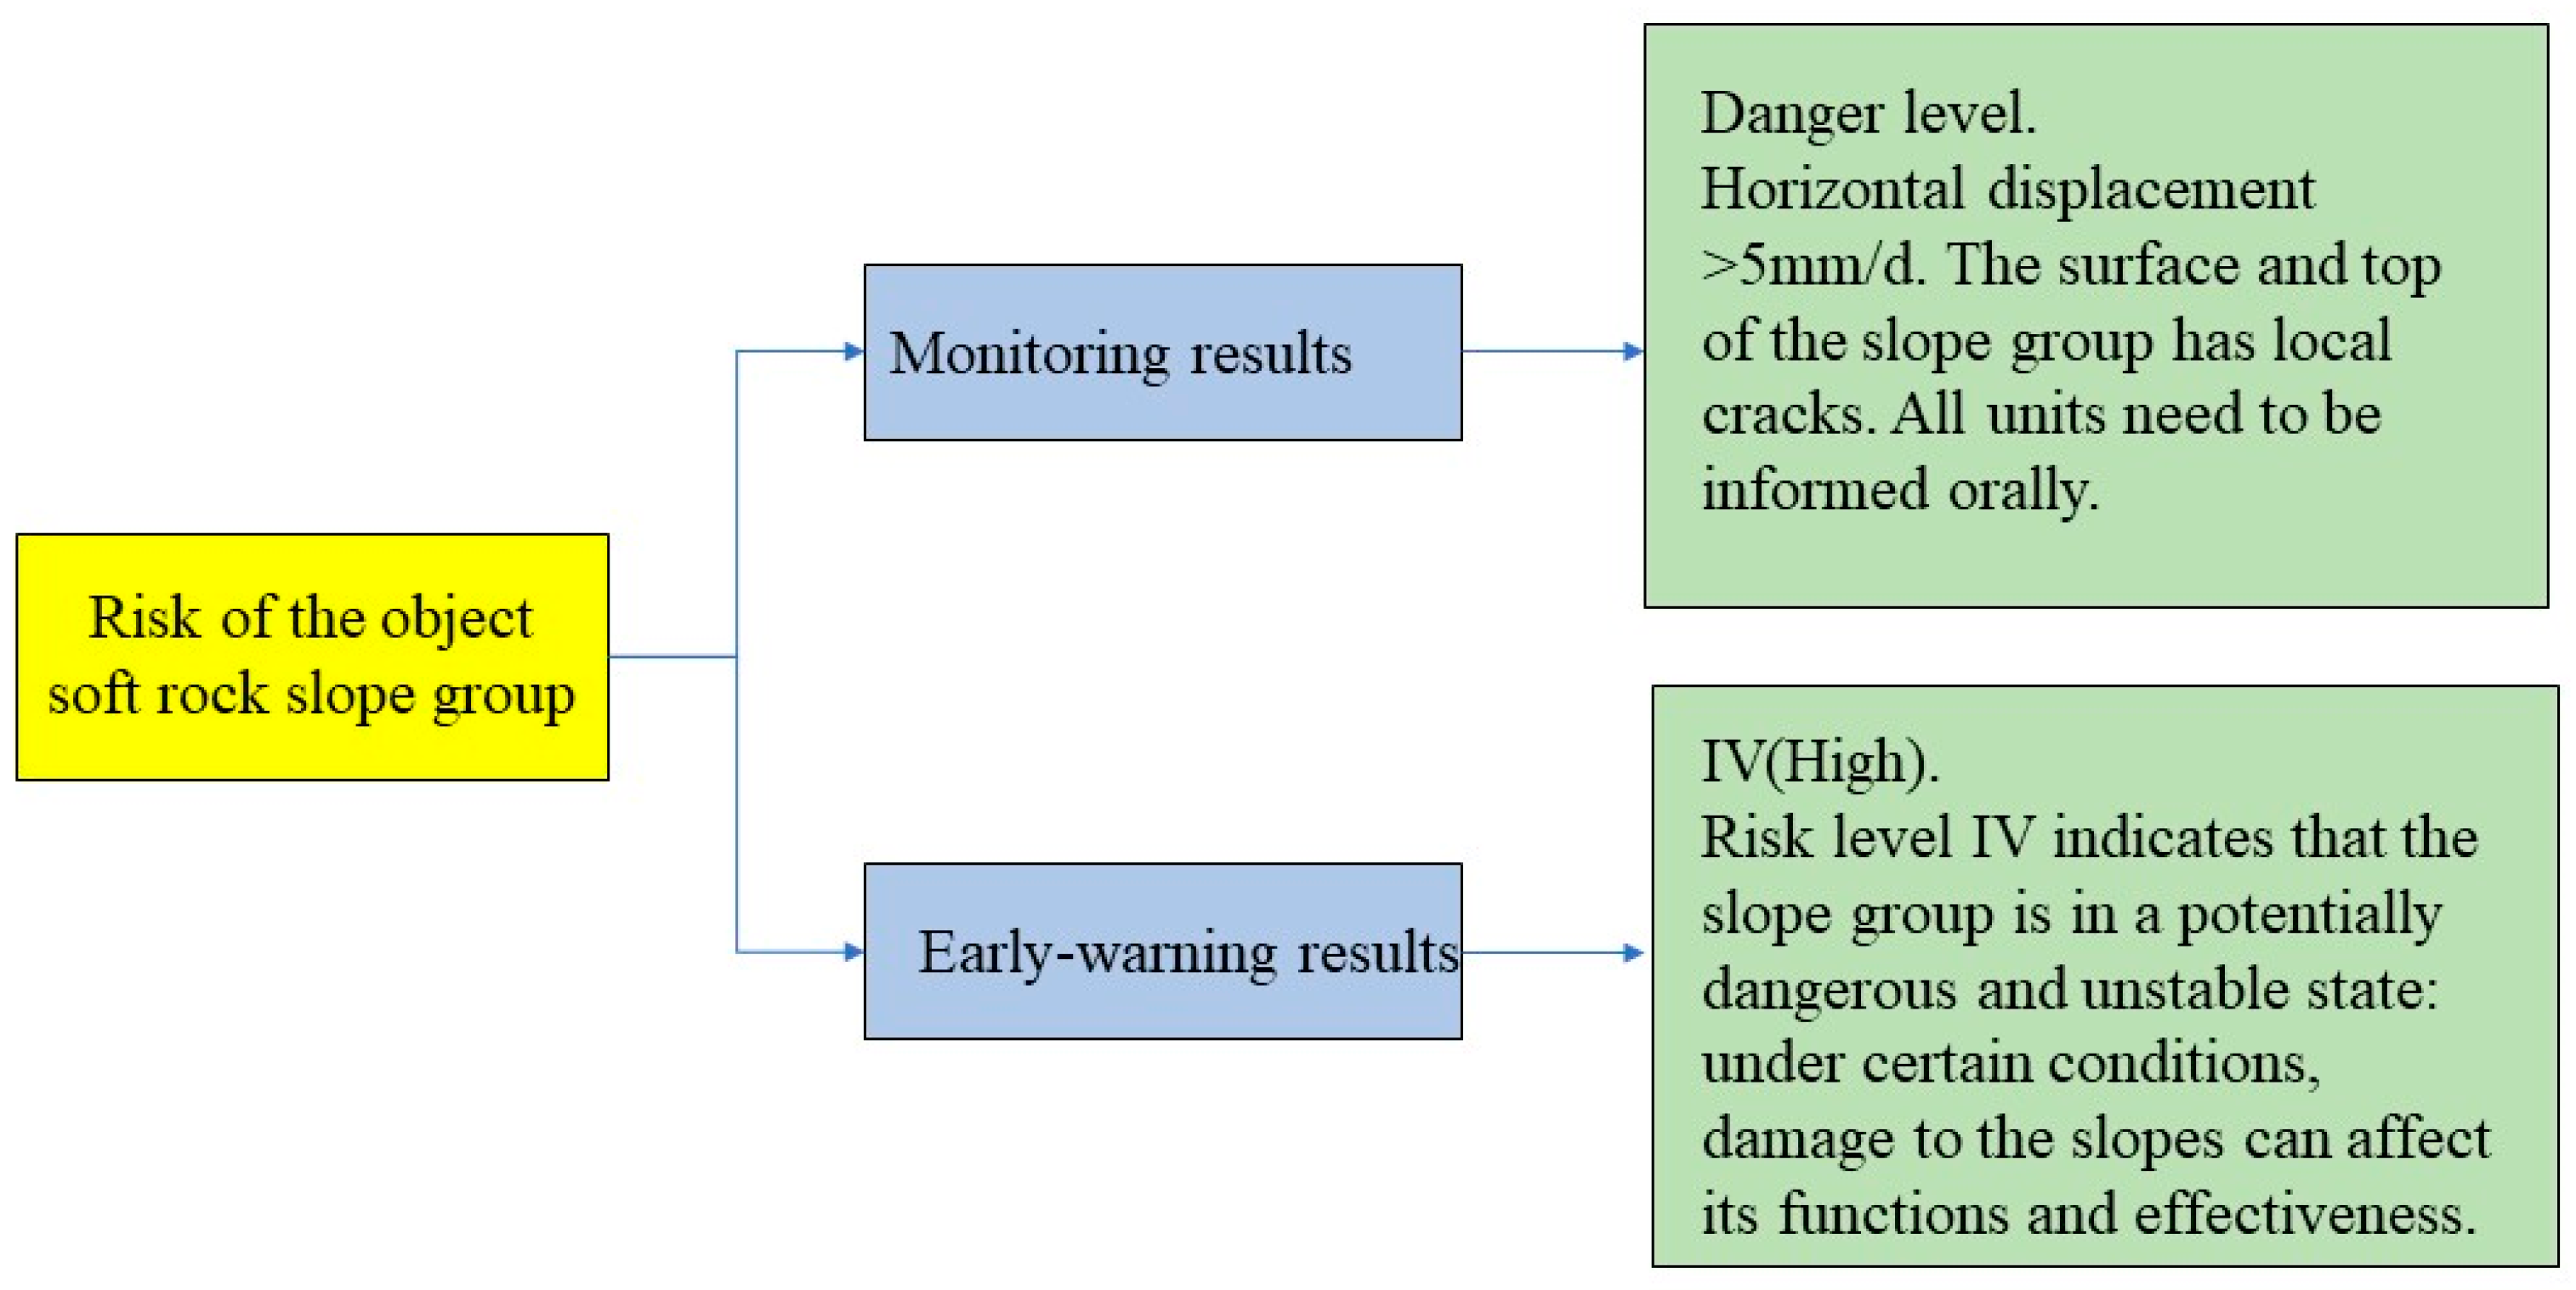
4.3.3. Early Risk-Warning Results for a Soft Rock Slope Group

We used the early warning index factor data as input to the soft rock slope group risk early warning model, including the individual soft rock slope risk level, the distance between the soft rock slope and road, the number of lanes, rainfall, and adverse geological conditions. The early warning result for the object soft rock slope group was therefore obtained, as shown in Table 14. The risk levels for soft rock slopes 1, 3, and 4 reached Level III on 23 June, and the overall risk level of the object soft rock slope group reached Level IV (high). The risk early warning results of Level IV indicated that the soft rock slope group was in a potentially dangerous and unstable state (i.e., under certain conditions, damage to the soft rock slope can affect its functions and effectiveness).

4.3.4. Discussion

Figure 14 shows the risk comparing the monitoring results and early waring results for the object soft rock slope group.
According to the engineering monitoring data [67] and Table 7, the first- and second-grade ditches of slope 1 and the outside of the slope 1 were seriously washed by rain; the second-grade platform ditch of the slope 3 was seriously washed by water, and the frame beam had separated from the slope surface. In terms of slope 4, there was a small area collapsed in the ditch at the top of the fifth-grade platform, and small cracks had occurred in the arch skeleton of the fourth-grade slope. The overall evaluation result of the object soft rock slope group issued by the engineers was dangerous: the soft rock slope group was in a potentially dangerous and unstable state, with a rate of horizontal displacement over 5 mm/d and local cracks on the soft rock slope surface and top. Thus, the soft rock slope group was considered prone to losing its stability, thereby affecting the nearby highway.
The early risk-warning results of Level IV for the object soft rock slope group also indicated that the soft rock slope group was in a potentially dangerous and unstable state (i.e., under certain conditions, damage to the soft rock slope can affect its functions and effectiveness). By comparing the model’s early warning result with the field monitoring results, it can be seen that the predictions agreed reasonably well with the monitoring results. The accuracy and rationality of the risk early warning model for soft rock slope groups was, therefore, verified. By utilizing the advantages of neural network self-learning, the model developed in this study allows for risk early warning regarding the stability of multiple soft rock slopes in an effective and efficient way, ultimately ensuring the safety of the highways nearby.

5. Conclusions

In this study, an FNN-based machine learning model was developed to identify the instability risks of a highway soft rock slope group, in order to ensure the safety of highways. FNNs can make the physical meaning of the neural network clear, and possess self-learning and self-adaptability capabilities. FNNs develop the advantages of both fuzzy theory and neural networks. The model was trained using a range of collected data from a highway project in southern China, such as the meteorological conditions, soft rock slope topographical and geomorphological characteristics, geotechnical properties of the soft rock slope, and measured soft rock slope horizontal displacement data.
On this basis, a comprehensive evaluation method based on an FNN was used for the risk early warning of the soft rock slope group. The comprehensive FNN-based evaluation method combined a comprehensive evaluation method and the FNN, allowing us to avoid the influence of human factors to a large extent, address the problem of soft rock slope group risk early warnings, and make the warning results more objective and reliable. The model was trained using a range of collected data, such as soft rock slope risk levels, adverse geological factors, distance between the soft rock slope and road, number of lanes, and 24-h rainfall.
We demonstrated that the developed model can be used to conduct soft rock slope group risk identification and early warning both efficiently and accurately. This study could enrich the knowledge and practice of soft rock slope risk management, thus contributing to the early identification and control of soft rock slope group hazards. In future work, we will further conduct the following research: (1) consider the optimal measures path in the soft rock slope group when the risk occurs; (2) consider the soft rock slope group risk evolution law.

Author Contributions

Z.L., conceptualization, methodology, data curation, formal analysis; writing—original draft preparation, writing—review and editing, project administration, funding acquisition; C.Z., conceptualization, methodology, writing—original draft preparation, supervision, project administration, funding acquisition; J.O., data curation, formal analysis, writing—original draft preparation and editing; L.Z., editing. All authors have read and agreed to the published version of the manuscript.

Funding

The research is supported by the National Natural Science Foundation of China (NSFC) (Grant No. 41977230), the Special Fund Key Project of Applied Science and Technology Research and Development in Guangdong (Grant No. 2015B090925016, No. 2016B010124007).

Institutional Review Board Statement

The study did not require ethical approval.

Informed Consent Statement

Not applicable.

Data Availability Statement

Not applicable.

Acknowledgments

The authors would like to thank the anonymous reviewers for their very constructive and helpful comments.

Conflicts of Interest

The authors declare that they have no conflict of interest.

References

  1. Lee, D.-H.; Lai, M.-H.; Wu, J.-H.; Chi, Y.-Y.; Ko, W.-T.; Lee, B.-L. Slope management criteria for Alishan Highway based on database of heavy rainfall-induced slope failures. Eng. Geol. 2013, 162, 97–107. [Google Scholar] [CrossRef]
  2. Lai, J.; Zhang, L.; Duffield, C.F.; Aye, L. Engineering Reliability Analysis in Risk Management Framework: Development and Application in Infrastructure Project. Int. J. Appl. Math. 2013, 43, 242–249. [Google Scholar]
  3. Huabin, W.; Gangjun, L.; Weiya, X.; Gonghui, W. GIS-based landslide hazard assessment: An overview. Prog. Phys. Geog. 2005, 29, 548–567. [Google Scholar] [CrossRef]
  4. Goorchi, R.N.; Amini, M.; Memarian, H. A new rating system approach for risk analysis of rock slopes. Nat. Hazards 2018, 91, 75–102. [Google Scholar]
  5. Dang, K.; Sassa, K.; Konagai, K.; Karunawardena, A.; Bandara, R.M.S.; Hirota, K.; Tan, Q.; Ha, N.D. Recent rainfall-induced rapid and long-traveling landslide on 17 May 2016 in Aranayaka, Kagelle District, Sri Lanka. Landslides 2019, 16, 155–164. [Google Scholar] [CrossRef]
  6. Infante, D.; Di Martire, D.; Calcaterra, D.; Miele, P.; Scotto Di Santolo, A.; Ramondini, M. Integrated Procedure for Monitoring and Assessment of Linear Infrastructures Safety (I-Pro MONALISA) Affected by Slope Instability. Appl. Sci. 2019, 9, 5535. [Google Scholar] [CrossRef]
  7. Yin, C.; Li, H.; Hu, Z.; Li, Y. Application of the Terrestrial Laser Scanning in Slope Deformation Monitoring: Taking a Highway Slope as an Example. Appl. Sci. 2020, 10, 2808. [Google Scholar] [CrossRef]
  8. Zakaria, M.T.; Muztaza, N.M.; Zabidi, H.; Salleh, A.N.; Mahmud, N.; Samsudin, N.; Rosli, F.N.; Olugbenga, A.T.; Jia, T.Y. 2-D Cross-Plot Model Analysis Using Integrated Geophysical Methods for Landslides Assessment. Appl. Sci. 2021, 11, 747. [Google Scholar] [CrossRef]
  9. Liu, D.; Liu, C.; Tang, Y.; Gong, C. A GA-BP Neural Network Regression Model for Predicting Soil Moisture in Slope Ecological Protection. Sustainability 2022, 14, 1386. [Google Scholar] [CrossRef]
  10. Habumugisha, J.M.; Chen, N.; Rahman, M.; Islam, M.; Ahmad, H.; Elbeltagi, A.; Sharma, G.; Liza, S.N.; Dewan, A. Landslide Susceptibility Mapping with Deep Learning Algorithms. Sustainability 2022, 14, 1734. [Google Scholar] [CrossRef]
  11. Xiaojun, Z.; Gulishengmu, A.; Guang, Y.; Ping, G.; Chunxia, W.; Yi, L.; Xiaolong, L.; Pengfei, L.; Chenxi, L.; Changlu, Q.; et al. Evaluation of the Water Resource Carrying Capacity on the North Slope of the Tianshan Mountains, Northwest China. Sustainability 2022, 14, 1905. [Google Scholar]
  12. Gatto, M.P.A.; Montrasio, L. Analysis of the Behaviour of Very Slender Piles: Focus on the Ultimate Load. Int. J. Civ. Eng. 2021, 19, 145–153. [Google Scholar] [CrossRef]
  13. Gatto, M.P.A.; Montrasio, L.; Zavatto, L. Experimental Analysis and Theoretical Modelling of Polyurethane Effects on 1D Wave Propagation through Sand-Polyurethane Specimens. J. Earthq. Eng. 2021, 1–24. [Google Scholar] [CrossRef]
  14. Gatto, M.P.A.; Montrasio, L.; Berardengo, M.; Vanali, M. Experimental Analysis of the Effects of a Polyurethane Foam on Geotechnical Seismic Isolation. J. Earthq. Eng. 2020, 1–22. [Google Scholar] [CrossRef]
  15. Gatto, M.P.A.; Lentini, V.; Castelli, F.; Montrasio, L.; Grassi, D. The Use of Polyurethane Injection as a Geotechnical Seismic Isolation Method in Large-Scale Applications: A Numerical Study. Geosciences 2021, 11, 201. [Google Scholar] [CrossRef]
  16. Hua, X.; Fan, Q.; Shang, Y.; Cheng, J.; Zhang, Y.; Liu, Z. Application of coupling analysis method for slopes stability in three gorges reservoir region. Adv. Sci. Technol. Water Res. 2019, 39, 54–57. [Google Scholar]
  17. Cheng, Y.; Guo, T.; Qiu, C. Application of online safety monitoring system for high speed slope group in Guilong. Hunan Commun. Sci. Technol. 2019, 45, 37–42. [Google Scholar]
  18. Zhi, Z.; Jian, X.; Guangliang, Z. A review of slope risk analysis. Sichuan Cem. 2020, 8, 347–348. [Google Scholar]
  19. Raghuvanshi, T.K. Plane failure in rock slopes—A review on stability analysis techniques. J. King Saud Univ. Sci. 2019, 31, 101–109. [Google Scholar] [CrossRef]
  20. Hunter, A.G.M. A review of research into machine stability on slopes. Safety Sci. 1993, 16, 325–339. [Google Scholar] [CrossRef]
  21. Boggett, A.D.; Mapplebeck, N.J.; Cullen, R.J. South Shore Cliffs, Whitehaven—Geomorphological survey and emergency cliff stabilization works. Q. J. Eng. Geol. Hydroge. 2000, 33, 213–226. [Google Scholar] [CrossRef]
  22. Brand, E.W. Special Lecture: Landslide Risk Assessment in Hong Kong. In Proceedings of the International Symposium on Landslides, Lausanne, Switzerland, 10–15 July 1988; Volume 5, pp. 1059–1074. [Google Scholar]
  23. Gaprindashvili, G.; Van Westen, C.J. Generation of a national landslide hazard and risk map for the country of Georgia. Nat. Hazards 2016, 80, 69–101. [Google Scholar] [CrossRef]
  24. Harden, J.; Viberg, L. General report: Evaluation of landslide hazard. In Proceedings of the 5th International Symposium on Landslides, Lausanne, Switzerland, 10–15 July 1988; Volume 2, pp. 1037–1057. [Google Scholar]
  25. Lin, D.; Chen, P.; Ma, J.; Zhao, Y. Assessment of slope construction risk uncertainty based on index importance ranking. B Eng. Geol. Environ. 2019, 78, 4217–4228. [Google Scholar] [CrossRef]
  26. McDonnell, B.A. Hazard Identification and Visitor Risk Assessment at the Giant’s Causeway World Heritage Site, Ireland: Instability: Planning and Management; Thomas Telford Publishing: London, UK, 2002. [Google Scholar]
  27. Rautela, P.; Lakhera, R.C. Landslide risk analysis between Giri and Tons rivers in Himachal Himalaya (India). Int. J. Appl. Earth Obs. 2000, 2, 153–160. [Google Scholar] [CrossRef]
  28. Remondo, J.; Bonachea, J.; Cendrero, A. A statistical approach to landslide risk modelling at basin scale: From landslide susceptibility to quantitative risk assessment. Landslides 2005, 2, 321–328. [Google Scholar] [CrossRef]
  29. Liu, S.Y.; Shao, L.T.; Li, H.J. Slope stability analysis using the limit equilibrium method and two finite element methods. Comput. Geotech. 2015, 63, 291–298. [Google Scholar] [CrossRef]
  30. Huang, Y.H. Slope Stability Analysis by the Limit Equilibrium Method: Fundamentals and Methods; American Society of Civil Engineers: Reston, VA, USA, 2014. [Google Scholar]
  31. Kalatehjari, R.; Ali, N. A Review of Three-Dimensional Slope Stability Analyses based on Limit Equilibrium Method. Electron. J. Geotech. Eng. 2013, 18, 119–134. [Google Scholar]
  32. Bednarik, M.; Yilmaz, I.; Marschalko, M. Landslide hazard and risk assessment: A case study from the Hlohovec-Sered’ landslide area in south-west Slovakia. Nat. Hazards 2012, 64, 547–575. [Google Scholar] [CrossRef]
  33. Dai, F.C.; Lee, C.F. Landslide characteristics and slope instability modeling using GIS, Lantau Island, Hong Kong. Geomorphol. 2002, 42, 213–228. [Google Scholar] [CrossRef]
  34. McQuillan, A.; Canbulat, I.; Payne, D.; Oh, J. New risk assessment methodology for coal mine excavated slopes. Int. J. Min. Sci. Technol. 2018, 28, 583–592. [Google Scholar] [CrossRef]
  35. Li, D.Q.; Yang, Z.Y.; Cao, Z.J.; Zhang, L.M. Area failure probability method for slope system failure risk assessment. Comput. Geotech. 2019, 107, 36–44. [Google Scholar] [CrossRef]
  36. Drummond, C. Machine learning as an experimental science (revisited). In AAAI Workshop on Evaluation Methods for Machine Learning; AAAI Press: Menlo Park, CA, USA, 2006; pp. 1–5. [Google Scholar]
  37. Koopialipoor, M.; Armaghani, D.J.; Yang, H.; Gordan, B.; Khorami, M.; Tahir, M.M. Intelligent design of retaining wall structures under dynamic conditions. Steel Compos. Struct Int. J. 2019, 31, 629–640. [Google Scholar]
  38. Ma, Z.; Mei, G.; Piccialli, F. Machine learning for landslides prevention: A survey. Neural Comp. Appl. 2021, 33, 10881–10907. [Google Scholar] [CrossRef]
  39. Cai, M.; Koopialipoor, M.; Armaghani, D.J.; Pham, B.T. Evaluating slope deformation of earth dams due to earthquake shaking using MARS and GMDH techniques. Appl. Sci. 2020, 10, 1486. [Google Scholar] [CrossRef]
  40. Momeni, E.; Yarivand, A.; Dowlatshahi, M.B.; Armaghani, D.J. An efficient optimal neural network based on gravitational search algorithm in predicting the deformation of geogrid-reinforced soil structures. Transp. Geotech. 2021, 26, 100446. [Google Scholar] [CrossRef]
  41. Xu, C.; Gordan, B.; Koopialipoor, M.; Armaghani, D.J.; Tahir, M.M. Improving performance of retaining walls under dynamic conditions developing an optimized ANN based on ant colony optimization technique. IEEE Access 2019, 7, 94692–94700. [Google Scholar] [CrossRef]
  42. Huat, C.Y.; Moosavi, S.M.H.; Mohammed, A.S.; Armaghami, D.J.; Ulrikh, D.V.; Monjezi, M.; Lai, S.H. Factors Influencing Pile Friction Bearing Capacity: Proposing a Novel Procedure Based on Gradient Boosted Tree Technique. Sustainability 2021, 13, 11862. [Google Scholar] [CrossRef]
  43. Pradhan, B.; Lee, S. Landslide risk analysis using artificial neural network model focussing on different training sites. Int. J. Phys. Sci. 2009, 4, 1–15. [Google Scholar]
  44. Koopialipoor, M.; Armaghani, D.J.; Hedayat, A.; Marto, A.; Gordan, B. Applying various hybrid intelligent systems to evaluate and predict slope stability under static and dynamic conditions. Soft Comp. 2019, 23, 5913–5929. [Google Scholar] [CrossRef]
  45. Asteris, P.G.; Rizal, F.I.M.; Koopialipoor, M.; Roussis, P.C.; Ferentinou, M.; Armaghani, D.J.; Gordan, B. Slope Stability Classification under Seismic Conditions Using Several Tree-Based Intelligent Techniques. Appl. Sci. 2022, 12, 1753. [Google Scholar] [CrossRef]
  46. Chen, H.; Asteris, P.G.; Armaghani, D.J.; Gordan, B.; Pham, B.T. Assessing dynamic conditions of the retaining wall: Developing two hybrid intelligent models. Appl. Sci. 2019, 9, 1042. [Google Scholar] [CrossRef]
  47. Xiong, J.; Sun, M.; Zhang, H. Application of the Levenburg–Marquardt back propagation neural network approach for landslide risk assessments. Nat. Hazards Earth Syst. Sci. 2019, 19, 629–653. [Google Scholar] [CrossRef]
  48. Kanungo, D.P.; Arora, M.; Gupta, R.P.; Sarkar, S. Landslide risk assessment using concepts of danger pixels and fuzzy set theory in Darjeeling Himalayas. Landslides 2008, 5, 407–416. [Google Scholar] [CrossRef]
  49. Leonardi, G.; Palamara, R.; Suraci, F. A fuzzy methodology to evaluate the landslide risk in road lifelines. Transp. Res. Procedia 2020, 45, 732–739. [Google Scholar] [CrossRef]
  50. Zhou, N.; Fu, H.; Yuan, Y. Evaluation approach of slope stability based on fuzzy neural network. Chin. J. Undergr. Space Eng. 2009, 5, 1826–1832. [Google Scholar]
  51. Li, Y. Researches on Comprehensive Evaluation Method Based on Fuzzy Neural Network; Southwest University: Chongqing, China, 2005. [Google Scholar]
  52. Zhang, G. Coupled stability analysis for slopes near a reservoir. Geofluids 2015, 55, 612–615. [Google Scholar]
  53. Li, X.; Kong, J. Runout Distance Estimation of Landslides Triggered by “5·12” Wenchuan Earthquake. J. Sichuan Univ. Eng. Sci. Ed. 2010, 42, 243–249. [Google Scholar]
  54. Feng, X.; Wang, Y.; Lu, S. Neural network estimation of slope stability. J. Eng. Geol. 1995, 419, 54–61. [Google Scholar]
  55. Ying, H.; Siler, W.; Buckley, J.J. Fuzzy control theory A nonlinear case. Automatica 1990, 26, 513–520. [Google Scholar] [CrossRef]
  56. Anderson, C.W. Learning to Control an Inverted Pendulum Using Neural Networks. IEEE Contr. Syst. Mag. 1989, 9, 31–37. [Google Scholar] [CrossRef]
  57. Beieniawski, Z.T. The geomechanics classification in rock engineering applications. In Proceedings of the 4th International Congress on Rock Mechanics (ISRM) Congress, Montreux, Switzerland, 2–8 September 1979; International Society for Rock Mechanics and Rock Engineering: Lisbon, Portugal, 1979. [Google Scholar]
  58. Romana, M. SMR classification. In Proceedings of the 7th ISRM International Congress in Rock Mechanics, Aachen, Germany, 16–20 September 1991; International Society for Rock Mechanics (ISRM): Lisbon, Portugal, 1992; pp. 78–84. [Google Scholar]
  59. Huang, W.; Du, J.; Sun, H.; Zhou, C.; Liu, Z.; Zhang, L. New polymer composites improve silty clay soil microstructure: An evaluation using NMR. Land Degrad. Dev. 2021, 32, 3272–3281. [Google Scholar] [CrossRef]
  60. Liu, Z.; Liu, P.; Zhou, C.; Huang, Y.; Zhang, L. Structural Health Monitoring of Underground Structures in Reclamation Area Using Fiber Bragg Grating Sensors. Sensors 2019, 19, 2849. [Google Scholar] [CrossRef] [PubMed]
  61. GB 50330-2013; Technical Code for Building Slope Engineering. China Building Industry Press: Beijing, China, 2013.
  62. Liu, R.; Wang, Y. Comprehensive grade evaluation of power quality based on improved radar chart method and Gaussian membership degree. Elec. Measurement Instrum. 2018, 55, 69–74. [Google Scholar]
  63. Zhou, C.; Ouyang, J.; Ming, W.; Zhang, G.; Du, Z.; Liu, Z. A Stratigraphic Prediction Method Based on Machine Learning. Appl. Sci. 2019, 9, 3553. [Google Scholar] [CrossRef]
  64. CHELBI Engineering Consultants. Detailed Engineering Geological Survey Report of the 10th Contract Section of the Highway from Huacheng to Lankou Section of the Highway; CHELBI Engineering Consultants: Beijing, China, 2005. [Google Scholar]
  65. China Planning Press. Standard for Test Methods of Engineering Rock Mass; China Planning Press: Beijing, China, 2013. [Google Scholar]
  66. A Study on Rainfall in Meizhou River Source Area in 2005. National Weather Service Website. Available online: http://www.cma.gov.cn/ (accessed on 30 July 2005).
  67. Ministry of Railways. Monitoring Report of High Slope Engineering in the Section from Chengjiang to Lankou of Mei (Zhou) River (Source) Expressway; Shenzhen Research and Design Institute of Science Research Institute, Ministry of Railways: Shenzhen, China, 2005.
Figure 1. Flowchart of the soft rock slope early risk-warning framework based on machine learning developed in this study.
Sustainability 14 03367 g001
Figure 2. Flowchart of the FNN model used for soft rock slope risk analysis (the data can be collected from the practical engineering report data, which include rainfall, slope angle, slope height, cohesion, internal friction angle, measured horizontal displacement, and safety factor).
Sustainability 14 03367 g002
Figure 3. Composition of the FNN model for identification of soft rock slope risk.
Sustainability 14 03367 g003
Figure 4. Risk identification learning and training process.
Sustainability 14 03367 g004
Figure 5. Flow of the proposed fuzzy comprehensive evaluation method.
Sustainability 14 03367 g005
Figure 6. Structural diagram of early warning model for soft rock slope group based on the FNN architecture.
Sustainability 14 03367 g006
Figure 7. Locations of soft rock slopes 1–4 investigated in this study area.
Sustainability 14 03367 g007
Figure 8. Schematic diagram showing the details of soft rock slopes 1–4.
Sustainability 14 03367 g008
Figure 9. The horizontal displacement monitoring points on slope 2.
Sustainability 14 03367 g009
Figure 10. The model training process.
Sustainability 14 03367 g010
Figure 11. Original and predicted safety factors for the soft rock slope group risk, based on the validation samples.
Sustainability 14 03367 g011
Figure 12. Original risk level and predicted risk level for the soft rock slope group based on validation samples.
Sustainability 14 03367 g012
Figure 13. Risk identification for the object soft rock slope group.
Sustainability 14 03367 g013
Figure 14. Comparison diagram of the risk results for the object soft rock slope group.
Sustainability 14 03367 g014
Table 1. Levels of soft rock slope risk.
Level of RiskI
(Negligible)
II
(Minor)
III
(Mild)
IV
(Major)
V
(Severe)
Safety factor>1.251.15–1.251.05–1.151.0–1.05≤1.0
Table 2. Classification of influencing factors in the soft rock slope group early risk-warning system.
FactorsIIIIIIIVV
Soft rock slope factorEach soft rock slope risk level12345
Adverse geological conditionWeaker (0.1)Weak (0.3)Average (0.5)Strong (0.7)Stronger (0.9)
Road factorDistance between soft rock slope and road(m)>3030–22.522.5–1515–7.5<7.5
Number of lanes≥86421
External factorRainfallGrading parameters need to be determined
Table 3. Stratum information of slopes in this region.
Soft Rock SlopeDepth RangeStratumFigures
Slope 1From the surface to 2.8 m undergroundMild clay Sustainability 14 03367 i001
From 2.8 m underground to 5.5 m undergroundStrongly weathering mixed gneiss Sustainability 14 03367 i002
From the 5.5 m underground to 29.0 m undergroundWeak weathering mixed gneiss
Slope 2From the surface to 4.5 m undergroundMild clay Sustainability 14 03367 i003
From 4.5 m underground to 18.5 m undergroundCompletely weathering mixed gneiss Sustainability 14 03367 i004
From 18.5 m underground to 41.5 m undergroundStrongly weathered mixed gneiss
From 41.5 m underground to 49.0 m undergroundModerate weathering mixed gneiss
Slope 3From the surface to 4.0 m undergroundMild clay Sustainability 14 03367 i005
From 4.0 m underground to 10.3 m undergroundCompletely weathering mixed gneiss Sustainability 14 03367 i006
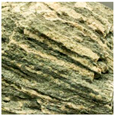
From 10.3 m underground to 21.3 m undergroundStrongly weathered mixed gneiss
From 21.3 m underground to 27.1 m undergroundMetamorphic sandstone Sustainability 14 03367 i007
Slope 4From the surface to 2.0 m undergroundMild clay Sustainability 14 03367 i008
From 2.0 m underground to 4.6 m undergroundCompletely weathering siltstone Sustainability 14 03367 i009
From 4.6 m underground to 24.8 m undergroundStrongly weathering siltstone
Table 4. Historical soft rock slope data in the study area.
NumberSoft Rock Slope
Angle (°)
Soft Rock Slope Height (m)Friction Angle (°)Weight (kN/m3)Cohesion (KPa)24-h Rainfall (mm)Measured
Horizontal
Displacement (mm/d)
Safety Factors
143.0420.035.027.040.04151.15
247.1292.035.027.040.04241.15
342.6301.033.027.032.03641.16
447.0213.037.031.368.03411.20
549.0200.537.031.368.03621.20
646.0366.037.031.368.03431.20
747.0305.037.031.368.63731.20
846.0432.035.025.046.04021.23
937.8320.035.027.037.53011.24
1041.0135.029.727.331.52711.25
1150.092.031.027.326.03421.25
1241.0110.031.027.314.02611.25
1350.090.528.027.316.82731.25
1442.0359.035.027.035.03611.27
1547.0443.035.025.046.03121.28
1642.4289.033.027.032.03111.30
1746.0393.035.025.046.03311.31
1850.0284.035.025.046.03421.34
1941.0511.039.027.310.01621.43
2044.0435.035.025.046.02411.37
2140.0470.039.027.310.02311.42
2242.0407.040.027.050.02911.44
2340.0480.039.027.310.03231.45
2449.0330.040.025.048.03421.49
2545.5299.036.025.055.02221.52
2644.5299.036.025.055.02611.55
2730.088.026.014.012.04650.63
2845.050.036.020.00.05260.67
2930.06.00.018.512.05650.78
3045.050.036.020.00.05440.79
3145.050.036.020.020.05240.83
3245.08.030.012.00.06140.80
3345.050.036.022.00.05750.89
3445.010.035.022.410.05650.90
3545.050.036.020.020.06340.96
3630.03.70.016.511.56141.00
3731.076.830.021.56.95431.01
3845.050.036.022.020.05741.02
3930.088.026.014.012.05631.02
4028.012.832.021.88.64221.03
4120.061.020.021.40.04621.03
4220.07.620.018.80.05131.05
4337.0214.032.023.50.04631.08
4430.06.00.018.525.04221.09
4535.021.028.019.111.74631.09
4640.0115.020.016.070.05921.11
4720.030.525.018.814.44111.11
4835.08.215.018.726.34211.11
4945.020.030.218.024.04621.12
5020.050.017.014.80.04611.13
5120.0100.020.023.00.03721.20
5250.0200.045.026.0150.03821.20
5330.040.026.520.616.33531.25
5453.0120.045.025.0120.03221.30
5520.08.024.520.00.03521.37
5622.010.713.020.424.94221.40
5735.04.030.012.00.03511.44
5833.08.040.022.00.02611.45
5935.04.030.012.00.02521.46
6033.08.040.024.00.02211.58
6125.010.730.018.815.32011.63
6230.020.030.321.410.01911.70
6335.0100.035.028.429.41421.78
6445.015.045.022.4100.01311.80
6520.030.525.018.814.41811.88
6635.0100.038.028.439.21231.99
6730.010.035.022.410.01012.00
6820.030.520.018.857.51012.05
6920.08.030.018.05.01012.05
7035.08.030.012.00.06740.86
7145.050.036.020.020.06420.96
7247.0117.030.027.0320.02921.61
7338.0140.030.027.0320.02521.71
7437.0128.030.027.0320.02411.81
7544.0120.040.728.0328.02311.89
7644.0116.040.728.0328.02631.98
7743.0166.036.827.0242.53411.60
7838.0121.036.026.3162.13111.69
7945.0206.041.027.0340.02621.80
8040.0186.040.027.0305.02511.89
Table 5. Current soft rock slope data in the study area.
Soft Rock SlopeNumberSoft Rock Slope Angle (°)Soft Rock Slope Height (m)Friction Angle (°)Weight (kN/m3)Cohesion (KPa)24-h Rainfall (mm)Measured Horizontal Displacement (mm/d)Safety
Factors
slope 11-122.025.017.527.314.66831.01
1-220.035.021.321.013.74521.15
slope 22-125.020.024.127.010.93911.40
2-226.048.023.618.416.17550.80
2-325.0110.012.019.511.85950.75
2-425.055.026.425.328.13921.13
2-525.020.024.119.510.95751.00
slope 33-155.020.033.725.041.32911.30
3-250.040.027.220.120.44251.02
slope 44-135.040.021.420.022.82821.30
4-230.045.018.620.316.65640.90
4-333.078.021.031.065.02612.00
4-433.078.015.022.510.07550.75
4-535.026.021.324.023.26140.91
4-630.020.031.326.033.23421.30
Table 6. The geomorphological, geological information of the object soft rock slope group.
Soft Rock Slope GroupSlope Angle (°)Slope Height (m)Friction Angle (°)Cohesion (KPa)24-h Rainfall (mm)
Slope 122.028.020.314.178
Slope 224.054.018.725.369
Slope 354.020.034.035.232
Slope 435.068.018.715.261
Table 7. Other information of the object soft rock slope group.
Soft Rock Slope GroupDistance between Soft Rock Slope and Road (m)Length (m)Horizontal Displacement (mm/d)Number of LanesSoft Rock Slope Monitoring and Early-Warning ResultsOverall Monitoring Results
Slope 12.610034Alert level. The gutters and outside of the soft rock slope were significantly washed by rainwater.Danger level. Horizontal displacement > 5 mm/d. The surface and top of the soft rock slope group has local cracks. All units need to be informed orally.
Slope 2318044\
Slope 3315044Alert level. The platform gutter was significantly washed by rainwater, and the frame beam was separated from the soft rock slope surface. The arch skeleton of soft rock slope surface Level 4 had a small crack, and the intercepting ditch on the top of platform Level 5 collapsed in a small area
Slope 42.640054Alert level. There was a small area collapse in the drainage ditch at the top of the platform, and a small crack appeared in the arched skeleton of the soft rock slope.
Table 8. Classification of factors influencing the soft rock slope risk.
FactorIIIIIIIVV
Rainfall
(mm)
<1010–2828–4646–64>64
Slope height
(m)
<3030–6060–9090–120>120
Slope angle (°)<2020–3030–4040–50>50
Cohesion (KPa)>7272–5454–3636–18<18
Friction angle (°)>4545–3535–2525–15<15
Measured horizontal displacement (mm/d)<12–33–55–8>8
Table 9. Classification of influencing factors 24-h rainfall of the soft rock slope group early risk warning.
FactorsIIIIIIIVV
24-h rainfall (mm)<1010–2828–4646~64>64
Table 10. Ten training samples for sample soft rock slope group when the adverse geological factor of the soft rock slope groups is weaker.
NumberSoft Rock Slope Risk Level Distance between Each Soft Rock Slope and the Road in the Group (m)Number of Lanes Rainfall
(mm)
Adverse Geology Levels
1IIIII56544150.9II
2IIIIIIII5645623III
3IIIIVIIIIII4345465IV
4IIIIIIII6544412III
5IIIIIIII5445418II
6IIIIIIIIII3445420IV
7IIIIIIII4345418II
8IIIIIII5424418IV
9IIIIIIIIII3343416IV
10IIIIII4434415III
Table 11. One training sample for sample soft rock slope group when the adverse geological factor of the soft rock slope group is weak.
NumberSoft Rock Slope Risk Level Distance between Each Soft Rock Slope and the Road in the Group (m)Number of Lanes Rainfall
(mm)
Adverse Geology Levels
11IIIIVIIIIII43454650.7V
Table 12. Twenty training samples for sample soft rock slope group when the adverse geological factor of the soft rock slope groups is average.
NumberSoft Rock Slope Risk Level Distance between Each Soft Rock Slope and the Road in the Group (m)Number of Lanes Rainfall
(mm)
Adverse Geology Levels
12IIIIIIIIV54644200.5IV
13IVIIIIIIII3454426IV
14IIIIIVII3423650V
15IIIIIIIIII6654428IV
16IVIIIIIII5455450IV
17IVIVIIIII5564660III
18IIIIIIII5466426III
19IIIIIIII6554426III
20IIIIIIIII5545415II
21IIIIIIIII5453613II
22IIIIIIIIIII3546426III
23IIIIVIIIII6554445IV
24IIIIIIII4443613II
25IIIIIIIIIV5533440IV
26IIIIIIIIIV4454640III
27IIIIIIIVIV3343446V
28IVIIIIIIIII3443445V
29IIIIIII4556616III
30IIIIIIIIIIII4323436III
31IIIIIIIVII3434430 IV
Table 13. Three training samples for sample soft rock slope group when the adverse geological factor of the soft rock slope groups is strong.
NumberSoft Rock Slope Risk Level Distance between Each Soft Rock Slope and the Road in the Group (m)Number of Lanes Rainfall
(mm)
Adverse Geology Levels
32IVIIIVII46456400.3III
33VIIIIIIIV4554450V
34IIIIVIVII5433442IV
Table 14. The early risk-warning results of the object soft rock slope group.
Soft Rock Slope GroupLevel of RiskDistance between Soft Rock Slope and Road (m)Number of LanesRainfall
(mm)
Poor Geological ConditionHorizontal Displacement (mm/d)Results of Soft Rock Slope Group Early Risk Warning
Slope 1III2.64650.53IV (high)
Slope 2II34650.54
Slope 3III34650.74
Slope 4III2.64650.55
Publisher’s Note: MDPI stays neutral with regard to jurisdictional claims in published maps and institutional affiliations.

