1. Introduction
Global warming will cause enormous damage to the natural ecological environment on which human beings depend, and greenhouse gas emissions from human activities (mainly carbon dioxide emissions) have been the leading cause of global warming since the mid-20th century. In 2019, China’s CO
2 (carbon dioxide) emissions were 10,175 MtCO
2e, accounting for about 27.9% of global carbon emissions. As the world’s largest developing country and the largest CO
2 emitter, China attaches great importance to the issue of addressing climate change and is actively taking various measures to promote energy conservation and emissions reduction and facilitate the transition to a low-carbon economy. The carbon emissions trading market is considered an effective means of reducing global greenhouse gas emissions and addressing climate change due to its flexibility, cost-saving ability, and effectiveness [
1].
The European Union Emissions Trading System (EU ETS) is the cornerstone of European climate policy to combat climate change [
2,
3]. Since its launch in 2005, it has become the world’s first and largest international mandatory carbon trading program, covering more than 11,000 power stations and industrial plants in 31 countries [
4]. It regulates around 50% of the total greenhouse gas (GHG) emissions in Europe. The EU ETS has proven to be an efficient policy tool that has led to a decline of 35% in emissions within the regulated installations during the period from 2005 to 2019 [
5]. The system supports stakeholders in the EU in finding cost-effective ways of reducing emissions and is regarded as an important approach for the EU to reduce its GHG emissions by 80–95% by 2050 compared to the level in 1990 [
4]. Since they causes firms to consider the price of carbon in their production costs [
6], carbon trading policies have been shown to have a significant impact on manufacturing in countries such as Norway, Finland, and Germany [
7,
8,
9].
In 2011, the Chinese government formally proposed the gradual establishment of a carbon market in the 12th Five-Year Plan. Then, from 2013 to 2016, eight provinces and cities, including Beijing, Tianjin, Shanghai, Chongqing, Hubei, Guangdong, Fujian, and Sichuan, launched carbon market pilots. In 2021, the national carbon market took the lead in online trading in the power generation industry. A report on the work of the Chinese government in 2021 emphasized the solid work of carbon peaking and carbon neutrality, one aim of which is to accelerate the construction of the carbon market. In the future, China is expected to build the world’s largest carbon market covering greenhouse gas emissions, which will be an essential step in addressing global climate change. Therefore, it is crucial to study the policy effects of China’s carbon emissions trading policy on carbon emissions reduction and economic development in China and the world.
With the advancement of China’s economic structural transformation, the transformation and upgrading of manufacturing play a vital role. As the engine of the national economy, China’s manufacturing industry has been developing rapidly since its reform and opening back up. China is the only country globally that has all industrial categories and ranks first in the world in terms of production. In 2010, China became the world’s top manufacturing country, and its proportion of manufacturing has been rising, contributing nearly 30% of the world’s manufacturing industry. However, at the same time, the share of carbon emissions from China’s manufacturing industry decreased from 71.84% in 2011 to 65.93% in 2018, but the annual average share reached 68.69%, which is still the most significant source of carbon emissions. Existing studies show that optimizing manufacturing structure is important for reaching carbon emissions reduction targets. Tian et al. proved that greening the manufacturing structure led to faster carbon emissions reduction nationwide [
10]. Mi et al. demonstrated that the restructuring of the manufacturing structure has a huge potential for energy savings and emissions reduction [
11]. China launched “Made in China 2025” in 2015, which puts forward the requirements for the transformation and upgrading of manufacturing and promotes the transformation of manufacturing from big to vigorous. How the structural upgrading of manufacturing can be used to develop a low-carbon economy and achieve an effective balance between economic development and environmental protection is a topic of common concern for the government and academia. Therefore, it is important to study how the manufacturing structure can be optimized to achieve the carbon reduction target.
In China, the government sets regional carbon emission allowances in the pilot areas of carbon trading policy every year, and the allowances are converted into carbon quotas and allocated to trading subjects according to certain rules. The main participants of carbon emissions trading in each region are mainly manufacturing enterprises with high carbon emissions, such as cement, iron and steel, petrochemical, paper, and other industries. The annual carbon emissions of enterprises cannot exceed this quota. Under such rules, enterprises in the market are faced with three choices. The first is to develop technological innovation and thus reduce the company’s own carbon emissions. If the actual carbon emissions are lower than the carbon quota, they will sell the carbon emission rights of the difference in the market. The second is to purchase carbon credits from other companies at market price to offset the excess carbon emissions. Third, they could choose not to innovate or purchase carbon credits and accept fines if their carbon emissions exceed their carbon allowances. The fine is much higher than the cost of investing or purchasing carbon credits. Companies usually do not choose to accept fines in order to make more profit. At the same time, the market price of carbon emission rights is uncertain, and the risk of fluctuation is high, which brings more business risks to enterprises. Therefore, enterprises tend to carry out energy- and environment-related technological innovation, thus optimizing the industrial structure. However, it has not been proved empirically whether the carbon emissions trading policy can optimize the manufacturing structure effectively. Therefore, it is essential to study the impact of carbon emissions reduction policies on the manufacturing structure.
We have shown the necessity of studying how carbon reduction policies affect the optimization of the manufacturing industry structure. However, how do we study the effect of these policies? A social experiment is a good way of doing so. As one of the major manufacturing bases in China, manufacturing in Guangdong accounts for about 95% of the industrial output value of the whole province. At the same time, Guangdong is also the province and city with the most significant level of carbon emissions in China. In 2013, Guangdong started to implement a carbon trading policy as the first batch of carbon trading pilot areas. After years of development, Guangdong has achieved good results in developing the carbon emissions trading market. As of 2020, the cumulative carbon emissions turnover is 172 million tons, and the turnover is CNY 3.561 billion, both ranking first in the national carbon emissions trading market. At the same time, considering that Guangdong has a wide range of manufacturing sectors, the proportion of manufacturing in the province’s economic development is similar to that of national manufacturing, and the proportion of the output value of each sector is similar to that of the national sectors; thus, it can be viewed as a smaller version of China in terms of manufacturing. Other provinces and cities that have also implemented carbon trading pilot policies, whether in terms of manufacturing output or structure, have had difficulty in providing the same reference value as Guangdong for the national implementation of carbon trading policies. In addition, we reviewed the manufacturing-related policies in Guangdong around and after 2013, and based on studies related to the manufacturing structure of Guangdong [
1,
6,
11], we cannot prove that any other particular policies or factors have particularly influenced the manufacturing structure of Guangdong around or after 2013. Undoubtedly, these factors make Guangdong a perfect social experiment and reference for the national implementation of a carbon trading policy. Therefore, we used the carbon trading policy pilot in Guangdong as a natural experiment to study the effect of carbon trading policy on the optimization of manufacturing structure.
In summary, did the carbon market, as an essential tool to address climate change in China, affect the optimization of the manufacturing structure? Through what channels did it affect the manufacturing structure? These questions have not been sufficiently addressed in previous studies.
We used a synthetic control method to construct a “synthetic Guangdong”, which has similar observed characteristics to Guangdong before the carbon emissions trading experiment in 2013. Therefore, manufacturing structure differences between Guangdong and the synthetic province after 2013 can be attributed only to the carbon emissions trading policy. This paper is one of the papers that uses the synthetic control method to conduct a counterfactual analysis of the potential impact of implementing a carbon emissions trading policy in mainland China on the manufacturing structure, which empirically complements the paper on the assessment of the effect of the synthetic control method on carbon trading policy. This study may become an essential reference for further statistical studies on implementing carbon trading policy.
The rest of the paper is organized as follows:
Section 2 presents the literature review and research approach;
Section 3 provides the empirical analysis of Guangdong and synthetic Guangdong;
Section 4 conducts a robustness test;
Section 5 analyzes the impact mechanism; and
Section 6 concludes the paper.
2. Literature Review and Research Approach
2.1. Research on Manufacturing Structure Optimization
Industrial structure upgrading and optimization have been hot topics occupying economists’ attention. Regarding the definition of the structural optimization of manufacturing, the current, more unified understanding is that the optimization of manufacturing structure includes both upgrading and rationalization.
Among these, the upgrading of manufacturing structure refers to the process of evolution of the industrial structure in the direction of technological structure upgrading and labor productivity improvement, i.e., the process of upgrading the industrial structure from a low to a high level. Poon argued that industrial upgrading is upgrading manufacturing firms from low-value-added segments of production to high-value-added segments [
12]. Gereffi stated that manufacturing structural upgrading is the process of upgrading a firm or country to establish more profitable capital- and technology-intensive areas [
13]. Cheong and Wu argued that manufacturing structural upgrading is when countries develop comparative advantages in capital- and technology-intensive industries when capital is more abundant than labor and other resource endowments [
14]. Calvo argued that manufacturing industrial upgrading is how economic agents (countries, firms, and producers) climb the global value chain and add more embedded value into their output process [
15]. Scholars generally agree that the upgrading of manufacturing structure increases the share of technology-intensive industries within manufacturing [
16]. The measure of the upgrading of manufacturing structure is generally the ratio of the gross value of high-end manufacturing to the gross value of mid-range manufacturing in each region, which can reflect the continuous transformation of the manufacturing structure from labor-intensive to technology-intensive.
Rationalization of manufacturing structure, firstly, refers to whether the number and proportion of each industrial sector are relatively balanced; secondly, it refers to the degree of correlation between different industries. Li et al. stated that rationalization reflects the degree of coordination between manufacturing industries, especially the efficiency of resource allocation among manufacturing industries [
17]. Zhao et al. believed that rationalization reflects the coordination degree among industries; that is, the degree of rational flow of production factors such as labor and capital among industries, and rationalization is beneficial to promote the benign and coordinated development of various sectors and further promote regional economic development [
18]. The “Thiel Index” is generally used to indicate the rationalization of manufacturing structure. The “Thiel Index” can reflect the degree of interenterprise correlation and the coupling degree between factor inputs and outputs within the manufacturing industry, which is a better measure of the degree of interindustry convergence.
With the concept of sustainable economic development, the connotation of manufacturing structure optimization has been expanded to include not only the traditional meaning but also the greening and ecologization of industrial development. The greening and ecologization of industrial structure refer to the organic and reasonable division of labor and synergy among various industries in the economy and society, so as to ensure the integrity and rationality of the industrial chain in the industrial system, as well as the multilevel progression and recycling of industrial waste at each level of the entire production system, and finally, the realization of the coordinated development of the economy and environment. Some scholars have examined whether carbon emissions reduction can be accommodated in optimizing the manufacturing structure [
19,
20]. Some scholars believe that reasonable environmental policies need to be established in industrial structure optimization. Chen et al. argued that environmental regulation policies suitable for local conditions should be established based on the transition of the local industrial structure [
21]. The measuring of the greening of manufacturing structure is generally performed using the ratio of low-energy-consuming and low-pollution industries to manufacturing output value as the indicator of the greening of manufacturing structure. This reflects that in economic growth, the proportion of industries with low energy consumption and waste emissions is rising higher and higher, and the manufacturing structure is changing to clean and environmental protection.
With reference to existing studies, we divided manufacturing structure optimization into the upgrading of manufacturing structure, the rationalization of manufacturing structure, and the greening of manufacturing structure. In this way, we avoided a single one-sided definition of manufacturing structure optimization and studied the impact of carbon trading policy on industrial structure optimization in a comprehensive way.
2.2. Externality Theory and Research on Carbon Emissions Trading
In 1920, Pigou introduced the concept of the impact of production activities of enterprises on external factors from the perspective of welfare economics, i.e., externality [
22]. An externality is an action of a microsubject that has a beneficial or negative impact on the welfare of a subject other than itself. Such effects are not deserved or borne by these subjects themselves, and they cannot be traded through the market. The positive effects are called positive externalities and the negative effects are called negative externalities.
As the contradiction between environmental protection and economic development continues to emerge, environmental pollution has become a prominent negative externality. Enterprises earn revenue by producing products and selling them, but they also release pollutants into the natural ecological environment. The public, excluding the enterprise, does not gain any benefit but has to bear the loss caused by environmental pollution. In the long run, it will not only cause more and more serious environmental pollution, but will also lead to a reduction in overall social welfare and an increase in social inequality. The main solution to solve this negative externality problem is the “Pigou tax”, which is a tax on enterprises or individuals who emit pollutants, but this approach requires administrative intervention by the government, which has its costs. At the same time, it requires the government to have complete information about the costs and benefits of economic agents that cause externalities, but in reality, the information is not complete, so the policy effect of the “Pigou tax” in practice is not ideal.
To address the issue of externalities, environmental policy has always been a hot topic for scholars to study, and there is more research literature about the effect of environmental policy on the optimization of industrial structures. Most of the scholars’ research results from the existing literature confirm that environmental policy tools can optimize manufacturing structure to a certain extent [
23,
24]. Reasonable environmental regulation changes the cost–benefit relationship of manufacturing enterprises. In order to maximize profits, enterprises make corresponding adjustments to their technology level, product location, product structure, and factor structure to absorb the cost increase brought about by environmental protection measures, driving the transformation and upgrading of industrial structure. A small number of studies have examined the relationship between environmental regulations and the manufacturing industry’s structure in China. Chen et al. argued that the industrial structure’s effect was the largest negative factor in increasing industrial carbon emissions [
25]. Lin and Zhu confirmed the importance of urbanization and upgrading of industrial structures to realize the goals of saving energy and emissions reduction [
26].
In contrast to Pigou’s approach, Coase proposed the use of market transactions in 1960 to prevent the occurrence of negative externalities and to achieve efficient resource allocation [
27]. Carbon trading is a kind of environmental policy that can effectively use market trading to solve the negative externality problem. At present, the research on carbon emissions trading mainly focuses on the allocation of initial carbon emissions rights in the process of carbon emissions trading, the trading mechanism, the comparison of the advantages and disadvantages of carbon emissions trading and carbon tax, and the emissions reduction effect of carbon emissions trading. However, there is little research on the impact of carbon emissions trading on manufacturing industry structure optimization. Dong et al. stated that carbon emissions reduction promotes industrial structure upgrading [
28]. Zheng et al. argued that the construction of low-carbon cities displays a positive impact on industrial structure supererogation, while it has little effect on industrial structure rationalization [
29]. In measuring the impact of carbon emissions trading on industrial structure optimization, most of the studies measured this impact only in the traditional sense of rationalization and upgrading [
29,
30], and a few scholars analyzed it from the perspective of greening [
31,
32]. However, there are few studies on whether carbon emissions trading policy can effectively optimize the manufacturing structure in China and its impact mechanism, and there is no consistent conclusion. As a critical market-based environmental policy tool, the effect of carbon emissions trading on manufacturing structure optimization can be studied regarding the optimization effect of environmental policies.
Therefore, existing studies have demonstrated that environmental policies have an impact on the structure of the manufacturing industry. However, there are relatively few studies on whether carbon trading policy, as one of the most important environmental policies, has an impact on the optimization of manufacturing structure, and if so, through which channels it operates. Our study attempted to answer this question and provide a reference with regard to the implications of this policy for its national expansion.
2.3. Analysis of the Influence Mechanism
With continuous research, scholars began to study how environmental policies affect manufacturing structure optimization through different realization mechanisms, summarized in four main aspects: improving the level of technological innovation, attracting foreign direct investment, adjusting international trade, and changing the demand structure [
33,
34,
35,
36].
The first aspect is improving the level of technological innovation. The positive role of technological innovation in promoting manufacturing structure upgrading has been widely recognized by academia, while the impact of environmental regulation on manufacturing technological innovation is somewhat controversial. The traditional view is that environmental regulations, such as technical standards, environmental taxes, and tradable emissions, can protect the environment. However, these policies increase the cost of enterprises, weaken their international competitiveness, and are not conducive to their sustainable development. Economists such as Porter have argued that strict but adequately designed environmental regulations, predominantly market-based environmental policies such as taxes and pollution emissions permits, can incentivize firms to innovate and partially or even completely offset the costs of following environmental regulations [
37].
The second aspect is attracting foreign direct investment (FDI). FDI is both a production factor and a technology spillover for the host country, promoting the technological transformation of traditional industries in the host country and the development of related industries through industrial linkages, thus promoting the upgrading of the host country’s industrial structure. Most of the literature recognizes the positive role of FDI in optimizing and upgrading China’s manufacturing structure [
38].
The third aspect is adjusting the structure of international trade. Changes in environmental regulations affect international trade by influencing the terms of trade, the structure of trade products, innovation, and the geographical direction of trade, promoting the restructuring of domestic industries. Environmental regulations are tightened, affecting the comparative advantage of trade in a country or region, changing the trade division, and prompting a transition from pollution-intensive products to clean products. In order to comply with the requirements of environmental regulations, enterprises will reduce imports of pollution-intensive products and increase imports of clean technologies or products. Similarly, if pollution-intensive industries comply with environmental regulations, their output will decline, and exports will be restricted.
The fourth aspect is changing the structure of demand. On the one hand, environmental regulations will provide clear product signals and influence consumers’ demand preferences, such as reducing consumers’ consumption of polluting products and increasing consumers’ preference for green and low-carbon products, thus guiding enterprises to adjust their production plans and product structures. On the other hand, investment is essential for forming and upgrading the manufacturing structure. Environmental regulations restrict the development scope of resources required by enterprises to engage in production and increase production costs, and then lead to a reduction in the scale of enterprise investment and a decrease in the share of related industries through the investment multiplier effect, and guide enterprises to adjust their investment structure and thus promote changes in the overall manufacturing structure.
Through the above combing of the literature and mechanism analyses, theoretically, the potential channels of influence of the carbon emissions trading mechanism in the optimization and upgrading of manufacturing structure include technological innovation, foreign direct investment, international trade, and demand factor aspects. In practice, the influence of the carbon emissions trading mechanism on China’s manufacturing structure needs further empirical testing.
2.4. Research Approach
According to the current research on carbon trading policy evaluation, there are three main categories of methods: the single-difference method, the difference-in-difference (DID) method, and the propensity-score-matching double-differences (PSM-DID) method.
First, the single-difference method can illustrate the implementation effect of the carbon trading pilot by comparing the change in carbon dioxide emissions before and after the implementation of the carbon trading pilot. However, it cannot effectively divorce the changes in carbon emissions caused by other factors, such as technological progress and production process innovation. Moreover, if carbon emissions are only compared between pilot and nonpilot provinces, it is easy to mistake the unobservable systematic differences that may exist in different provinces before the implementation of carbon trading for the effects of carbon trading policies.
Second, the difference-in-difference (DID) method needs to satisfy the assumption that the carbon emissions of the experimental and control groups have a common trend. However, the carbon emissions of each region are significantly different, and the convergence rate of carbon emissions has obvious regional heterogeneity. The DID method cannot completely strip the policy effect and other influencing factors when the assumption of a parallel trend is not satisfied. The DID method cannot completely strip out the emissions reduction effects of policy effects and other influences when the parallel trend assumption is not satisfied.
Third, Heckman et al. evolved the traditional DID method into the propensity-score-matching double-differences (PSM-DID) method [
39]. PSM-DID is widely used in academia to study the policy effects of carbon emissions trading pilots [
40]. Although PSM-DID can guarantee the optimal matching effect and make the research conclusions more credible in the case of large samples, PSM-DID has its strict application conditions. Firstly, PSM-DID can improve the matching results only in the case of large samples. Since there are only eight provinces in the carbon emissions trading pilot projects, and the longest implementation time is not more than six years, the research samples of carbon trading pilot projects do not meet the large-sample requirement. Secondly, PSM-DID can control for observable variables only, ignoring the control for unobservable variables, which leads to estimation bias. Thirdly, PSM-DID analyzes all provinces covered by carbon trading policy as a whole, and the conclusion obtained is only the overall policy effect. However, in reality, on the one hand, the provinces implementing carbon emissions trading policies differ significantly in terms of economic development, industrial structure, and energy efficiency. The policy effects achieved even after implementing the same policies are not the same. On the other hand, there is also heterogeneity in the policy effects achieved due to the different supporting measures taken by the provinces in implementing the policy after the carbon emissions trading policy and the differences in the efficiency of the policy implementation. Therefore, selecting the control group scientifically and avoiding the control group’s subjectivity have become critical issues studied by scholars.
In order to better evaluate the effects of the policy, in 2003, Abadie and Gardeazabal proposed the synthetic control method (SCM) [
41]. Compared with previous evaluation methods, firstly, it allows multidimensional coshocks to exist. Secondly, the synthetic control group is highly similar to the experimental group characteristically, which can overcome the effects of policy endogeneity problems.
SCM finds ideal areas that are highly similar to the policy intervention areas but without policies to compare whether the changes that occur in a country or area before and after the policy occurrence are significant. It is based on the principle that out of N + 1 regions, only one region has implemented a particular policy and the other N regions are not subject to policy interventions. SCM is most applicable to comparative case studies where only a few treatment units exist. Positive weights are calculated and assigned to several control units from the same national province donor pool to obtain the weighted average of the manufacturing structure of the synthetic province that best reflects the trend of Guangdong’s manufacturing structure before implementing the carbon emissions trading policy. The formation of synthetic control units provides a policy counterfactual that allows us to assess the effectiveness of carbon trading policies on manufacturing structures.
The studies mentioned above provide valuable and essential references that allowed this paper to expand the research perspective and determine the research ideas and methods. Using data from 23 provinces in mainland China without carbon emissions trading policies from 2009 to 2019, we constructed a “synthetic Guangdong” using an SCM to study the carbon emissions trading pilot policy experiment that has been implemented in Guangdong since 2013. We assessed the impact of carbon emissions trading on the manufacturing industry structure in Guangdong compared with other provinces in mainland China without implementing carbon emissions trading pilot policies. The impact of carbon trading on the manufacturing structure of Guangdong was compared to other provinces in mainland China that did not implement carbon trading pilot policies. Prior to implementing the carbon trading policy in Guangdong Province in 2013, “synthetic Guangdong” shared similar observed characteristics to Guangdong. Therefore, after 2013, the difference in manufacturing structure between Guangdong and “synthetic Guangdong” can only be attributed to the carbon emissions trading policy. This paper empirically complements the paper on the synthetic control method in assessing the effect of carbon trading policy. Assessing the potential impact of carbon trading policy on manufacturing industry structure will add to the literature before the policy is fully promoted and will also have implications for future carbon trading policy adjustments in China.
3. Empirical Analysis
3.1. Data Sources
This paper’s primary variable of interest is the structure of China’s provincial manufacturing industries and their determinants. We restricted the data to provinces in mainland China for two reasons. First, there are enough provinces in mainland China to allow for a comparative case study. Second, there may be more similarity between unobservable characteristics at the provincial level for provinces within the same country.
Guangdong Province was the experimental group, and the remaining provinces were the control group of synthetic control. According to the actual situation of the carbon emissions trading policy implementation, we selected 2013 as the time point of policy implementation. This paper used data from 2009 to 2019 for 23 provinces in mainland China that have not implemented a carbon emissions trading policy. We obtained the data from the 2009–2019 China Industrial Economic Yearbook published by the National Bureau of Statistics of China and the 2009–2019 provincial and municipal yearbooks published by the provincial and municipal statistical bureaus. Due to the missing data in the statistical yearbooks of some years, this paper used year-on-year growth and other methods to complete the data in some years with missing data.
This paper selected manufacturing structure upgrading, manufacturing structure rationalization, and manufacturing structure greening as explanatory variables and economic development, capital input, labor input, and urbanization as control variables. The connotations of each variable and the basis of their selection are as follows.
(1) Upgrading of manufacturing structure (): We used the ratio of high-end manufacturing output value to a mid-range manufacturing output value in each region to measure the upgrading of manufacturing structure. It reflects the process of continuous transformation of the manufacturing structure as it becomes more technology-intensive. It reflects the rational allocation of resources and the efficiency of applying the core technology level in the production process.
(2) Rationalization of manufacturing structure (
): We used the “Thiel index” to express the rationalization of manufacturing structure. It reflects the degree of correlation between manufacturing enterprises and the degree of coupling between factor inputs and outputs and is a better measure of interindustry convergence. The model is as follows (Equation (1)):
where
is the Thiel index, which indicates the rationalization of manufacturing structure,
indicates the output value of industry
in manufacturing, and
indicates the number of people in the labor force at the end of the year in industry
.
(3) Greening of manufacturing structure (): We used the ratio of low-energy-consuming and low-pollution industries to manufacturing output value as the indicator of the greening of manufacturing structure. It reflects that in economic growth, the proportion of industries with low energy consumption and waste emissions is increasing, and the manufacturing structure is changing to a focus on clean energy and environmental protection.
(4) Referring to Wang and Wang [
42], the following control variables were selected. Economic development (
): The gross domestic product (GDP) per capita indicates each region’s economic development level. Labor input (
): The ratio of the working population to the resident population at the end of the year indicates each region’s labor input level. Urbanization (
): The urban population to resident population ratio indicates each region’s urbanization level.
3.2. Empirical Evidence of Research Approach
The purpose of this paper was to assess the causal impact of carbon trading policies on industry structure. A key concept in policy evaluation is to find a suitable “counterfactual”, i.e., what would have happened if the policy had not occurred. Because we cannot observe a “counterfactual” for the experimental group, we needed to find a suitable control group similar to the experimental group but not affected by the policy. Study designs to identify an appropriate control group can be divided into randomized controlled trials (RCT) and quasi-experimental designs (QED), such as regression control, DID, PSM-DID, and regression discontinuity. In the context of the Guangdong experiment, we needed to rely on quasi-experimental designs to determine the “counterfactual” of the policy occurrence in Guangdong.
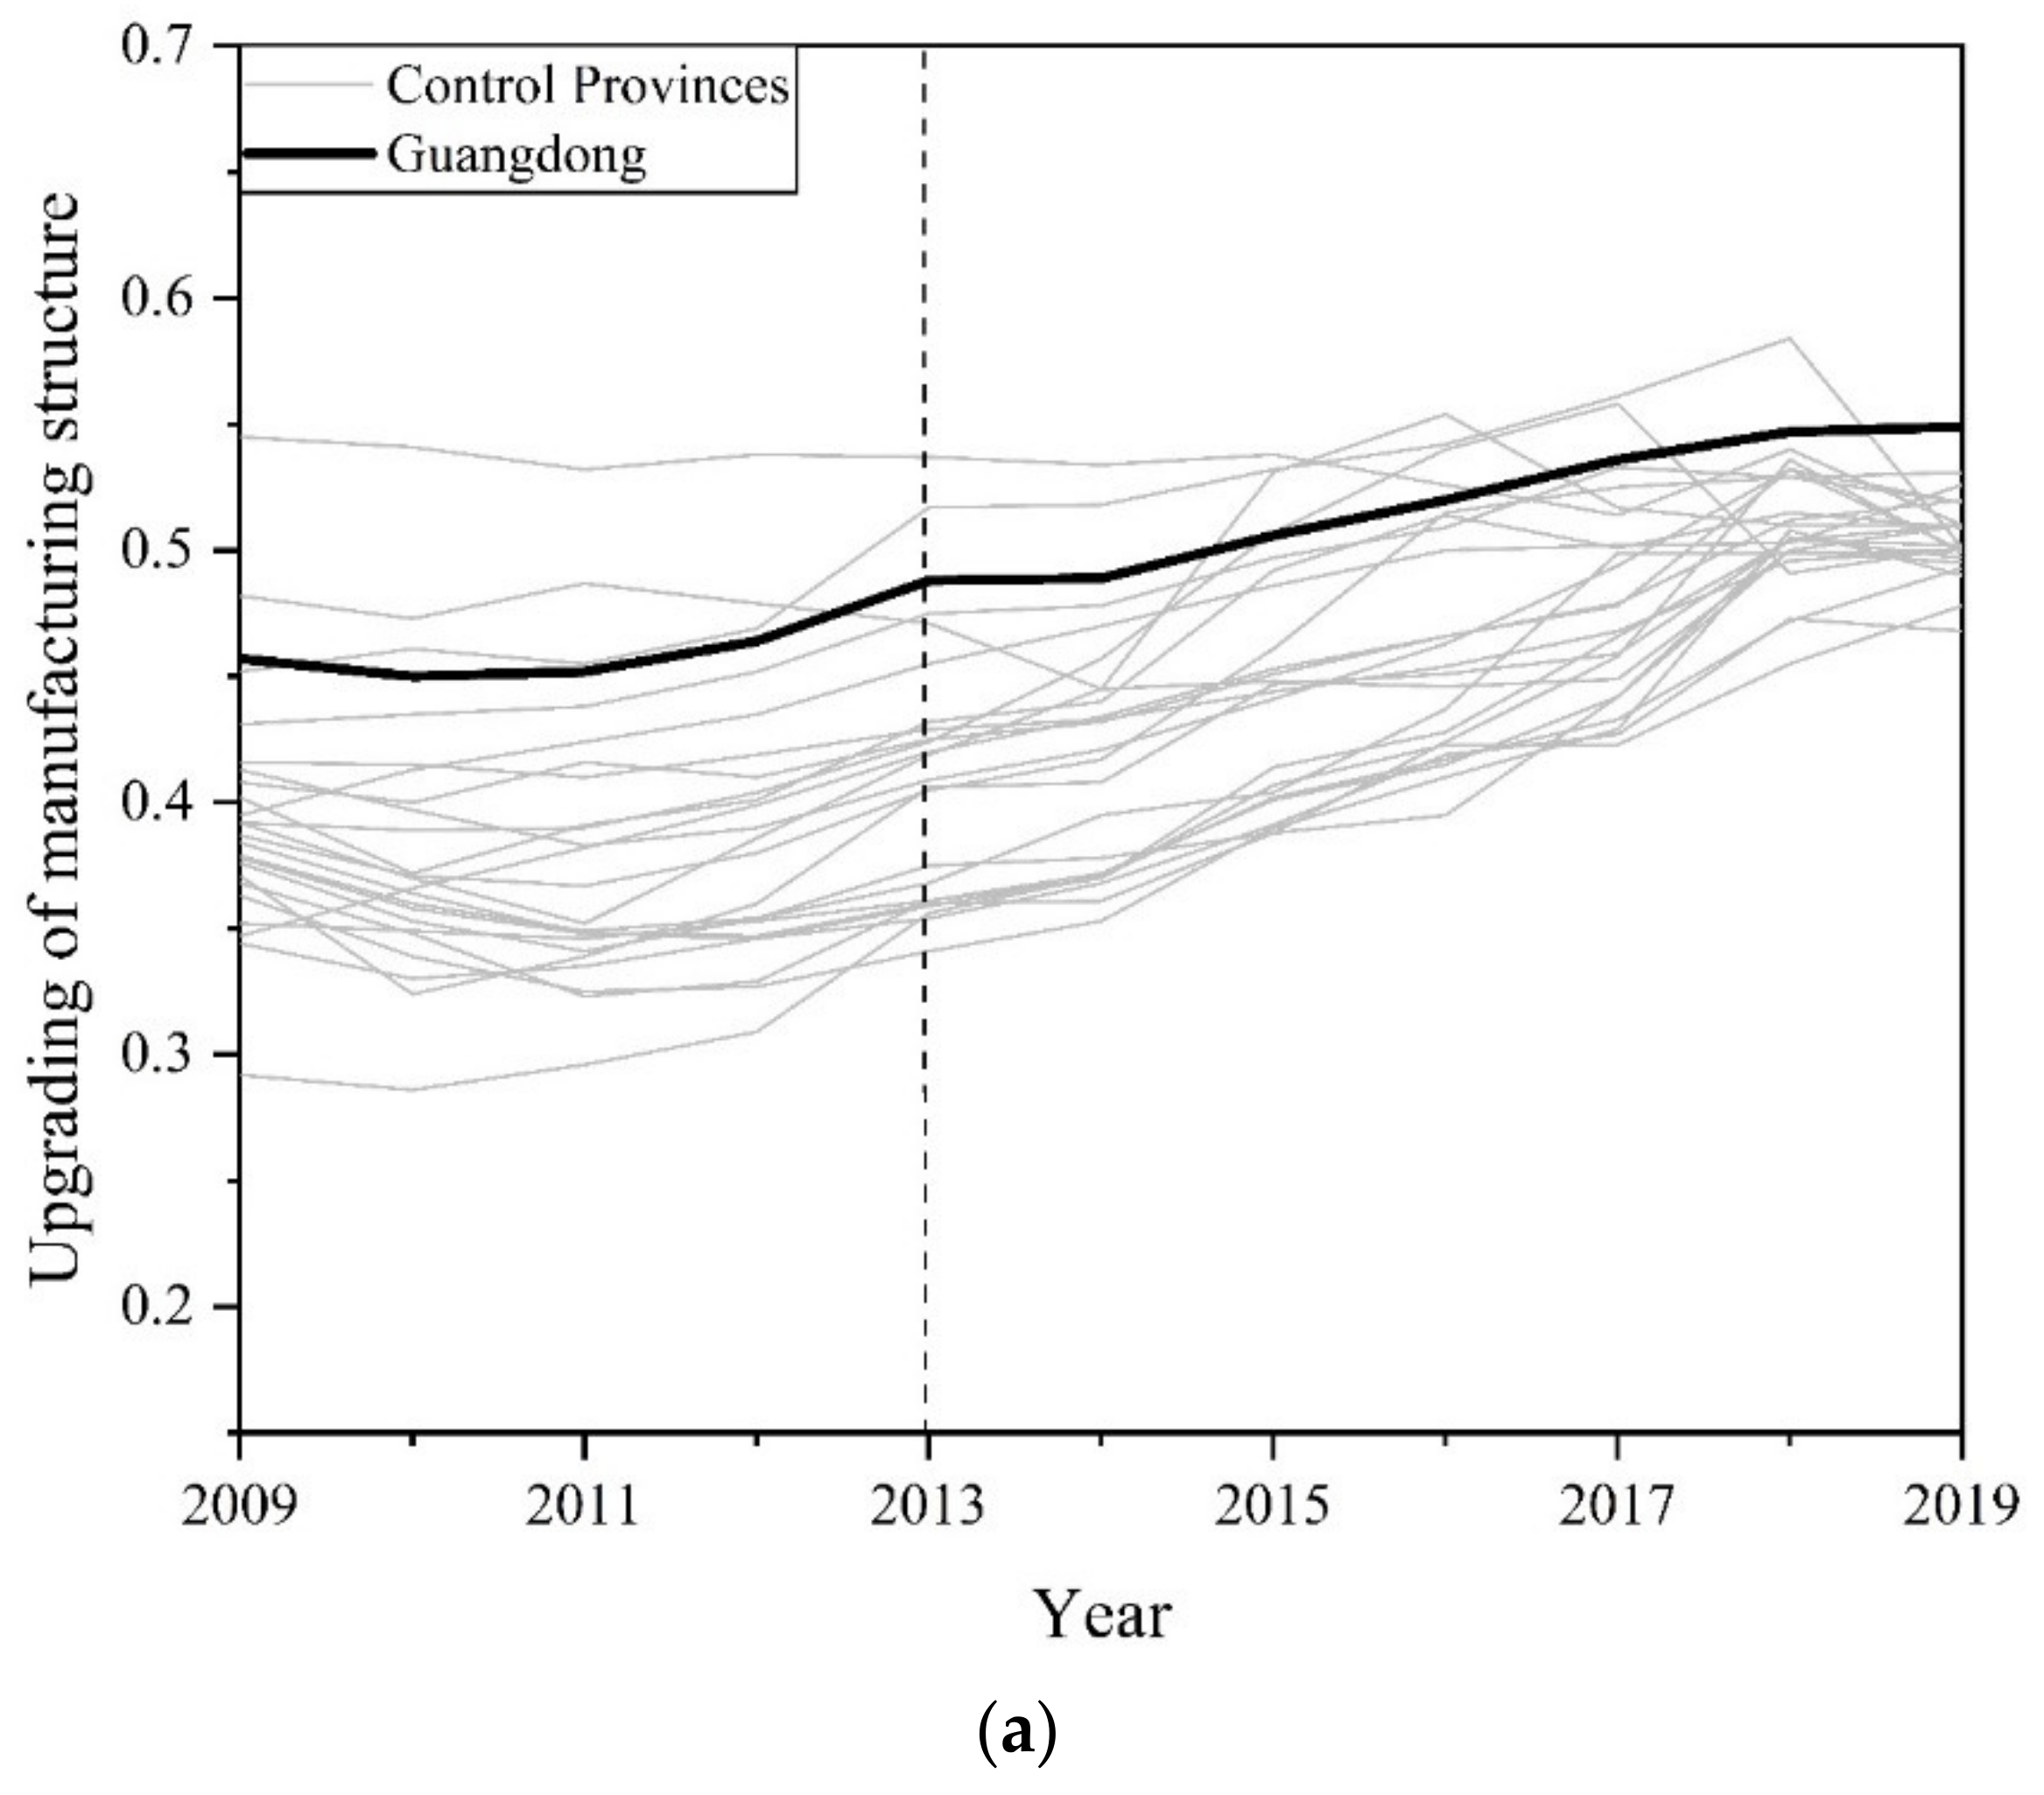
However, it was not easy to find a control unit similar to Guangdong Province but not affected by policies.
Figure 1 shows the upgrading, rationalization, and greening manufacturing structure of Guangdong and 23 other provinces, which clearly shows that the manufacturing structure of Guangdong is significantly different from the average level of other provinces. We formally tested the differences between Guangdong and other provinces using the DID method. Using the data for 24 provinces for 2009–2019, we regressed
,
, and
on provincial dummies, year dummies, and the interactions of Guangdong and year dummies. The results show that, before 2014, almost all coefficients were significantly negative, indicating that the
,
, and
between Guangdong and other provinces changed significantly more in these years than in 2013. In addition, any pair of coefficients for adjacent years prior to 2014 was significantly different, which indicates a different manufacturing structure between Guangdong and the rest of China. Therefore, if we implement the DID analysis directly, the estimated impact of carbon trading policies may be biased. Furthermore, Cameron and Miller (2015) pointed out that a DID model is likely to be inconsistent if there are too few treatment groups compared with control groups, which was the case in our study.
As DID cannot appropriately identify the policy impact of the Guangdong experiment, we adopted a synthetic control approach that sufficiently addressed the shortcomings of a traditional DID analysis. The synthetic control method (Abadie and Gardeazabal 2003; Abadie, Diamond, and Hainmueller 2010, 2015) allowed us to construct an artificial control group that almost exactly mimicked the manufacturing structure of the treated unit prior to the policy experiment. The “synthetic Guangdong” constructed by the synthetic control method was the control group, which was compared with Guangdong with carbon emissions trading policy to evaluate the impact of carbon emissions trading on the manufacturing structure of Guangdong. The provinces that generate nonzero weights were the components of synthetic Guangdong.
3.3. Result Analysis
As shown in
Table 1, based on the synthetic control method, an
with a positive synthetic contribution to Guangdong was found for Zhejiang (0.812) and Liaoning (0.188). A
with a positive synthetic contribution to Guangdong was found for Jiangsu (0.935) and Liaoning (0.065). A
with a positive synthetic contribution to Guangdong was found for Zhejiang (0.626), Jiangsu (0.111), and Heilongjiang (0.263).
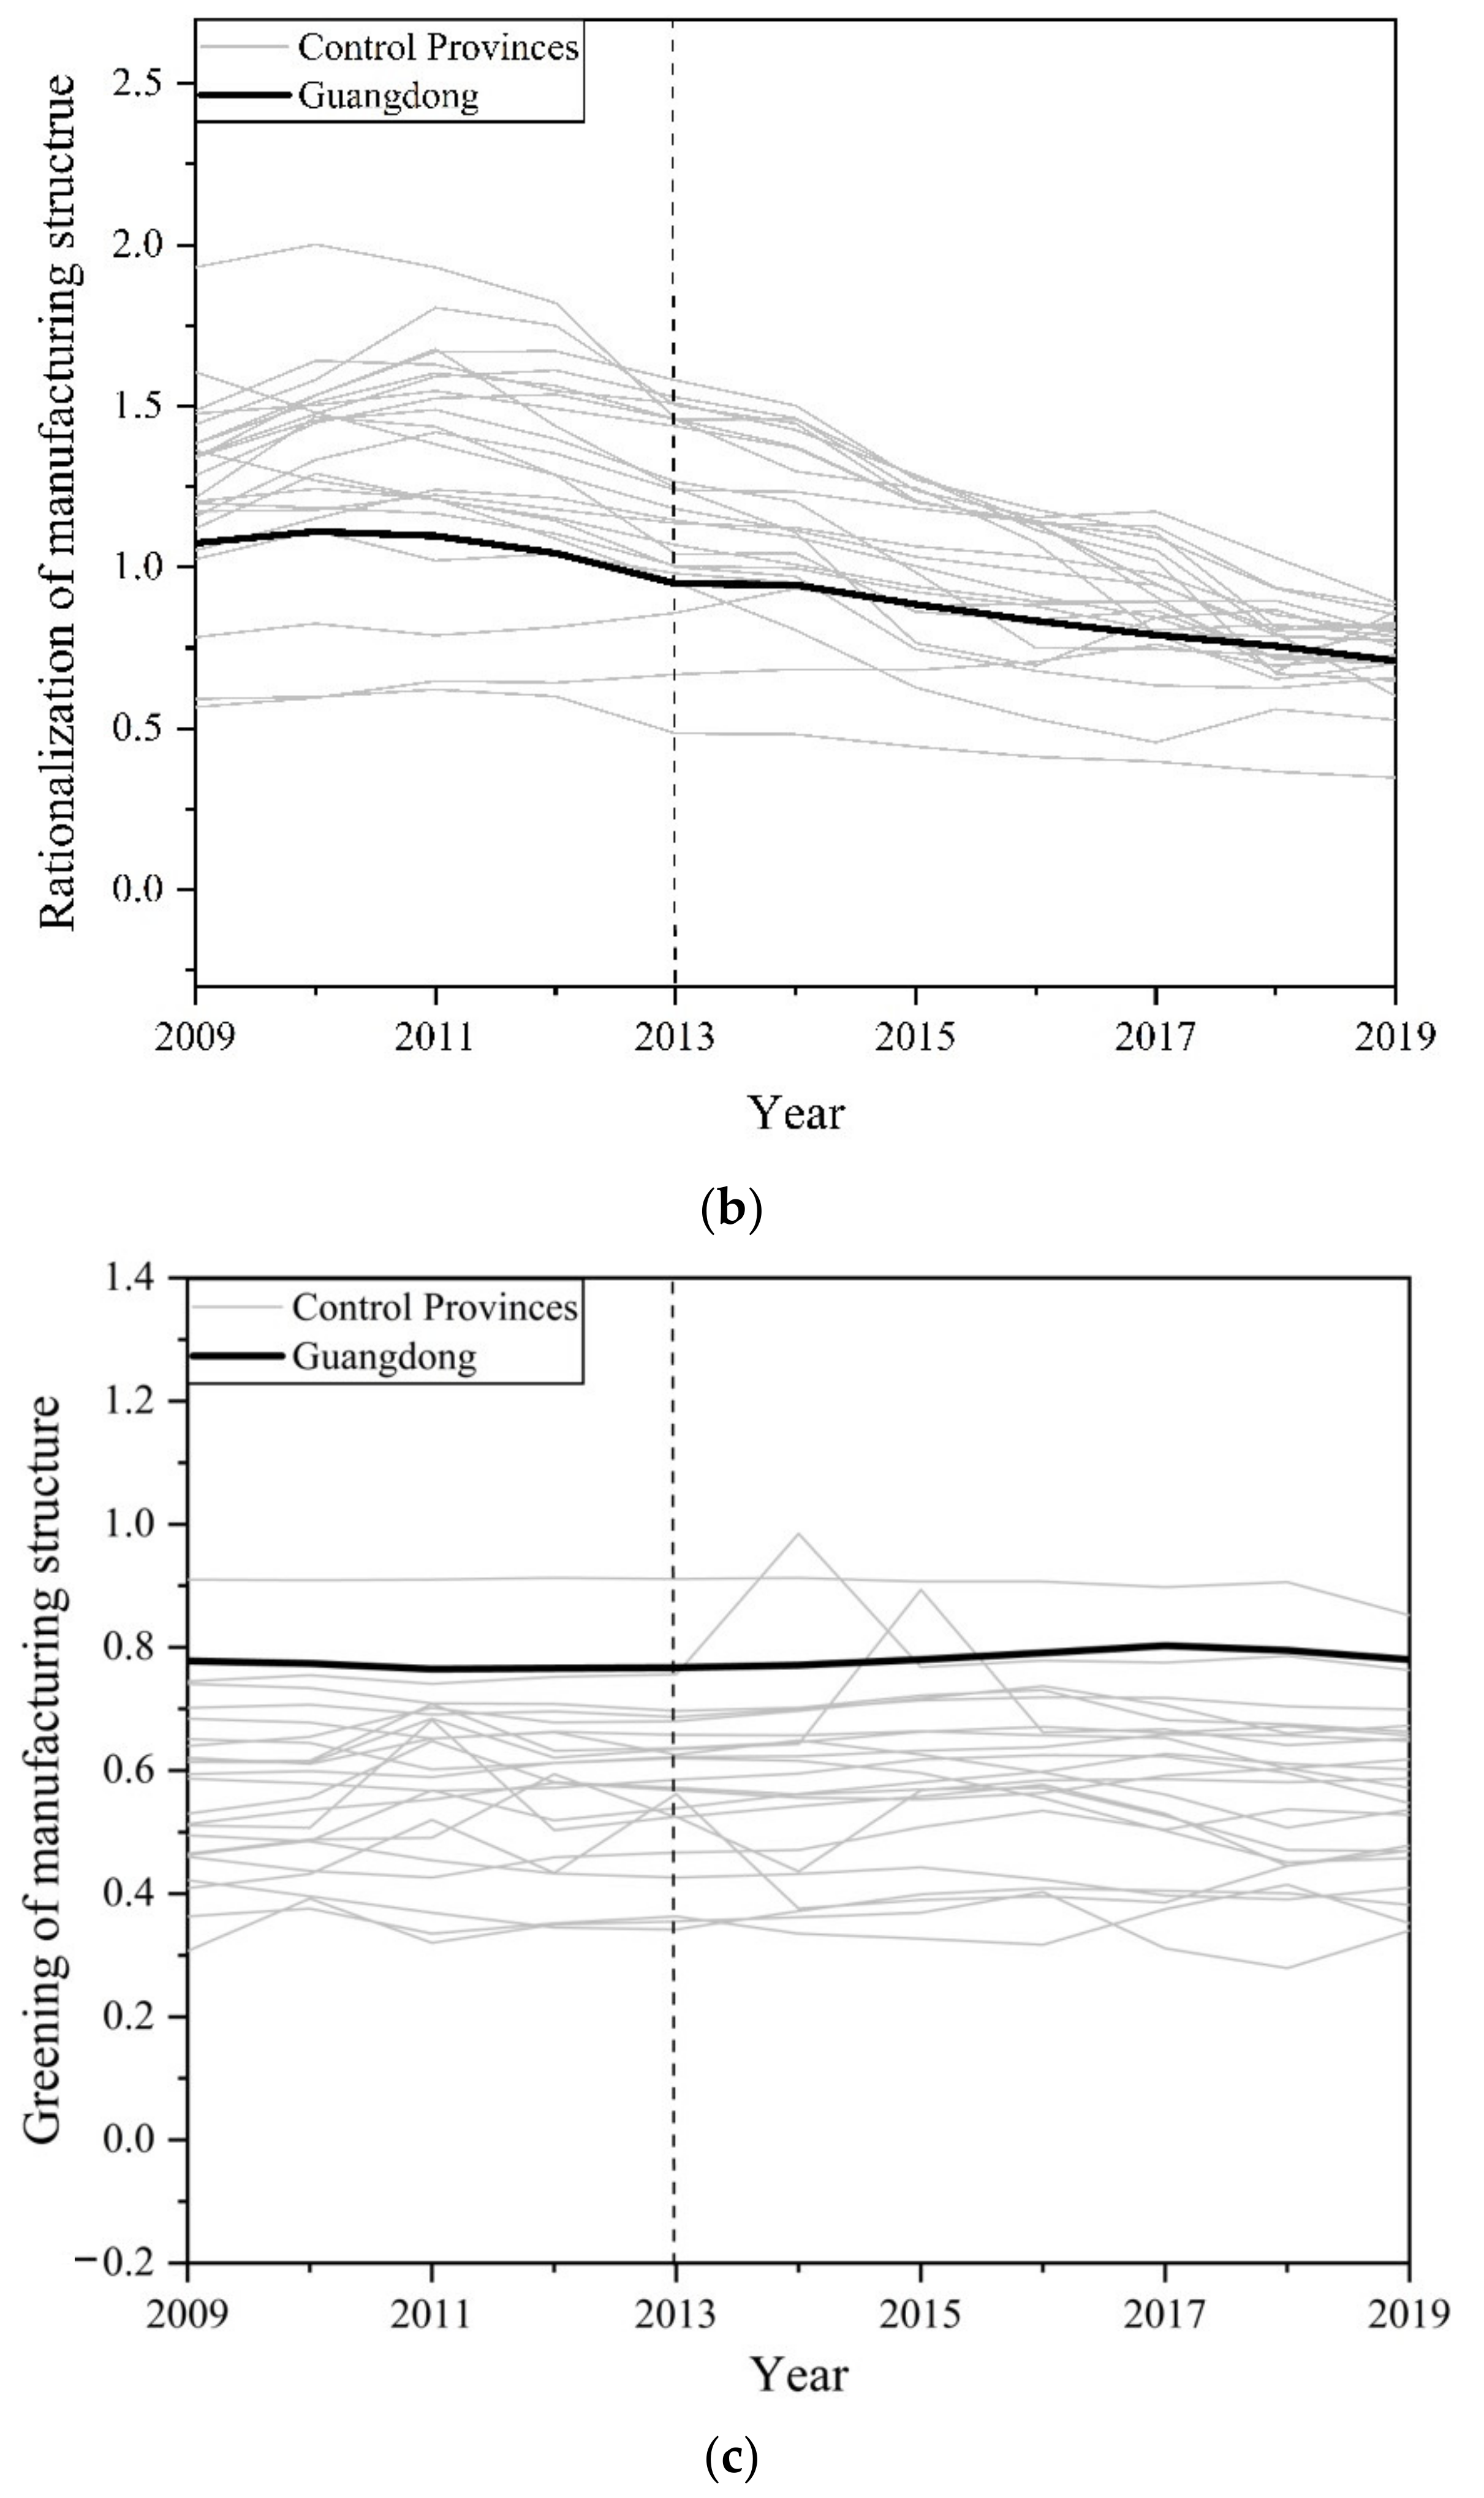
Figure 2,
Figure 3 and
Figure 4 shows the degree of difference between the trajectory changes of Guangdong and synthetic Guangdong before and after the policy. The rationalization effect of carbon emissions trading in optimizing manufacturing structure was not very significant, and the effects on the upgrading and greening manufacturing structure were prominent.
Figure 2 shows the test results of the rationalization effect of manufacturing structure in Guangdong and synthetic Guangdong. The solid line represents Guangdong, and the dashed line represents synthetic Guangdong. Whether observing the results before or after implementing the carbon emissions trading policy, there was no significant change in Guangdong’s manufacturing structure rationalization indexes and synthetic Guangdong. This indicates that the implementation of the carbon emissions trading policy has not had a significant effect on the manufacturing structure rationalization of Guangdong for the time being.
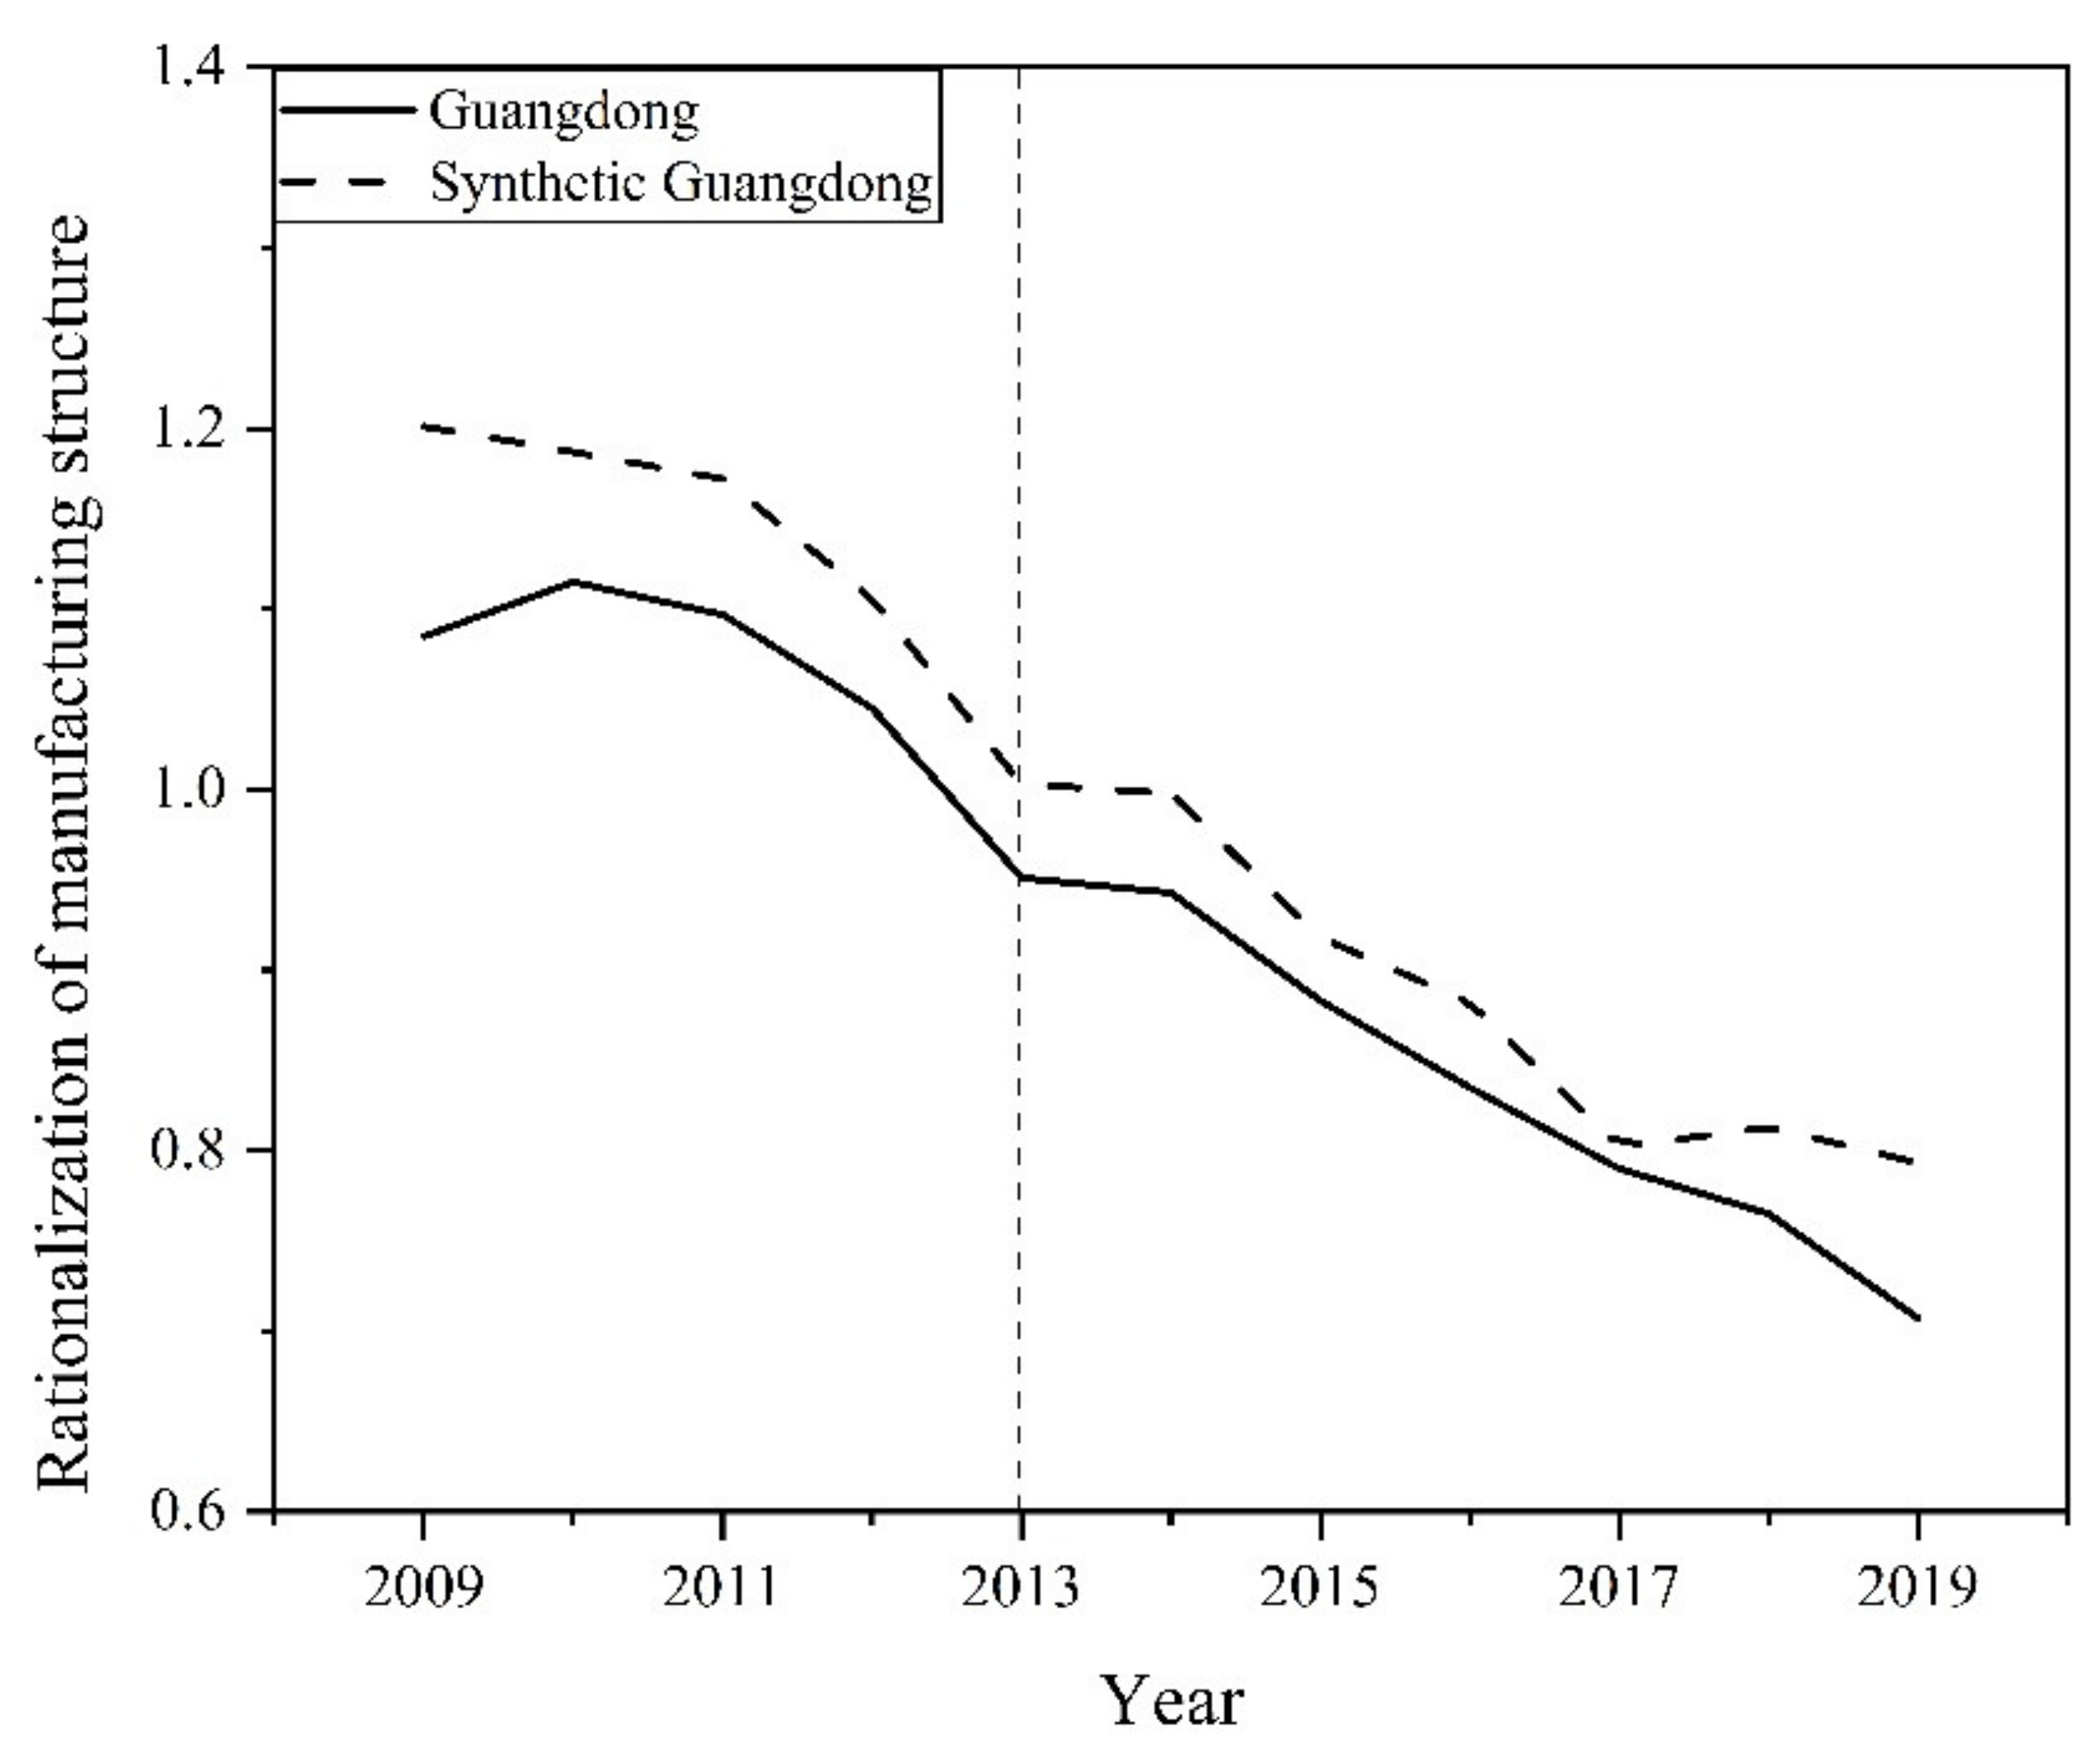
Figure 3 shows the test results of the upgrading effect of the manufacturing structure of Guangdong and synthetic Guangdong. The solid line represents Guangdong, and the dashed line represents synthetic Guangdong. Before and after 2013, Guangdong and synthetic Guangdong Province were relatively similar and close to each other, but after implementing the policy, there was a significant difference between them. The upgrading index of the manufacturing structure of Guangdong was on an upward trend. It was significantly higher than the upgrading index of manufacturing structure of the synthetic Guangdong during the examined time. This indicates a continuously optimized trend in the manufacturing structure of Guangdong, and the implementation of carbon emissions trading has accelerated the process of manufacturing structure advanced in Guangdong.
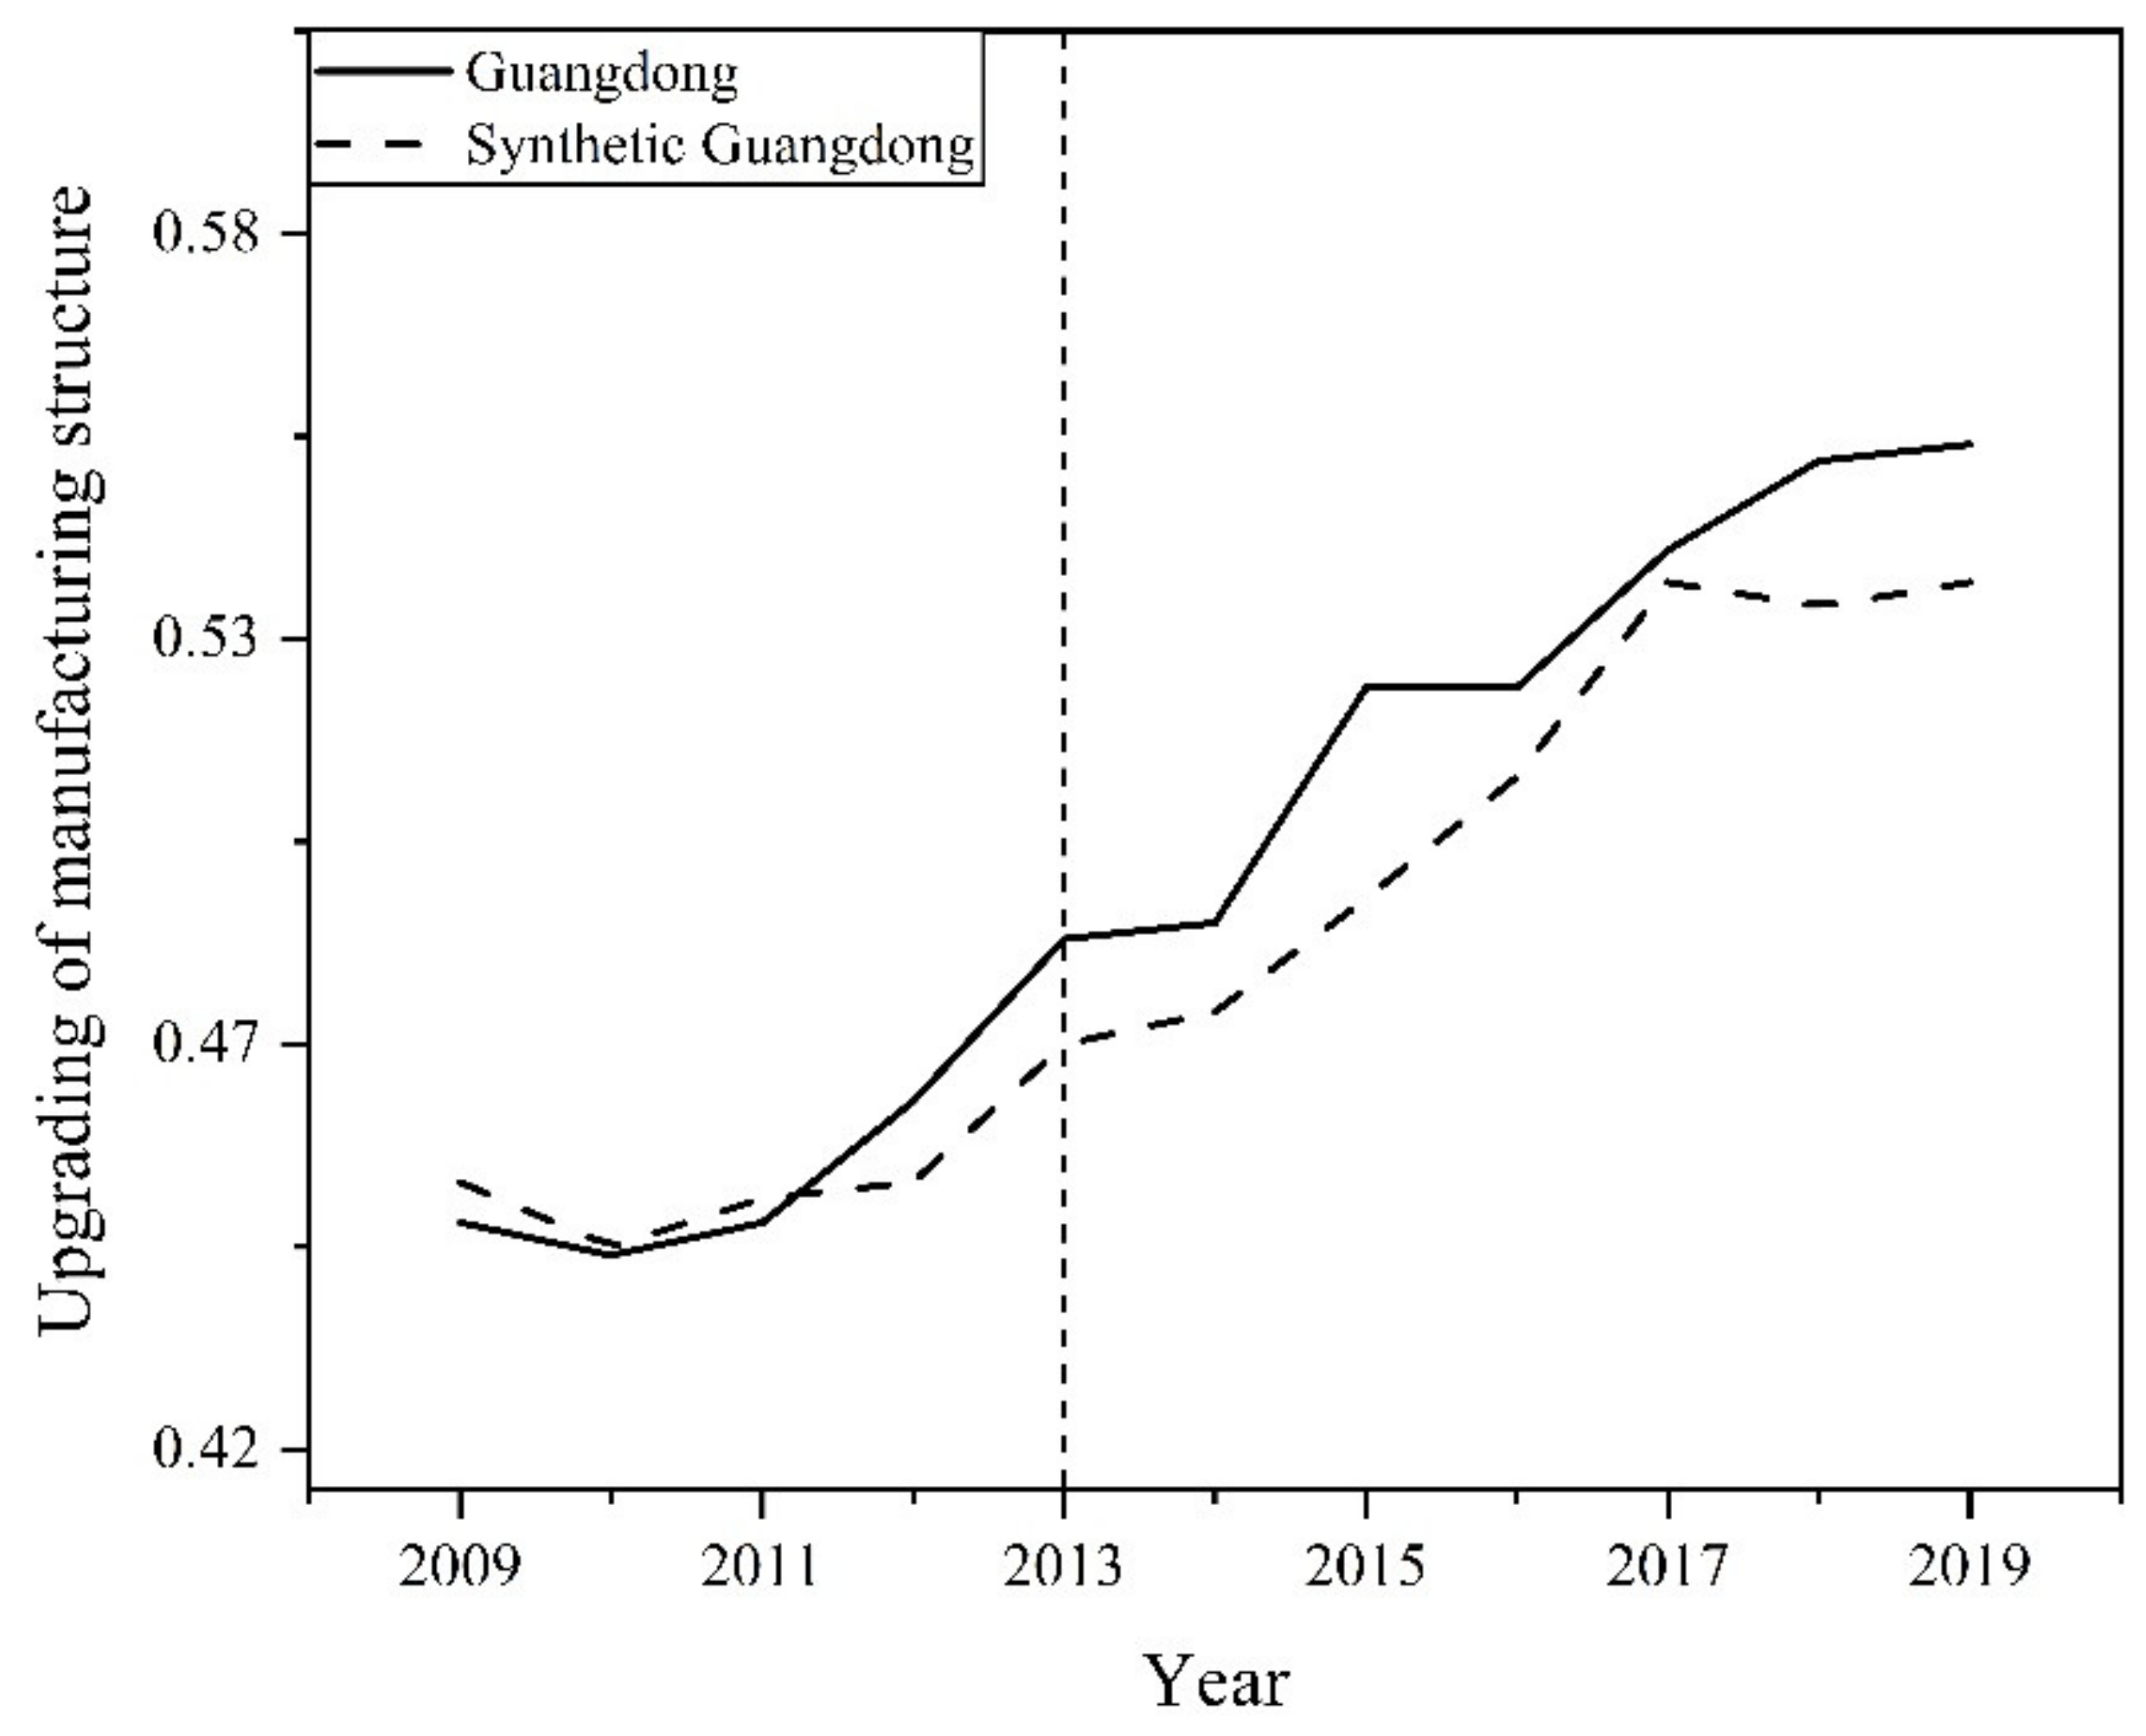
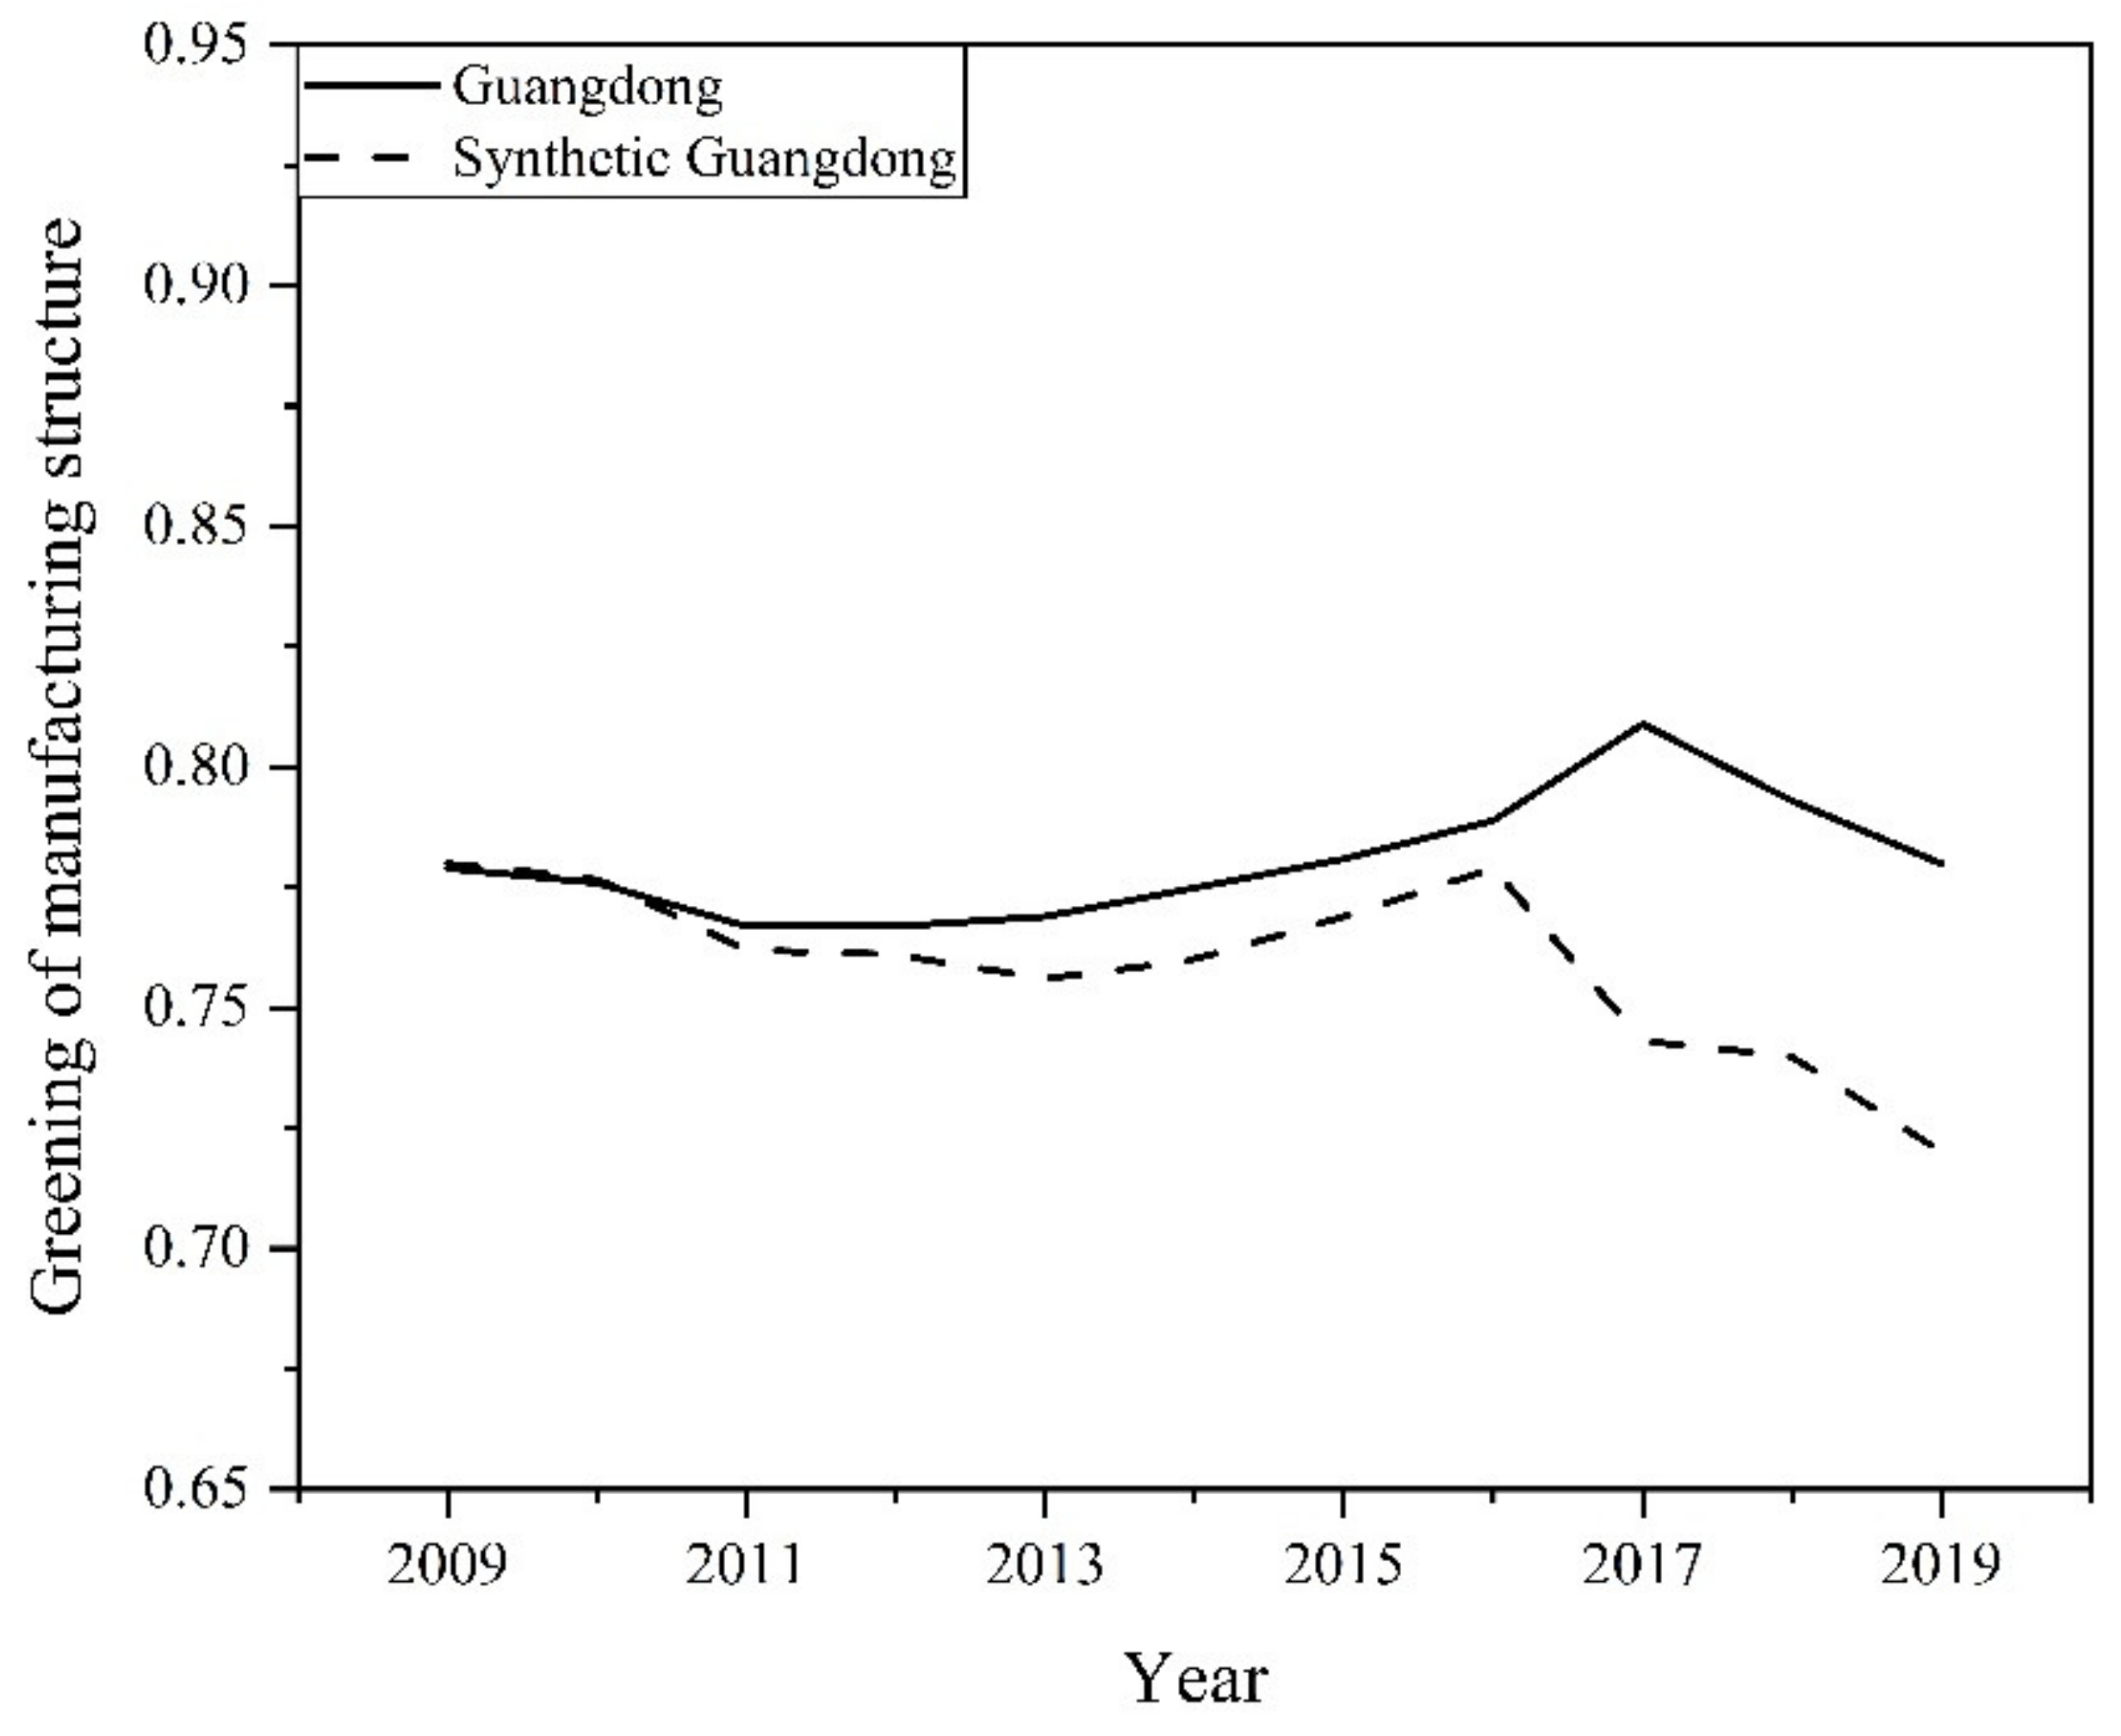
Figure 4 shows the test results of the greening effect of the manufacturing structure of Guangdong and synthetic Guangdong, where the solid line represents Guangdong, and the dashed line represents synthetic Guangdong. After implementing carbon emissions trading, there was a significant change in the greening index in optimizing the manufacturing structure of Guangdong compared to synthetic Guangdong. This indicates that carbon emissions trading significantly promotes the overall development of the manufacturing structure of Guangdong towards cleanliness and greening. In order to reach the government-mandated CO
2 emissions, many enterprises have taken effective emissions reduction measures, by directly reducing product production, replacing production equipment, or by promoting technological innovation.
Meanwhile,
Figure 3 and
Figure 4 show that in 2012, due to a specific time lag between the official release of policy and prepolicy research, the manufacturing structure of Guangdong began to upgrade and green from 2012 onwards before the release of the policy. We can often see this phenomenon in the empirical tests of the policy effects, since enterprises had already learned of some policies through government inspection agencies and other means to make decisions and production ahead of the policy when it was not formally released.
4. Robustness Checks
We observed a more significant contribution of implementing carbon emissions trading policy to the upgrading and greening of the manufacturing structure of Guangdong through the synthetic control method. We conducted a robustness test to ensure the validity of the empirical test results. We selected one province among the provinces that did not have carbon trading, which is highly consistent with Guangdong regarding the rest of the characteristics, and conducted the empirical test according to the synthetic control method. Suppose the empirical test results do not support the conclusion that the implementation of the carbon trading policy has significantly contributed to the upgrading and greening of the manufacturing structure in Guangdong. In that case, it means that the implementation of carbon trading caused the change in the manufacturing structure optimization in Guangdong and not by chance, i.e., the empirical test results are valid. The opposite is not true.
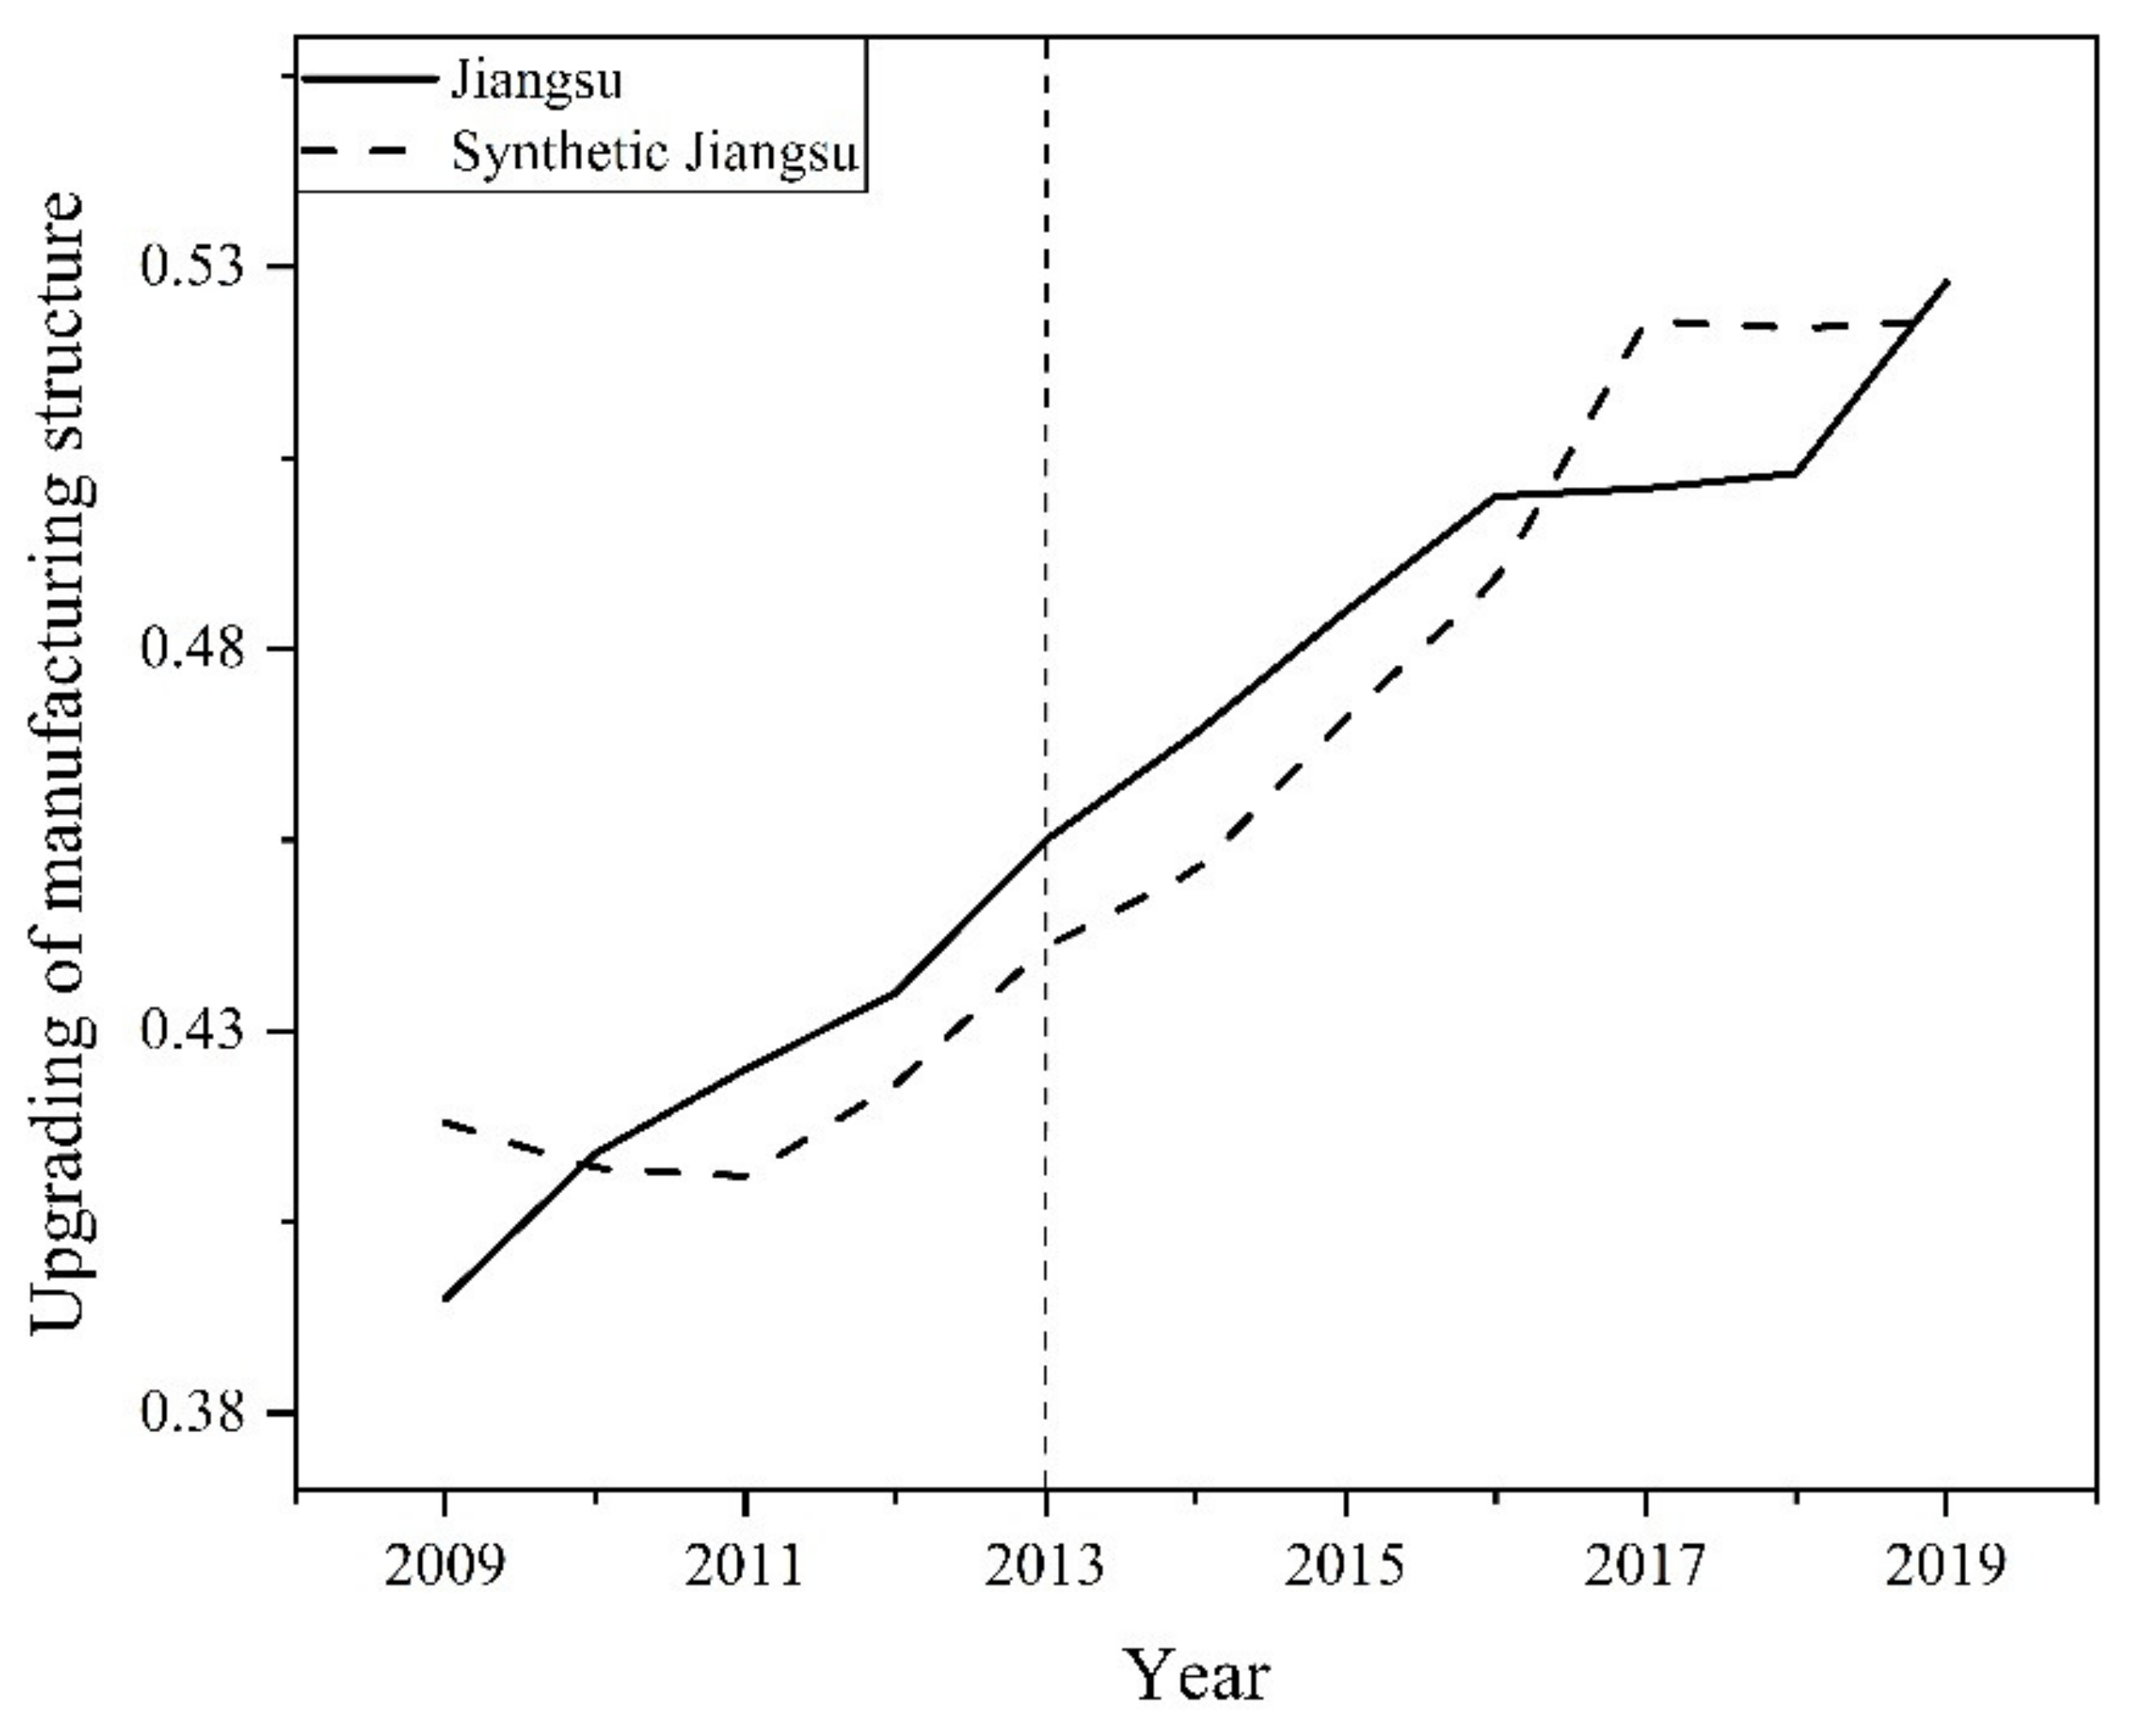
Due to the conclusion that the implementation of carbon emissions trading policy has a significant contribution to the upgrading manufacturing structure in Guangdong, we chose Jiangsu as an example, which had a significant positive contribution to the upgrade effect of the manufacturing structure in Guangdong. The most positive contributions to the upgrade effect of the manufacturing structure in Jiangsu were Zhejiang (0.56), Inner Mongolia (0.283), Shandong (0.094), and Liaoning (0.063). As shown in
Figure 5, the indicators of the upgrade effect of the manufacturing structure in Jiangsu and synthetic Jiangsu did not show regular changes before or after implementing the carbon emissions trading policy. The indicator of upgrading the manufacturing structure in Jiangsu was not always higher than that in synthetic Jiangsu. It indicates that the results of the empirical tests in the previous subsection are not coincidental, i.e., they are valid. Implementing a carbon emissions trading policy can effectively upgrade the manufacturing structure of Guangdong.
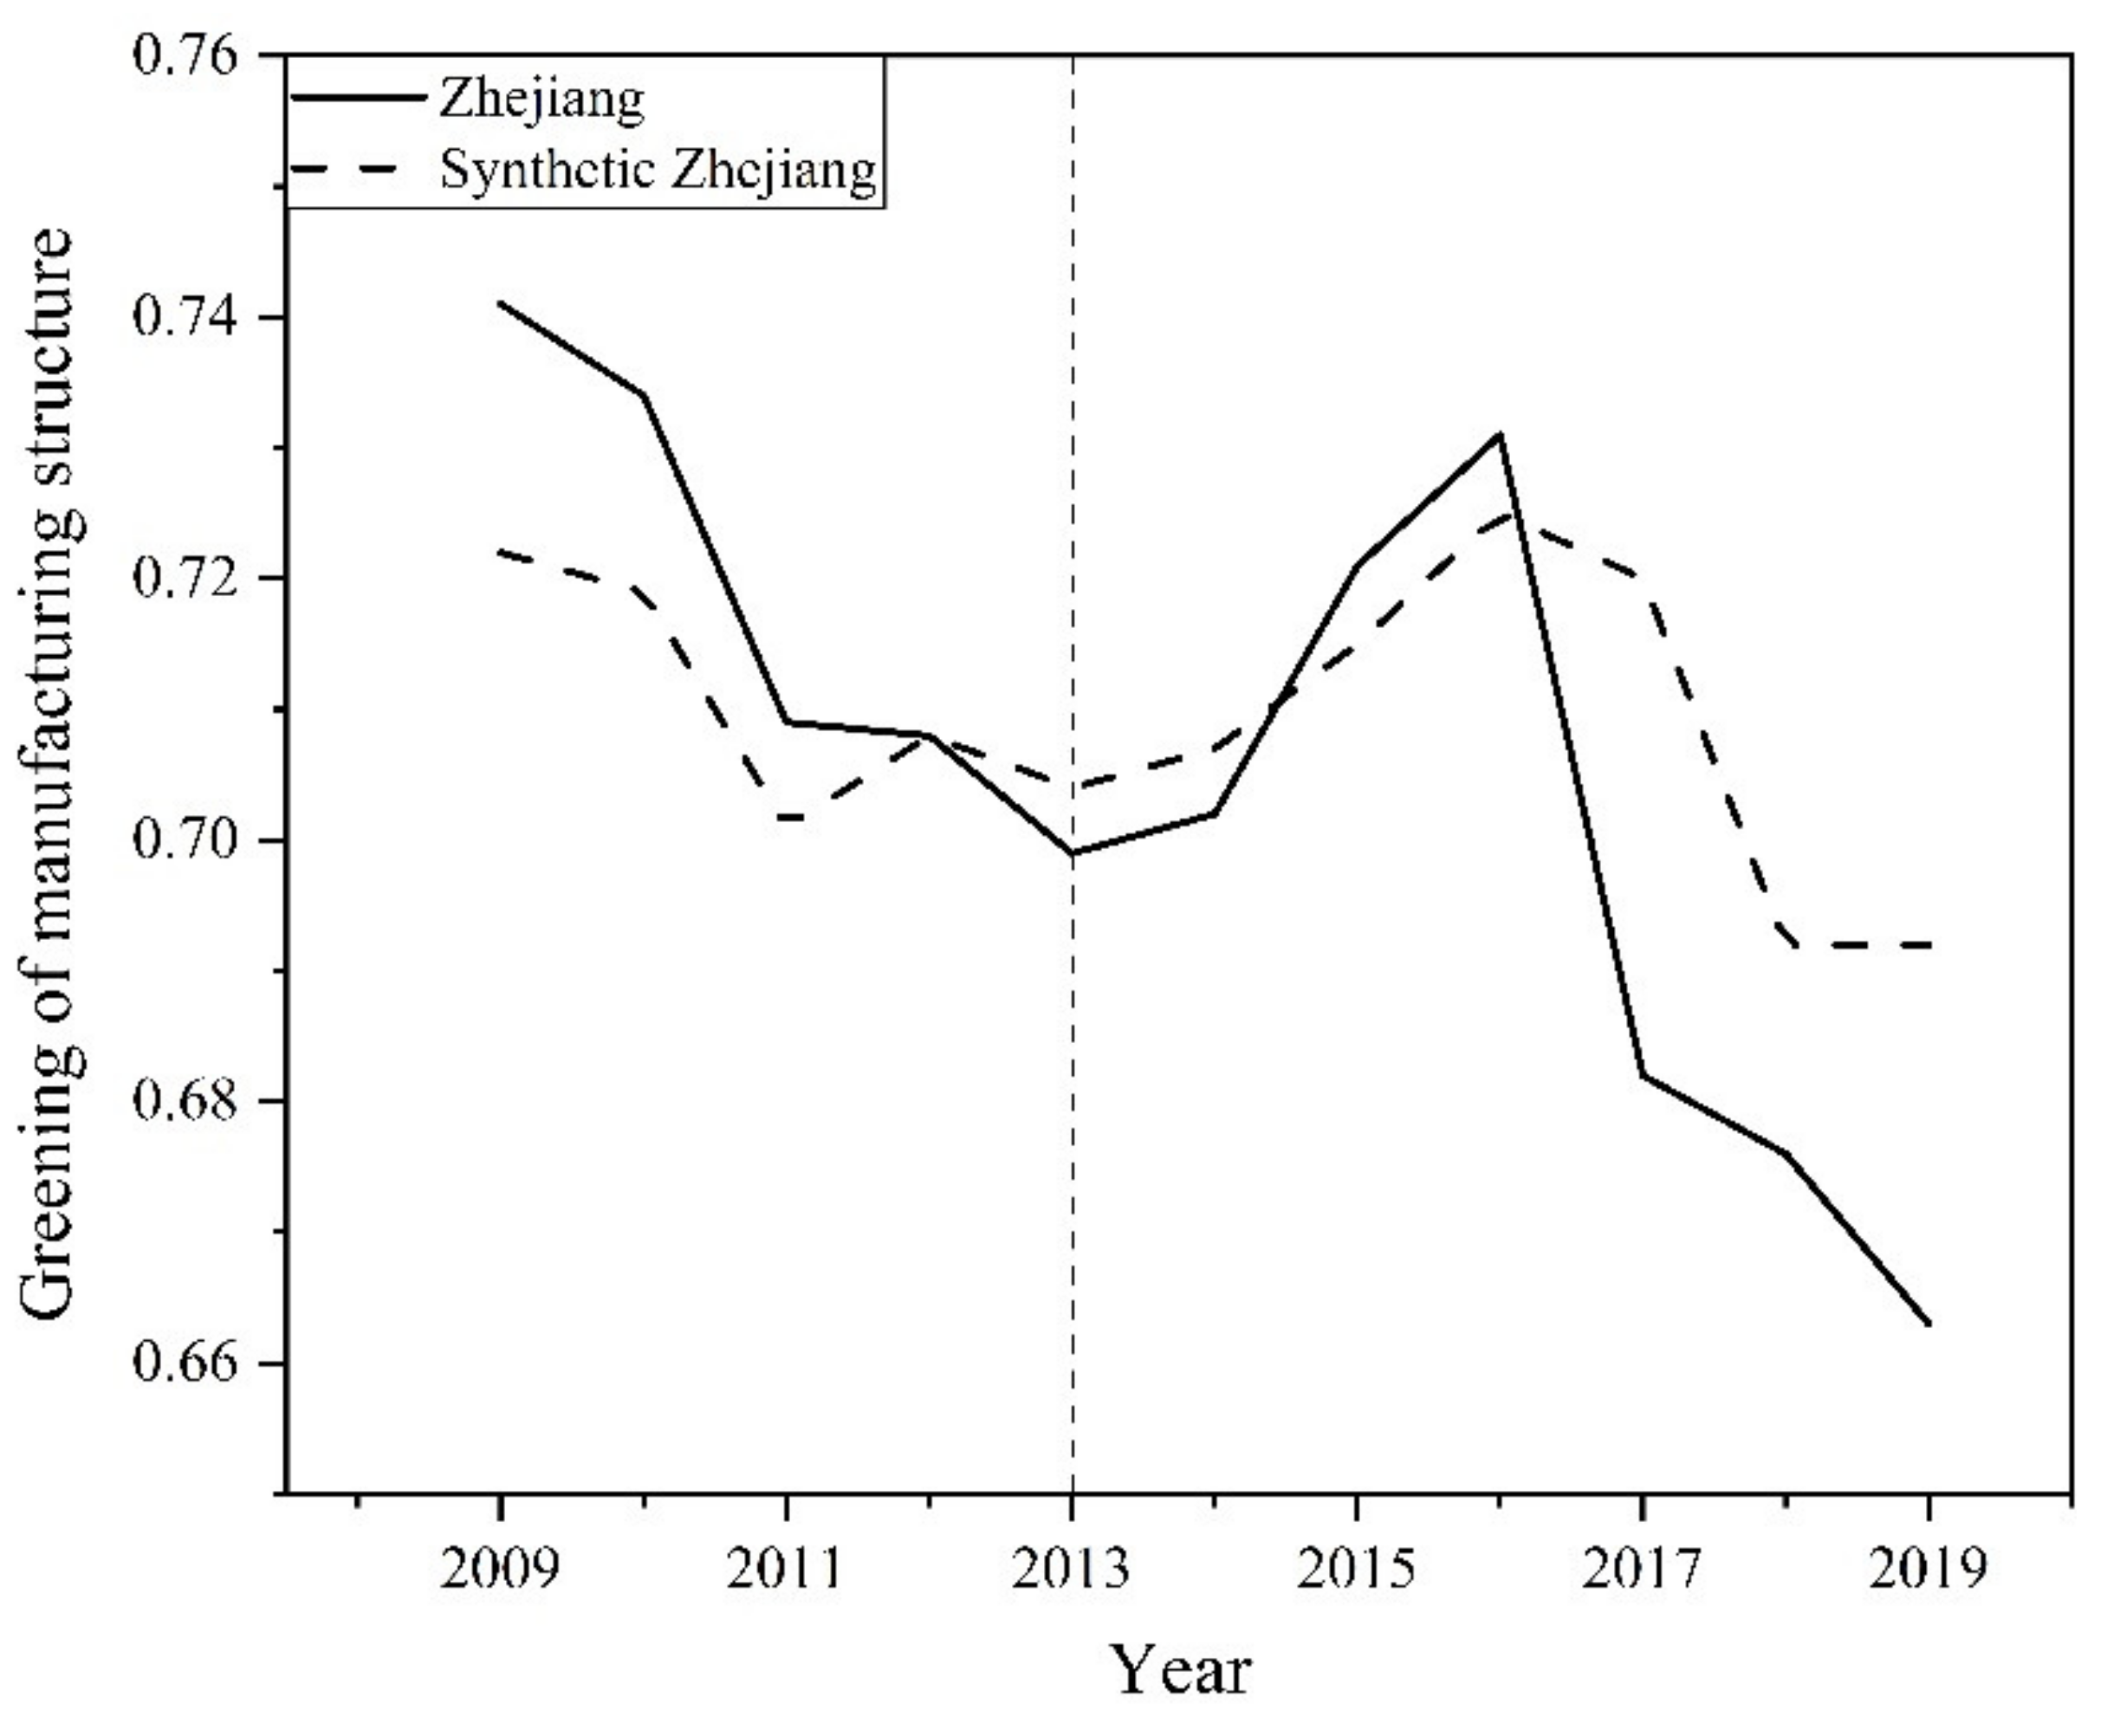
Due to the conclusion that the implementation of carbon emissions trading policy has a more significant contribution to the greening of manufacturing structure in Guangdong, we chose Zhejiang as an example, which had a significant positive contribution to the greening effect of manufacturing structure in Guangdong. Positive contributions to the optimization of manufacturing structure in Zhejiang were found for Shandong (0.456), Guangdong (0.365), and Jiangsu (0.179).
Figure 6 shows the fitted paths of Zhejiang and synthetic Zhejiang regarding the greening indicators in the manufacturing structure. The greening effect indicators of manufacturing structure did not show regular changes before or after implementing carbon emissions trading policy. Although the greening indicators of manufacturing structure in Zhejiang changed after 2016, the difference in change was smaller than that seen for Guangdong, so it can prove that the empirical test results in the previous subsection are valid. Carbon emissions trading does promote the greening of the manufacturing structure in Guangdong.
5. Impact Mechanism Analysis
5.1. Model Setting
The empirical evidence proves that implementing the carbon emissions trading policy had a more significant contribution to upgrading and greening of manufacturing structure in Guangdong. Then, we further analyzed the mechanism by which carbon emissions trading affected the manufacturing structure optimization in Guangdong. According to
Section 2 of this paper, carbon trading can affect the optimization of manufacturing structure by influencing technological innovation, foreign direct investment, international trade, and demand structure. Therefore, this section will further investigate whether carbon emissions trading affected the upgrading and greening of the manufacturing structure of Guangdong through these mechanisms using the mediating effect equation.
According to the analysis of the previous section, we selected the indicators of upgrading of the manufacturing structure (
) and greening of the manufacturing structure (
) as explanatory variables; the levels of technological innovation (
), foreign direct investment (
), international trade (
), and demand structure (
) as mediating variables; and the level of economic development (
), labor input level (
), and urbanization rate (
) as control variables to construct Equations (2)–(6).
where
is the indicator of the upgrading of the manufacturing structure, and
is the indicator of the greening of the manufacturing structure.
is the dummy variable of the carbon emissions trading pilot, which is assigned 1 or 0 according to whether Guangdong implements carbon emissions trading at time
.
is the control variable affecting the indicator of manufacturing structure optimization.
is the mediator variable of carbon emissions trading affecting manufacturing structure optimization.
5.2. Data Sources
The explanatory variables, such as upgrading of the manufacturing structure (
) and greening of the manufacturing structure (
), and the control variables, such as economic development level (
), labor input level (
), and urbanization rate (
), have the same selection basis, meaning, and data source as discussed in
Section 3.1: Data sources.
The data of mediating variables, such as technological innovation (), foreign direct investment (), international trade (), and demand structure (), were obtained from the statistical yearbook of Guangdong from 2009 to 2019. The connotation of each variable is as follows.
(1) Technological innovation (): The logarithm of the number of patent applications was used as an indicator of technological innovation. The increase in the level of technological innovation promotes the change of production scale, production efficiency, and production type of the original industry, and also leads to a leading industry with higher output value growth rate, so it blends with the traditional industry and promotes the interpenetration between industries, thus promoting the level of industrial development of manufacturing.
(2) Foreign direct investment (): The actual utilization of foreign direct investment was used as the indicator of foreign direct investment. Foreign direct investment in the form of capital, technology, and advanced management experience in the host country plays a role in promoting its industrial development and economic growth. Due to the competitive pressure from foreign advanced enterprises, local enterprises actively play the advantage of “learning by doing”, improve the efficiency of resource utilization, improve products and services, and try to catch up with advanced enterprises. In order not to be overtaken, advanced enterprises will also continue to carry out technological research and development, which can form a good technology spillover cycle and promote continuous optimization of manufacturing structure. The difference between INN and FDI is that INN is the autonomous technological innovation of firms inside the region or the country, while FDI is a factor of production from outside the region or the country.
(3) International trade (): Total import and export trade was used as the indicator of international trade. International trade affects the change of industrial structure mainly because international trade affects the elasticity of demand and supply of each domestic industrial factor, thus affecting the development of industrial sectors, changing the evolution of domestic manufacturing structure.
(4) Demand structure (): The ratio of social fixed asset investment to GDP was used as an indicator of demand structure. Final consumption is the last link of enterprise production. Changes in the size and type of final consumption of consumers directly lead to changes in the structure of consumer demand. Additionally, the change in consumer demand affects the adjustment of production behavior of enterprises, and the rechange of the production sector eventually affects the adjustment of manufacturing structure.
5.3. Endogeneity Test
The endogeneity problem arises mainly from omitted variables and two-way causal causes, among which two-way causality is more common in the study of economic problems. The explanatory variables in Equations (5) and (6) were upgrading of the manufacturing structure (
) and greening of the manufacturing structure (
). The main explanatory variables included four mediating variables: technological innovation, foreign direct investment, international trade, and demand structure. There is a specific two-way causal relationship between the two kinds of variables. According to the existing literature, on the one hand, the improvement of technological innovation, foreign direct investment, international trade, and demand structure will have a more obvious promotion effect on manufacturing structure optimization. On the other hand, the improvement of manufacturing structure optimization level will reverse promote technological level, foreign direct investment, international trade, and demand structure. Therefore, endogeneity problems may arise when using Equations (5) and (6) for estimation. The Davidson–McKinnon test shows a two-way causality between the explanatory and explanatory variables, and
Table 2 shows the results.
In order to reduce the estimation problem caused by endogeneity, the current solutions are mainly the natural experiment method, DID method, and instrumental variable method. In this paper, we adopted four mediating variables of technological innovation, foreign direct investment, international trade, and demand structure lagged by one period as instrumental variables to weaken the endogeneity problem of the empirical test and reduce the error level of the estimation results.
Table 3 shows the econometric results of Equations (2) and (3). The results show that carbon emissions trading can significantly promote upgrading of the manufacturing structure (
) and greening of the manufacturing structure (
). The results are consistent with the previous findings of the synthetic control method. The original purpose of the implementation of carbon emissions trading is to not only encourage enterprises to complete the task of carbon emissions reduction effectively but also to carry out technological innovation and develop green products actively, and then complete the transformation and development processes and promote the optimization and adjustment of the regional manufacturing structure. The empirical test results prove that carbon emissions trading has a significant effect on the manufacturing structure, giving China’s regions confidence to actively explore the carbon emissions trading market.
Table 4 shows the results of the model regressions of Equations (4)–(6) with technological innovation (
) as the mediating variable. The level of technological innovation in column (1) of the table was the explanatory variable. The results of the dummy variables are positive, indicating that the establishment of the carbon emissions trading pilot can significantly promote Guangdong enterprises to improve their technological innovation level. The establishment of the carbon emissions trading pilot has led Guangdong enterprises to adapt to the changing market due to the implementation of the carbon trading policy by improving their technology, production equipment, or production methods to meet the carbon emissions reduction standards. The green development concept of enterprises and the technological innovation are consistent with the purpose of the carbon emissions trading policy, which indicates that the carbon emissions trading pilot project has achieved positive results. Columns (2) and (3) show the results of upgrading of the manufacturing structure (
) and greening of the manufacturing structure (
) simultaneously influenced by carbon emissions trading and the level of technological innovation. The results show that the coefficient estimates of the level of technological innovation are optimistic, indicating that technological innovation promoted the optimization of the manufacturing structure in Guangdong after implementing the carbon emissions trading policy. In contrast, the estimated values of the dummy variables of Equations (5) and (6) were all lower compared with those of Equations (2) and (3). The data change can support the hypothesis that technological innovation is one of the mechanisms of optimizing the manufacturing structure promoted by carbon emissions trading. The result reveals that in the pilot regions with a carbon emissions trading policy, the government should actively encourage relevant enterprises to carry out technological innovation and promote technological innovation in promoting manufacturing structure optimization.
Table 5 shows the model regression results of Equations (4)–(6) with foreign direct investment (
) as the mediating variable. Column (1) of
Table 5 had foreign direct investment as the explanatory variable. The estimated value of the dummy variable was significantly positive, indicating that the establishment of the pilot carbon emissions trading has expanded the scale of foreign direct investment in Guangdong. Columns (2) and (3) of
Table 5 show that upgrading of manufacturing structure (
) and greening of manufacturing structure (
) was influenced by both the establishment of the carbon emissions trading pilot and foreign direct investment. The results show that the estimated values of the dummy variables in Equations (5) and (6) were 2.148 and 1.253, which are lower than the estimated values of the dummy variables in Equations (2) and (3). This indicates that the mechanism of carbon emissions trading operates through promoting the optimization of manufacturing structure by influencing foreign direct investment. However, the effect of this promotion was smaller than the effect brought about by technological innovation. Although foreign enterprises have brought advanced management experience and production technology to Guangdong, they primarily concentrate on the processing manufacturing industry. They had limited positive effects on the industrial structure of Guangdong.
Table 6 shows the model regression results of Equations (4)–(6) with international trade as the mediating variable. Column (1) of
Table 6 had international trade as the explanatory variable. The estimated value of the dummy variable was negative, indicating that the establishment of the carbon emissions trading pilot reduced the level of imports and exports. Columns (2) and (3) of
Table 6 show the statistical results, which indicate that the upgrading and greening manufacturing structure was affected by both the establishment of the carbon emissions trading pilot and international trade. The estimated value of the coefficient of the dummy variable in the model was positive, but the coefficient of international trade was not significant, which does not support the hypothesis that carbon emissions trading promotes the optimization of the manufacturing structure in Guangdong through influencing the structure of international trade.
Table 7 shows the model regression results for Equations (4)–(6) with the relationship between the demand structure as the mediating variable. The demand structure relationship in column (1) of
Table 7 was the explanatory variable. The estimated coefficients of the dummy variables were negative, indicating that the establishment of the carbon emissions trading pilot reduced the investment demand. The establishment of the carbon trading pilot started to promote the development of clean industries while controlling the high-pollution, high-energy consumption industries. The negative investment demand of the latter was greater than the positive investment demand of the former and overall had a lesser impact on the investment demand. Columns (2) and (3) of
Table 7 show the statistical results, which indicate that both the carbon emissions trading pilot and the investment demand simultaneously influenced the upgrade and green industrial structure. The coefficient estimates of the dummy variables in Equations (5) and (6) were 1.843 and 1.151, which are lower than the coefficient estimates of the dummy variables in Equations (2) and (3). In contrast, the coefficient estimates of the investment demand were pessimistic, but the coefficient estimates were not significant. This indicates that the establishment of a carbon emissions trading pilot in Guangdong negatively impacted enhancing investment demand. It thus cannot support the hypothesis that carbon emissions trading promotes the optimization of the manufacturing structure in Guangdong by affecting the demand structure.
Table 8 shows the regression results of all four mediating variables of technology innovation, foreign direct investment, international trade, and demand structure in Equations (5) and (6). The estimated coefficients of the dummy crossover variables were all positive, indicating that carbon emissions trading had a significant positive contribution to the upgrading and greening of the manufacturing structure in Guangdong. The estimated coefficients of the technological innovation level and foreign direct investment were positive, indicating that carbon emissions trading can promote the upgrading and greening of the manufacturing structure in Guangdong through these two channels. The estimated coefficients of demand structure were significantly negative, and the estimated coefficients of international trade were not significant, indicating that carbon trading causes investment demand to decrease at present. The empirical evidence does not support the suggestion that carbon trading can promote manufacturing structure optimization in Guangdong through international trade.
6. Conclusions and Discussion
This paper studied a carbon emissions trading policy experiment in Guangdong starting in 2013. We used a synthetic control method. Constructing a “synthetic Guangdong”, which reflects the manufacturing structure of Guangdong before the policy experiment, allowed us to conduct a counterfactual analysis. The results show that, in the short run, the pilot carbon trading policy implemented in 2013 significantly promoted the upgrading and greening of the manufacturing structure of Guangdong. Carbon trading can significantly affect the optimization of the manufacturing structure of Guangdong by improving both the technological innovation level of enterprises and foreign direct investment.
In contrast to some of the existing literature which studies the emissions reduction effect of carbon trading policy, or a few studies that examine the effect of carbon trading on the optimization of the industrial structure as measured by only a single indicator, this paper investigated the effect of carbon trading policy on the upgrading, rationalization, and greening of manufacturing structure. Not only does this paper provide empirical evidence to support the paper on the synthetic control method in assessing the effect of carbon trading policy, but this paper also provides an empirical reference for the promotion of a carbon emissions trading policy within the whole industry. This paper provides empirical evidence for the possibility of achieving an effective balance between manufacturing development and environmental protection.
A caveat of this paper is that the impact of the carbon emissions trading policy presented here may at best be generalized to regions with a similar structure to Guangdong, which has a tertiary-industry-dominated economy with a rising share of tertiary industry, and not to other regions where the share of secondary industries is too high. This is due to the limitation of the synthetic control method, since the estimated policy impact is specific to each treated unit. Fortunately, we have seen similar findings in other studies examining provinces such as Chongqing and Hubei. Another significant limitation is that due to the availability of carbon emission data in some provinces, the period of research could only extend as far back as 2009. The carbon trading pilot has only been implemented since 2013, and the epidemic has had a large impact on the data from 2020 and 2021. Therefore, the period studied in this paper only includes the years 2009–2019. It would be beneficial if data for a greater number of years could be used for future research in order to depict a more precise pattern of the long-term effects.


