
Investigate Jobs–Housing Spatial Relationship with Individual-Based Mobility Big Data of Public Housing Tenants: A Case Study in Chongqing, China


Abstract
:1. Introduction
2. Methodology
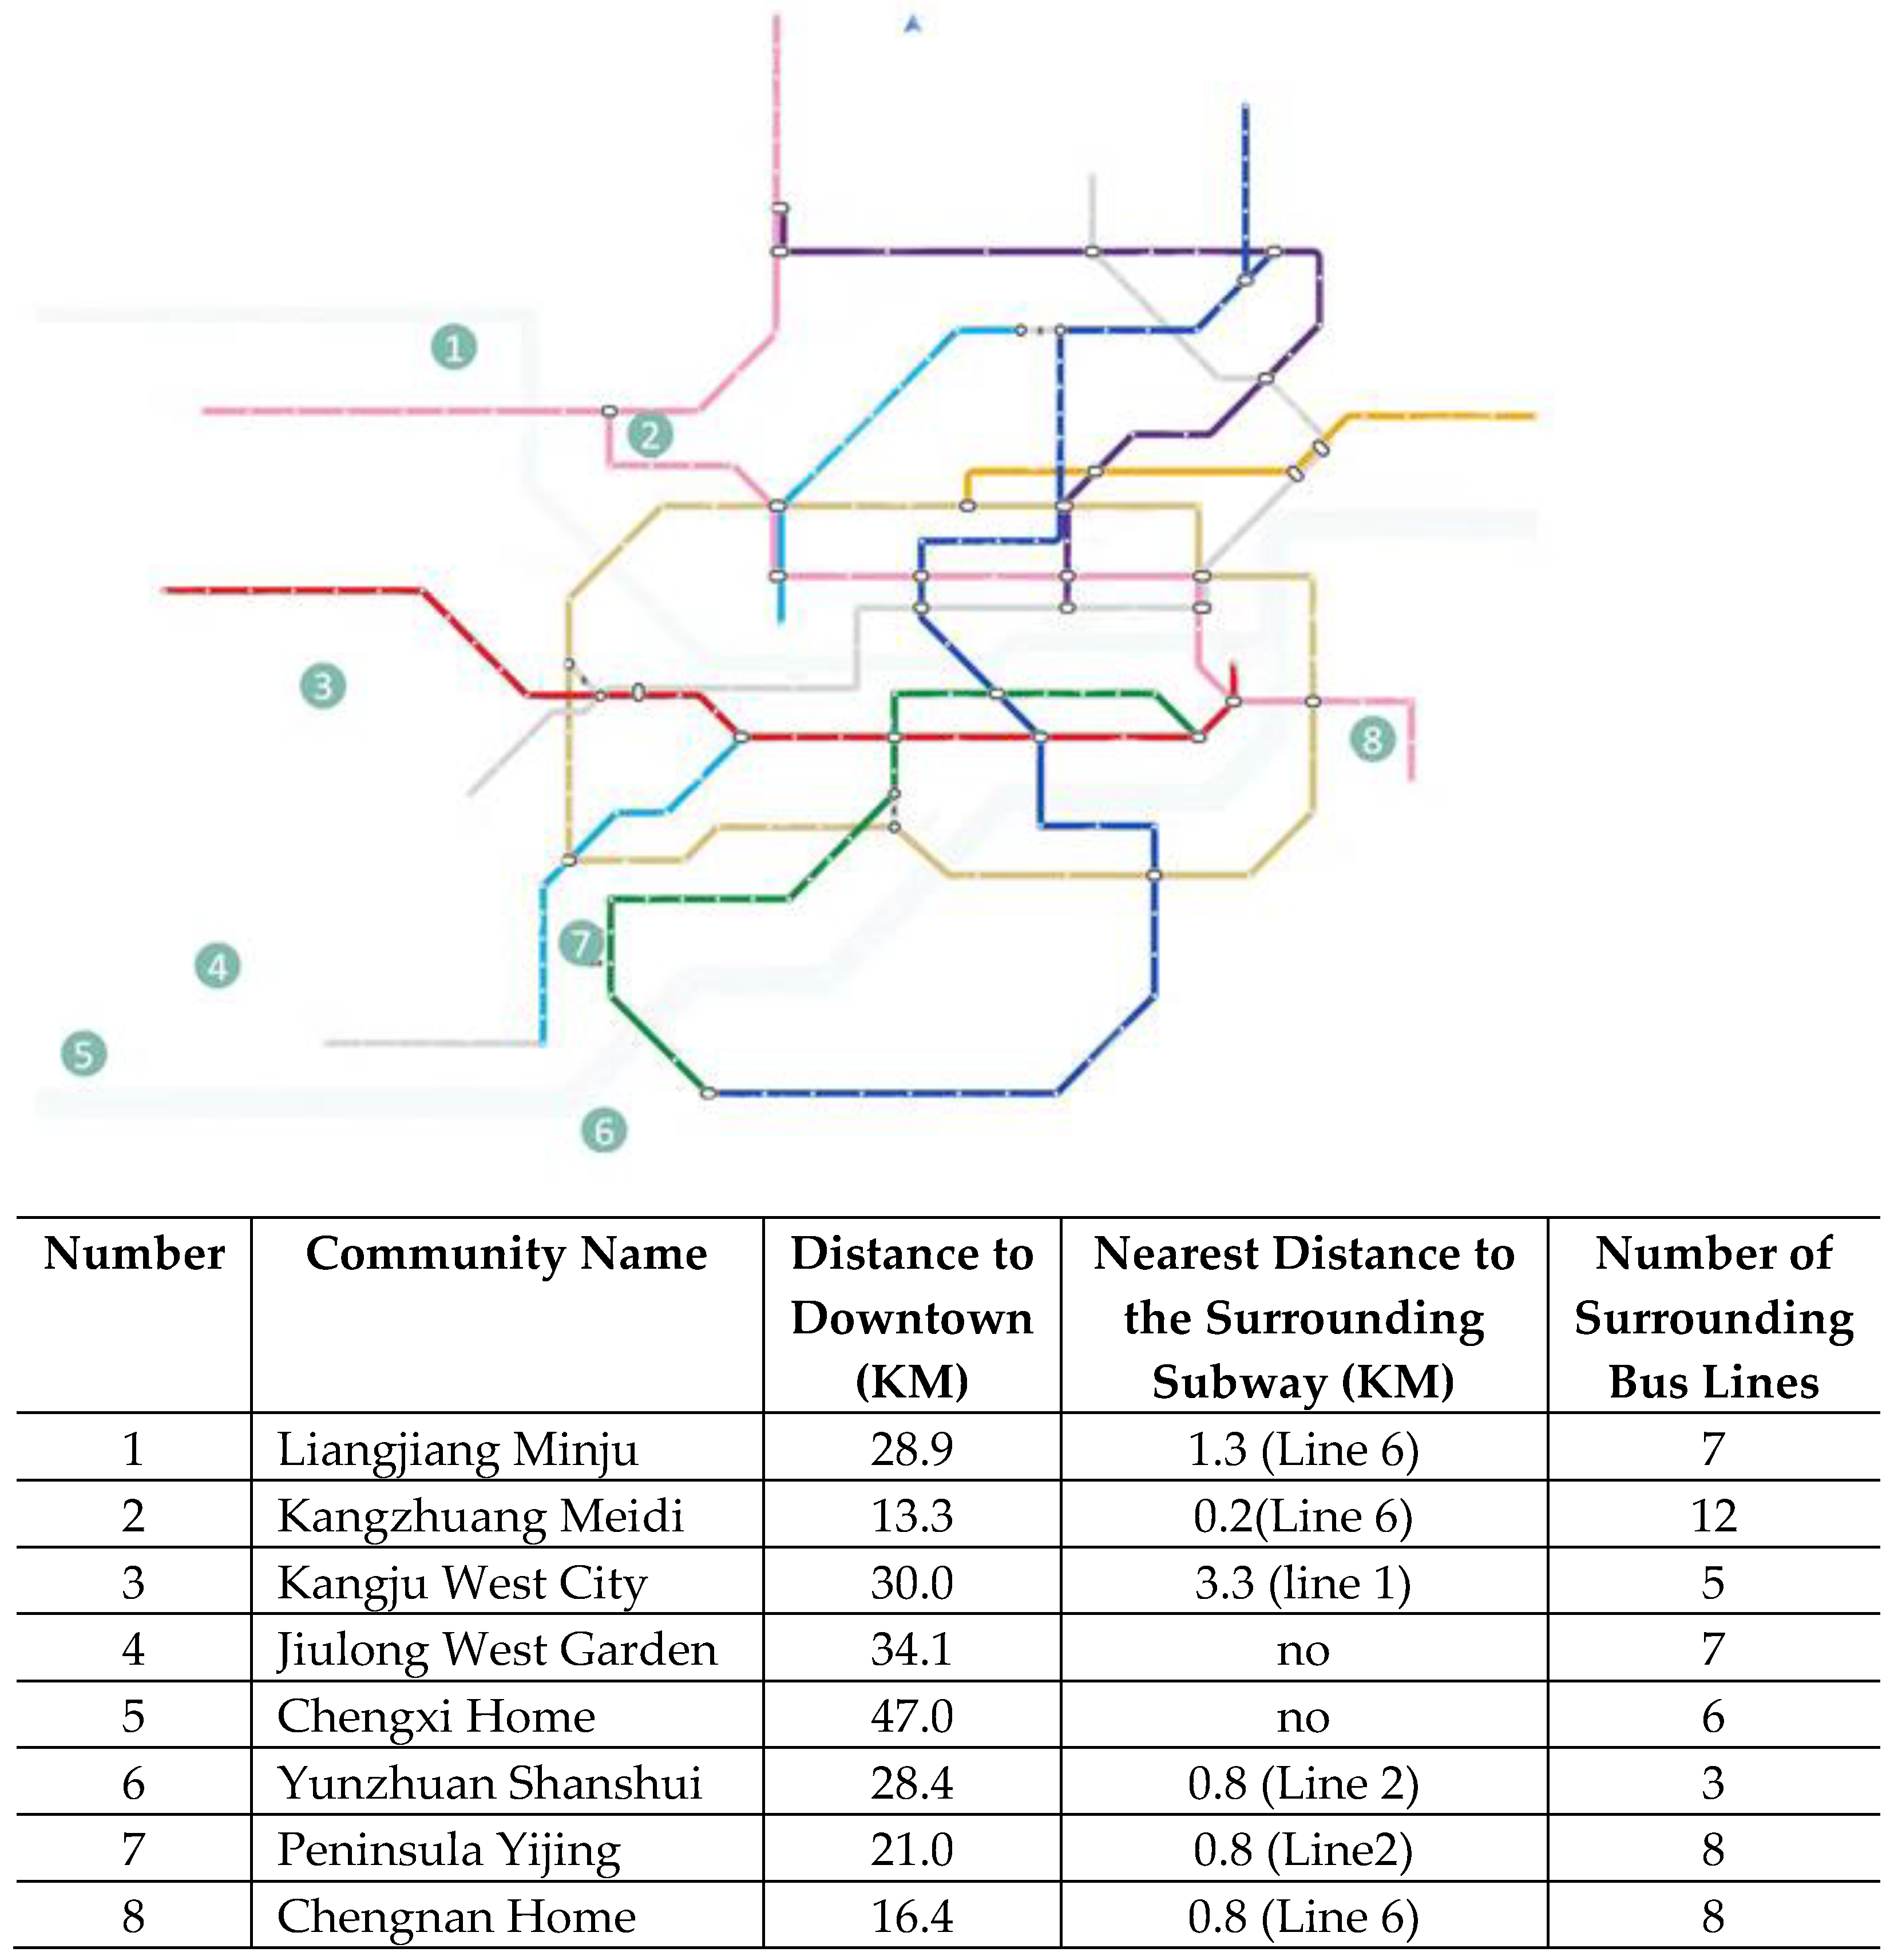
2.1. Study Area
2.2. Research Method
2.2.1. Data
2.2.2. Data Analysis
- 1.
- Static description indicators
- 2.
- Dynamic correlation indicators
3. Data Analysis
3.1. The Static Description Characteristics
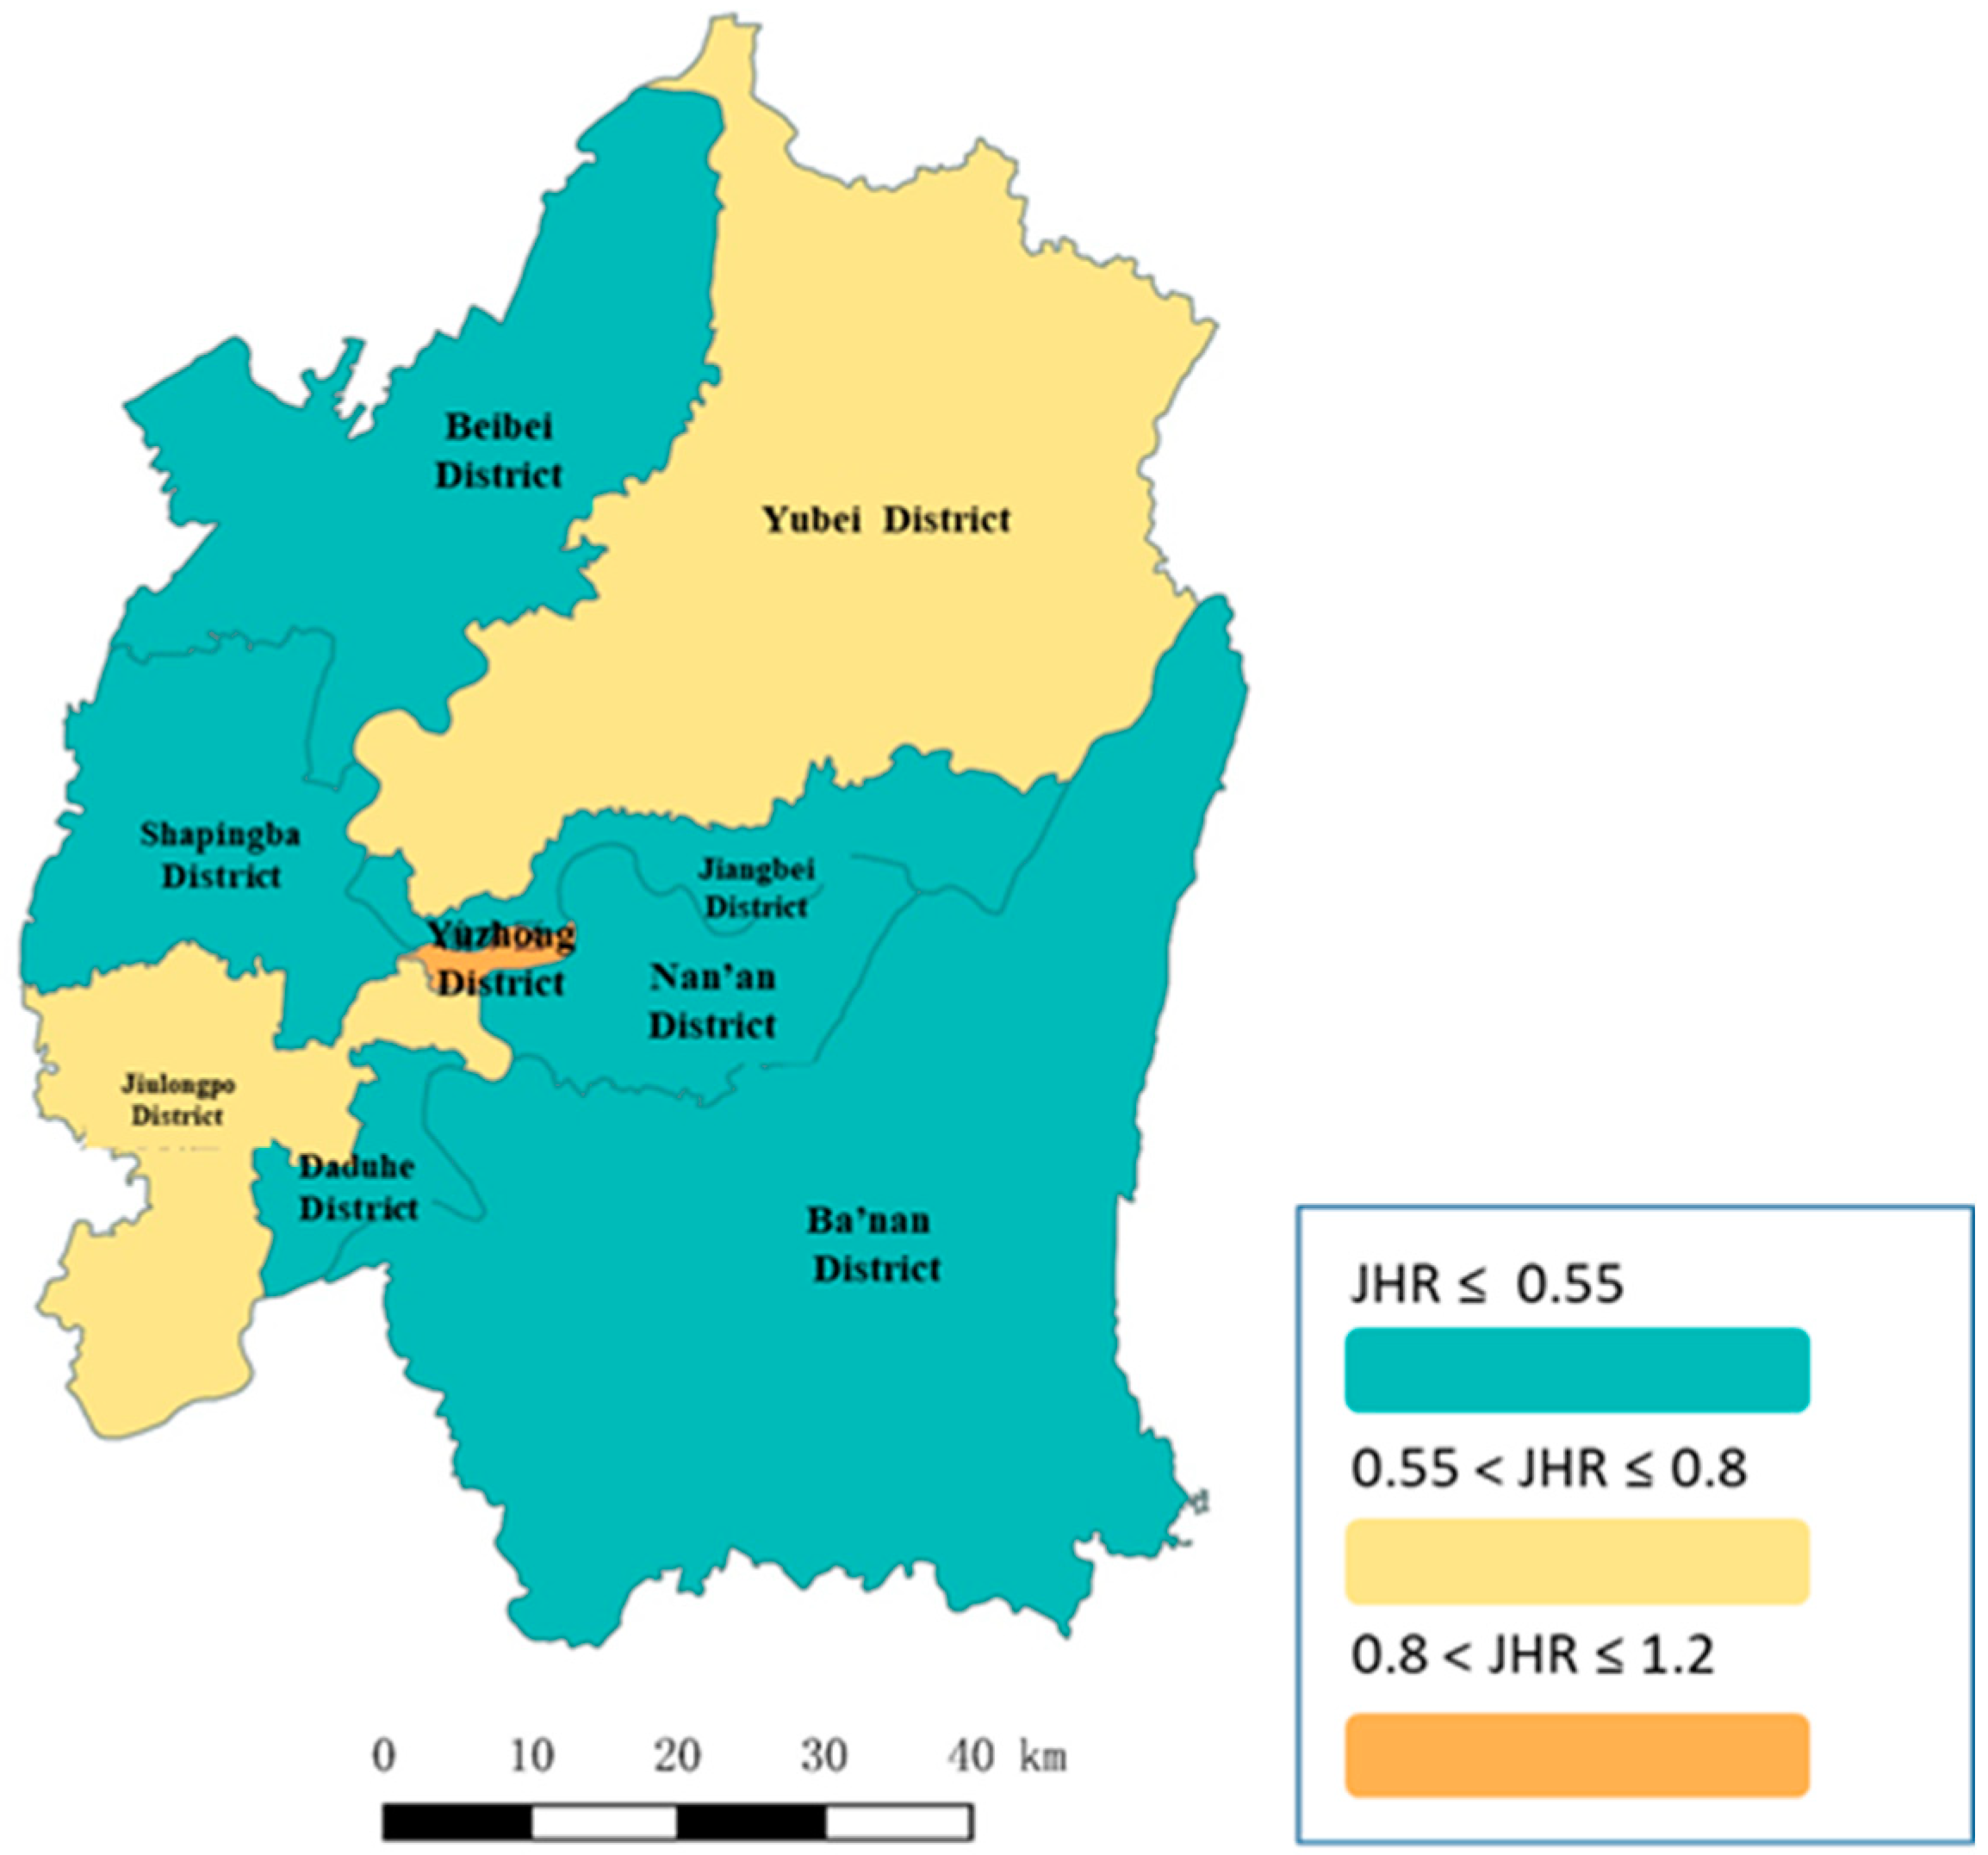
3.1.1. JHR
3.1.2. JHB
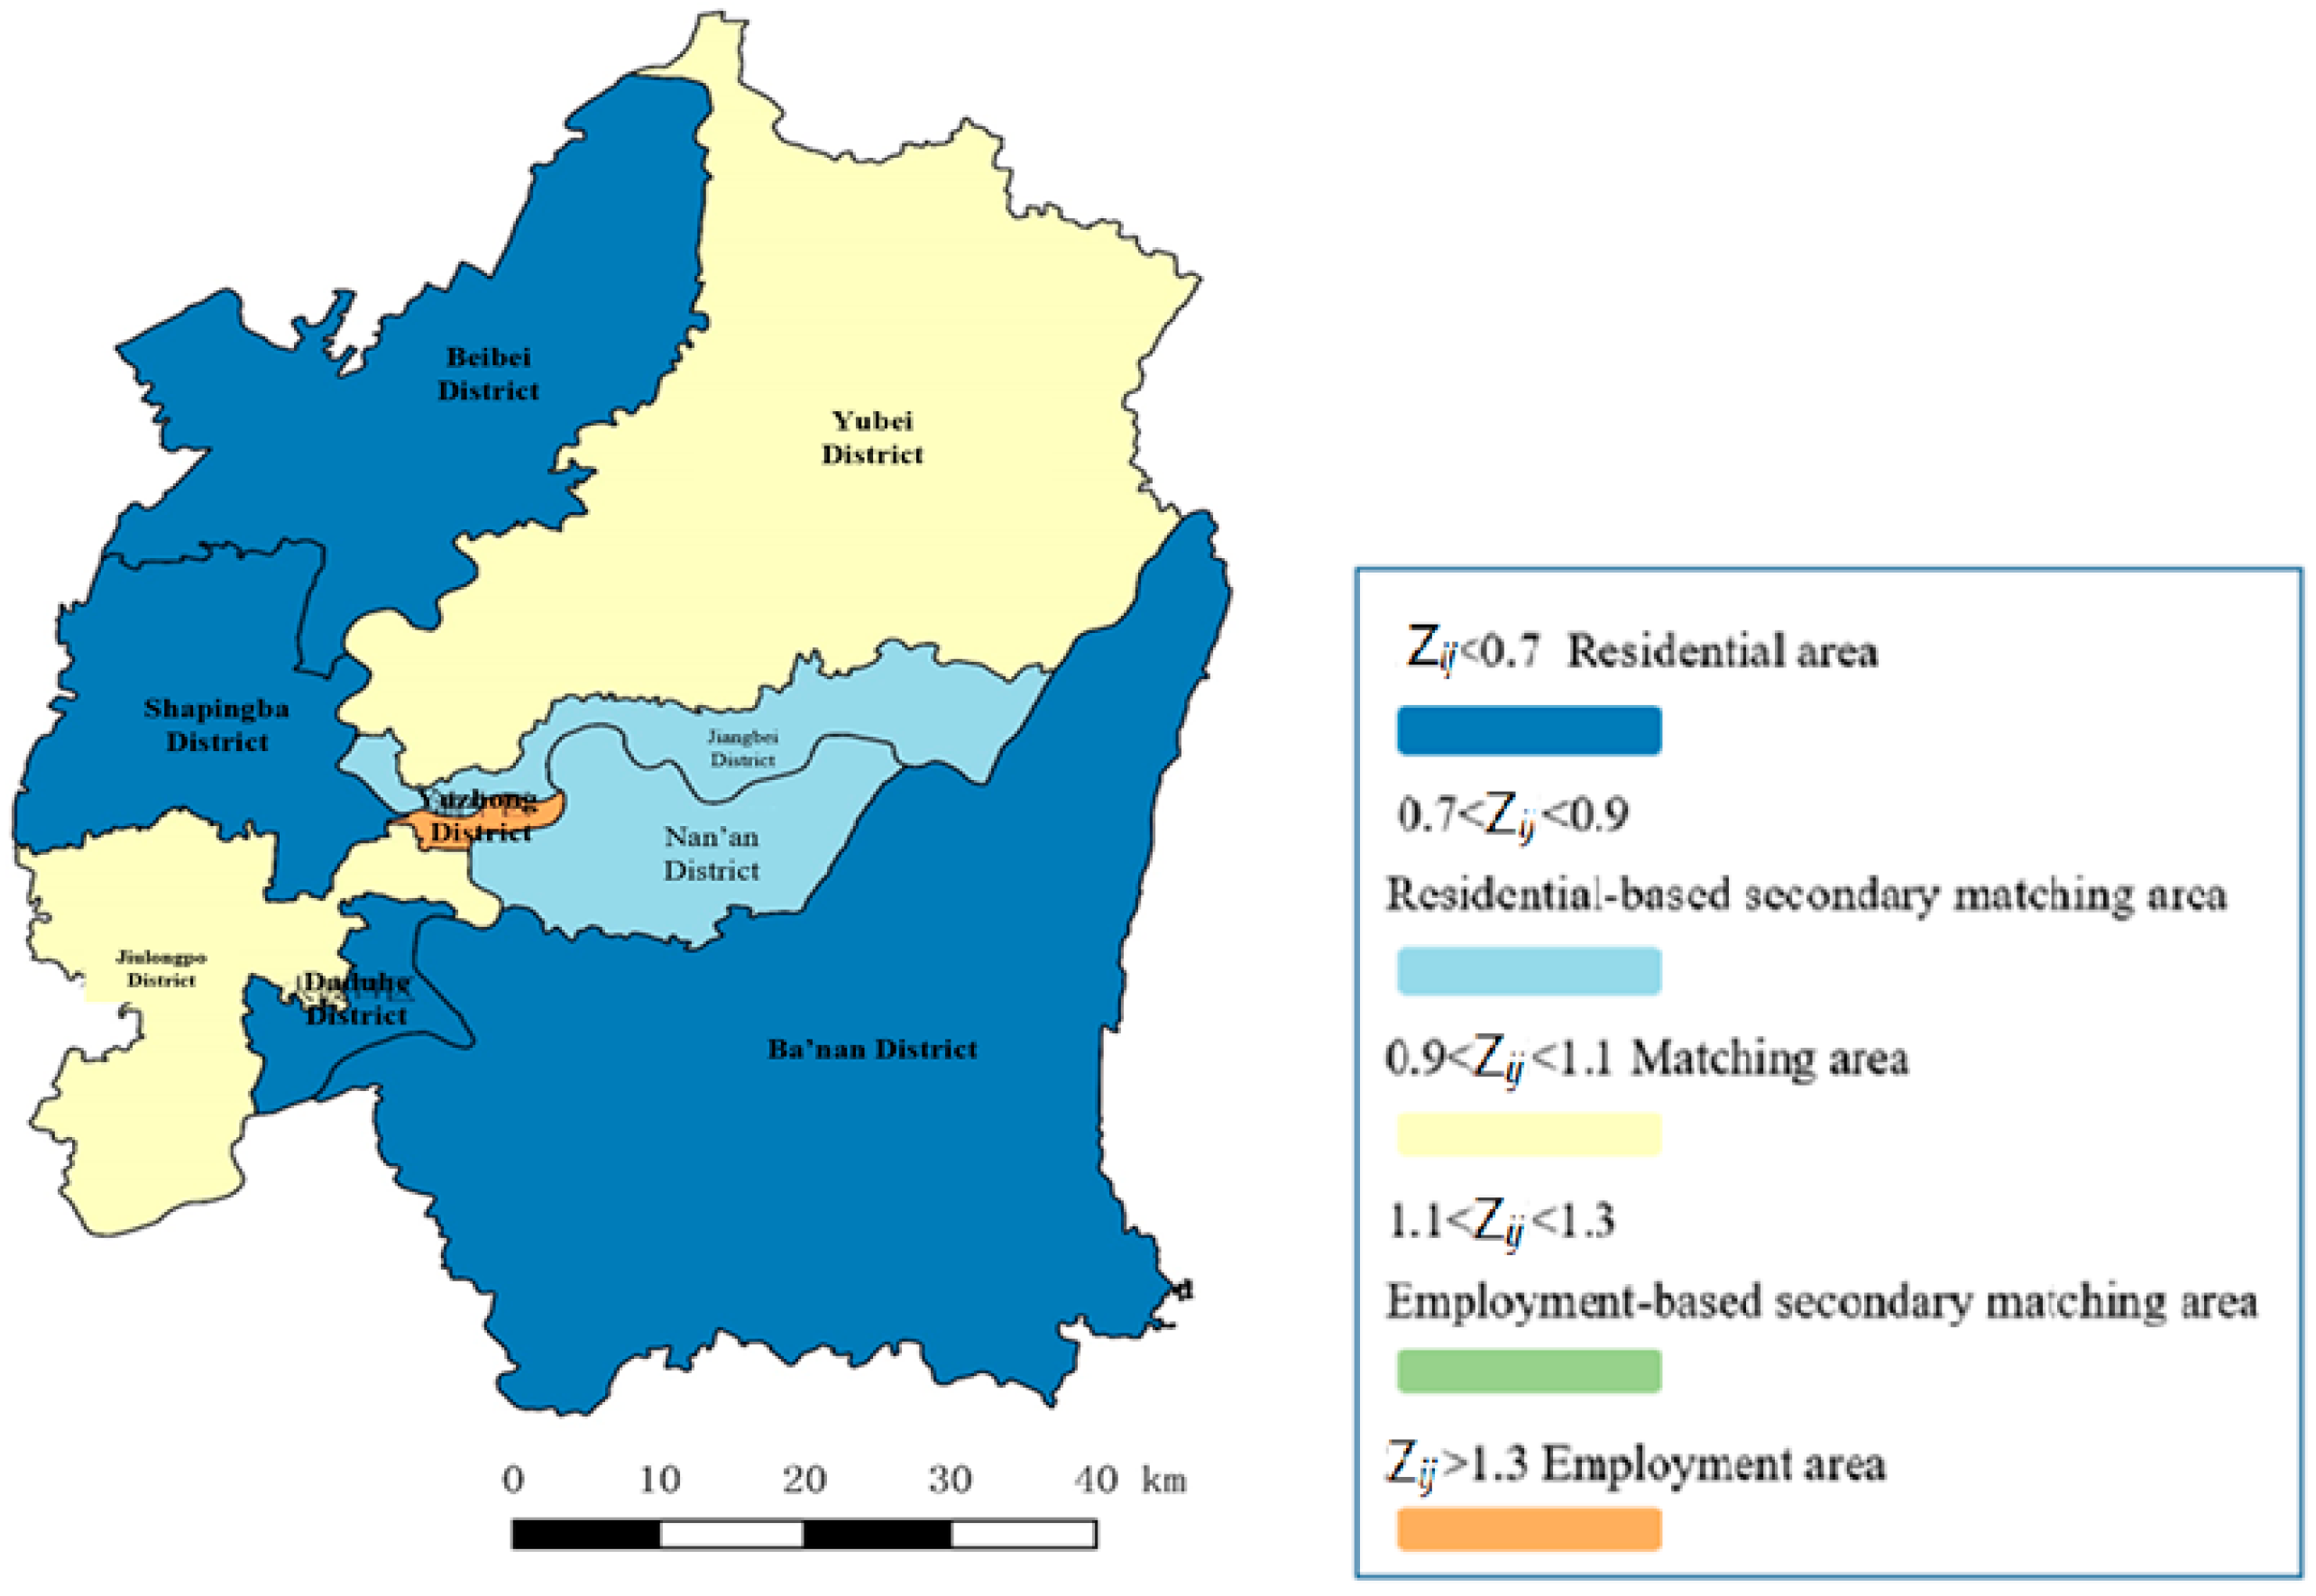
3.2. Dynamic Correlation Characteristics
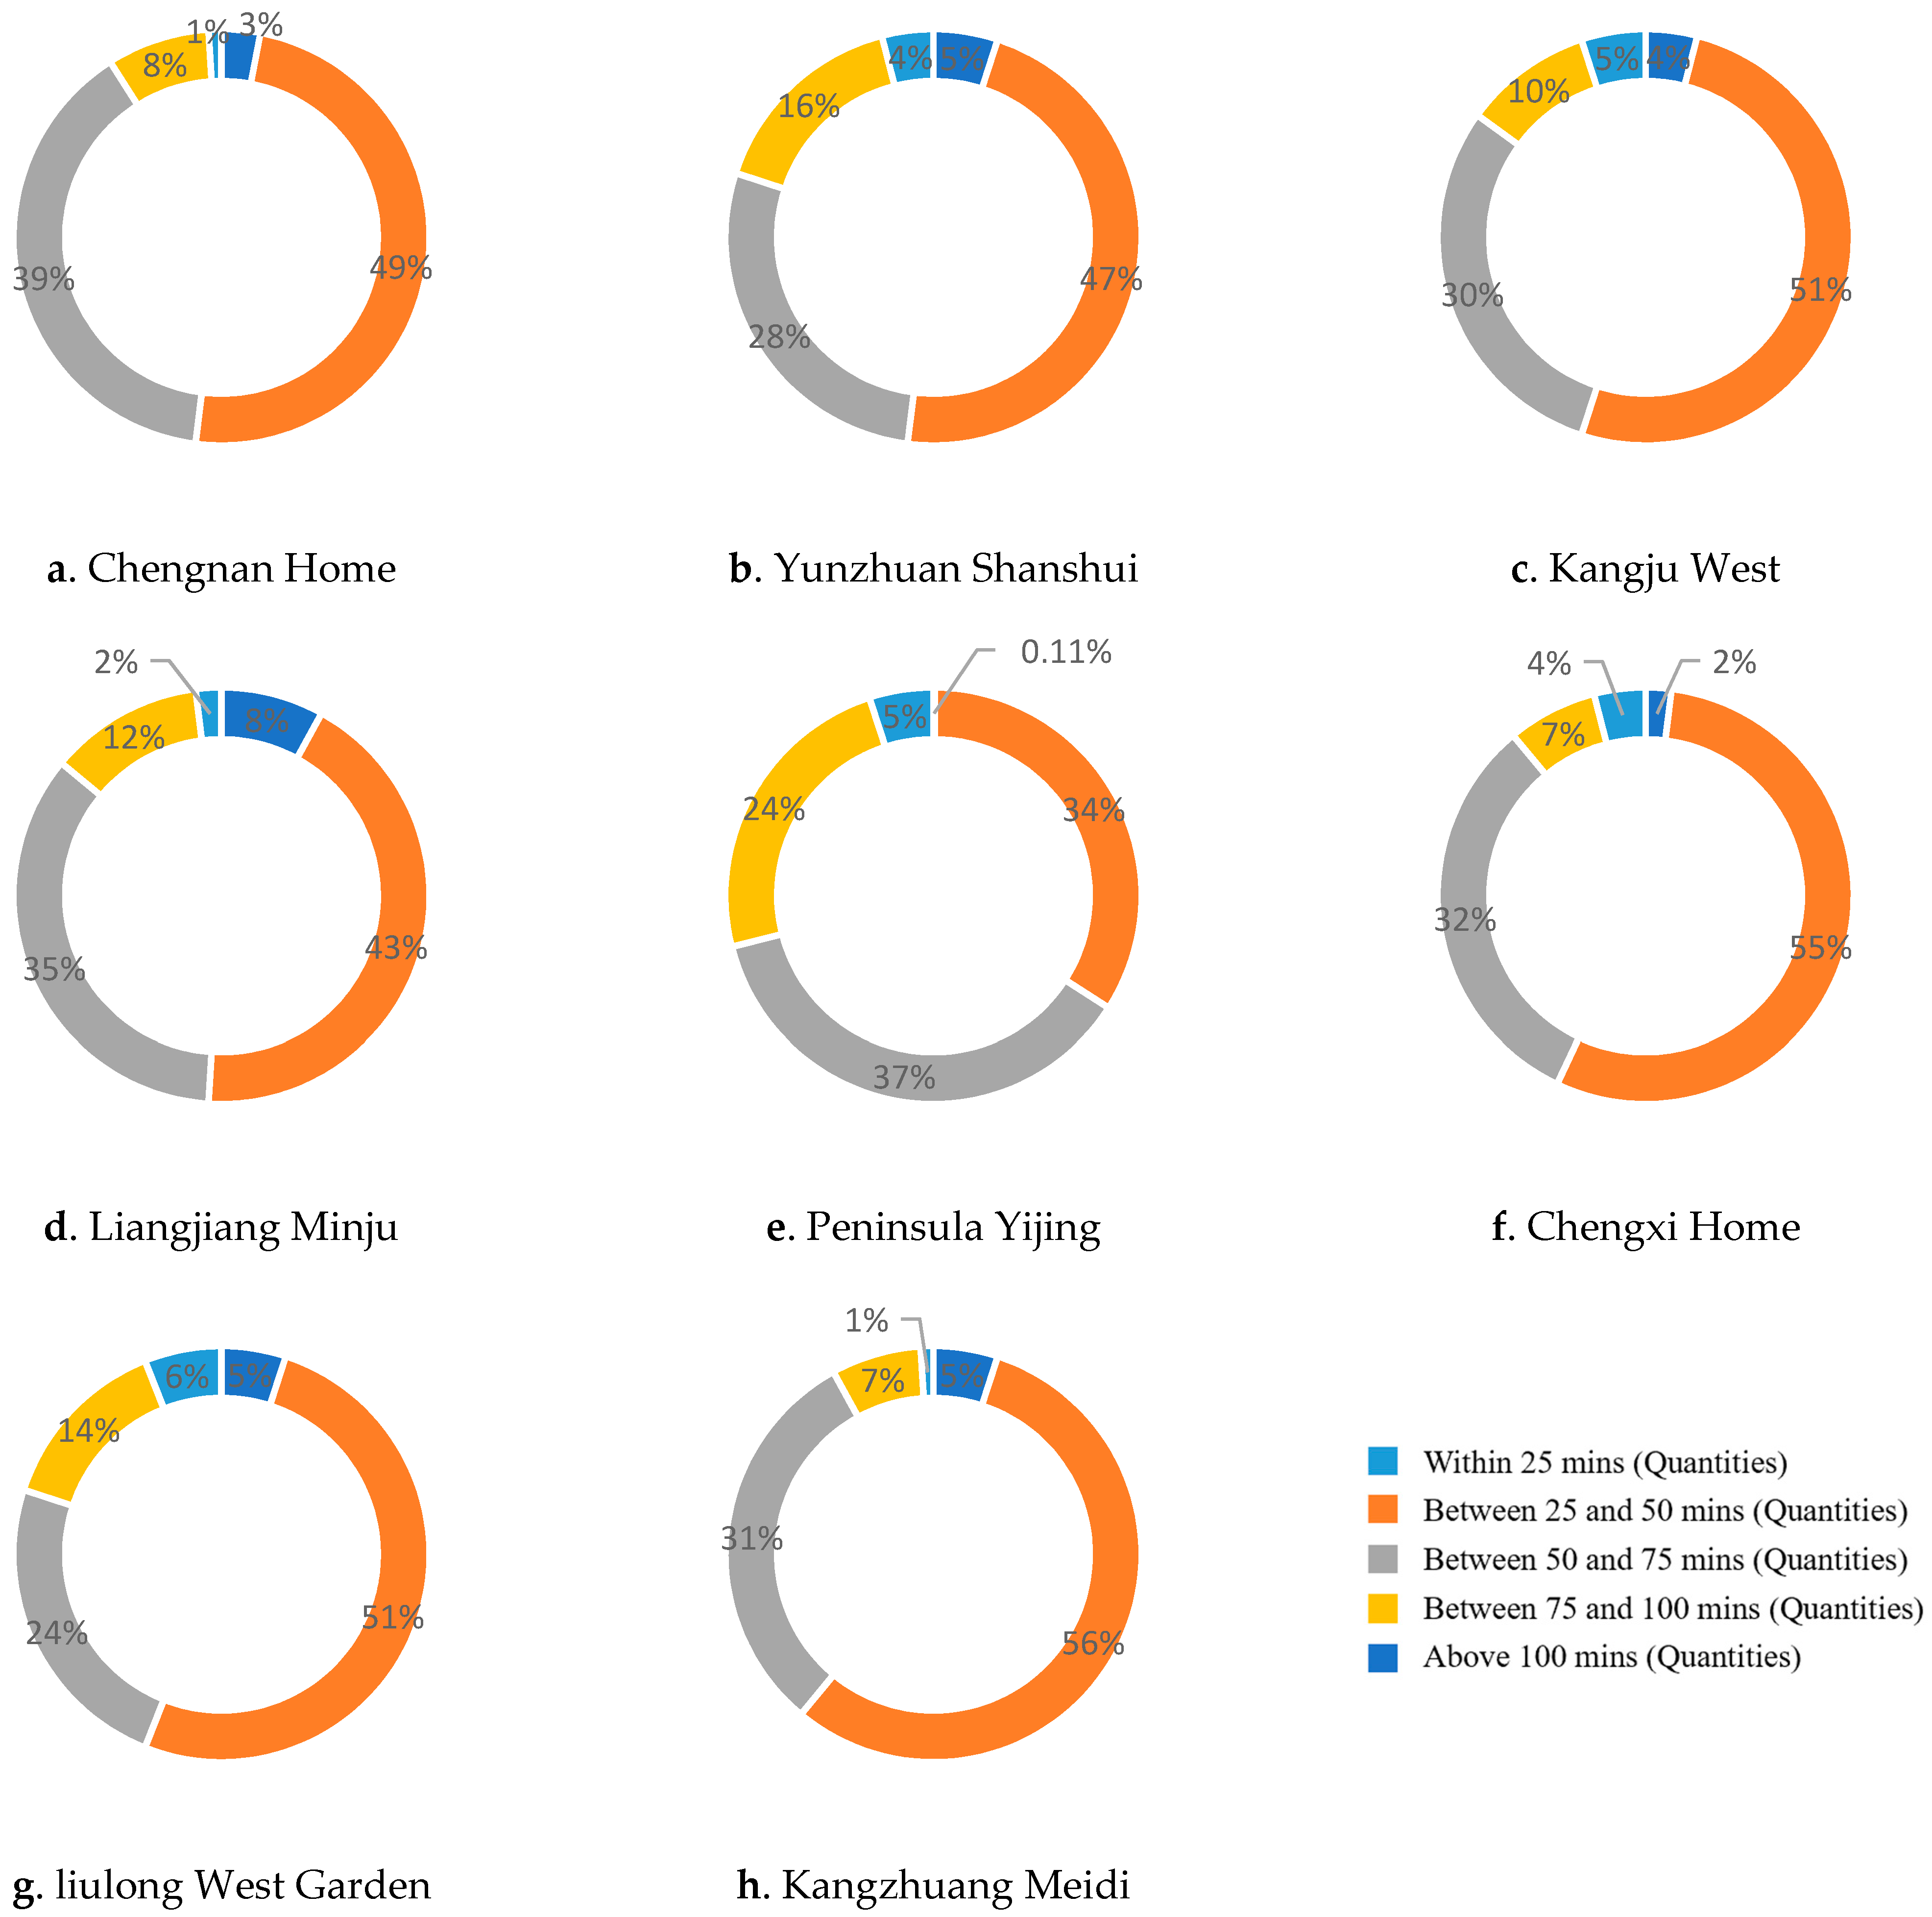
3.2.1. Commuting Time and Commuting Distance
3.2.2. Commuting Center
4. Discussion
5. Conclusions
Author Contributions
Funding
Conflicts of Interest
References
- Mumford, L. The Urban Prospect; Harcourt, Brace and World: New York, NY, USA, 1968. [Google Scholar]
- Kain, J.F. Housing segregation, Negro employment, and metropolitan decentralization. Q. J. Econ. 1968, 82, 175–197. [Google Scholar] [CrossRef]
- Meng, X.; Wu, J.; Shen, F. The study review of urban jobs-housing balance. Urban Stud. 2009, 16, 23–28. [Google Scholar]
- Kanaroglou, P.S.; Higgins, C.D.; Chowdhury, T.A. Excess commuting: A critical review and comparative analysis of concepts, indices, and policy implications. J. Transp. Geogr. 2015, 44, 13–23. [Google Scholar] [CrossRef]
- Bai, Y.; Zhao, P. A review of concept and methodology of jobs-housing balance. J. Northwest Norm. Univ. 2018, 54, 89–98. [Google Scholar]
- Leng, B.; Yi, Z.; Cao, C.; Tang, X.; Zhang, J. Recognizing the jobs-housing relationship in Chongqing main city and the transportation reflection based on mobile phone data. In Proceedings of the Annual National Planning Conference, Shengyang, China, 23–26 September 2016. [Google Scholar]
- Zhang, P.; Zhou, J.P.; Zhang, T.R. Quantifying and visualizing jobs-housing balance with big data: A case study of Shanghai. Cities 2017, 66, 1022. [Google Scholar] [CrossRef] [Green Version]
- Cheng, P.; Tang, Z. A study on the spatial match of jobs-housing balance and its change over time in the central city of Shanghai. Urban Plan. Forum 2017, 3, 62–69. [Google Scholar]
- Wang, E.R.; Song, J.P.; Xu, T. From “spatial bond” to “spatial mismatch”: An assessment of changing jobs-housing relationship in Beijing. Habitat Int. 2011, 35, 398–409. [Google Scholar] [CrossRef]
- Hu, J.; Zhu, L.; Luo, J. Characteristics and evaluation of jobs-housing space of Wuhan. Hum. Geogr. 2014, 29, 76–82. [Google Scholar]
- Liu, W.; Zhan, Q.; Huang, Z.; Zhou, J.; Zhou, H. Research the jobs-housing matching characteristics and commuting characteristics of Wuhan metropolitan area based on municipal government data. Mod. Urban Res. 2019, 7, 80–90. [Google Scholar]
- Liu, Y.; Chen, L.; An, Z.; Zhang, X. Research on jobs-housing and commuting in Wuhan based on bus smart card data. Econ. Geogr. 2019, 39, 93–102. [Google Scholar]
- Guo, L.; Bi, Y.; Huang, J.; Zheng, C.; Hu, G.; Wang, G. Multi-scale comparison and analysis of jobs-housing spatial characteristics in big cities—Taking Wuhan as an example. Urban Plan. Forum 2018, 5, 88–97. [Google Scholar]
- Huang, J.; Hu, Y.J.; Wang, J.E.; Li, X. A tale of two cities: Jobs-housing balance and urban spatial structures from the perspective of transit commuters. Environ. Plan. B-Urban Anal. City Sci. 2020, 48, 1543–1557. [Google Scholar] [CrossRef]
- Zheng, M.N.; Liu, F.; Guo, X.C.; Lei, X.Y. Assessing the distribution of commuting trips and jobs-housing balance using smart card data: A case study of Nanjing, China. Sustainability 2019, 11, 5346. [Google Scholar] [CrossRef] [Green Version]
- Lu, Z.; Long, Z.; Yu, Q. Analysis on the jobs-housing spatial distribution and commuting characteristics of Kunshan city based on mobile phone data. Mod. Urban Res. 2019, 3, 50–55. [Google Scholar]
- Tan, X.; Huang, D.; Zhao, X.; Yu, Y.; Leng, B.; Feng, L. Jobs housing balance based on Baidu thermodynamic diagram. J. Beijing Norm. Univ. 2016, 52, 622–627. [Google Scholar]
- Zhang, Y.; Yao, X.; Meng, B.; Zhang, J.; Sun, R.; Yin, L.; Wang, J. A study of the spatial pattern of jobs-housing balance in Beijing. J. Beijing Union Univ. 2019, 33, 31–40. [Google Scholar]
- Zhou, T.; Yu, Q. The impact of individual attribute of residents on the commuting characteristics: A case study of Chongqing. Urban Probl. 2018, 1, 89–94. [Google Scholar]
- Wang, Z.; Xi, Q.; Wang, L.; Song, S. Study on characteristics of jobs-housing spatial balance and its influencing factors: A case study in Tianjin. Urban Dev. Stud. 2017, 24, 23–28. [Google Scholar]
- Zong, H.; Dai, J.; Dai, J. The characteristics of spatial organization between jobs and residential locations in the urban core area: A case study of Yuzhong district, Chongqing. Mod. Urban Res. 2016, 7, 113–119. [Google Scholar]
- Zhang, J.; Zhou, S. The diversity of different groups’ jobs-housing patterns and their impact factors under the background of institutional transformation: A case study of Guangzhou, China. Geogr. Res. 2018, 37, 564–576. [Google Scholar]
- Wu, X.; Chen, X.; Yuan, F. Jobs-housing relationship of people with housing difficulties and influencing factors in Nanjing city. Prog. Geogr. 2019, 38, 1890–1902. [Google Scholar] [CrossRef]
- Zhou, S.; Yan, X. The relationship between urban structure and traffic demand in Guangzhou. Acta Geogr. Sin. 2005, 60, 131–142. [Google Scholar]
- Cervero, R. The jobs-housing balance and regional mobility. Am. Plan. Assoc. J. 1989, 55, 136–150. [Google Scholar] [CrossRef]
- Ying, C.; Lei, J.; Duan, Z.; Yang, Z. Characteristics of jobs-housing spatial organization in Urumqi city and influencing factors. Prog. Geogr. 2016, 35, 462–475. [Google Scholar]
- Wang, L.; Yang, S. A study on the temporal and spatial characteristics of residents’ job and residence in the public rental housing in Chongqing. Hum. Geogr. 2021, 5, 101–110. [Google Scholar]


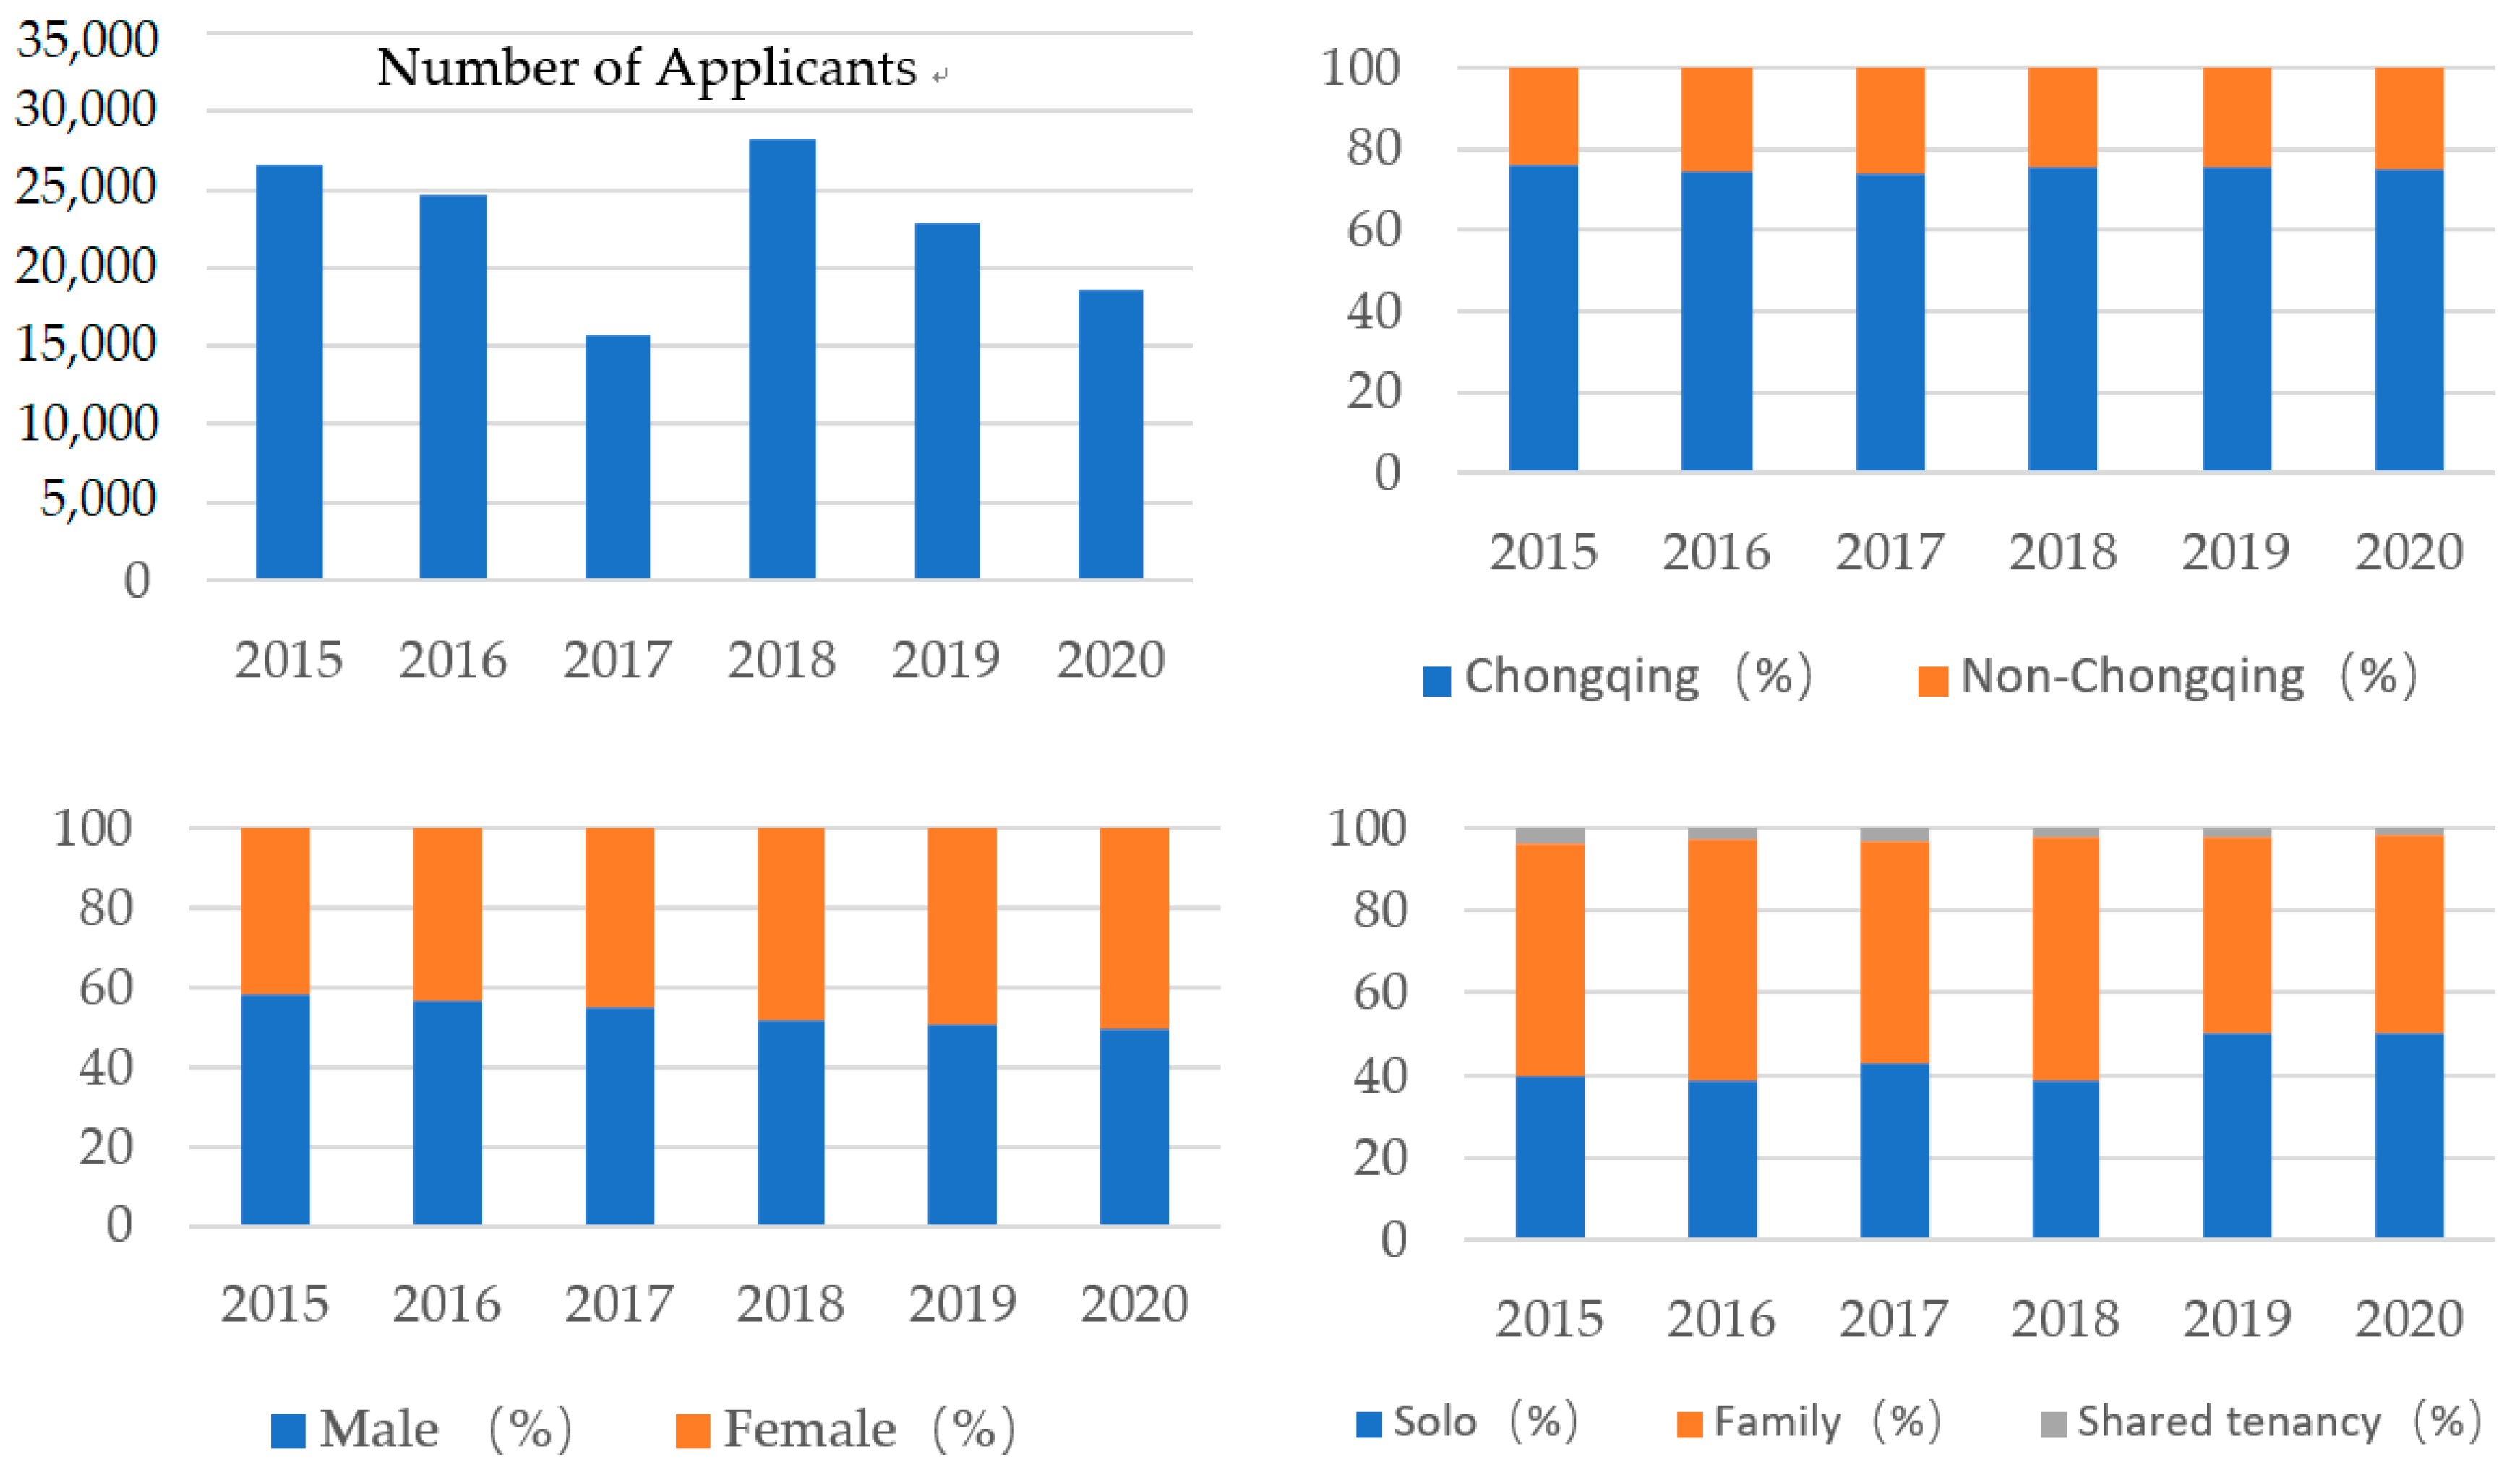
| Project | Administrative District | Area (million m2) | Residential Units (sets) | Occupied Residential Units (sets) | Occupancy Rate (%) |
|---|---|---|---|---|---|
| Peninsula Yijing | Dadukou | 135 | 19,833 | 19,533 | 98.49% |
| Happy Garden | Dadukou | 91 | / | / | / |
| Beautiful Sunshine | Shapingba | 111 | 15,255 | 15,023 | 98.48% |
| Xuefu Yueyuan | Shapingba | 186 | 27,051 | 6952 | 25.70% |
| Kangju West City | Shapingba | 147 | 24,330 | 21,690 | 89.15% |
| Min’an Huafu | Jiulongpo | 125 | 19,288 | 18,688 | 96.89% |
| Golden Phoenix Garden | Jiulongpo | 67 | 9616 | 777 | 8.08% |
| Chengxi Home | Jiulongpo | 74 | 10,939 | 2439 | 22.30% |
| Jiulong West Garden | Jiulongpo | 107 | 14,383 | 2051 | 14.26% |
| Chengnan Home | Nan’an | 199 | 32,649 | 31,817 | 97.45% |
| Jiangnan Waterfront | Nan’an | 126 | / | / | / |
| Liangjiang Minju | Beibei | 107 | 17,156 | 16,275 | 94.86% |
| Jinyun New Residence | Beibei | 82 | / | / | / |
| Beidu Jiayuan | Beibei | 89 | / | / | / |
| Airport Paradise | Yubei | 185 | 29,862 | 27,372 | 91.66% |
| Yunzhuan Shanshui | Ba’nan | 140 | 17,466 | 16,709 | 95.67% |
| Longzhou South Garden | Ba’nan | 36 | / | / | / |
| Qiaoping Renjia | Ba’nan | 87 | 11,628 | 6031 | 51.87% |
| Minxin Jiayuan | Liangjiang New Area | 112 | 18,238 | 17,689 | 96.99% |
| Kangzhuang Meidi | Liangjiang New Area | 135 | 22,830 | 21,979 | 96.27% |
| Community Name | To Work | Back Home | ||
|---|---|---|---|---|
| Average Commuting Time (min) | Average Commuting Distance (km) | Average Commuting Time (min) | Average Commuting Distance (km) | |
| Chengnan Home | 50.32 | 12.436 | 50.20 | 12.545 |
| Yunzhuan Shanshui | 53.52 | 12.827 | 55.83 | 13.487 |
| Kangju West City | 52.74 | 9.393 | 51.13 | 9.589 |
| Liangjiang Minju | 50.45 | 13.354 | 55.85 | 13.611 |
| Peninsula Yijing | 63.51 | 12.614 | 64.80 | 12.435 |
| Chengxi Home | 50.50 | 6.839 | 48.24 | 6.693 |
| Jiulong West Garden | 54.06 | 8.989 | 52.20 | 9.099 |
| Kangzhuang Meidi | 47.30 | 10.950 | 47.11 | 10.822 |
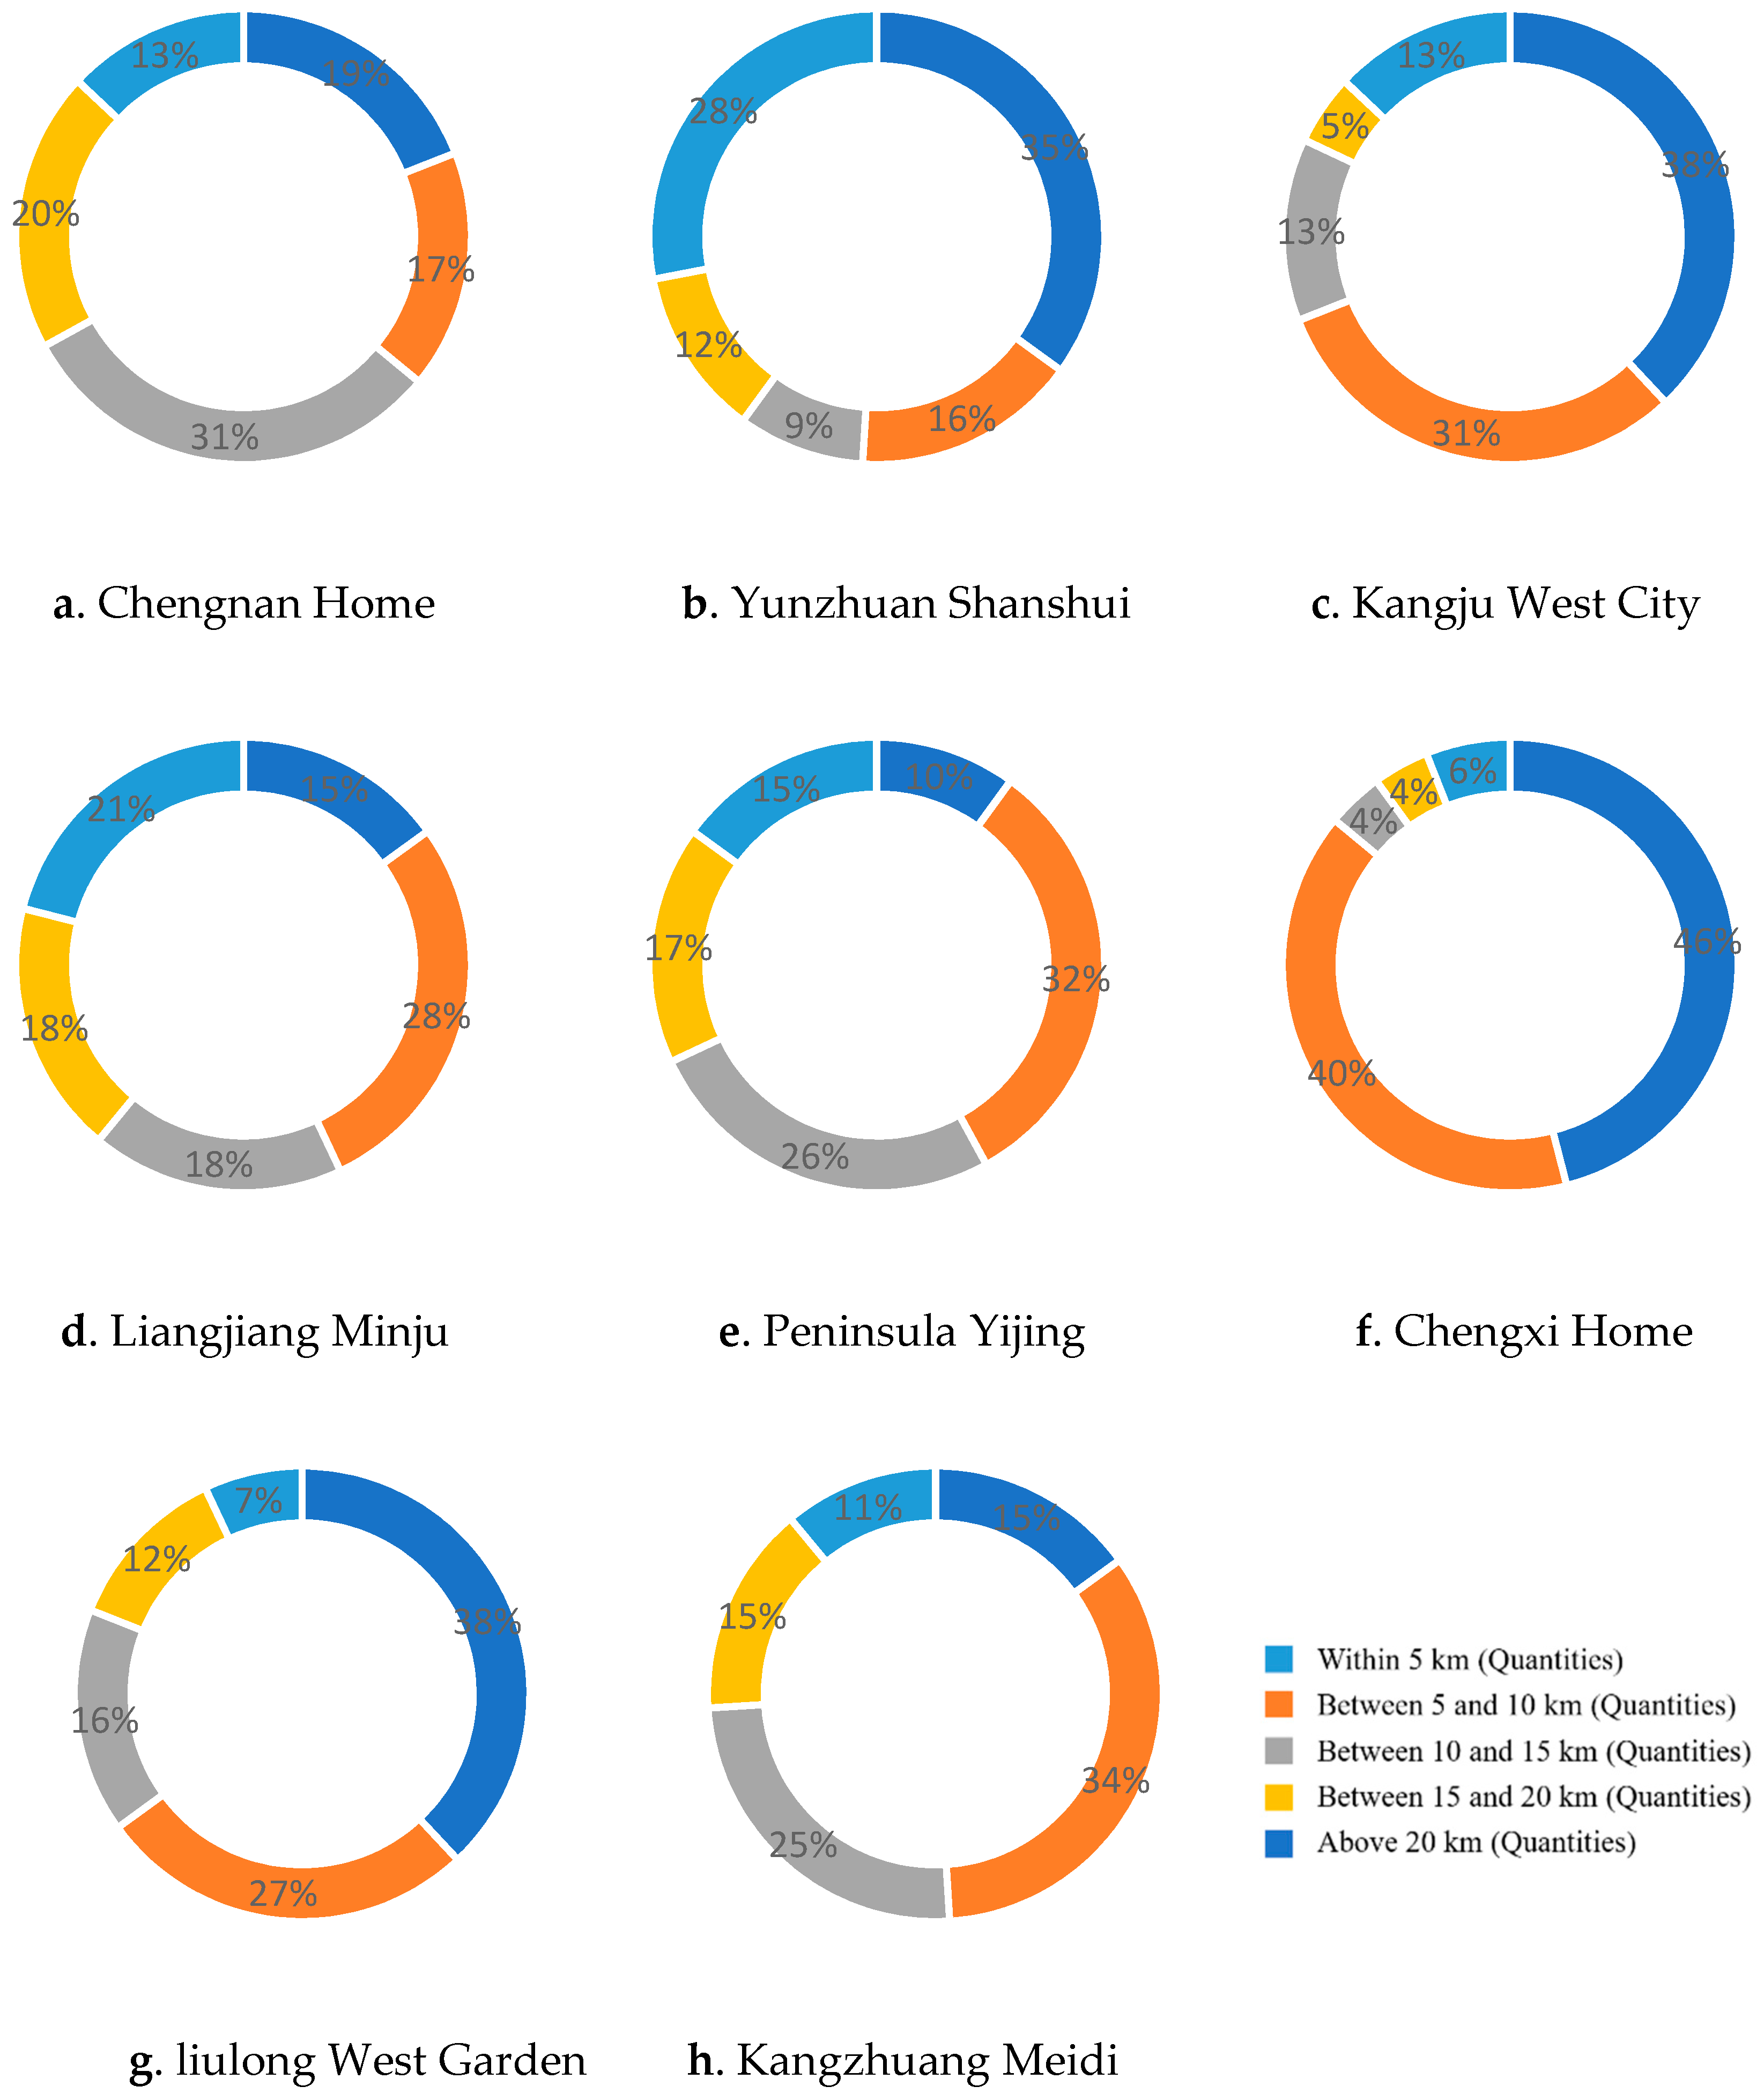
| Unit: km | <5 | 5~10 | 10~15 | 15~20 | >20 |
|---|---|---|---|---|---|
| Studied communities | 21.8% | 23.5% | 22.5% | 16.0% | 16.2% |
| Chongqing | 48% | 27% | 25% | ||
| Community Name | Administrative District | Characteristics of the Administrative Districts | |
|---|---|---|---|
| JHR | JHB | ||
| Chengnan Home | Nan’an | 0.42 | 0.75 |
| Yunzhuan Shanshui | Ba’nan | 0.28 | 0.5 |
| Kangju West City | Shapingba | 0.35 | 0.63 |
| Liangjiang Minju | Beibei | 0.31 | 0.56 |
| Peninsula Yijing | Dadukou | 0.34 | 0.63 |
| Chengxi Home | Jiulongpo | 0.56 | 1.01 |
| Jiulong West Garden | Jiulongpo | 0.56 | 1.01 |
| Kangzhuang Meidi | Yubei | 0.55 | 1.00 |
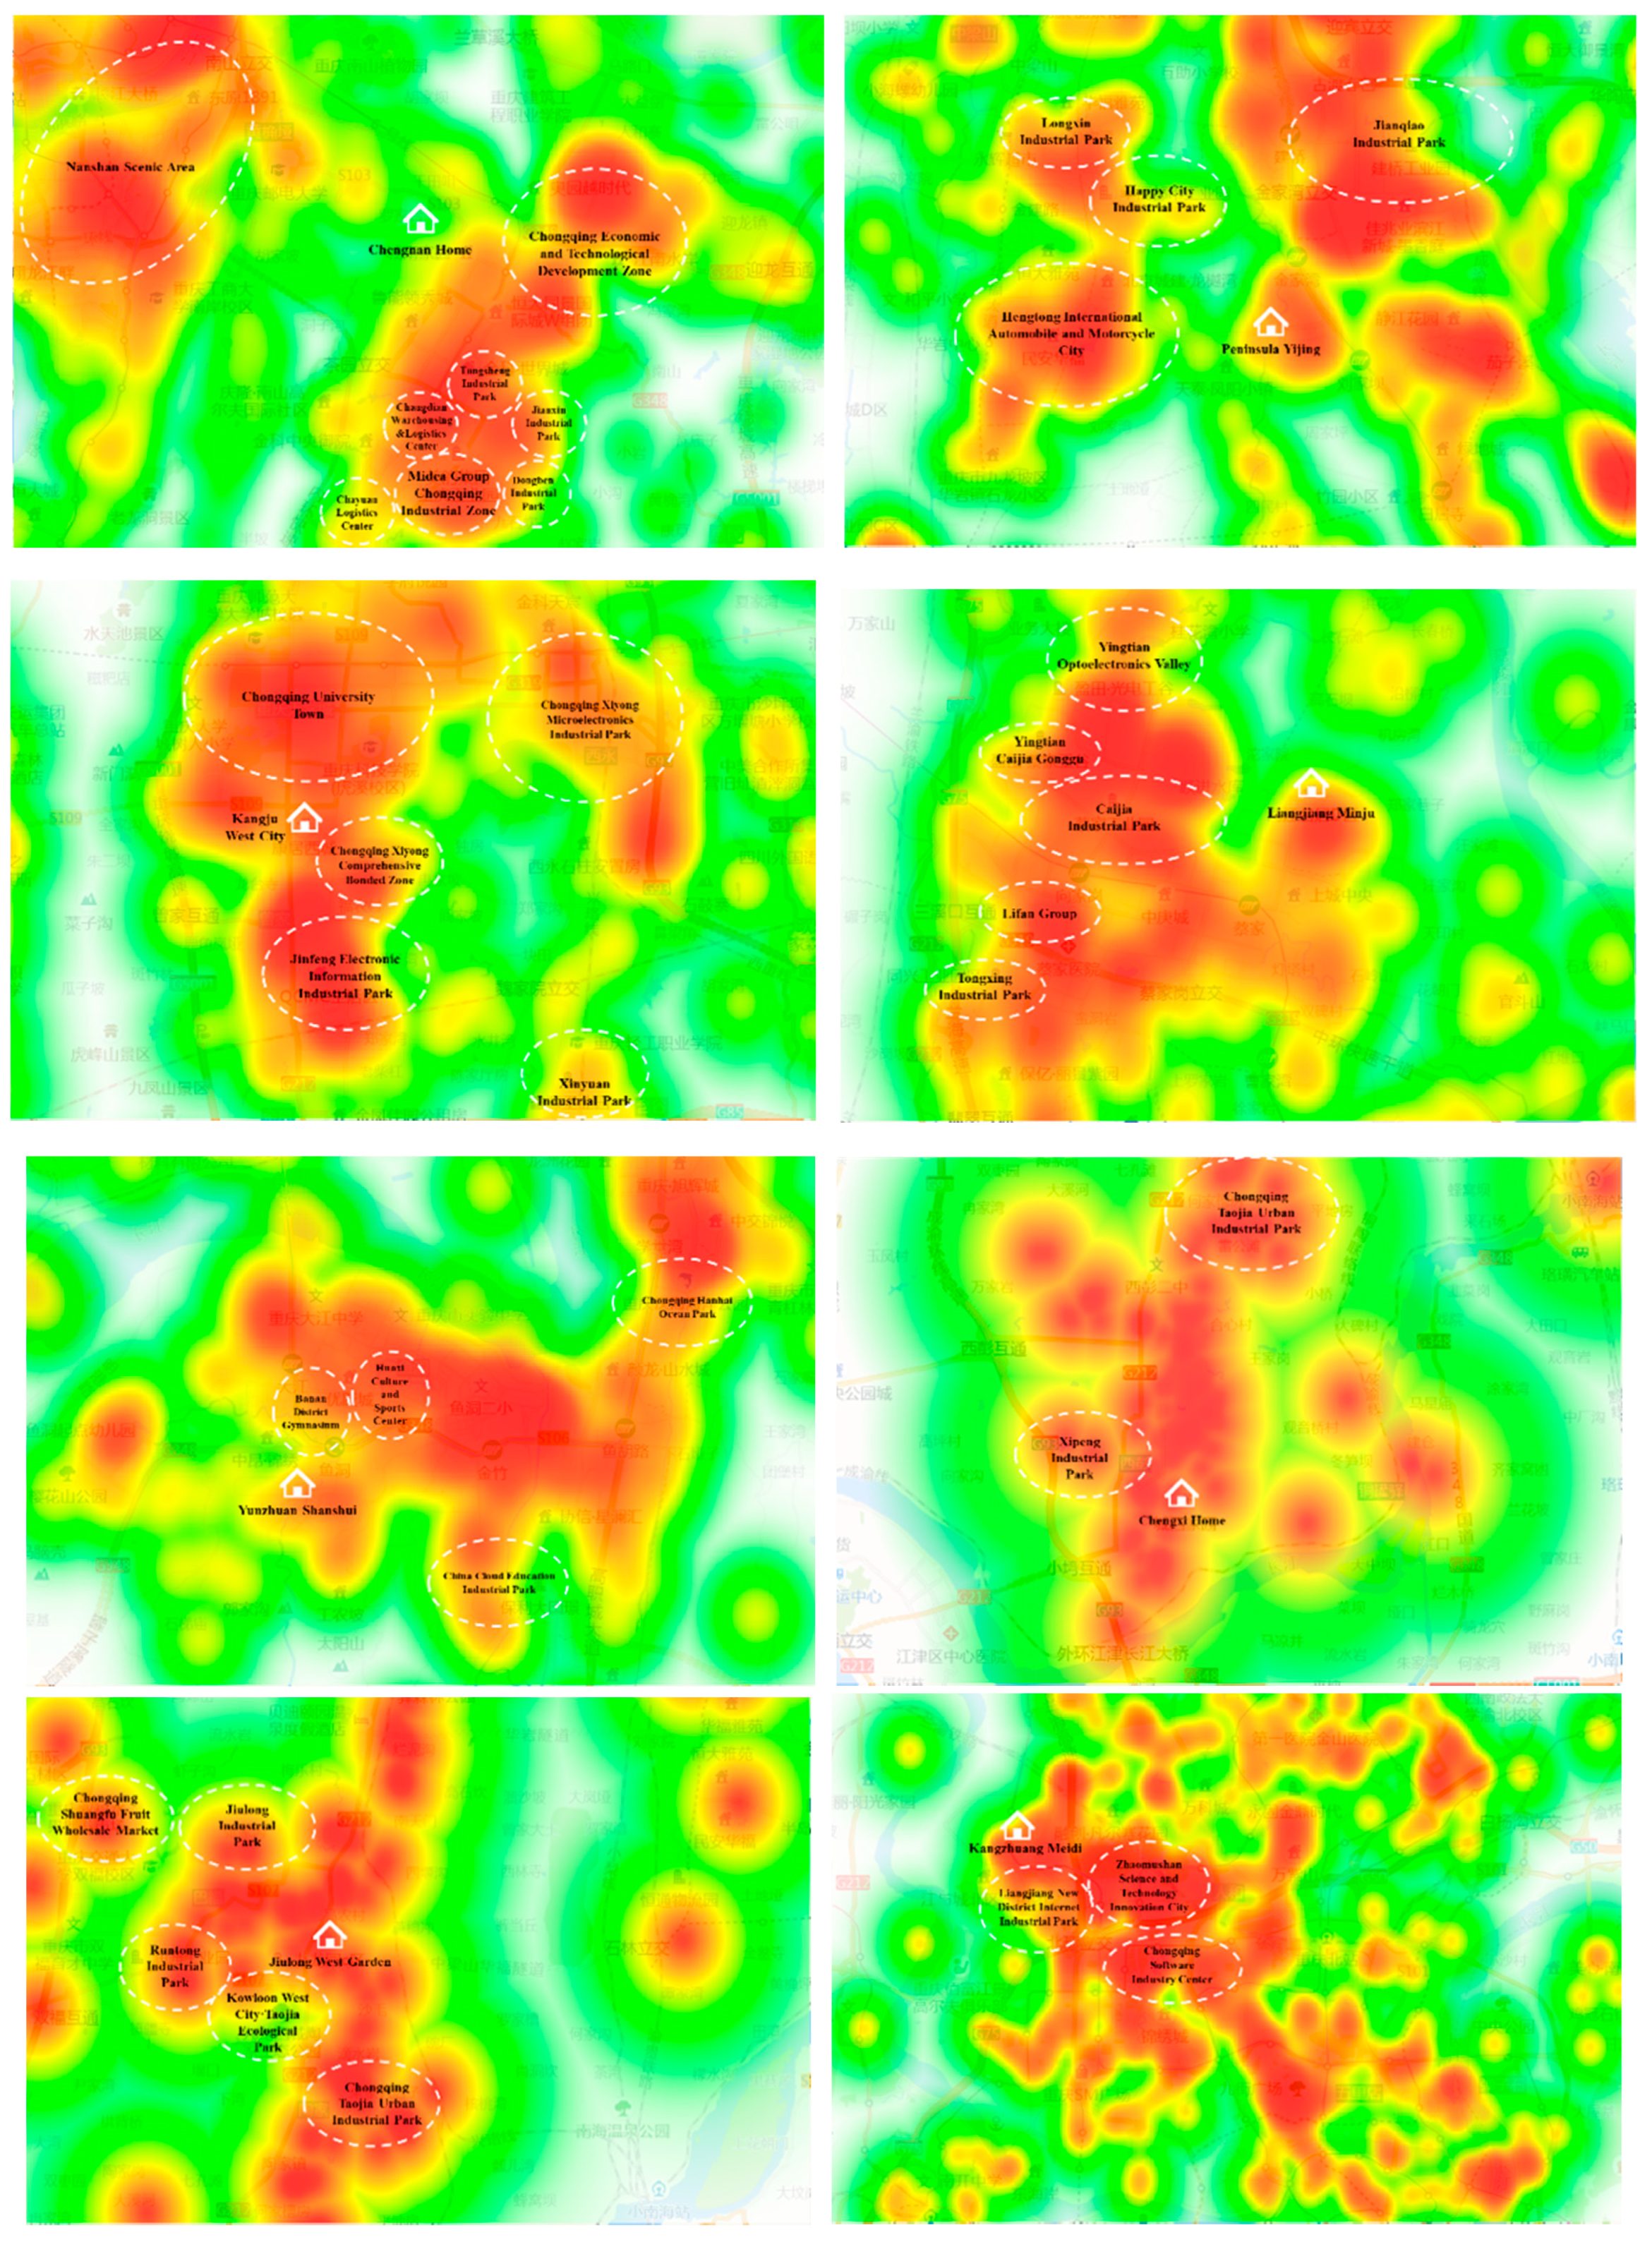
| Community Name | Industrial Zone | Rank | Approved Area (ha) | Pillar Industry |
|---|---|---|---|---|
| Peninsula Yijing | Hengtong International Automobile and Motorcycle City | N/A | N/A | Auto and motorcycle accessories |
| Jianqiao Industrial Park | Provincial | 1152.88 | Machinery, new materials, environmental protection | |
| Happy City Industrial Park | N/A | N/A | N/A | |
| Longxin Industrial Park | N/A | N/A | Motorcycle, motorcycle engine | |
| Chengnan Home | Nanshan Scenic Area | N/A | 2500 | Tourism service industry |
| Chongqing Economic and Technological Development Zone | National | N/A | Electronic information, equipment manufacturing | |
| Dongben Industrial Park | N/A | N/A | Motorcycle | |
| Changdian Warehousing & Logistics Center | N/A | N/A | Logistics | |
| Chayuan Logistics Center | N/A | 1754.96 | Electronic information, equipment manufacturing, pharmaceutical and chemical industry | |
| Tongsheng Industrial Park | N/A | N/A | N/A | |
| Midea Group Chongqing Industrial Zone | N/A | 53.3 | Appliances and machinery midwest manufacturing center | |
| Jianxin Industrial Park | N/A | N/A | N/A | |
| Kangju West City | Chongqing University Town | Provincial | 3300 | Advanced talent training center, scientific research and innovation center, international science and technology education exchange center |
| Chongqing Xiyong Micro-electronics Industrial Park | Provincial | 1708.53 | Computer, electronic and communication equipment | |
| Chongqing Xiyong Comprehensive Bonded Zone | National | 832 | Computer, electronics | |
| Jinfeng Electronic Information Industrial Park | Provincial | 589 | Computer, electronics | |
| Xinyuan Industrial Park | N/A | 26.27 | Motorcycle | |
| Liangjiang Minju | Caijia Industrial Park | N/A | 4.06 | N/A |
| Lifan Group | N/A | N/A | Production of engines, general machines, motorcycles, and automobiles | |
| Yingtian Caijia Gonggu | N/A | 17.27 | N/A | |
| Yingtian Optoelectronics Valley | N/A | 17.45 | N/A | |
| Tongxing Industrial Park | Provincial | 1107.99 | Machinery, instrumentation, auto and motorcycle accessories | |
| Yunzhuan Shanshui | China Cloud Education Industrial Park | N/A | 270 | Combining virtual education with physical education |
| Banan District Gymnasium | N/A | 0.08 | Humanities and entertainment | |
| Huaxi Culture and Sports Center | N/A | N/A | International top events and high-end performances | |
| Chengxi Home | Xipeng Industrial Park | Provincial | 1406.39 | Aluminum processing, auto and motorcycle parts, food |
| Chongqing Taojia Urban Industrial Park | Provincial | 66.67 | Mechanical processing and manufacturing, electronic information, high-tech, business logistics | |
| Jiulong Industrial Park | Provincial | 2142.59 | Cars, motorcycles, smart equipment | |
| Chongqing Shuangfu Fruit Wholesale Market | N/A | N/A | Wholesale fruit market | |
| Runtong Industrial Park | N/A | 46.67 | General-purpose engines, ATV utility vehicles, small household appliances, and their supporting parts | |
| Chongqing Taojia Urban Industrial Park | Provincial | 66.67 | Mechanical processing and manufacturing, electronic information, high-tech, business logistics | |
| Kangzhuang Meidi | Liangjiang New District Internet Industrial Park | N/A | N/A | Internet and software information (More than 200 various Internet companies have settled, with more than 10,000 employees in the park) |
| Zhaomushan Science and Technology Innovation City | N/A | 400 | Software industry center, internet industry park, service trade park, advertising creative industry park | |
| Chongqing Software Industry Center | National | 3000 | Internet of Things, industrial internet, big data, 5G, artificial intelligence |
Publisher’s Note: MDPI stays neutral with regard to jurisdictional claims in published maps and institutional affiliations. |
© 2022 by the authors. Licensee MDPI, Basel, Switzerland. This article is an open access article distributed under the terms and conditions of the Creative Commons Attribution (CC BY) license (https://creativecommons.org/licenses/by/4.0/).
Share and Cite
Yi, H.; Wang, L.; Li, Q.; Li, X. Investigate Jobs–Housing Spatial Relationship with Individual-Based Mobility Big Data of Public Housing Tenants: A Case Study in Chongqing, China. Sustainability 2022, 14, 3211. https://doi.org/10.3390/su14063211
Yi H, Wang L, Li Q, Li X. Investigate Jobs–Housing Spatial Relationship with Individual-Based Mobility Big Data of Public Housing Tenants: A Case Study in Chongqing, China. Sustainability. 2022; 14(6):3211. https://doi.org/10.3390/su14063211
Chicago/Turabian StyleYi, Hong, Lu Wang, Qiao Li, and Xiang Li. 2022. "Investigate Jobs–Housing Spatial Relationship with Individual-Based Mobility Big Data of Public Housing Tenants: A Case Study in Chongqing, China" Sustainability 14, no. 6: 3211. https://doi.org/10.3390/su14063211
APA StyleYi, H., Wang, L., Li, Q., & Li, X. (2022). Investigate Jobs–Housing Spatial Relationship with Individual-Based Mobility Big Data of Public Housing Tenants: A Case Study in Chongqing, China. Sustainability, 14(6), 3211. https://doi.org/10.3390/su14063211