Article

Investigating Company’s Technical Development Directions Based on Internal Knowledge Inheritance and Inventor Capabilities: The Case of Samsung Electronics

1
National Science Library, Chinese Academy of Sciences, Beijing 100190, China
2
Department of Information Systems, Hanyang University, Seoul 04763, Korea
3
Engineering Product Development Pillar, Singapore University of Technology and Design, Singapore 487372, Singapore
*
Author to whom correspondence should be addressed.
Sustainability 2022, 14(5), 3117; https://doi.org/10.3390/su14053117
Submission received: 19 February 2022 / Revised: 3 March 2022 / Accepted: 6 March 2022 / Published: 7 March 2022

Abstract

:
This paper proposes a new method to analyze technical development directions of a company using knowledge persistence-based main path analysis and co-inventor network analysis. Main path analysis is used for identifying internal technical knowledge flows and inheritances over time within a company, and knowledge persistence-based main path analysis can well identify major knowledge streams of each sub-domain within a relatively small knowledge network generated by one company without omission of significant inventions. A co-inventor network analysis is used for identifying key inventors who can be represented as the major technical capabilities of a company. The method is a meaningful attempt in that it applies knowledge persistence-based main path analysis to analyzing a company’s internal technical development and combines the two approaches to provide the information on both base technical capabilities and new technical characteristics. To test the method, this paper conducted an empirical study of Samsung Electronics. The results show that the method generated major knowledge flows and identified key inventors of Samsung Electronics. In particular, the method can identify the base technical knowledge as the ‘backbone’ and newly injected knowledge as ‘fresh blood’ for forecasting future technical development. Based on the identified clue information, this paper forecasted the potential future technologies for each sub-domain of Samsung Electronics with technical keywords and descriptions.

1. Introduction

Technologies have been considered as a key resource for achieving and sustaining a competitive advantage. The internal technical capability as a basis for obtaining new technical knowledge can determine the technical competitiveness and development directions of companies. Since it fundamentally requires much time and effort for technical human resources to develop and improve the internal technical capability, most tech-oriented companies, even service companies, devote much attention to developing it through continual R&D activities. To achieve competitive advantages, companies should provide relatively better customer’s values than competitors, and so it is essential to know competitors’ technical capabilities and understand their developmental directions through technical monitoring. There have been many studies on monitoring the technical landscape of a specific technical field using technical data; patents as the reliable, free-accessible, and structured technical data, have been widely used for technical monitoring. Lee et al. [1] developed a patent map approach to discovering new technical opportunities in a technical domain. Daim et al. [2] presented a bibliometric approach for monitoring and forecasting emerging technologies using patent data. Zhang et al. [3] proposed a term of clumping steps for technical monitoring. Moehrle and Caferoglu [4] employed a semantic patent analysis to discover the emerging technologies in a camera domain. Park et al. [5] suggested an analytic framework to evaluate companies’ technical capability within a specific technical field using a patent semantic analysis. Yoon et al. [6] developed a method to identify technical competition trends for R&D planning using a dynamic patent map approach. Mun et al. [7] proposed a method to analyze technical trends in a specific technical field from the functional perspective using a function scoring approach. Mun et al. [8] suggested a method to assess the technical capability of firms for the business diversification purpose using patent metrics.
Even though previous methods are useful to identify competitive relationships and evaluate technical capabilities of firms, there have been few researches that focus on the specific development trajectories of internal technical capability and future development directions based on the technical capability.
To overcome this, we propose a new method to investigate the technical development directions of a company based on its internal knowledge inheritance and inventor capabilities. Specifically, this paper combined the main path analysis and inventor network analysis to identify a firm’s internal technical trajectories and predict its future development directions. A main path analysis has been widely used for understanding technical changes [9,10,11,12,13,14] and trajectories under a technical field [15,16,17,18,19,20,21,22,23,24,25,26,27]. This approach identifies the major knowledge flows within a knowledge network by minimizing the network complexity, and so it can show the major knowledge flows within a company. In addition, the last nodes in a main path can be the specific clues to predict future development directions [28]. Given that the technical capabilities of a company cannot be evolved in short time, but accumulated and inherited over time through continuous R&D activity, we adopted the knowledge persistence (KP)-based main path analysis, which can quantify how much knowledge of a patent was inherited to later inventions [23,29]. A co-inventor network analysis assesses the inventors’ impact or power in a co-inventor network and finds key inventors who make a huge influence on the internal technical development [30,31,32,33]. Since key inventors play a critical role for the internal knowledge flows and inheritance, the specific technical areas of key inventors are closely aligned with the firm’s R&D directions. Companies develop new inventions based on the combination of internal technical capability as a ‘backbone’ and new technical knowledge from outside as ‘fresh blood’. Therefore, the technical knowledge in the end-nodes on the main paths and major technical capabilities, or technical fields, of key inventors can be the ‘backbone’ for future technologies, and new technical knowledge adopted to the end-nodes or recently emerged technical areas of key inventors can be the unconventional knowledge sources that enable one to achieve novel and breakthrough features as ‘fresh blood’.
To test the method, this paper applied it to the case of Samsung Electronics. Since Samsung Electronics has a great number of patents (Top 2 assignee in the world) and complex internal technical structures, this company can be a great case to test the proposed method. The empirical analysis shows/found that KP-based main path analysis can represent the major technical knowledge flows and inheritance, and co-inventor network analysis can objectively identify key inventors in each technical field of the focal company. In particular, new technical knowledge, or technical fields, employed by the inventions through backward citations and added to the key inventors was identified in the later inventions. Therefore, the proposed method is useful for predicting future development directions of a company, and this paper forecasted the potential future technologies for each sub-domain of Samsung Electronics with technical keywords and descriptions.
The rest of this paper is structured as follows. The related literature is reviewed in Section 2. Section 3 explains the proposed method. The empirical case study is conducted in Section 4. Section 5 presents the discussion and conclusion.

2. Literature Review

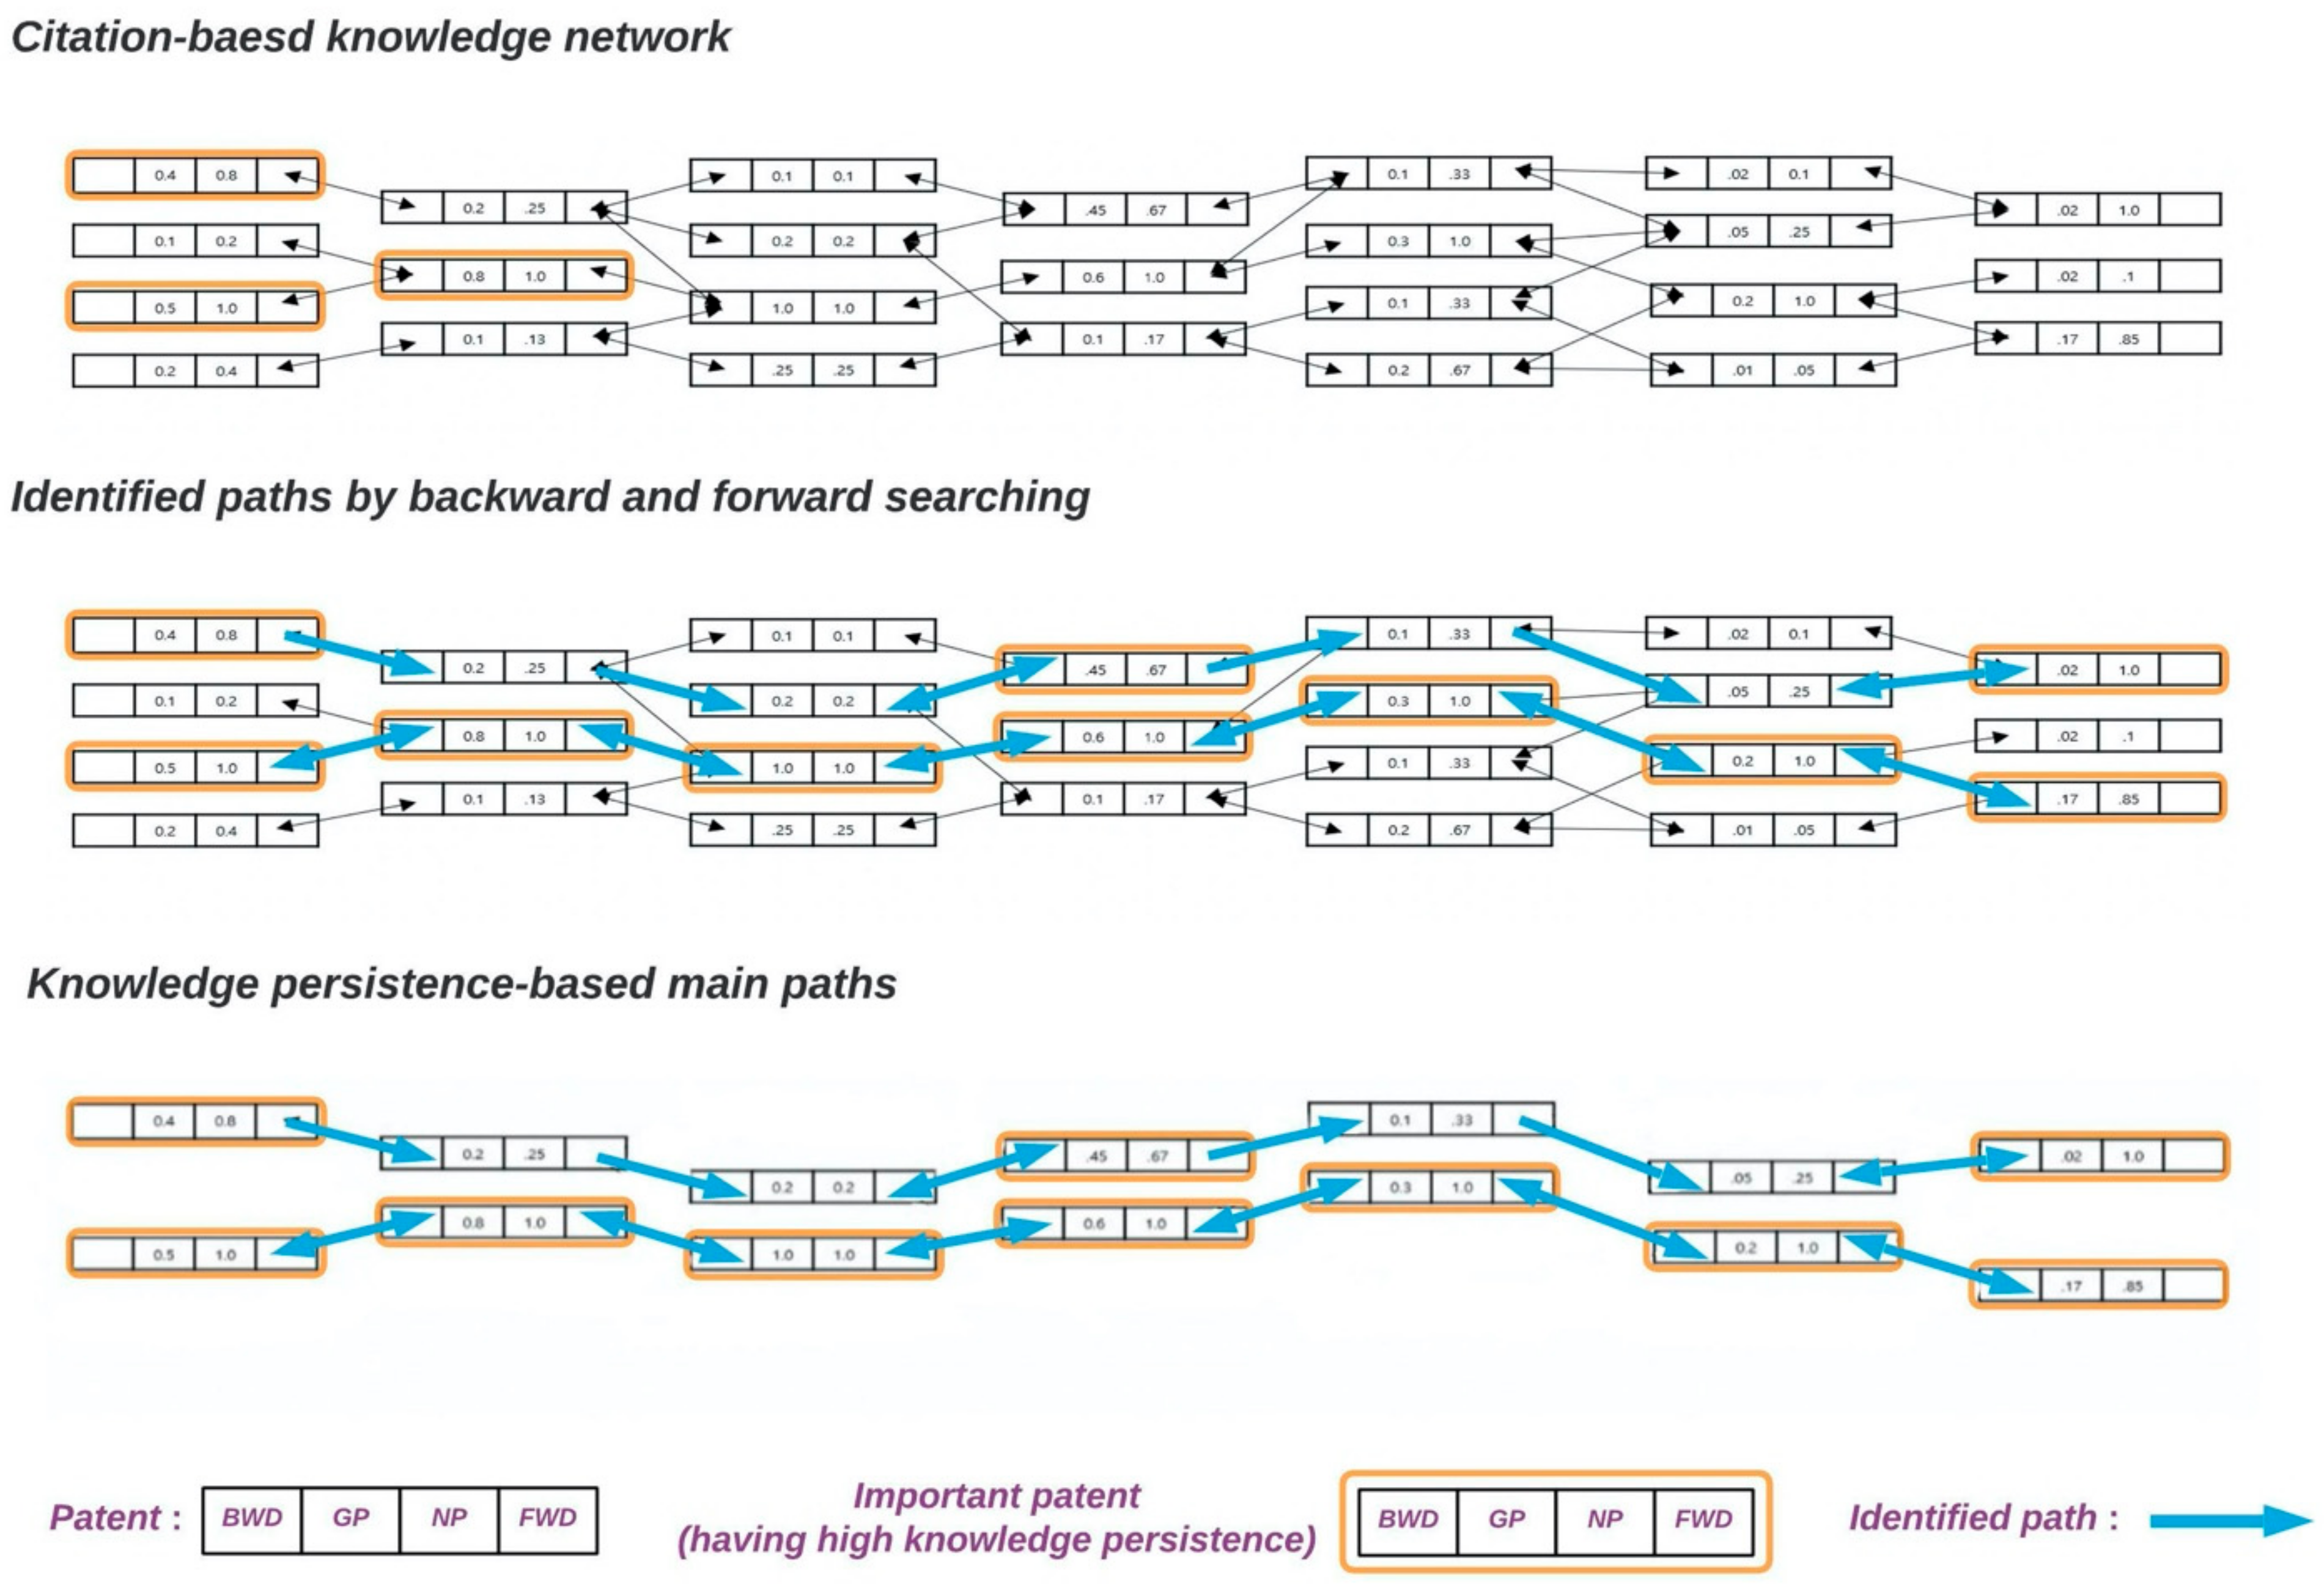
2.1. KP-Based Main Path Analysis

Main path analysis has been widely exploited for analyzing and understanding the technical changes and innovation under a specific area. The basic concept of main path analysis is to reduce the network complexity of a citation-based big/huge knowledge network. A knowledge network is usually constructed based on citation relationships. So, each citing and cited relationship represents knowledge flow between two inventions. Since early inventions cannot cite later inventions and citations basically have directions, the network is an unweighted and directional acyclic network. This type of network does not work well with common metrics from a social network analysis. Therefore, most main path analysis studies developed or adopted a new network algorithm.
The first attempt is a search path-based approach developed by Hummon and Dereian [34]. This main path analysis generates a single path based on the traversal counts. Most previous studies adopted the basic concept of the Hummon and Dereian [34]’s main path analysis for investigating scientific and technical knowledge trajectories [16,35,36,37,38,39,40]. Since a single main path is insufficient to analyze technical domains, Verspagen [16] suggested an improved main path approach that can generate multiple main paths. Verspagen [16]’s main path analysis integrates the main path for specific periods. For example, if the whole period is 10 years and the year scale is one year, there are nine main paths from the first year to n-th year (n = 2~10). Verspagen’s main path analysis was useful to analyze the technical domains having multiple sub-fields. Many studies have adopted it for various purposes [41,42,43,44,45,46,47]. However, the critical limitations of this approach were the high network complexity and omission of the dominant technologies on the main paths.
To overcome the limitations, Park and Magee [29] developed the knowledge persistence (KP)-based main path analysis. KP-based main path analysis first identifies the dominant knowledge using KP that quantifies how much technical influence an invention has on the latest technical developments and then connects the adjacent nodes having the highest KP scores using backward–forward path analysis [29]. The clear benefit of KP-based main path analysis is that it can generate multiple main paths by significantly reducing the network complexity without omission of any dominant inventions. Since this research adopts a main path analysis to identify the major knowledge trajectories of a specific company, a main path analysis must show the multiple technical domains of a company, inherited knowledge flows over time and the most significant inventions of the focal company. Considering the mentioned advantages, this paper adopted the KP-based main path analysis.

2.2. Co-Inventor Network Analysis

In a scholarly data analysis, inventors or authors are important bibliographic information for various research purposes. Since R&D human resources can represent the scientific and technical capability of organizations, their co-occurrence relations with other bibliographic information, such as a country, organization, or research field, can be used for better understanding the collaboration trends [48,49,50], regional characteristics [33,51,52,53,54,55,56], or technical changes and innovation [33,54,57,58,59,60,61]. In particular, co-inventor relationships within an organization can show some significant inventors who are strategically allocated to major R&D projects and so usually lead most R&D projects. Therefore, key inventors’ technical capability and major technical fields are aligned with the firm’s R&D directions.
A co-inventor network can be constructed based on the co-occurrence relationships among inventors. A co-inventor network is usually a weighted and undirected cyclic network, and so the metrics from social network analysis can provide good performance. There have been many studies that used a social network analysis to analyze patent co-inventor networks. Han and Park [62] developed a method to calculate inter-industrial knowledge diffusions using patent citation-based network analysis. Cantner and Graf [30] investigated the local inventor relationships in Jena using co-inventor network analysis. Lei et al. [63] employed patent-based assignee and co-inventor network analysis to analyze the collaboration relationships in the solar photovoltaic domain. This paper used the degree and betweenness centrality to identify key inventors in a company.

3. Method

3.1. Data Collections

This paper collected all granted United States patents of Samsung Electronics from 1 January 1976 to 31 December 2020. We first constructed a patent database using USPTO (United States Patent and Trademark Office) data through PatentsView (www.patentsview.org) and collected patents of Samsung Electronics by searching the patents containing the assignee name ‘samsung’ and then filtering out the patents not having ‘electronics’. Total 112,334 patents were collected. For co-inventor network analysis, inventor name disambiguation should be processed. We disambiguated inventor names by considering technical fields and co-inventor relationships.

3.2. Identification of Internal Knowledge Flows

To understand the technical development process, it is important to identify the flows of technical knowledge over time, and this paper used the KP-based main path analysis to identify knowledge flows within a company. KP is a quantitative metric that measures the technical influence of a patent on the latest technologies in a knowledge network. KP can be measured as follows. First, the patent citation network is constructed. Second, the layer length of the patent citation network is measured by identifying the longest path from the start-point to the end-point. Third, each patent is rearranged by the defined layer structure. Fourth, the weight of each edge between two patents is calculated based on knowledge in-flows through backward citations. Specifically, the weight of the edge from the cited to the citing patent is calculated by 1/the number of all backward citations of the citing patent. Finally, KP of a patent is calculated by the following formulation [29]:
KP P a t e n t A = i = 1 n j = 1 m i k = 1 l j 1 1 B a c k w a r d C i t a t i o n P a t e n t i j k  
where KP P a t e n t A is the knowledge persistence value of the focal patent A, n is the number of directly or indirectly connected end nodes, i is the number of the last layer nodes directly or indirectly connected to P a t e n t A , l j is the number of nodes on the j-th path between P a t e n t i and P a t e n t A , and mi is all paths can be generated between P a t e n t i and P a t e n t A . P a t e n t i j k is the k-th patent on the j-th path between P a t e n t i and P a t e n t A ; B a c k w a r d C i t a t i o n P a t e n t i j k is the number of the cited patents (backward citations) by P a t e n t i j k .
To identify the important patents, the KP value of each patent is max normalized from the global point of view (GP: Global Knowledge persistence) and the local point of view (LP: Local Knowledge Persistence). This paper sets the threshold for the important patents as GP ≥ 0.3 or LP ≥ 0.8, based on the previous studies [29,64,65]. To identify the main paths, all important patents are connected by the backward and forward searching technique (Figure 1). The backward and forward searching finds the highest KP patents on the backward and forward layers of the focal patent. Therefore, KP-based main path analysis can dramatically reduce a network complexity without missing the important patents.

3.3. Identification of Key Inventors

To investigate R&D efforts of Samsung Electronics, the co-inventor network was constructed based on all the Samsung patents. Each node in the network represents an inventor, and the edge between two nodes indicates that the two inventors co-invented one patent. The co-inventor network in this research is generated and analyzed using iGraph—a network analysis package for Python. Based on [59], we determined the key inventors whose research activeness or broadness is dramatically higher than other inventors. The research activeness of inventors can be calculated by the degree centrality and broadness can be calculated by the betweenness centrality. The formulation of the degree centrality is as follows [66]:
DEGREE = d i ,
where d i means the number of the linked nodes with the focal node i in a network. The inventors, having high degree score, have higher co-inventing experiences from many R&D projects than other inventors and so can be considered as the active inventors in a company [59]. The research broadness of inventors can be calculated by using betweenness centrality. The betweenness centrality identifies nodes that act as a bridge or brokerage in an inventor network, and so an inventor having high betweenness centrality scores is likely to be an R&D head or leader. The formulation of for the normalized betweenness centrality is as follows [66]:
b i = j , k V , i j k n g j i k g j k / n 1 n 2 2 ,
where bi is the betweenness centrality of the node i, gjik is the number of the shortest paths between the node j and k that pass through the node i. gjk is the number of shortest paths from the node j to k, n is the number of total nodes in the network.
The key inventors in the whole network as well as the main paths are identified based on the above two indicators. The next step is to analyze the key inventors’ technical fields where they are mainly focused, which could be identified by the patent classification, e.g., Cooperative Patent Classification (CPC). Analyzing the major CPCs of the key inventors can indicate the important technologies that are related to the corporate strategy. In addition, the technical knowledge of key inventors in the main paths are helpful to forecast the further R&D directions. The details on the metrics will be described in Section 3.4.

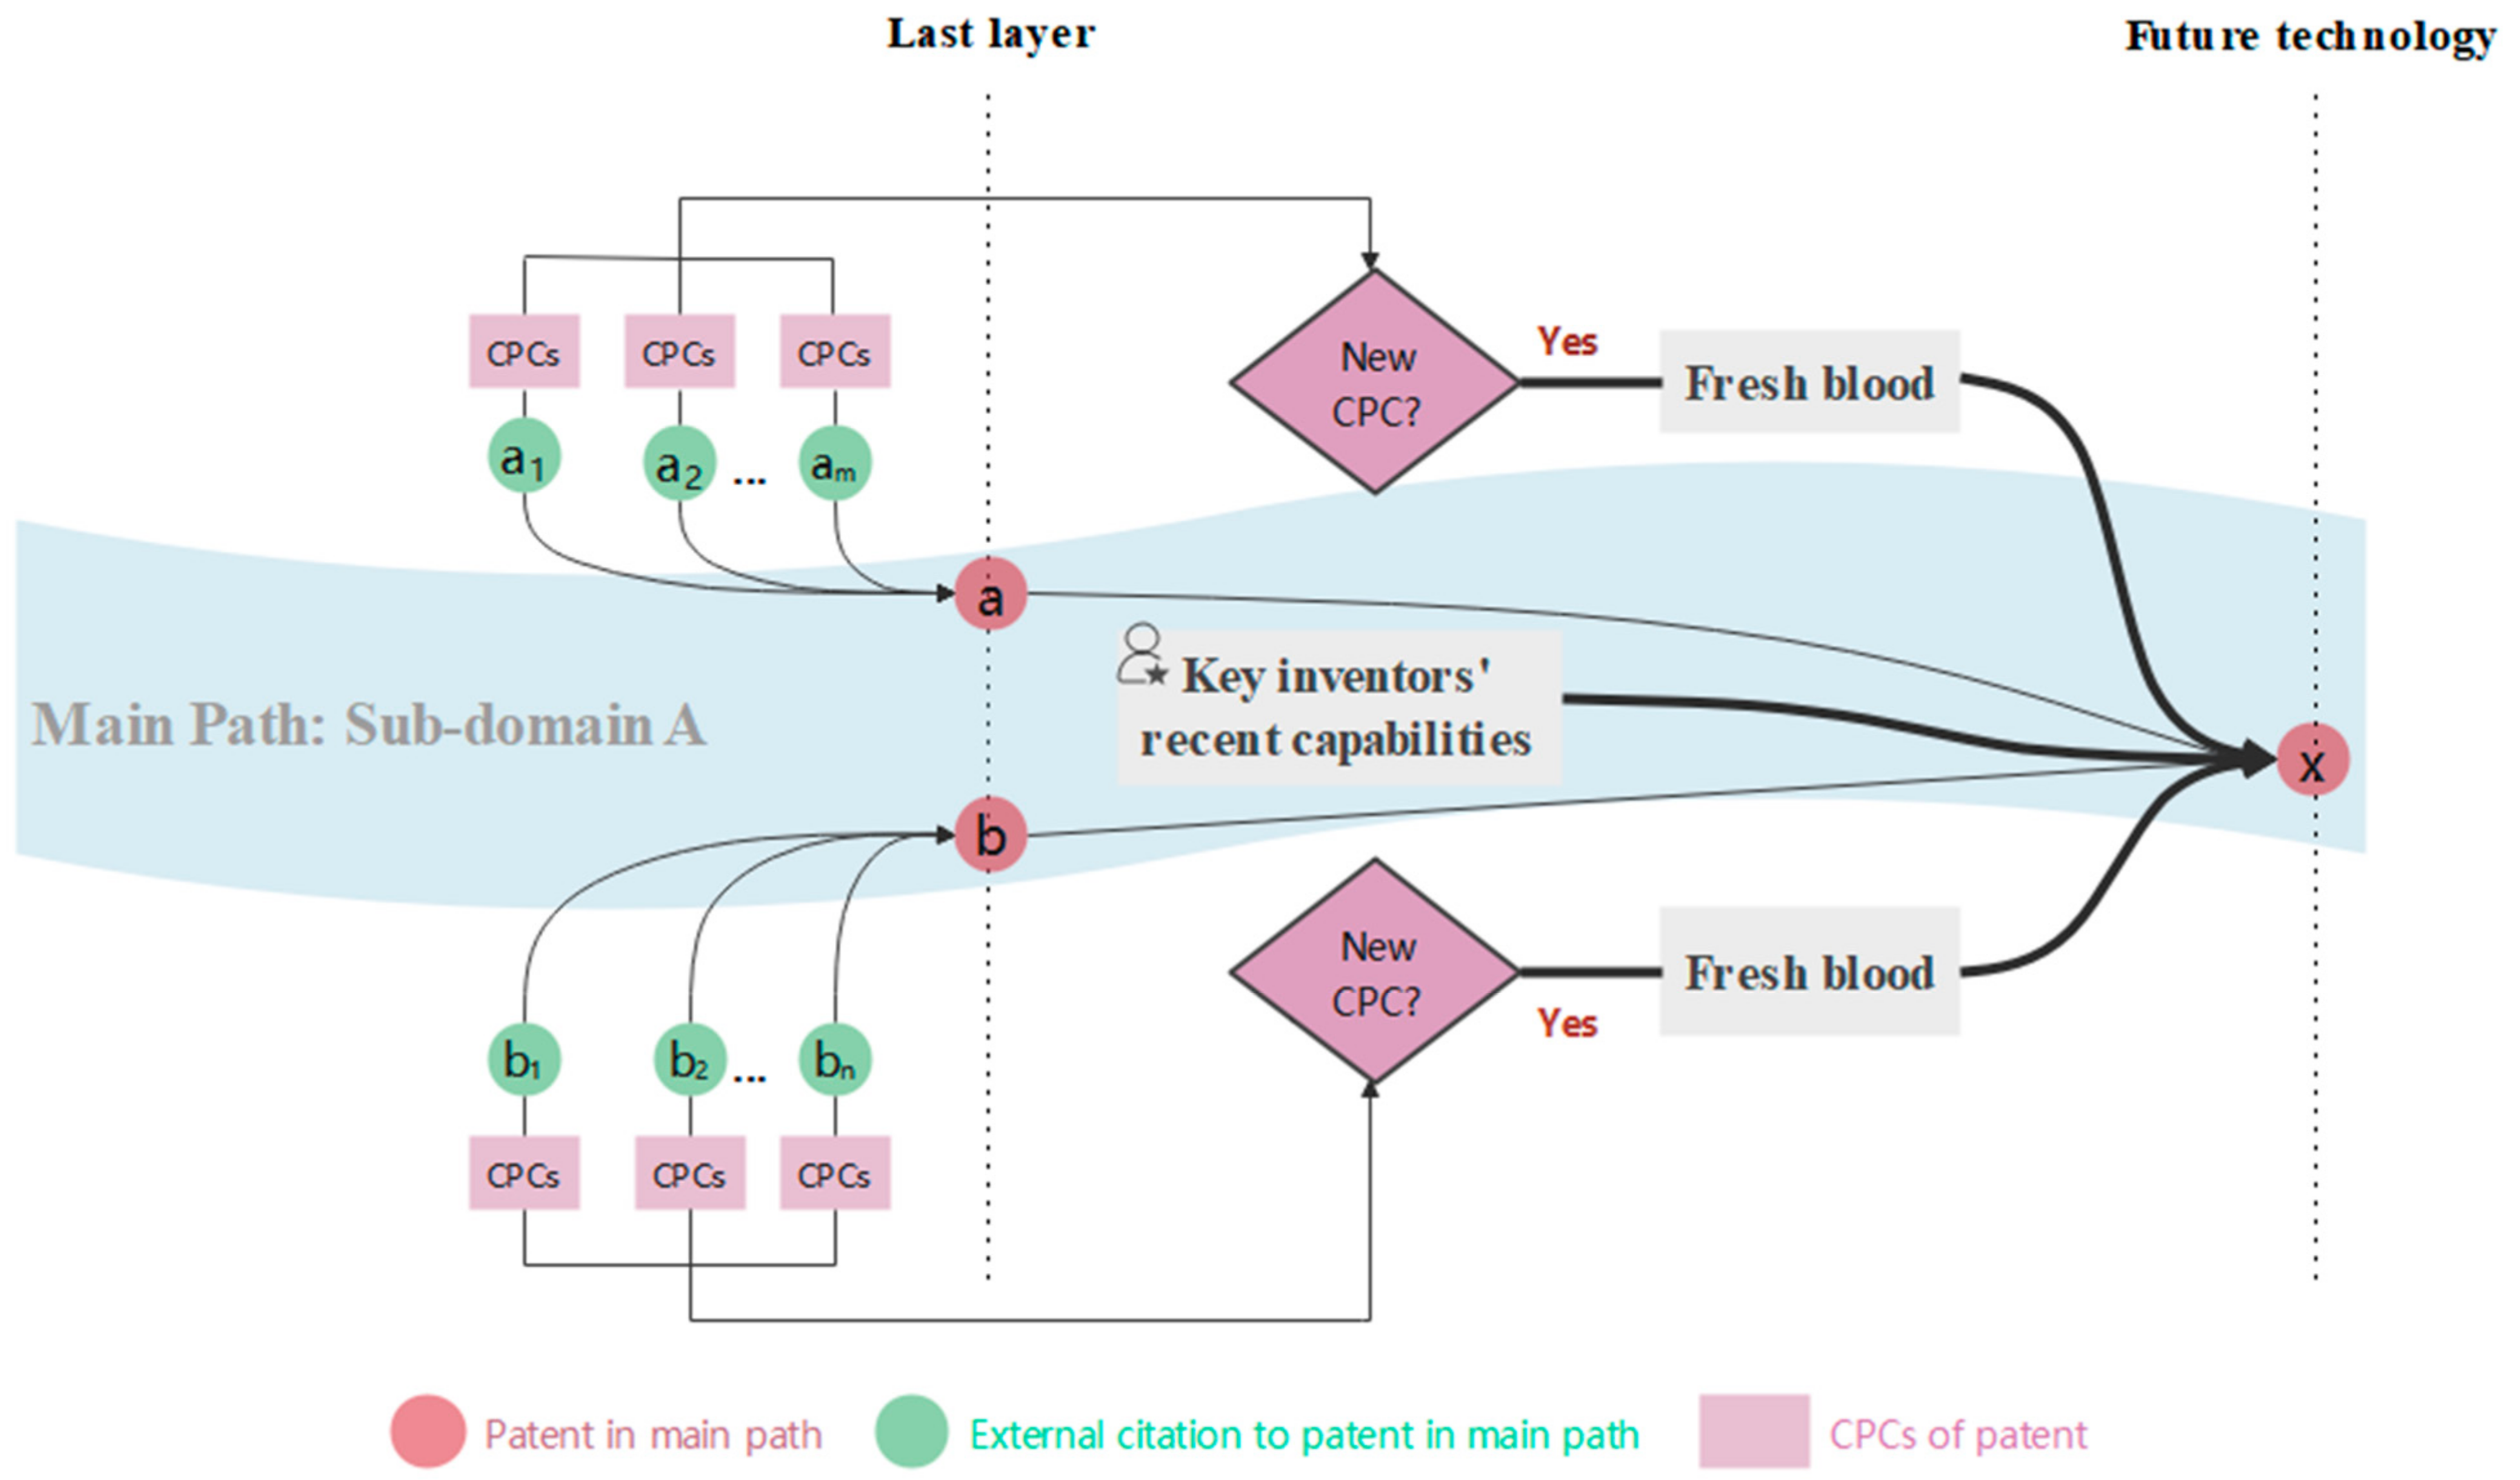
3.4. Future Direction Analysis

From the knowledge-based view, the main paths show the knowledge genetic map of the firm. Each node in the main paths inherits knowledge from the ancestor nodes. Thus, we could predict the future possible technologies based on the nodes in the last layer of the main.
The embodied knowledge in the nodes in the last layer could be divided into two types: one is from the internal knowledge flows that are inherited from the ancestor inventions of the company, and the other is the external knowledge from outside the company. Based on the knowledge recombination theory [67,68,69,70,71,72,73], the injected external knowledge is often regarded as the main source of innovation, and so the external knowledge injected to the last nodes can be the signal or major characteristics of the future technologies. Our empirical study in Section 4.3.1 also supports this point: almost half of new emerging CPCs in the main paths have presented in the external citation to their cited nodes in the last layer. Based on this, the CPCs in the external citations of the nodes in the last layer that have not been presented in each sub-domain are utilized to predict the possible new emerging knowledge in the next layer.
As mentioned above, the key inventors’ major technical fields are related to the R&D strategy of a firm, and our experiments also indicate that the key inventors’ recent major technical capability, i.e., CPCs, can be considered as the internal inheritable knowledge (Section 4.3.2). In this study, the key inventors are defined as the inventors with top 1% high degree or top 1% high betweenness indicators among all the inventors in all patents of Samsung Electronics. The key inventors’ recent major technical capability can be analyzed by the top 10 CPCs of all their patents in the recent five years, and their top CPCs that have already appeared in the sub-domain are used to predict the possible future technologies that would appear again in the next layer.
In summary, this paper predicts future technologies based on the key inventors’ recent major CPCs and the CPCs within and injected to the last nodes in each sub-domain. The former denotes the base knowledge that has high possibilities to be employed as ‘backbone’ for the future technologies, and the latter denotes ‘fresh blood’ that is unconventional knowledge for innovative or novel characteristics. Figure 1 illustrates the detailed process to predict future technologies.
In Figure 1, a and b are two last nodes on the main paths for the sub-domain A. a1, a2,, and am (and b1, b2,, and bn) are the cited nodes by the last node a (and b) and so they are neither Samsung Electronics’ inventions, nor on the main paths. The aim is to predict the potential CPCs that would be involved in patent x (the next layer). The CPCs in the external citations that have not presented in the main paths of sub-domain A are identified as New CPCs, which are “fresh blood”, as explained above, and they are possibly involved in patent x as the new technical fields. In this study, the recent capabilities of key inventors in sub-domain A are analyzed based on all the key inventors’ patents published in the last 3 years. Top 10 CPCs in these patents are identified as the “recent capabilities” of the key inventors, and the CPCs that have already appeared among the top 10 are supposed to have high possibilities to be present in patent x.

4. Results and Discussion

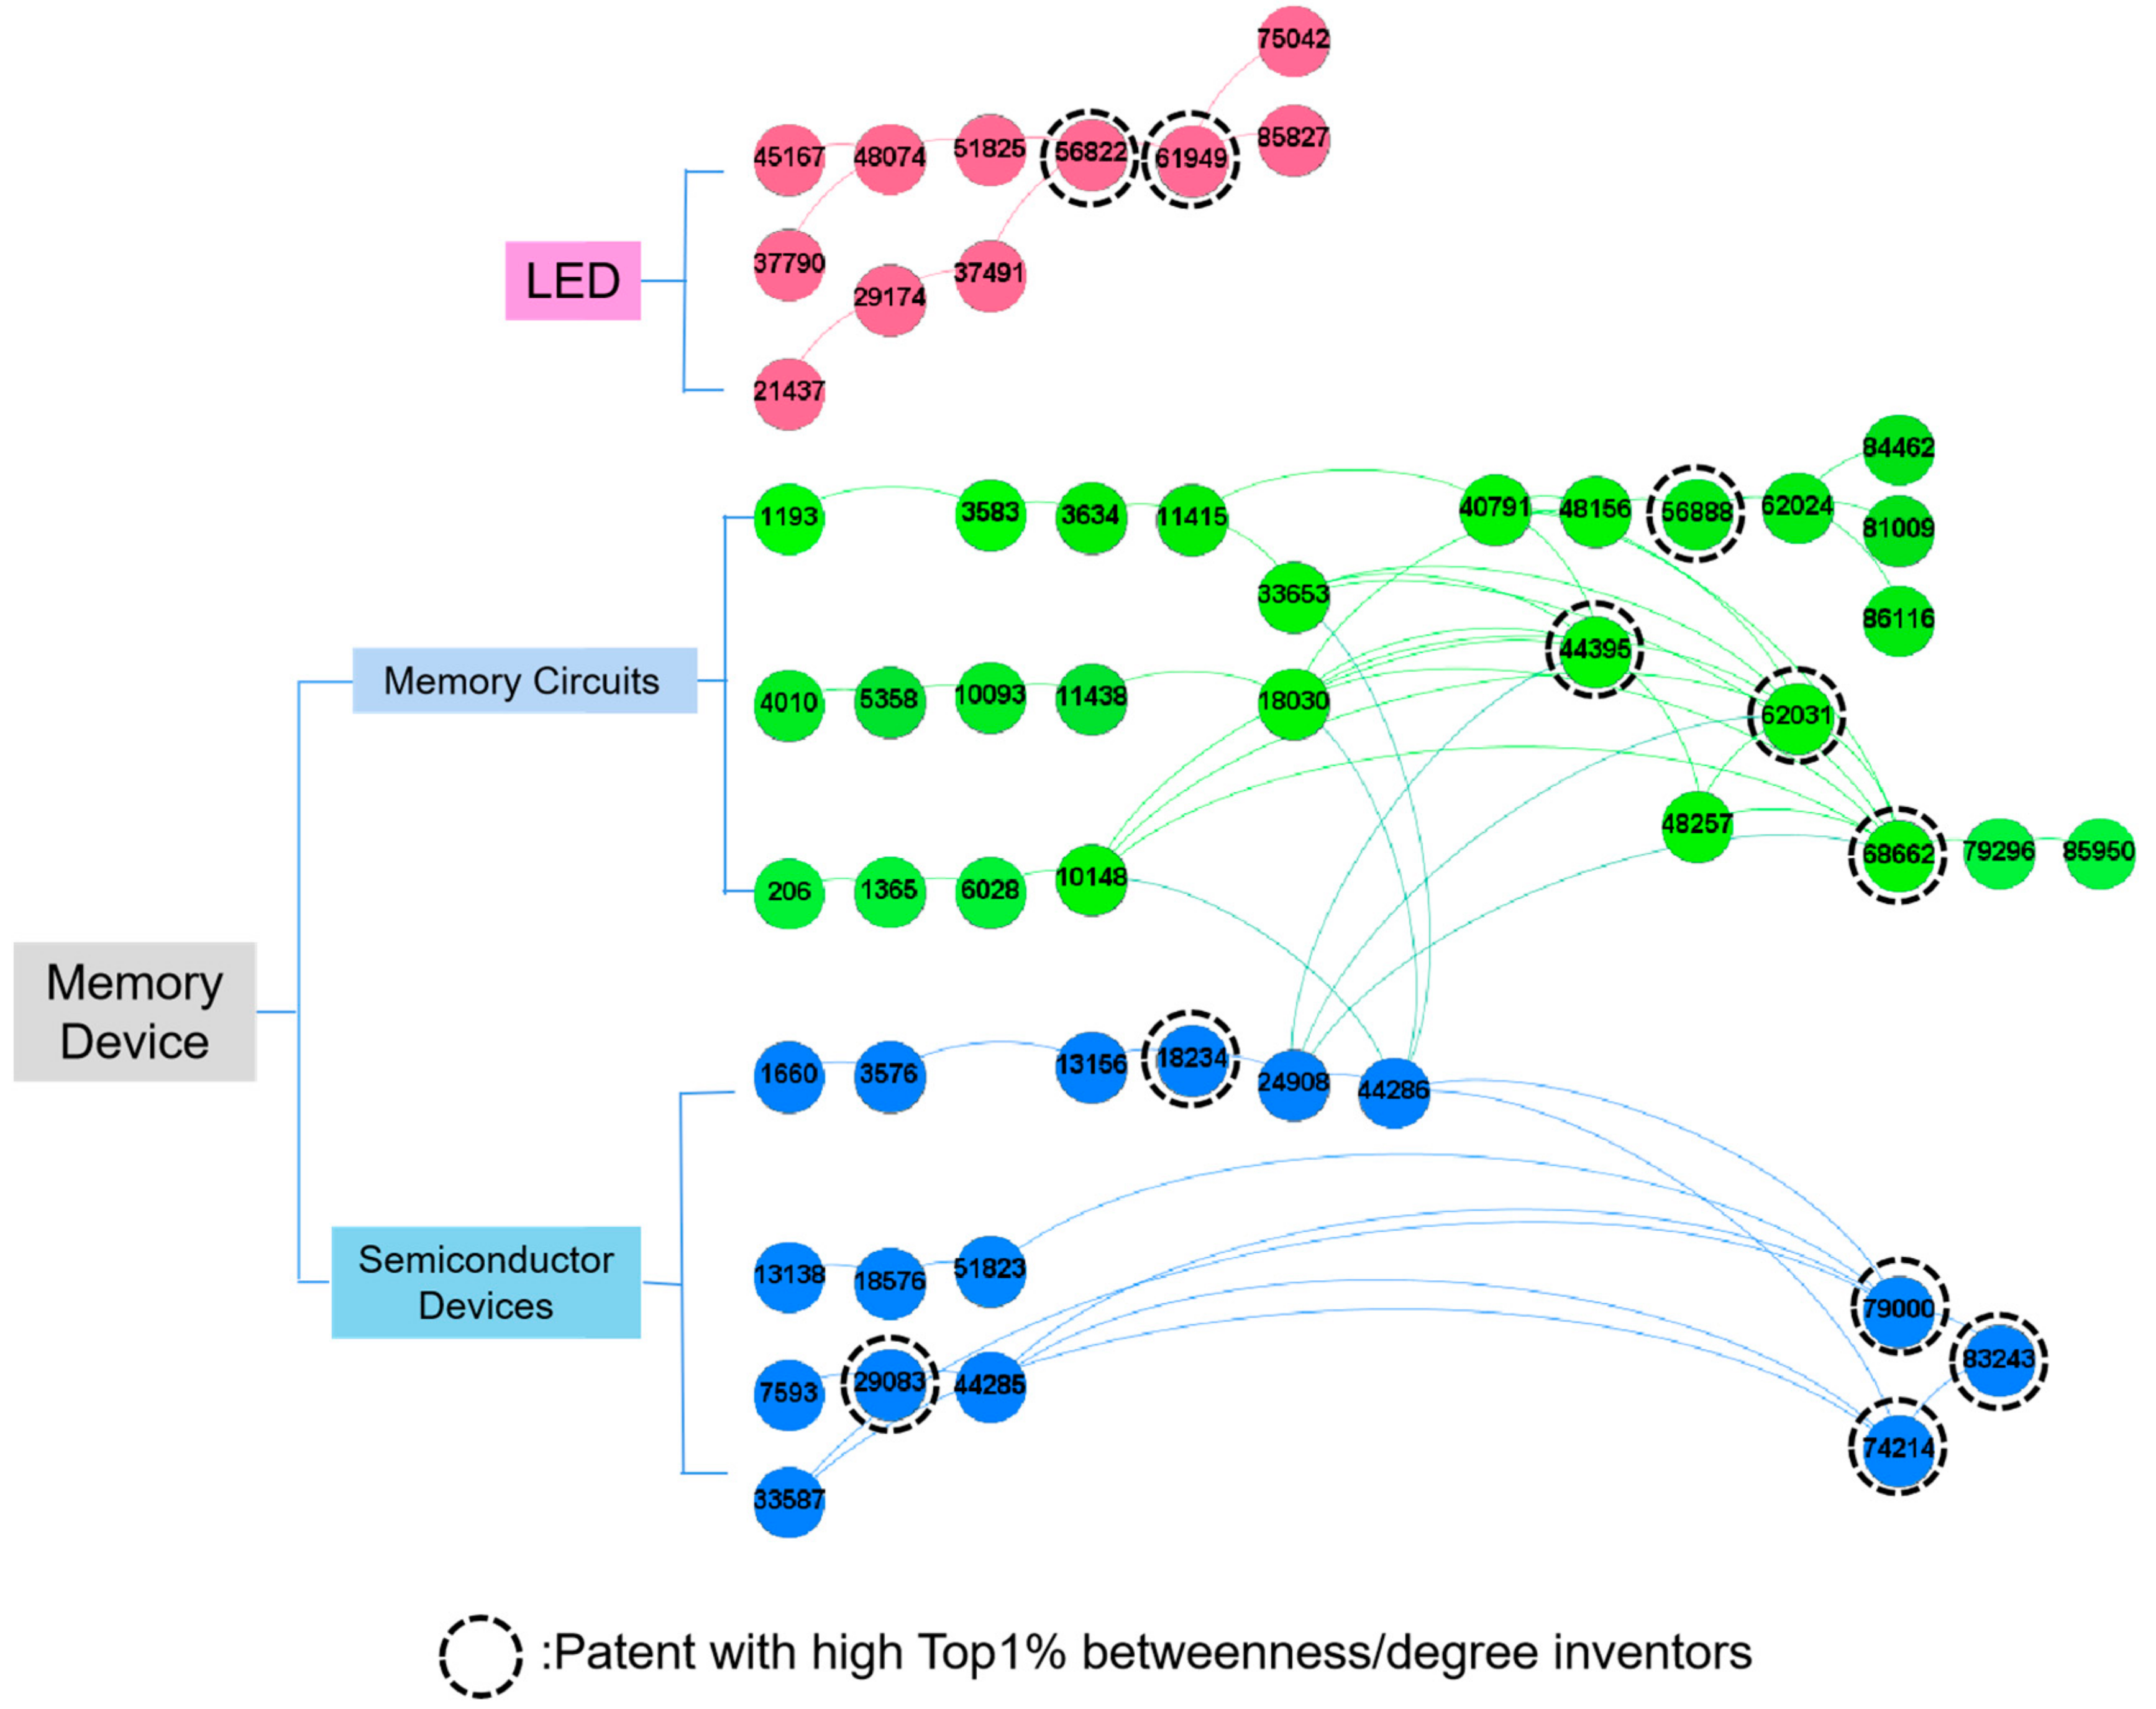
4.1. Internal Knowledge Flows

The initial knowledge network contains 86,429 nodes and 67,729 edges based on the citing–cited relationship. The main paths of Samsung Electronics are generated by KP-based main path analysis, and 54 patents on the main paths were identified (Figure 2).
Based on the topological structure of the patents on the main paths and their specific information (bibliographic information and technical texts of the patents), we divided the technical structure of Samsung Electronics into two main technical fields: LED (including 11 patents on the main paths) and Memory Device (including 43 patents on the main paths). Then the Memory Device domain was divided into the further two sub-domains: Memory Circuits and Semiconductor Devices (Figure 2). The nodes highlighted with the black dotted circle are the patents on the main paths that were invented by the key inventors (the metrics are described in Section 4.2). Table 1 shows the summary table for the results of the main paths and co-inventor network analysis. There are seven key inventors whose inventions are HPPs in the main paths and they are identified. The Semiconductor Devices’ and Memory Circuits’ sub-domains have relatively more key inventors. The LED domain includes only one key inventor in the main paths (Figure 3).

4.2. Key Inventor Identification

4.2.1. Co-Inventor Network Analysis

This research analyzes the co-inventor network of Samsung Electronics patents using the iGraph package for Python. The overall results are as follows (Table 2). First, the density of the network is very low (0.0002). This is because Samsung Electronics has many business units, such as memory, mobile phone, and domestic appliances, and inventors in different business units that are not tightly connected to each other. Second, the mean value of the degree is 1.333 and the standard variation is 2.221. Since most inventions are co-invented, co-inventor network analysis can be properly applied. Finally, the average of betweenness centrality is 24,044.413 and the standard variation is 114,686.498. Since the standard variation is greater than the value of the degree centrality, few inventors have dramatically high betweenness centrality. The result shows that the degree (4.199) and betweenness centrality (147,706.880) in the co-inventor network for 171 inventors on the main paths are both much higher than the average level in the overall network.

4.2.2. Technical Fields of Inventors

The top 20 CPCs of all inventors in Samsung Electronics are shown in Table 3. The result shows that many inventors are involved in semiconductor devices (with six related CPCs), smart phones (five related CPCs), and personal computers (four related CPCs).
The next analysis is about the CPC distribution on the main paths (Table 4). There are 171 inventors on the main paths, and many inventors are involved in CPC G11C/16, which is related to the erasable programmable read-only memories. Among them, 59 inventors are related to G11C16/0483 and some are related to G11C16/10, G11C16/08, G11C16/26 and so on. This shows that Samsung Electronics focuses on the transistor architecture, and memory circuits and memory storage are the core technical areas of Samsung Electronics.

4.2.3. Key Inventors on Main Paths

This paper analyzed the degree and betweenness centrality of each inventor. The inventors having the top 1% degree or betweenness centrality were identified as the key inventors, and 330 key inventors were identified. Table 5 shows the statistical result for the different sets. The average degree of the 330 key inventors is 15,863, and the average betweenness is 1,068,664.526, which are much higher than the average value of all inventors. Among them, seven key inventors have patents on the main paths. Based on the major CPCs of the seven key inventors’ patents, the major technical capability of them were analyzed and shown in Table 5.

4.3. Future R&D Directions

We selected some patents to find the knowledge inheritance phenomenon on the main paths and the relationship between the future technologies and key inventors’ technical capability (Appendix A). The results are shown as follows.

4.3.1. Identification of Newly Injected External Knowledge

The emergence of new technical knowledge in a sub-domain is highly related to the newly injected or adopted external knowledge represented as knowledge flows through backward citations. Among 111 CPCs in the nine selected nodes, 52 CPCs appeared for the first time in the sub-domains, and 23 out of the 52 CPCs were also included in the backward citations of the end-nodes. This result is consistent with the knowledge recombination theory [67,68,69,70,71,72] that stresses the role of unconventional knowledge for creating innovative knowledge.

4.3.2. Identification of Key Inventors’ Capabilities

Among 111 CPCs of the nine selected nodes, 54 CPCs are also frequently included in the key inventors’ patents in the recent five years and so these technical fields (54 CPCs) can be considered as the key inventors’ recent technical capabilities. Most of them (39 CPCs out of 43 CPCs) are not new technical fields, and this shows that the key inventors’ recent technical capabilities are highly related to the inheritable knowledge in the sub-domain (Appendix A). The results indicate that the key inventors’ latest technical capabilities can be the key clue to predict the technical development directions of firms. In particular, the key inventors’ technical capabilities, unlike the external knowledge, can represent the central knowledge basis for corporate R&Ds. Therefore, the future technologies can be predicted based on combining the new technical fields in backward citations of end nodes and the key inventors’ latest (recent five years) technical fields in a sub-domain.

4.3.3. Forecasting Future Technologies

Based on the above results, the external citations of seven patents on the last layer of the main paths, combined with key inventors’ latest major capabilities, are used to extend the last layer of the main paths. Table 6 shows the new CPCs through external citations and the key inventors’ recent CPCs in each of sub-domains, and Table 7 shows keywords and key topics qualitatively extracted from the patents.
The potential technical fields with technical descriptions of each sub-domain of Samsung Electronics were forecasted.
LED: Based on the CPCs H01L33/32 and H01L2924/0002, new CPCs H01L33/38, H01L33/40, or B82Y20/00 can be added in the future. The potential emerging technologies in the LED sub-domain are mainly related to the materials of luminous diodes. For example, CPC B82Y20/00 is related to nano optics (e.g., quantum optics). The quantum dot light emitting diodes (QLED) have both more technical and economic advantages than the organic light-emitting diode (OLED) which is one of the mainstream products now. A GaN (Gallium nitride)-based semiconductor light emitting device is also the potential emerging technology in the future. A GaN-based micro LED developed by Samsung Electronics in recent years will be more efficient and brighter with less power than a liquid crystal display (LCD) or OLED. Besides, technologies related to the LED laser radiation, n-type semiconductor layer, and indium tin oxide (ITO) material could possibly be adopted in the future LED sub-domain.
Memory circuits: Based on CPC G11C16/04, G11C16/34, G11C16/10, G11C16/26, and H01L27/115, the new CPC G11C16/0466, G11C16/0475, or G11C11/5628 can be added to the memory circuit technologies of Samsung Electronics. Specifically, NAND memory technologies have high possibilities to dominate the future directions in the memory sub-domain. NAND memory is one of Samsung Electronics’ main products in recent years. Actually, Samsung Electronics will expand the scale of production of V-NAND and V-NAND chips, and they will become the future dominant memory chip market. The memory cell array which is related to the active region, transistors and interconnection, and the error detection or error correction may still be the key technologies in the future. Technologies related to the word line control circuit, input/output (I/O) data management or control circuits, and programming or writing circuits might be the new important technological topics after the current main paths.
Semiconductor devices: The new CPCs, G06F11/00, G06F11/076, G06F11/08, and so on, will be supplemented based on major base CPCs, including G11C16/0483, G11C16/10, and G11C16/26. Technologies related to memory block, memory circuits, and read voltage seem to last for the next layer. Besides, the technologies related to electrically programmable read-only memories (EPROM) and NAND flash will be in the next layer again. New dominant technologies in this sub-domain will include the word-lines and read voltage technologies. In addition, the semiconductor sector in Samsung Electronics will focus more on some basic technologies, including correct programming, log-likelihood ratio computation and counting exceeding the word or bit in memory.

5. Conclusions

This paper proposes a new method to analyze technical development directions of a company using the KP-based main path analysis and co-inventor network analysis. From the empirical test using the patents of Samsung Electronics, we found the following results and implications. First, the KP-based main path analysis is useful to identify internal knowledge flows of a company and it can properly show the developmental trajectories of each sub-domain, even though the method used only one company’s patents. Second, the combination of KP-based main path analysis and co-inventor network analysis provides the rich information for forecasting a company’s future technical directions. The empirical results show that the new technical capability of key inventors in Samsung Electronics and the newly injected technical knowledge through backward citations were actually identified in the later inventions. This result can support the usefulness of the proposed method.
However, some limitations should be resolved in the future works. First, since this paper mainly focused on developing a new method, we conducted only one empirical case to test the method. However, further research should conduct more empirical analyses for finding potential methodological limitations to be revised and then strengthening the performance and quality. Second, since the method only uses the patent classification information for forecasting, it cannot provide specific directions. One potential idea can be the tracing from the patent classification to the relevant keywords and key-concepts. Therefore, the future work will focus on the method to identify more clear clues for forecasting. Third, the KP-based main path analysis requires a huge computing resource and remains as further qualitative work for decomposing the main paths into sub-domains. In the further work, the KP calculation algorithm should be revised to reduce the computing time, and the technique to decompose the main paths into several sub-domains should be focused on. Fourth, although the method and its empirical result seems to be useful for forecasting the future technologies after the last layer of the main paths, further research should concentrate on improving prediction power of the method. One possible attempt is to supplement other technical documents, e.g., papers. By analyzing the main paths and inventor network using papers of the company, some information that cannot be identified from a patent analysis might be identified. Moreover, patents and papers can be linked through their citations, and it can provide rich information for increasing prediction power. Lastly, this paper qualitatively described the details of future technologies to increase the quality of forecasting. Even though a qualitative effort is still important and critical to provide the detailed and complex implications, it is useful or worthwhile to apply a quantitative approach for reducing cost and time and providing more robust information. In fact, we tested some NLP (Natural Language Processing) tools, including RAKE [74], Topic modeling [75], and TextRank [76], for extracting keywords or key phrases in a patent. Some extracted keywords were helpful to understand the details of inventions, but most of the keywords were insufficient to represent the technical knowledge of the inventions. Therefore, the further research will focus on how to extract key information of the clue inventions for better forecasting the technical directions.

Author Contributions

Conceptualization: F.H. and H.P., Methodology: F.H., S.Y., N.R. and H.P., Validation: F.H., N.R. and H.P., Data curation: F.H. and S.Y., Writing: F.H. and H.P., Review and editing: N.R. and H.P., Visualization: F.H. and S.Y., Funding acquisition: H.P., Supervision: H.P. All authors have read and agreed to the published version of the manuscript.

Funding

This research was supported by the Ministry of Education of the Republic of Korea and the National Research Foundation of Korea (No. 2019S1A5A8036427) and supported by Hanyang University (Grant number: HY-2020).

Institutional Review Board Statement

Not applicable.

Informed Consent Statement

Informed consent was obtained from all subjects involved in the study.

Data Availability Statement

Data are not publicly available, though the data may be made available on request from the corresponding author.

Conflicts of Interest

The authors declare no conflict of interest.

Appendix A

Table A1. Summary of CPCs for forecasting technical directions.
Patent IDCPCNew in Sub-DomainIn External CitationsRecent Major Capabilities of Key Inventor (s)
Memory Circuits86116G11C11/4074O
G11C5/025 O
G11C5/06O
G11C11/409O
G11C11/4085O
G11C16/0483OOO
G11C16/10OOO
G11C16/26OOO
G06F11/141O
G11C11/5621OO
G11C16/08 OO
G11C16/3427 OO
G11C29/021O O
G11C29/028O O
G11C29/52O O
G11C2029/0411O O
G11C2211/5648O
G06F11/00O
81009G11C16/0483 OO
H01L27/11582 OO
G11C16/10 OO
H01L27/11556OOO
G11C16/26 OO
G11C16/24 O
G11C16/3404O
G11C8/08OO
G11C8/12 O
G11C16/08 OO
G11C16/3427 OO
84462G11C16/0483 OO
G11C11/5671O
G11C16/08 OO
G11C16/10 OO
G11C16/12 O
G11C16/26 OO
H01L27/11582 OO
G11C16/30 OO
G11C5/04O
G11C11/5628OOO
G11C11/5642OOO
G11C16/3404
Semiconductor Device44286G11C16/04 OO
G11C16/08 OO
G11C16/16 OO
G11C16/14 O
H01L27/1157 O
H01L27/11582 O
51823H01L29/7889O
H01L29/7926
G11C16/3418O O
G11C16/0483 OO
H01L27/11582
H01L27/11556 O
G11C16/10 O
79000G11C16/28O
G11C11/5628OOO
G11C11/5642 OO
G11C16/04 OO
G11C16/0466 O
G11C16/0483 OO
G11C16/26 OO
G11C16/3495O O
G11C29/021
G11C29/028 O
G11C29/50004 O
G11C16/10 OO
G11C2211/5634O
G11C2029/5004
G11C11/5671OO
G11C2211/563O
74214G11C29/50004O
G11C16/0466OO
G11C16/10 OO
G11C16/26OOO
G11C16/0483 OO
G11C2029/5004O
G11C11/5642OOO
G11C29/021O
G11C29/028OO
LED75042H01L33/387 OO
H01L33/32 OO
H01L33/42OO
H01L33/46OO
H01L33/54O
H01L33/62 OO
H01L2933/0016 OO
H01L33/06OO
H01L33/10O
H01L2224/48091 O
H01L33/405 OO
H01L2224/16245O
H01L2924/00014 O
H01L33/382 OO
H01L33/48O
H01L33/60OO
85827H01L33/42 O
H01L33/54
H01L33/46 O
H01L33/62 OO
H01L33/32 OO
H01L33/387 OO
H01L33/405 OO
H01L2224/16245
H01L33/10
H01L33/06 O
H01L2224/48091 O
H01L2933/0016 OO
H01L33/382 OO
H01L33/48
H01L33/60 O
H01L2924/00014 O

References

  1. Lee, S.; Yoon, B.; Park, Y. An approach to discovering new technology opportunities: Keyword-Based patent map approach. Technovation 2009, 29, 481–497. [Google Scholar] [CrossRef]
  2. Daim, T.U.; Rueda, G.; Martin, H.; Gerdsri, P. Forecasting emerging technologies: Use of bibliometrics and patent analysis. Technol. Forecast. Soc. Chang. 2006, 73, 981–1012. [Google Scholar] [CrossRef]
  3. Zhang, Y.; Porter, A.L.; Hu, Z.; Guo, Y.; Newman, N.C. “Term clumping” for technical intelligence: A case study on dye-sensitized solar cells. Technol. Forecast. Soc. Chang. 2014, 85, 26–39. [Google Scholar] [CrossRef]
  4. Moehrle, M.G.; Caferoglu, H. Technological speciation as a source for emerging technologies. Using semantic patent analysis for the case of camera technology. Technol. Forecast. Soc. Chang. 2019, 146, 776–784. [Google Scholar] [CrossRef]
  5. Park, H.; Yoon, J.; Kim, K. Identification and evaluation of corporations for merger and acquisition strategies using patent information and text mining. Scientometrics 2013, 97, 883–909. [Google Scholar] [CrossRef]
  6. Yoon, J.; Park, H.; Kim, K. Identifying technological competition trends for R&D planning using dynamic patent maps: SAO-based content analysis. Scientometrics 2013, 94, 313–331. [Google Scholar]
  7. Mun, C.; Yoon, S.; Raghavan, N.; Hwang, D.; Basnet, S.; Park, H. Function score-based technological trend analysis. Technovation 2021, 101, 102199. [Google Scholar] [CrossRef]
  8. Mun, C.; Kim, Y.; Yoo, D.; Yoon, S.; Hyun, H.; Raghavan, N.; Park, H. Discovering business diversification opportunities using patent information and open innovation cases. Technol. Forecast. Soc. Chang. 2019, 139, 144–154. [Google Scholar] [CrossRef]
  9. Zeng, F.; Lee, S.H.N.; Lo, C.K.Y. The role of information systems in the sustainable development of enterprises: A systematic literature network analysis. Sustainability 2020, 12, 3337. [Google Scholar] [CrossRef] [Green Version]
  10. Filippin, F. Do main paths reflect technological trajectories? Applying main path analysis to the semiconductor manufacturing industry. Scientometrics 2021, 126, 6443–6477. [Google Scholar] [CrossRef]
  11. Wang, B.; Wang, Y.; Zhao, Y. Collaborative Governance Mechanism of Climate Change and Air Pollution: Evidence from China. Sustainability 2021, 13, 6785. [Google Scholar] [CrossRef]
  12. Wu, Q.; Tambunlertchai, K.; Pornchaiwiseskul, P. Examining the impact and influencing channels of carbon emission trading pilot markets in China. Sustainability 2021, 13, 5664. [Google Scholar] [CrossRef]
  13. Yu, D.; Yan, Z. Knowledge diffusion of supply chain bullwhip effect: Main path analysis and science mapping analysis. Scientometrics 2021, 126, 8491–8515. [Google Scholar] [CrossRef]
  14. Rejeb, A.; Rejeb, K.; Abdollahi, A.; Zailani, S.; Iranmanesh, M.; Ghobakhloo, M. Digitalization in food supply chains: A bibliometric review and key-route main path analysis. Sustainability 2022, 14, 83. [Google Scholar] [CrossRef]
  15. Carley, K.M.; Hummon, N.P.; Harty, M. Scientific influence: An analysis of the main path structure in the Journal of Conflict Resolution. Knowledge 1993, 14, 417–447. [Google Scholar] [CrossRef]
  16. Verspagen, B. Mapping technological trajectories as patent citation networks: A study on the history of fuel cell research. Adv. Complex Syst. 2007, 10, 93–115. [Google Scholar] [CrossRef] [Green Version]
  17. Xiao, Y.; Lu, L.Y.; Liu, J.S.; Zhou, Z. Knowledge diffusion path analysis of data quality literature: A main path analysis. J. Informetr. 2014, 8, 594–605. [Google Scholar] [CrossRef]
  18. Liang, H.; Wang, J.-J.; Xue, Y.; Cui, X. IT outsourcing research from 1992 to 2013: A literature review based on main path analysis. Inf. Manag. 2016, 53, 227–251. [Google Scholar] [CrossRef]
  19. Lu, L.Y.; Hsieh, C.-H.; Liu, J.S. Development trajectory and research themes of foresight. Technol. Forecast. Soc. Chang. 2016, 112, 347–356. [Google Scholar] [CrossRef]
  20. Lu, L.Y.; Liu, J.S. A novel approach to identify the major research themes and development trajectory: The case of patenting research. Technol. Forecast. Soc. Chang. 2016, 103, 71–82. [Google Scholar] [CrossRef]
  21. You, D.; Park, H. Developmental trajectories in electrical steel technology using patent information. Sustainability 2018, 10, 2728. [Google Scholar] [CrossRef]
  22. Fu, H.; Wang, M.; Li, P.; Jiang, S.; Hu, W.; Guo, X.; Cao, M. Tracing knowledge development trajectories of the internet of things domain: A main path analysis. IEEE Trans. Ind. Inform. 2019, 15, 6531–6540. [Google Scholar] [CrossRef]
  23. Yoon, S.; Mun, C.; Raghavan, N.; Hwang, D.; Kim, S.; Park, H. Hierarchical main path analysis to identify decompositional multi-knowledge trajectories. J. Knowl. Manag. 2020, 25, 454–476. [Google Scholar] [CrossRef]
  24. Zhang, B.; Ma, L.; Liu, Z. Literature Trend Identification of Sustainable Technology Innovation: A Bibliometric Study Based on Co-Citation and Main Path Analysis. Sustainability 2020, 12, 8664. [Google Scholar] [CrossRef]
  25. Yu, D.; Pan, T. Tracing knowledge diffusion of TOPSIS: A historical perspective from citation network. Expert Syst. Appl. 2021, 168, 114238. [Google Scholar] [CrossRef]
  26. Yu, D.; Sheng, L. Influence difference main path analysis: Evidence from DNA and blockchain domain citation networks. J. Informetr. 2021, 15, 101186. [Google Scholar] [CrossRef]
  27. Weiss, D.; Scherer, P. Mapping the Territorial Adaptation of Technological Innovation Systems—Trajectories of the Internal Combustion Engine. Sustainability 2022, 14, 113. [Google Scholar] [CrossRef]
  28. Kim, S.; Yoon, S.; Raghavan, N.; Le, N.-T.; Park, H. Developmental Trajectories in Blockchain Technology Using Patent-Based Knowledge Network Analysis. IEEE Access 2021, 9, 44704–44717. [Google Scholar] [CrossRef]
  29. Park, H.; Magee, C.L. Tracing technological development trajectories: A genetic knowledge persistence-based main path approach. PLoS ONE 2017, 12, e0170895. [Google Scholar] [CrossRef]
  30. Cantner, U.; Graf, H. The network of innovators in Jena: An application of social network analysis. Res. Policy 2006, 35, 463–480. [Google Scholar] [CrossRef]
  31. Ter Wal, A.L.; Boschma, R.A. Applying social network analysis in economic geography: Framing some key analytic issues. Ann. Reg. Sci. 2009, 43, 739–756. [Google Scholar] [CrossRef] [Green Version]
  32. Zhu, L.; Zhu, D.; Wang, X.; Cunningham, S.W.; Wang, Z. An integrated solution for detecting rising technology stars in co-inventor networks. Scientometrics 2019, 121, 137–172. [Google Scholar] [CrossRef]
  33. Turkina, E.; Oreshkin, B. The Impact of Co-Inventor Networks on Smart Cleantech Innovation: The Case of Montreal Agglomeration. Sustainability 2021, 13, 7270. [Google Scholar] [CrossRef]
  34. Hummon, N.P.; Dereian, P. Connectivity in a citation network: The development of DNA theory. Soc. Netw. 1989, 11, 39–63. [Google Scholar] [CrossRef]
  35. Kostoff, R.N.; Schaller, R.R. Science and technology roadmaps. IEEE Trans. Eng. Manag. 2001, 48, 132–143. [Google Scholar] [CrossRef] [Green Version]
  36. Garfield, E. Historiographic mapping of knowledge domains literature. J. Inf. Sci. 2004, 30, 119–145. [Google Scholar] [CrossRef]
  37. Lucio-Arias, D.; Leydesdorff, L. Main-Path analysis and path-dependent transitions in HistCite™-based historiograms. J. Am. Soc. Inf. Sci. Technol. 2008, 59, 1948–1962. [Google Scholar] [CrossRef]
  38. Fontana, R.; Nuvolari, A.; Verspagen, B. Mapping technological trajectories as patent citation networks. An application to data communication standards. Econ. Innov. N. Technol. 2009, 18, 311–336. [Google Scholar] [CrossRef]
  39. Hung, S.-C.; Liu, J.S.; Lu, L.Y.; Tseng, Y.-C. Technological change in lithium iron phosphate battery: The key-route main path analysis. Scientometrics 2014, 100, 97–120. [Google Scholar] [CrossRef]
  40. Jaffe, A.B.; De Rassenfosse, G. Patent citation data in social science research: Overview and best practices. In Research Handbook on the Economics of Intellectual Property Law; Edward Elgar Publishing: Cheltenham, UK, 2019. [Google Scholar]
  41. Hughes, A.; Mina, A. The Impact of the Patent System on SMEs; University of Cambridge, Centre for Business Research: Cambridge, UK, 2010. [Google Scholar]
  42. Barberá-Tomás, D.; Jiménez-Sáez, F.; Castelló-Molina, I. Mapping the importance of the real world: The validity of connectivity analysis of patent citations networks. Res. Policy 2011, 40, 473–486. [Google Scholar] [CrossRef] [Green Version]
  43. Martinelli, A. An emerging paradigm or just another trajectory? Understanding the nature of technological changes using engineering heuristics in the telecommunications switching industry. Res. Policy 2012, 41, 414–429. [Google Scholar] [CrossRef] [Green Version]
  44. Epicoco, M. Knowledge patterns and sources of leadership: Mapping the semiconductor miniaturization trajectory. Res. Policy 2013, 42, 180–195. [Google Scholar] [CrossRef] [Green Version]
  45. Nomaler, Ö.; Verspagen, B. River deep, mountain high: Of long run knowledge trajectories within and between innovation clusters. J. Econ. Geogr. 2016, 16, 1259–1278. [Google Scholar] [CrossRef] [Green Version]
  46. Dehdarian, A.; Tucci, C.L. A complex network approach for analyzing early evolution of smart grid innovations in Europe. Appl. Energy 2021, 298, 117143. [Google Scholar] [CrossRef]
  47. Tseng, F.-M.; Gil, E.I.N.P.; Lu, L.Y. Developmental trajectories of blockchain research and its major subfields. Technol. Soc. 2021, 66, 101606. [Google Scholar] [CrossRef]
  48. Xuefeng, W.; Jie, R.; Youguo, W. Co-Inventor analysis on China’s international technology collaboration in US patent activities: 1976–2010. Procedia Eng. 2012, 37, 314–322. [Google Scholar] [CrossRef] [Green Version]
  49. Cassi, L.; Plunket, A. Research collaboration in co-inventor networks: Combining closure, bridging and proximities. Reg. Stud. 2015, 49, 936–954. [Google Scholar] [CrossRef]
  50. Tóth, G.; Lengyel, B. Inter-Firm inventor mobility and the role of co-inventor networks in producing high-impact innovation. J. Technol. Transf. 2021, 46, 117–137. [Google Scholar] [CrossRef] [Green Version]
  51. Bednarz, M.; Broekel, T. The relationship of policy induced R&D networks and inter-regional knowledge diffusion. J. Evol. Econ. 2019, 29, 1459–1481. [Google Scholar]
  52. Pinto, P.E.; Vallone, A.; Honores, G. The structure of collaboration networks: Findings from three decades of co-invention patents in Chile. J. Informetr. 2019, 13, 100984. [Google Scholar] [CrossRef]
  53. Van der Wouden, F.; Rigby, D.L. Co-Inventor networks and knowledge production in specialized and diversified cities. Pap. Reg. Sci. 2019, 98, 1833–1853. [Google Scholar] [CrossRef]
  54. Abbasiharofteh, M.; Kogler, D.F.; Lengyel, B. Atypical combination of technologies in regional co-inventor networks. Pap. Evol. Econ. Geogr. 2020, 20, 1–35. [Google Scholar]
  55. Shkolnykova, M. Who shapes plant biotechnology in Germany? Joint analysis of the evolution of co-authors’ and co-inventors’ networks. Rev. Evol. Political Econ. 2021, 2, 27–54. [Google Scholar] [CrossRef]
  56. Tóth, G.; Juhász, S.; Elekes, Z.; Lengyel, B. Repeated collaboration of inventors across European regions. Eur. Plan. Stud. 2021, 29, 2252–2272. [Google Scholar] [CrossRef]
  57. Cassi, L.; Plunket, A. The Determinants of Co-Inventor tie Formation: Proximity and Network Dynamics; MPRA Paper: Munich, Germany, 2010. [Google Scholar]
  58. Perri, A.; Scalera, V.G.; Mudambi, R. An analysis of the co-inventor networks associated with the Chinese pharmaceutical industry. In Proceedings of the DRUID15, Rome, Italy, 15 June 2015. [Google Scholar]
  59. Choi, S.; Park, H. Investigation of strategic changes using patent co-inventor network analysis: The case of samsung electronics. Sustainability 2016, 8, 1315. [Google Scholar] [CrossRef] [Green Version]
  60. Miyashita, S.; Katoh, S.; Anzai, T.; Sengoku, S. Intellectual Property Management in Publicly Funded R&D Program and Projects: Optimizing Principal–Agent Relationship through Transdisciplinary Approach. Sustainability 2020, 12, 9923. [Google Scholar]
  61. Pinto, P.E.; Honores, G.; Vallone, A. Exploring the topology and dynamic growth properties of co-invention networks and technology fields. PLoS ONE 2021, 16, e0256956. [Google Scholar] [CrossRef]
  62. Han, Y.-J.; Park, Y. Patent network analysis of inter-industrial knowledge flows: The case of Korea between traditional and emerging industries. World Pat. Inf. 2006, 28, 235–247. [Google Scholar] [CrossRef]
  63. Lei, X.-P.; Zhao, Z.-Y.; Zhang, X.; Chen, D.-Z.; Huang, M.-H.; Zheng, J.; Liu, R.-S.; Zhang, J.; Zhao, Y.-H. Technological collaboration patterns in solar cell industry based on patent inventors and assignees analysis. Scientometrics 2013, 96, 427–441. [Google Scholar] [CrossRef]
  64. Mun, C.; Yoon, S.; Kim, Y.; Raghavan, N.; Park, H. Quantitative identification of technological paradigm changes using knowledge persistence. PLoS ONE 2019, 14, e0220819. [Google Scholar] [CrossRef] [Green Version]
  65. Park, H.; Magee, C.L. Quantitative identification of technological discontinuities. IEEE Access 2019, 7, 8135–8150. [Google Scholar] [CrossRef]
  66. Marin, A.; Wellman, B. Social network analysis: An introduction. SAGE Handb. Soc. Netw. Anal. 2011, 11, 25. [Google Scholar]
  67. Nelson, R.R.; Winter, S.G. An Evolutionary Theory of Economic Change; Harvard University Press: Cambridge, MA, USA, 1982. [Google Scholar]
  68. Weitzman, M.L. Recombinant growth. Q. J. Econ. 1998, 113, 331–360. [Google Scholar] [CrossRef]
  69. Fleming, L. Recombinant uncertainty in technological search. Manag. Sci. 2001, 47, 117–132. [Google Scholar] [CrossRef]
  70. Schilling, M.A.; Green, E. Recombinant search and breakthrough idea generation: An analysis of high impact papers in the social sciences. Res. Policy 2011, 40, 1321–1331. [Google Scholar] [CrossRef]
  71. Nakamura, H.; Suzuki, S.; Sakata, I.; Kajikawa, Y. Knowledge combination modeling: The measurement of knowledge similarity between different technological domains. Technol. Forecast. Soc. Chang. 2015, 94, 187–201. [Google Scholar] [CrossRef] [Green Version]
  72. Appio, F.P.; Martini, A.; Fantoni, G. The light and shade of knowledge recombination: Insights from a general-purpose technology. Technol. Forecast. Soc. Chang. 2017, 125, 154–165. [Google Scholar] [CrossRef]
  73. Xiao, T.; Makhija, M.; Karim, S. A Knowledge Recombination Perspective of Innovation: Review and New Research Directions. J. Manag. 2021, 01492063211055982. [Google Scholar] [CrossRef]
  74. Rose, S.; Engel, D.; Cramer, N.; Cowley, W. Automatic keyword extraction from individual documents. Text Min. Appl. Theory 2010, 1, 1–20. [Google Scholar]
  75. Blei, D.M.; Ng, A.Y.; Jordan, M.I. Latent dirichlet allocation. J. Mach. Learn. Res. 2003, 3, 993–1022. [Google Scholar]
  76. Mihalcea, R.; Tarau, P. Textrank: Bringing order into text. In Proceedings of the 2004 Conference on Empirical Methods in Natural Language Processing; Association for Computational Linguistics: Barcelona, Spain, 2004; Volume 2004, pp. 404–411. [Google Scholar]
Figure 1. Backward and forward searching for main path identification.
Sustainability 14 03117 g001
Figure 2. The process of predicting future technologies.
Sustainability 14 03117 g002
Figure 3. Main paths of Samsung Electronics.
Sustainability 14 03117 g003
Table 1. Result summary.
Sub-Domain# Patents# Key InventorsKey InventorsDegreeBetweennessMajor Technical Capabilities
LED111KIM,TAE HYUNG12863,637.760 H01L51/502, C09K11/883, H01L33/0093, H01L33/32, H01L51/5072
Memory circuits274SON,HONGRAK23749,000.051 G11C16/26, G11C16/0483, G11C11/5642, G11C16/10, G11C11/5628
KONG,JUNJIN271,893,719.455 G11C11/5628, G11C11/5642, G11C16/10, G11C16/0483, G11C16/26
PARK,KITAE10735,754.670 G11C16/0483, G11C16/10, G11C16/26, G11C11/5628, G11C16/08
JANG,JAEHOON10819,919.954 H01L27/11582, G11C16/0483, H01L27/11556, H01L27/11551, H01L27/1157
Semiconductor devices105PARK,KITAE10735,754.670 G11C16/0483, G11C16/10, G11C16/26, G11C11/5628, G11C16/08
CHOI,JUNGDAL17365,547.398 H01L27/115, G11C16/0483, H01L27/11521, H01L27/11524, H01L27/11568
KONG,JUNJIN271,893,719.455 G11C11/5628, G11C11/5642, G11C16/10, G11C16/0483, G11C16/26
SON,HONGRAK23749,000.051 G11C16/26, G11C16/0483, G11C11/5642, G11C16/10, G11C11/5628
BYEON,DAESEOK15365,547.398 G11C16/0483, G11C16/10, G11C16/26, G11C16/08, G11C16/30
Total547
Table 2. Co-inventor network analysis for whole patents and patents on main paths.
DensityDegree (All Inventors)Betweenness (All Inventors)Degree (171 Inventors on Main Paths) Betweenness (171 Inventors on Main Paths)
Mean0.00021.33324,044.4134.199147,706.880
Standard Deviation2.221114,686.4985.364309,291.731
Table 3. Inventor distribution for top 20 CPCs.
IDCPCClass DefinitionTechnical Field # Inventor
1H01L2924/00Indexing scheme for arrangements or methods for connecting or disconnecting semiconductor or solid-state bodies, as covered by H01L 24/00Semiconductor devices3231
2H01L2924/0002Technical content checked by a classifier2276
3H01L2924/00014The subject-matter covered by the group, the symbol of which is combined with the symbol of this group, being disclosed without further technical details2059
4G06F3/0488using a touch-screen or digitizer, e.g., input of commands through traced gesturesSmart phone1813
5Y02D30/70Reducing energy consumption in wireless communication networksWireless network solution1797
6G06F3/04883Inputting data by handwriting, e.g., gesture or textSmart phone 1744
7Y02D10/00Energy efficient computing, e.g., low power processors, power management or thermal managementBase technology1725
8G06F3/0482Interaction with lists of selectable items, e.g., menusSmart phone1698
9H01L2224/48091Arched loop shape of an individual wire connectorSemiconductor devices1493
10H01L2924/00012Indexing scheme for arrangements or methods for connecting or disconnecting semiconductor or solid-state bodies, as covered by H01L 24/001325
11H04W4/80Services using short range communication, e.g., near-field communication [NFC], radio-frequency identification [RFID] or low energy communicationSmart phone1313
12G06F3/04842Selection of displayed objects or displayed text elementsSemiconductor devices1221
13H01L2924/181Encapsulation1216
14H04W88/02Terminal devices specially adapted for wireless communication networks, e.g., terminals, base stations or access point devicesWireless communication 1204
15G06F3/0481Based on specific properties of the displayed interaction object or a metaphor-based environment, e.g., interaction with desktop elements like windows or icons, or assisted by a cursor’s changing behavior or appearancePersonal computer1195
16G06F3/14Digital output to display device1169
17B82Y10/00Nanotechnology for information processing, storage or transmission, e.g., quantum computing or single electron logicSmart phone1111
18G06F3/04817Interaction techniques based on graphical user interfaces [GUI] using iconsPersonal computer1104
19G06F1/1626with a single-body enclosure integrating a flat display, e.g., Personal Digital Assistants1103
20G06F3/04886Interaction techniques based on graphical user interfaces [GUI] by partitioning the display area of the touch-screen or the surface of the digitizing tablet into independently controllable areas, e.g., virtual keyboards or menus1068
Table 4. Inventor distribution for top 10 CPCs on main paths.
IDCPC# InventorsCPC Definition
1G11C16/048359Comprising cells having several storage transistors connected in series
2G11C16/1043Programming or data input circuits
3G11C16/0836Address circuits; decoders; word-line control circuits
4G11C16/2631Sensing or reading circuits; data output circuits
5G11C16/1623For erasing blocks, e.g., arrays, words, groups
6G11C16/1421Circuits for erasing electrically, e.g., erase voltage switching circuits
7G11C16/1219Programming voltage switching circuits
8G11C16/0617Auxiliary circuits, e.g., for writing into memory
9H01L27/11517Electrically programmable read-only memories; multistep manufacturing processes therefor
10H01L27/1155617Channels comprising vertical portions, e.g., U-shaped channels
Table 5. Key inventors (top 1% in whole networks) on main paths.
InventorBetweennessDegreePatents on Main PathsMajor Capabilities
KIM, TAE HYUNG863,637.760123LED materials and structures
SON, HONG RAK749,000.051233Programming; data I/O circuits
JANG, JAE HOON819,919.954102Channel design; read-only memories
PARK, KITAE735,754.670101Data I/O circuits; decoders; word-line control
BYEON, DAE SEOK365,547.398153Decoders; power supply circuits; data I/O circuits
CHOI, JUNG DAL697,039.692171Transistors; memory core region; read-only memories
KONG, JUN JIN1,893,719.455273Programming; data I/O circuits
Average874,945.56916.286
All inventors of Samsung Patents *24,044.4131.333
All key inventors of Samsung Patents *1,068,664.52615.864
LED *143,398.2444.412
Memory circuits *152,559.9053.788
Flash memory *113,652.8203.538
Semiconductor device *177,307.2104.712
*: The average value of inventors in the set.
Table 6. CPCs for forecasting future directions.
Sub-DomainPatent IDNew CPCs in External CitationsRecent Major CPCs of Key Inventors
LED75042H01L33/38
H01L33/40
B82Y20/00
H01L33/36
H01L21/268
H01L2224/45144
H01L2224/48463
H01L2224/85181
H01L33/30
H01L2224/1403
...
H01L33/32
H01L2924/0002
85827
Memory Circuits84462G11C16/0466
G11C16/0475
G11C11/5628
G11C16/04
G11C11/4074
G11C11/4085
G11C11/4096
G11C11/5635
G11C11/5642
G11C11/5671
...
G11C16/04
G11C16/34
G11C16/10
G11C16/26
H01L27/115
81009
86116
85950
Semiconductor Devices83243G06F11/00
G06F11/076
G06F11/08
G06F11/1068
G06F11/1072
G06F12/0246
G11C16/3404
G11C16/3454
H03M13/3927
G11C16/00
...
G11C16/0483
G11C16/10
G11C16/26
G11C11/5628
G11C11/5642
H01L27/115
G11C16/08
G11C16/3418
H01L27/11521
H01L27/11524
Table 7. Keywords and key topics extracted from patents of key inventors and external citations.
LEDMemory CircuitsSemiconductor Devices
Recent major capabilities from key inventors (existing keywords from key inventors’ patents)first electrode layer
first light
first semiconductor layer
insulating layer
second electrode layer
semiconductor device
control logic
flag cells
nonvolatile memory device
plurality of memory cells
plurality of word lines
upper surface
word line driver
word line voltages
NAND memory
bit line
controls operation
erasing method
external device
memory block
memory cells
nonvolatile memory device
plurality of word lines
plurality of memory cells
read command with respect
read operation
selected memory block
voltage generator
New or unconventional keywords from external citationsdistributed bragg reflection
n-type semiconductor layer
ITO DBR layer
ohmic contact layer
GaN-based semiconductor layer
upper surface
dummy string selection
horizontal layers
memory cells coupled
string selection transistors
unselected word line
word line driver
upper word line
unselected word lines
unselect read voltage
sampling read voltage
reference pages
lower word line
level look-up table
cell counting operation
Publisher’s Note: MDPI stays neutral with regard to jurisdictional claims in published maps and institutional affiliations.

