Article

Towards Understanding the Landscapes of Neighbourhood Research: An Insight from Bibliometric Analysis

1
Department of Environment and Geography, University of York, 290 Wentworth Way, Heslington, York YO10 5NG, UK
2
GCRF Centre for Sustainable, Healthy and Learning Cities and Neighbourhoods, School of Social and Political Sciences, University of Glasgow, 40 Bute Gardens, Glasgow G12 8RS, UK
*
Author to whom correspondence should be addressed.
Sustainability 2022, 14(5), 3115; https://doi.org/10.3390/su14053115
Submission received: 30 December 2021 / Revised: 25 February 2022 / Accepted: 1 March 2022 / Published: 7 March 2022
(This article belongs to the Section Social Ecology and Sustainability)

Abstract

:
The concept of neighbourhood remains contested and negotiated, and how to define it continues to be subject to debate. Neighbourhood is important for understanding social processes, behavioural characteristics, policy implementation and development initiatives. Until now, no attempt has been made to statistically characterise the field. This study aims to provide a macroscopic overview using bibliometric analysis of the main characteristics of neighbourhood research publications in order to understand the academic landscape. This characterisation will help to understand the scholarship nuances, which are often difficult to grasp by reading selected academic papers. The study analyses the emergence and evolution of the concept of neighbourhood in published research, its global regional distribution and extent of collaboration between regions, the contribution of institutions, author and journal productivity, as well as scholarship clusters of neighbourhood publications. The paper shows that the subfield of neighbourhood research is predominantly under the hegemony of the United States, given its major role in publication records, institutional contributions and international collaborations. While most studies have concentrated on social and environmental aspects of neighbourhood, topics related to the local economy of neighbourhoods are sparse, suggesting a major gap in the literature.

1. Introduction

The essence of the idea of neighbourhood is a local place of lived experiences. Neighbourhood as an academic concept and research unit continues to attract scholarly interest from different disciplines, including but not limited to urban planning, community development, geography and sociology. This increasing attention could be attributed to its embodiment as a microcosm of broader urban socio-ecological landscapes. The relevance of neighbourhoods as spatial units can be seen from different perspectives, including planning and strategic policies [1,2], population sampling [3], understanding behavioural characteristics [4] and social processes, such as immigration, unemployment and housing quality [5].
In spite of its currency, the concept of neighbourhood remains contested and negotiated, and how to define it continues to be subject to debate. The porosity and fluidity of neighbourhood boundaries, in addition to emerging social changes, make accurate definition a challenging task [6]. One author of [7] conceptualised neighbourhoods as socio-territorial units, encompassing four dimensions: the place-based, involving physical, topology, morphological, and architectural aspects of a neighbourhood; local human activities, including mobility and social organisations; unique cultural characteristics and personalities. Drawing on traditional conceptualisations, and echoing Brower’s [7] encapsulation, the authors of [8] classified neighbourhoods by emphasising territorialisation, rootedness, day-by-day services, social interactions, control and identity as well as place attachment. Forrest and Kearns [9] defined neighbourhood as ‘overlapping social networks with specific and variable time-geographies’. Others have defined neighbourhood from multiscalar [10] and place-framing perspectives [11]. Bjarnesen [12] notes that the varied connotations of neighbourhood in everyday life make the analytical application of the concept challenging. In this study, a neighbourhood is defined as a local abode with a defined or undefined boundary, often characterised by complex socio-economic and ecological interactions.
In practice, scholars have studied a wide range of phenomena at the neighbourhood level, ranging from neighbourhood effects and change [13,14,15,16,17], social cohesion [9,18], satisfaction and wellbeing [19,20], deprivation [21,22], health [23] and redevelopment [24]. They have also examined its practical definition [25] and its use as a geographical unit for addressing social challenges [26]. These studies, and many others, undoubtedly have made significant contributions in enriching both empirical and theoretical understanding of neighbourhood issues.
Until now, however, no attempt has been made to statistically characterise the field. The present study aims to fill that gap. The objective of the present paper is to provide a macroscopic overview using bibliometric analysis of the main characteristics of neighbourhood research publications in order to understand the academic landscape. The scientific value of this exercise is that characterisation helps to understand scholarship nuances (e.g., publication trends, collaborations, research hotspots, etc.), which are often difficult to imagine by reading selected academic papers. Specifically, the study seeks to (1) identify publication patterns, such as temporal dynamics and journal types; (2) quantify scholarship performance and impact from multiple perspectives, including authors’ countries and institutions; and (3) examine the intellectual development path by visualising the citation networks. Applying a bibliometric approach will be helpful in providing an overview of a research topic, which can inform further research [27], in addition to helping to identify research gaps. The study analyses are not limited to a particular aspect of neighbourhood research because of the potential danger in skewing the results; therefore, this study seeks to analyse neighbourhood as a general field.
This paper aims to be relevant in shaping the future direction of neighbourhood scholarship, but also to help avoid duplication of research efforts, while aiding in identifying the most productive authors, institutions, journals and countries in the domain of neighbourhood research. Its next section presents the method, including a detailed description of the sources, methods and data of bibliometric analysis. This is followed by results and discussions, while the last section concludes the paper, and considers its implications.

2. Materials and Methods

2.1. Bibliometric Analysis

Bibliometric analysis is widely applied across different disciplines, because it provides valuable information about scientific fields [28]. At its heart are statistical techniques used to objectively examine and quantify the number and growth trend of publications in an academic discipline [29,30]. Bibliometric analysis makes it possible to provide a macroscopic overview of a large amount of literature, through characterisation of various attributes, such as publication record, growth and impact [31,32] and it allows assessment of scientific quality and knowledge impact in a particular research domain [33]. It has been applied to study many fields in different contexts, including sustainability science [34], smart cities [35], city systems [36], funding and research productivity [37], safety culture [38] and deforestation [39].
Given the burgeoning literature in almost every academic field, scholars increasingly face a herculean task of achieving a structured overview of the landscape of their discipline or field [40]. Bibliometric analysis provides an effective way not only to analyse and summarise, but also to study the structure, distribution, relationships as well as growth of academic literature [41]. Such analyses help us to understand the social dimensions of (social) science and how social science is configured and knowledge produced in relation to the phenomenon studied. Notably, scholars use it to evaluate research productivity and impact [29], to map research communications [42] and to analyse connections between different bodies in the publication landscape [43]. It should, however, be noted that other important techniques, such as systematic review, literature review, scoping review and meta-analysis can be used to perform similar analyses.
The current study adopts bibliometric analysis due to its power to provide a broad overview of a field, dwelling on techniques, such as social network analysis (in delineating cocitations and international collaboration) and cluster analysis. Moreover, unlike systematic review and meta-analysis, bibliometric analysis is not limited in terms of literature quantum as the use of software makes it possible to avoid the manual exercise of counting and reading individual papers in a collection. There are still limitations, however. For instance, search parameters, particular languages and restrictions on the type of document included affect the results, thereby compromising a fully comprehensive picture of a particular field. Yet these shortcomings do not deny the usefulness of bibliometric analysis in charting scientific disciplines as it “does not replace the fundamental work of extensive readings but allows framing the literature in a novel way” [36] (p. 537).
Bibliometric analysis uses several techniques, such as basic bibliometric information, performance analysis, science mapping and domain visualisation in order to understand the scholarship terrain [34,44]. Core units of analysis consist of authors, journals, documents, citations, institutions and countries. Importantly, cocitations measure research influence, on the assumption that scholars cite works that they believe have influenced their field [45,46]. Cocitation refers to the frequency by which two documents are cited together [47] although it should be noted that this does not necessarily measure productivity. According to [48], although citation is important, methodological rigour and robustness of results must be prioritised in determining the quality of a paper. This is particularly important as papers in open access journals- some of poor quality- tend to be cited more frequently. Quantity (number of publications) and quality (impact of a publication) are two major indicators that measure the productivity and quality of research in this domain of scientific analysis [46,49]. Co-authorship analysis, in particular, provides critical information about the intellectual structure and social connections among scientists [50].
Taking cognisance of existing studies, the present study analyses the landscape of neighbourhood scholarship from the perspectives of literature growth, productive authors and journals, cocitations, publishing institutions and collaboration to discern underlying influences and to obtain a systematic overview of the features and the evolutions in the field.

2.2. Data Sources

The Web of Science (WOS), owned by Clarivate Analytics based in Philadelphia, and Scopus, owned by Elsevier which is headquartered in Amsterdam, are the two major academic abstract and citation databases used for bibliometric studies. For the purposes of this study, both databases were tested. The results in this paper were verified with the WOS database and WOS results are available upon request. Scopus was preferred to WOS because of its wider coverage of relevant journals, particularly in the field of social science. Scopus covers more titles [51,52] and is less stringent on journal index status [35], hence, making it a more comprehensive source. It also has a stronger social science coverage [35,36,53]. Although Scopus covers more journals than WOS, it should be noted that it does not cover every single paper in a particular field of study, including some influential work. As such, results reflect the limitations of the database and require to be interpreted with a degree of caution.
To access relevant neighbourhood papers in Scopus, searches were conducted using a keywords strategy [54]. The keywords were combined using Boolean Operators. The first variant of the search was to look for those words that are synonymous with the ‘neighbourhood’ term (e.g., vicinity, community, urban hood, urban area, suburb and locale). The ‘AND NOT’ operators were applied to terms such as ‘community’, ‘hood’ and ‘catchment area’, to limit the results to relevant papers only. Although ‘community’ is often used as a near-synonym of neighbourhood, a separate search generated 312,000 items with most papers discussing plant and animal communities, which were irrelevant to the current context. The operators were therefore applied to the term ‘community’ to exclude papers that discuss animal, plant, ecological, religious, interest, consumer, international, crofting, minority and online communities. A similar approach was applied to the remaining keywords. The second variant of the search was to combine neighbourhood with key [issue] terms (i.e., an issue-based search) (e.g., neighbourhood crime, neighbourhood satisfaction, neighbourhood effects, neighbourhood change and neighbourhood participation). This was important as it ensured that relevant papers that were missed in the first variant search were captured in the collection.
In all, 40 keywords were used for the search. These keywords were carefully selected, given that the concept of neighbourhood is fluid. They were particularly informed by literature and personal experience and knowledge of neighbourhood research. For the same reasons, the study treated the term ‘neighbourhood’ as a social construct. As such, the search was limited to only the Social Science collection in the Scopus database. Both British and American spellings were used in the search strategy. The search strategy (see Appendix A) is included in the paper for reproducibility purposes.
The time span for the search was from 1990 to 2020. The three-decade period was selected to allow for nuances in the publication trend. Using the title, abstract and keyword search options within Scopus, a total of 62,648 social science publications were retrieved. The records were then limited to only original articles, papers published in English and selected journals, using a manual process. The filtering brought down the number of papers to 11,714, which were used for the analysis. The language screening was important to ensure that all articles could be analysed without difficulty. However, we acknowledge that this is likely to have eliminated some important papers published in other languages. Figure 1 shows the process.

2.3. Data Processing and Research Cluster

The Scopus data was processed using the VOSviewer (Visualizing Scientific Landscapes) software [55]. This software is based on an algorithm called “visualisation of similarities” or VOS [56]. It provides a graphical representation of bibliometric networks, which enables relationship mapping between, for instance, keywords or co-occurrence that illustrate the most frequently used terms by scholars in a particular field. It further reveals clusters, making it possible to visualise, for instance, the intensity of citations and collaboration among countries [49]. The study used VOSviewer due to its user-friendly nature and wide application [38,57]. In particular, cluster analysis enables the partitioning of research into thematic areas, therefore illustrating the interrelationships among the different research streams [58]. This approach is frequently used in bibliometric analysis and critical discourse topics to understand author relationships [59]. In the present study, cluster analysis was used to identify thematic areas of neighbourhood scholarship, the nature of international collaboration, as well as keyword analysis. The latest impact factor (IF) of each journal was manually extracted from the relevant journal websites.

3. Results and Discussions

3.1. Collection Information and Publication Trend

The 11,714 articles were published in 130 journals by 17,805 authors (see Table 1) with an average citation of 27.24 per article. The contribution of articles to the domain of neighbourhood scholarship suggests the importance of original peer-reviewed research in the production of knowledge.
In terms of scholarship growth, three major stages can be identified (Figure 1). The period between 1990 and 2000 is characterised by a low level of neighbourhood studies, just 999 papers in the decade. The second decade is one of very considerable growth, where publication numbers increased to 3063. The period between 2011 and 2020 can be said to be the peak of neighbourhood research (so far), as publication more than doubled (to 7691) over the previous period. A closer look reveals a rising trend within all three stages, however. Critically observing Figure 2, it can be seen that there was a slight decline in 2002, 2008, and 2014, with the fastest growth occurring from 2015–2020.

3.2. Neighbourhood Publication Sources

Table 2 shows the top 25 journals that publish neighbourhood research. It is evident that many can be characterised as urban studies or planning journals. Altogether, the 11,714 outputs were published by 130 journals. The top 5 journals have, in total, published 2840 papers, with the top 10 publishing 4247, representing 24.2% and 36.2% of all neighbourhood-related papers, respectively. Urban Studies tops with 734 publications and 25,173 citations, followed by Health and Place (720 records), Social Science and Medicine (676 records), Journal of Urban Health (362 records) and Cities (348 records). Social Science and Medicine is the most cited journal with 39,060 citations, followed by Health and Place (26,860 citations) and Urban Studies (25,173 citations). In terms of journal impact, the top journals are Journal of the American Planning Association, Cities, Habitat International, Urban Geography, Journal of Transport Geography and Social Science and Medicine, with impact factors of 6.95, 4.80, 4.31, 4.04 3.83 and 3.62, respectively.

3.3. Top Publishing Authors in the Scopus Database

The 11,714 papers were written by 17,805 scholars (authors and coauthors combined). Table 3 shows the topmost productive (in terms of publishing) authors with their corresponding h-index and citations. From Table 3, Galster of Wayne State University, United States, leads the publication records with 65 papers and an h-index of 28. This is followed by Giles-Corti and Hipp (48 each), Kearns (39), Musterd (36), Subramanian (35) and Wu (33) with h-indexes of 27, 23, 21, 23, 20 and 26, respectively. While the United States is represented by five scholars in the top 10, Australia and United Kingdom are represented by two each, with The Netherlands represented by one scholar. With respect to the most cited authors, Giles-Corti tops with 3280 citations. He is followed by Frank, Diez Roux, Kawachi, Galster, Sallis, Wu, Saelens and Kearns with 2850, 2756, 2716, 2619, 2551, 2534, 2519 and 2372 citations, respectively. From these results, it can be argued that these scholars lead the subfield of neighbourhood research, at least with respect to outputs that appear in the current Scopus collection.

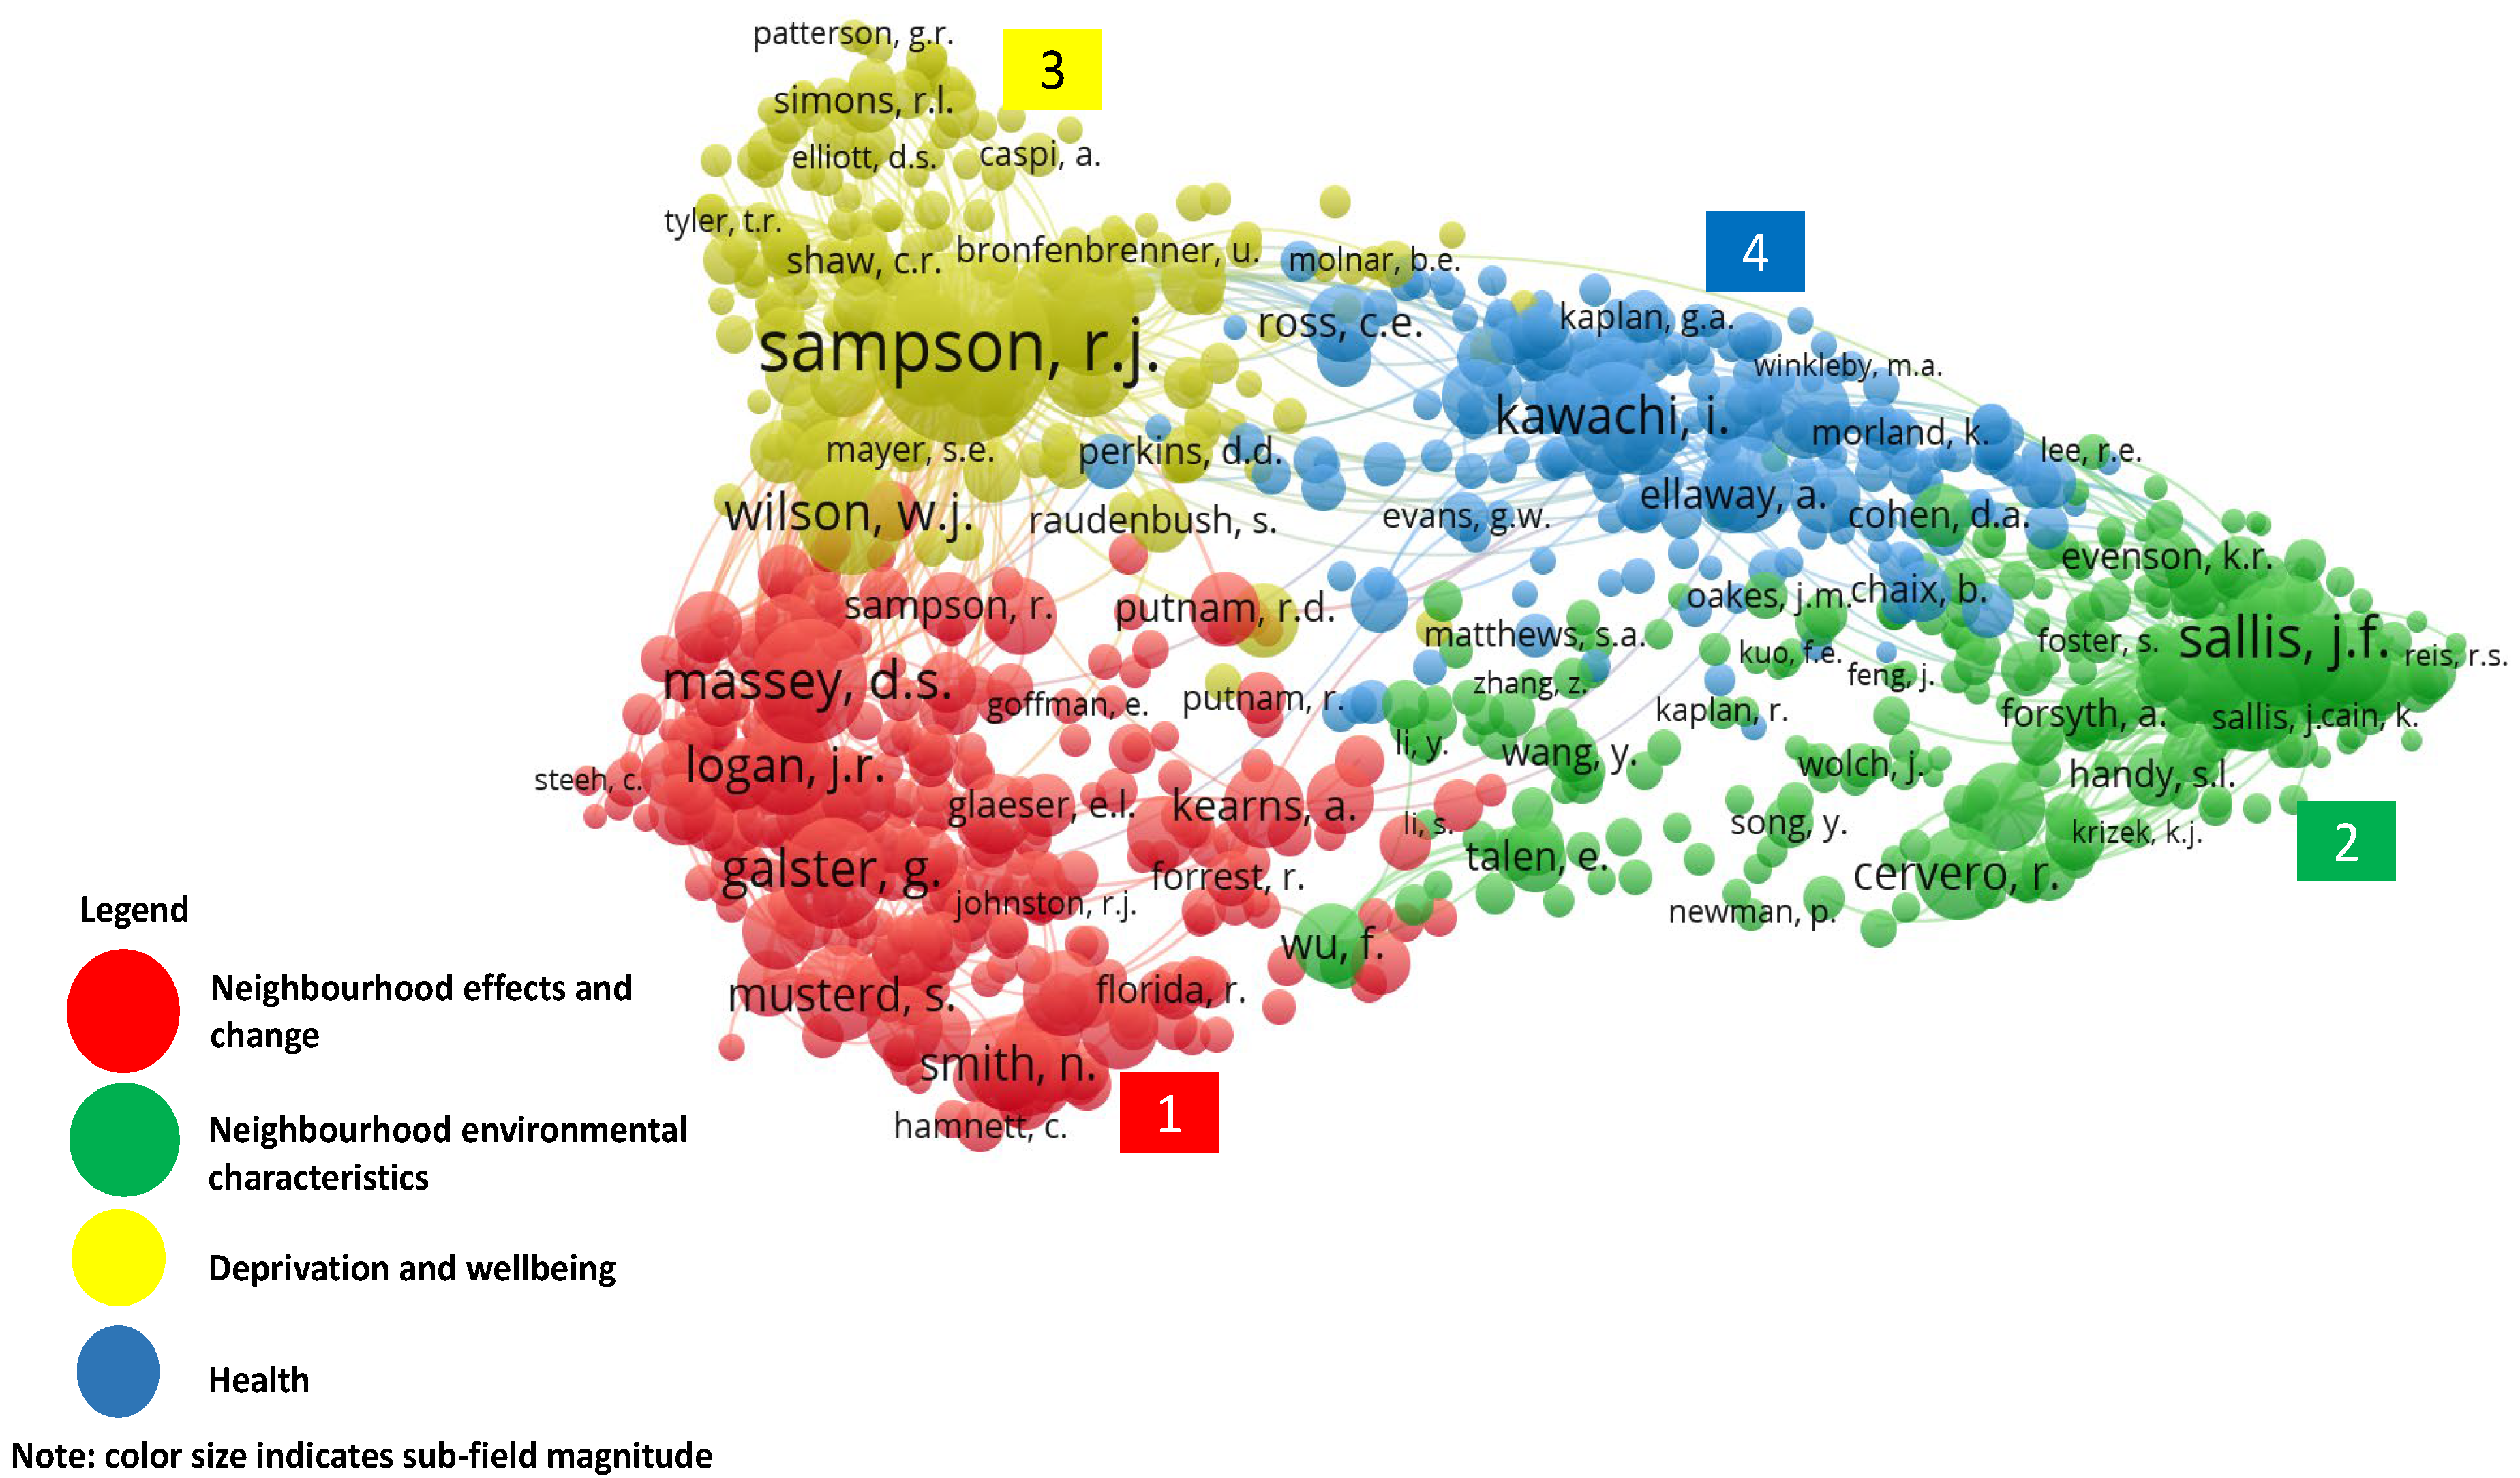
3.4. Cocitation and Research Cluster

Cocitation analysis places emphasis on the interaction between two publications. It gives a general overview of papers that have been cited together in other publications. Similarities between two or more papers can be identified by looking at how often they have been cited together [60]. Figure 3 shows the cocitation results. The nodes represent the papers, while the edges (curved lines) represent the interactions between the papers. The larger a node the more influential that particular paper is, in the subfield. A shorter edge between two papers indicates a stronger relationship and a high degree of similarity between the papers. Nodes with the same colour show that the papers discuss similar topics, helping to identify major clusters in the field. It should be noted that each node is represented by the publication’s first author.
Figure 3 clearly shows that within the domain of neighbourhood research, there are four distinct clusters, each representing a major research focus. From the figure, the largest cluster is coloured red, followed by green, yellow and blue, in that order. A closer look at the figure reveals that the colours somehow intermingle, particularly red and green, blue and green, suggesting that the clusters (based on the clustering algorithm within the software) cover similar topics. By carefully reading the original papers in each cluster, suitable labels were assigned. The largest cluster (red) represents the subfield of neighbourhood effects and change. The next major cluster (green) represents the subfield of neighbourhood environmental characteristics, with yellow and blue (third and fourth clusters) representing the subfields of deprivation and wellbeing and health, respectively.
Figure 3 also reveals key papers in each cluster, e.g., Galster (2012), Massey (1990), Musterd (2012) and Kearns and Parkinson (2001) in neighbourhood effects and change; Sallies et al. (2009) and Cervero (2004) in the subfield of neighbourhood environmental characteristics; Kawachi (2007) and Ellaway (2001) in health cluster; and Sampson (1997) and Wilson and Taub (2007) in the deprivation and wellbeing subfield.
With respect to what the authors investigated, Galster [61], Kearns and Parkinson [18], among others, have extensively analysed how the immediate neighbourhood socioeconomic, cultural and political factors influence life changes. Sallies and others and Cervero [62] analysed neighbourhood environment and physical activity correlates in 11 countries; Wilson and Taub [63] discussed race, ethnicity and class tensions in Chicago neighbourhoods [5,64], on the other hand, employed various techniques to study neighbourhood health in different contexts. A closer look at Figure 2 shows that it is consistent with Table 3, as almost all the lead names in each cluster are among the most productive authors. However, it is important to note that the node size can be influenced by the relative size of a subfield. This is important because journals, for instance, in urban environments and psychology-related disciplines tend to have higher citation indexes than those, for instance, in urban anthropology because there are more scholars in the former fields.

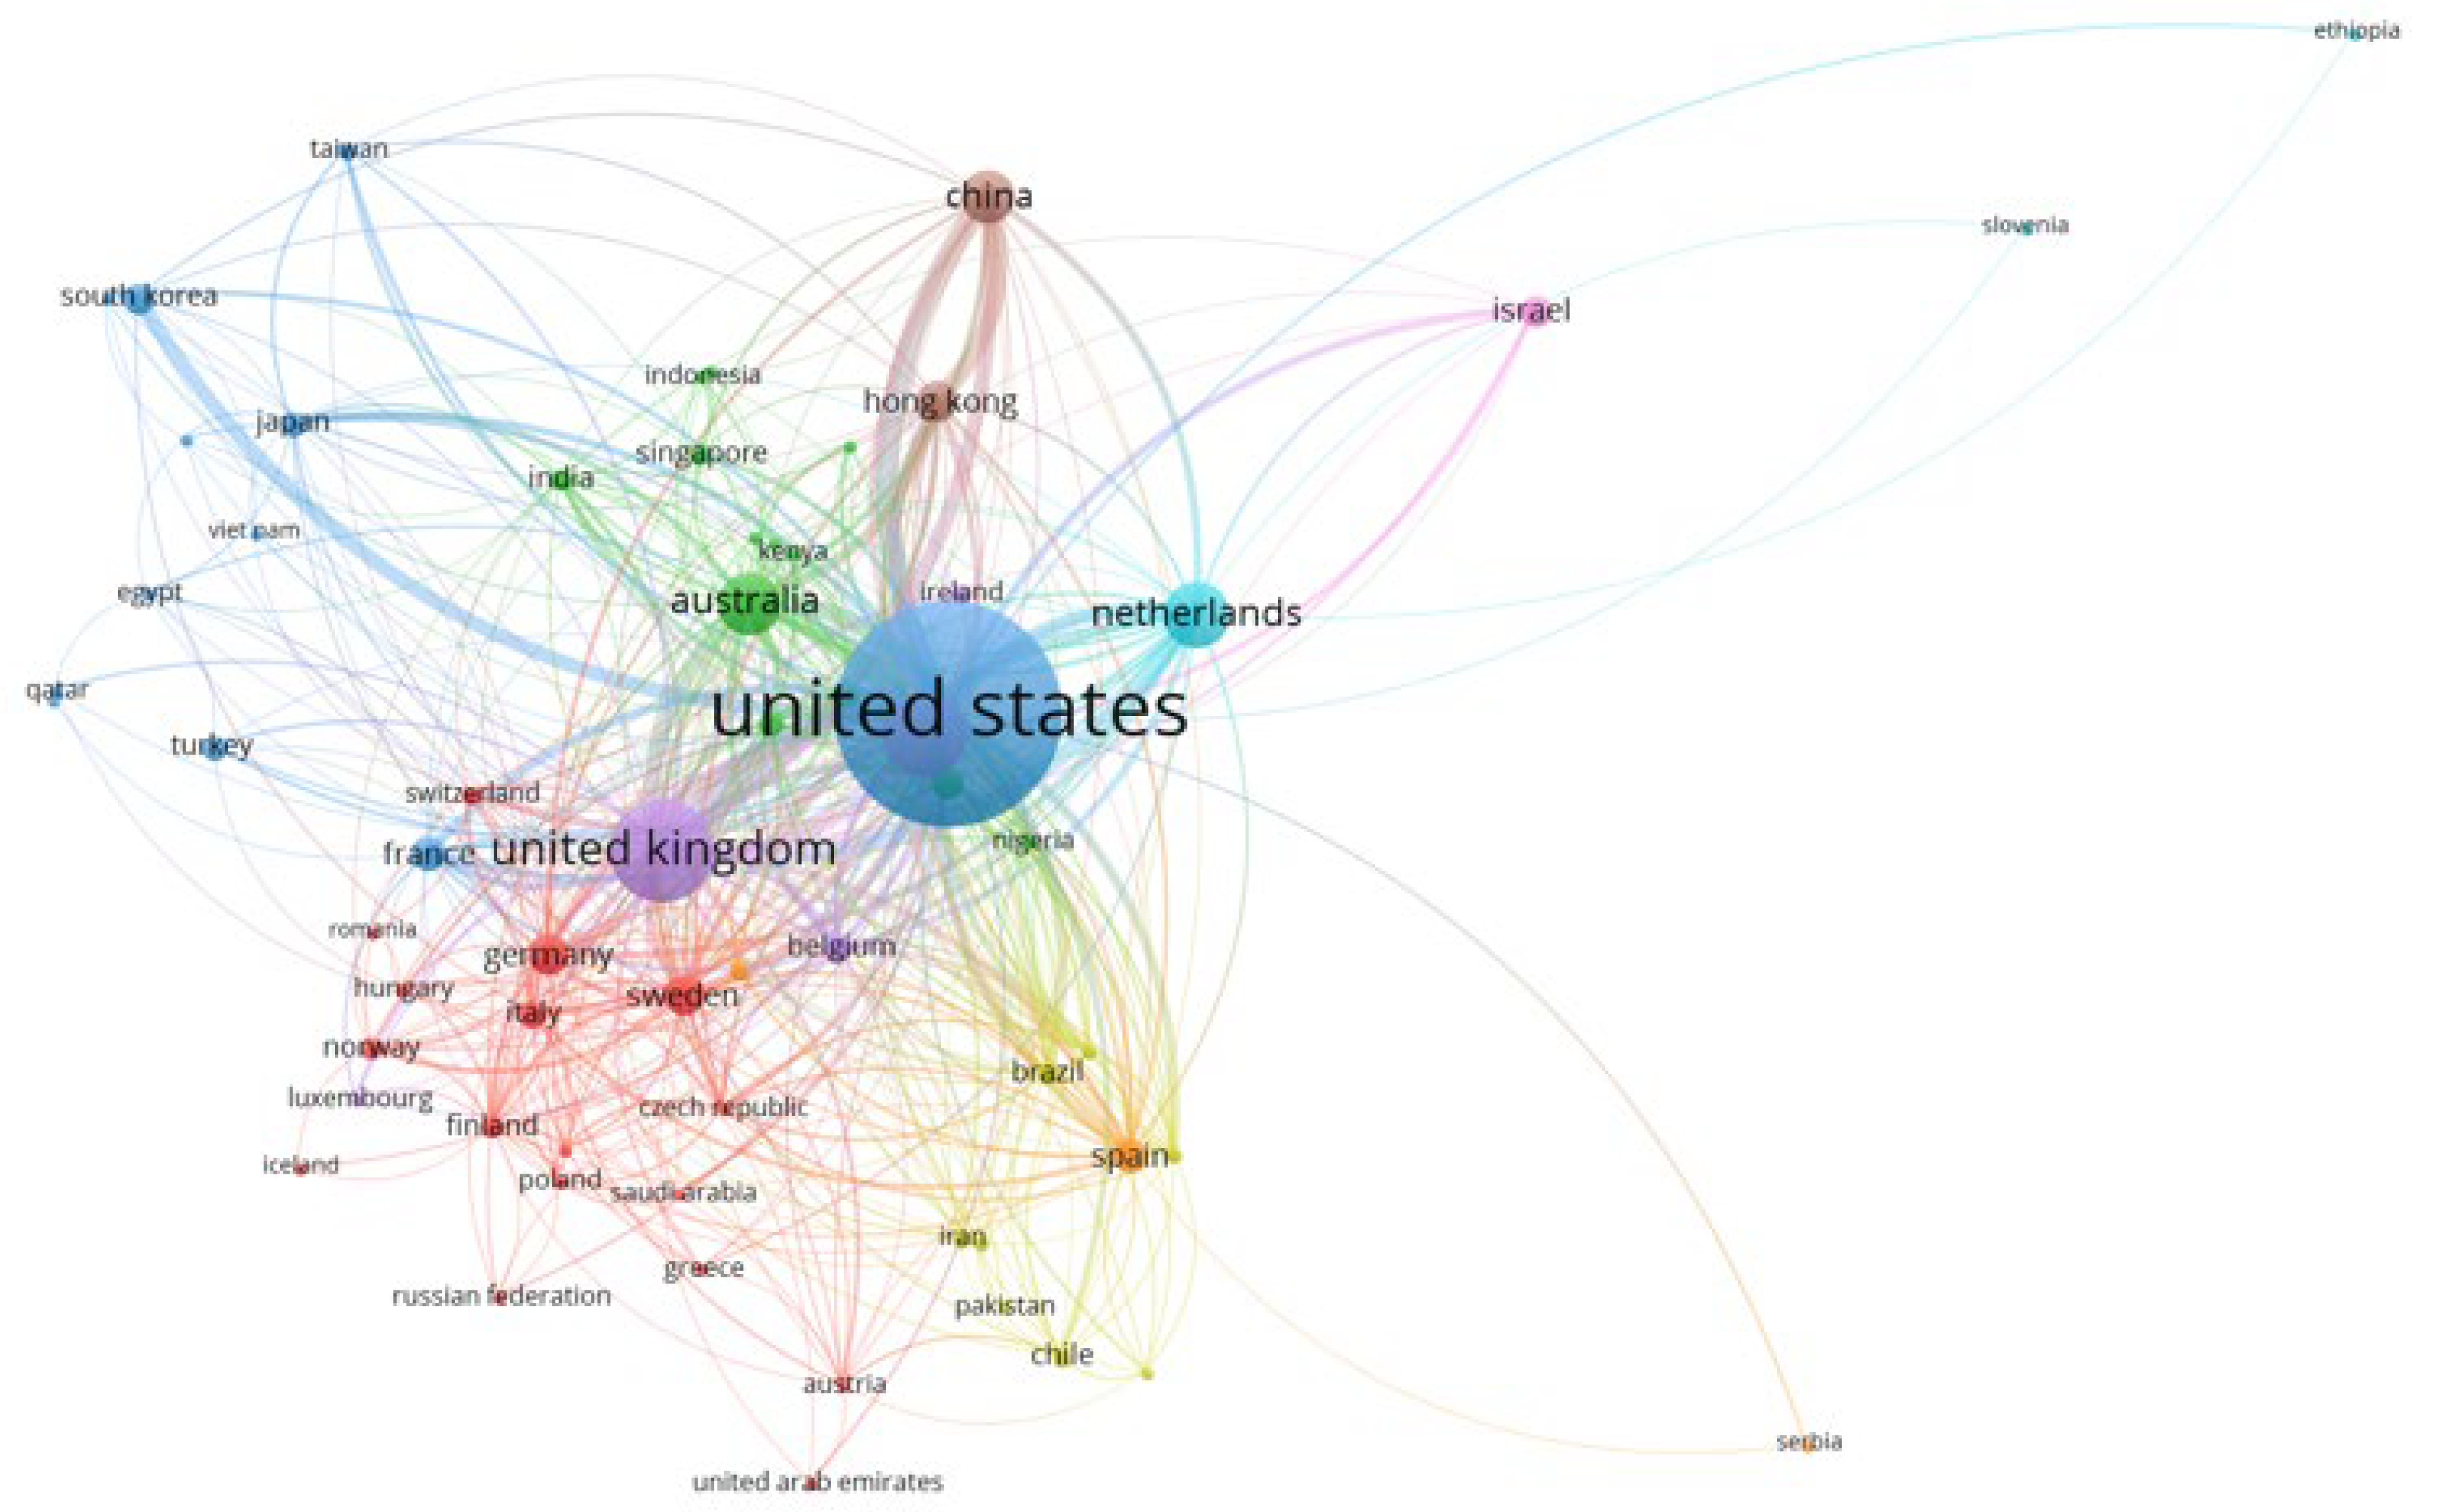
3.5. Regional Distribution, Institutional Contribution and International Collaboration

Global production of neighbourhood publications is shared among authors from 113 countries. Table 4 shows the top 60, where the contribution of the United States stands out, accounting for almost half of the total. Other notable countries include the United Kingdom (9%), Canada (7%), the Netherlands (4%) and Australia (3%). Of the 10 most productive countries, although five are in Europe, they together produce only 17% of the papers, compared to 56% from North America (the United States and Canada). The UK is the most productive country in Europe with 1079 publications, representing 9% of global output. Australia is the most productive in Oceania, with 385 papers and number five in the global rank. Asia is mainly represented by China with 374 publications, making it the sixth most productive country. Based on the current collection, it seems that the subfield of neighbourhood is under-studied in developing countries, particularly in Africa.
Related results concern the most productive institutions, presented in Table 5, which is wholly consistent with the regional distribution, as the dominance of North America, particularly the United States, again stands out. Of the top 30 most productive institutions, 25 are located in the United States, with the universities of Michigan (324 records), Harvard (265), Arizona State (239) and Washington (215), occupying numbers 1, 2, 4 and 5, respectively. The number three position is occupied by the University of Toronto, Canada, with 249 publication records. There is no representation from Oceania in the top 30 universities. Europe has four universities—Amsterdam (9th globally, with 180 records and number one in the Netherlands), Glasgow (11th, 171 records and number one in the UK), Utrecht (16th, 147 records) and UCL (17th, 143 records). Overall, these results further cement the position of the United States as a global leader in neighbourhood research and knowledge production. The influence of the USA can be partly attributed to its population size, however, this does not in any way underestimate the focus and the competencies of its scholars in this field.
In terms of international cooperation, measured by the number of collaboratively-authored publications among countries, Figure 4 presents the core collaborative networks. Major cooperation can be discerned between the United States and the United Kingdom, the Netherlands, South Korea, and China. There is also reasonable cooperation between the United Kingdom and Sweden, France, Germany and Australia. The various colours represent eight identifiable collaboration clusters. It should be noted that the clusters themselves do not indicate the intensity of cooperation, which is shown by the thickness of the edge between countries. Notwithstanding, many countries are collaborating at varying levels, for instance, Sweden with Italy and Germany; Brazil with Spain; Australia and Hong Kong China and Germany. The size of the node is an indication of influence in international cooperation. In this respect, the United States and the United Kingdom, Australia and the Netherlands are the key players, in line with their positions in the previous results.

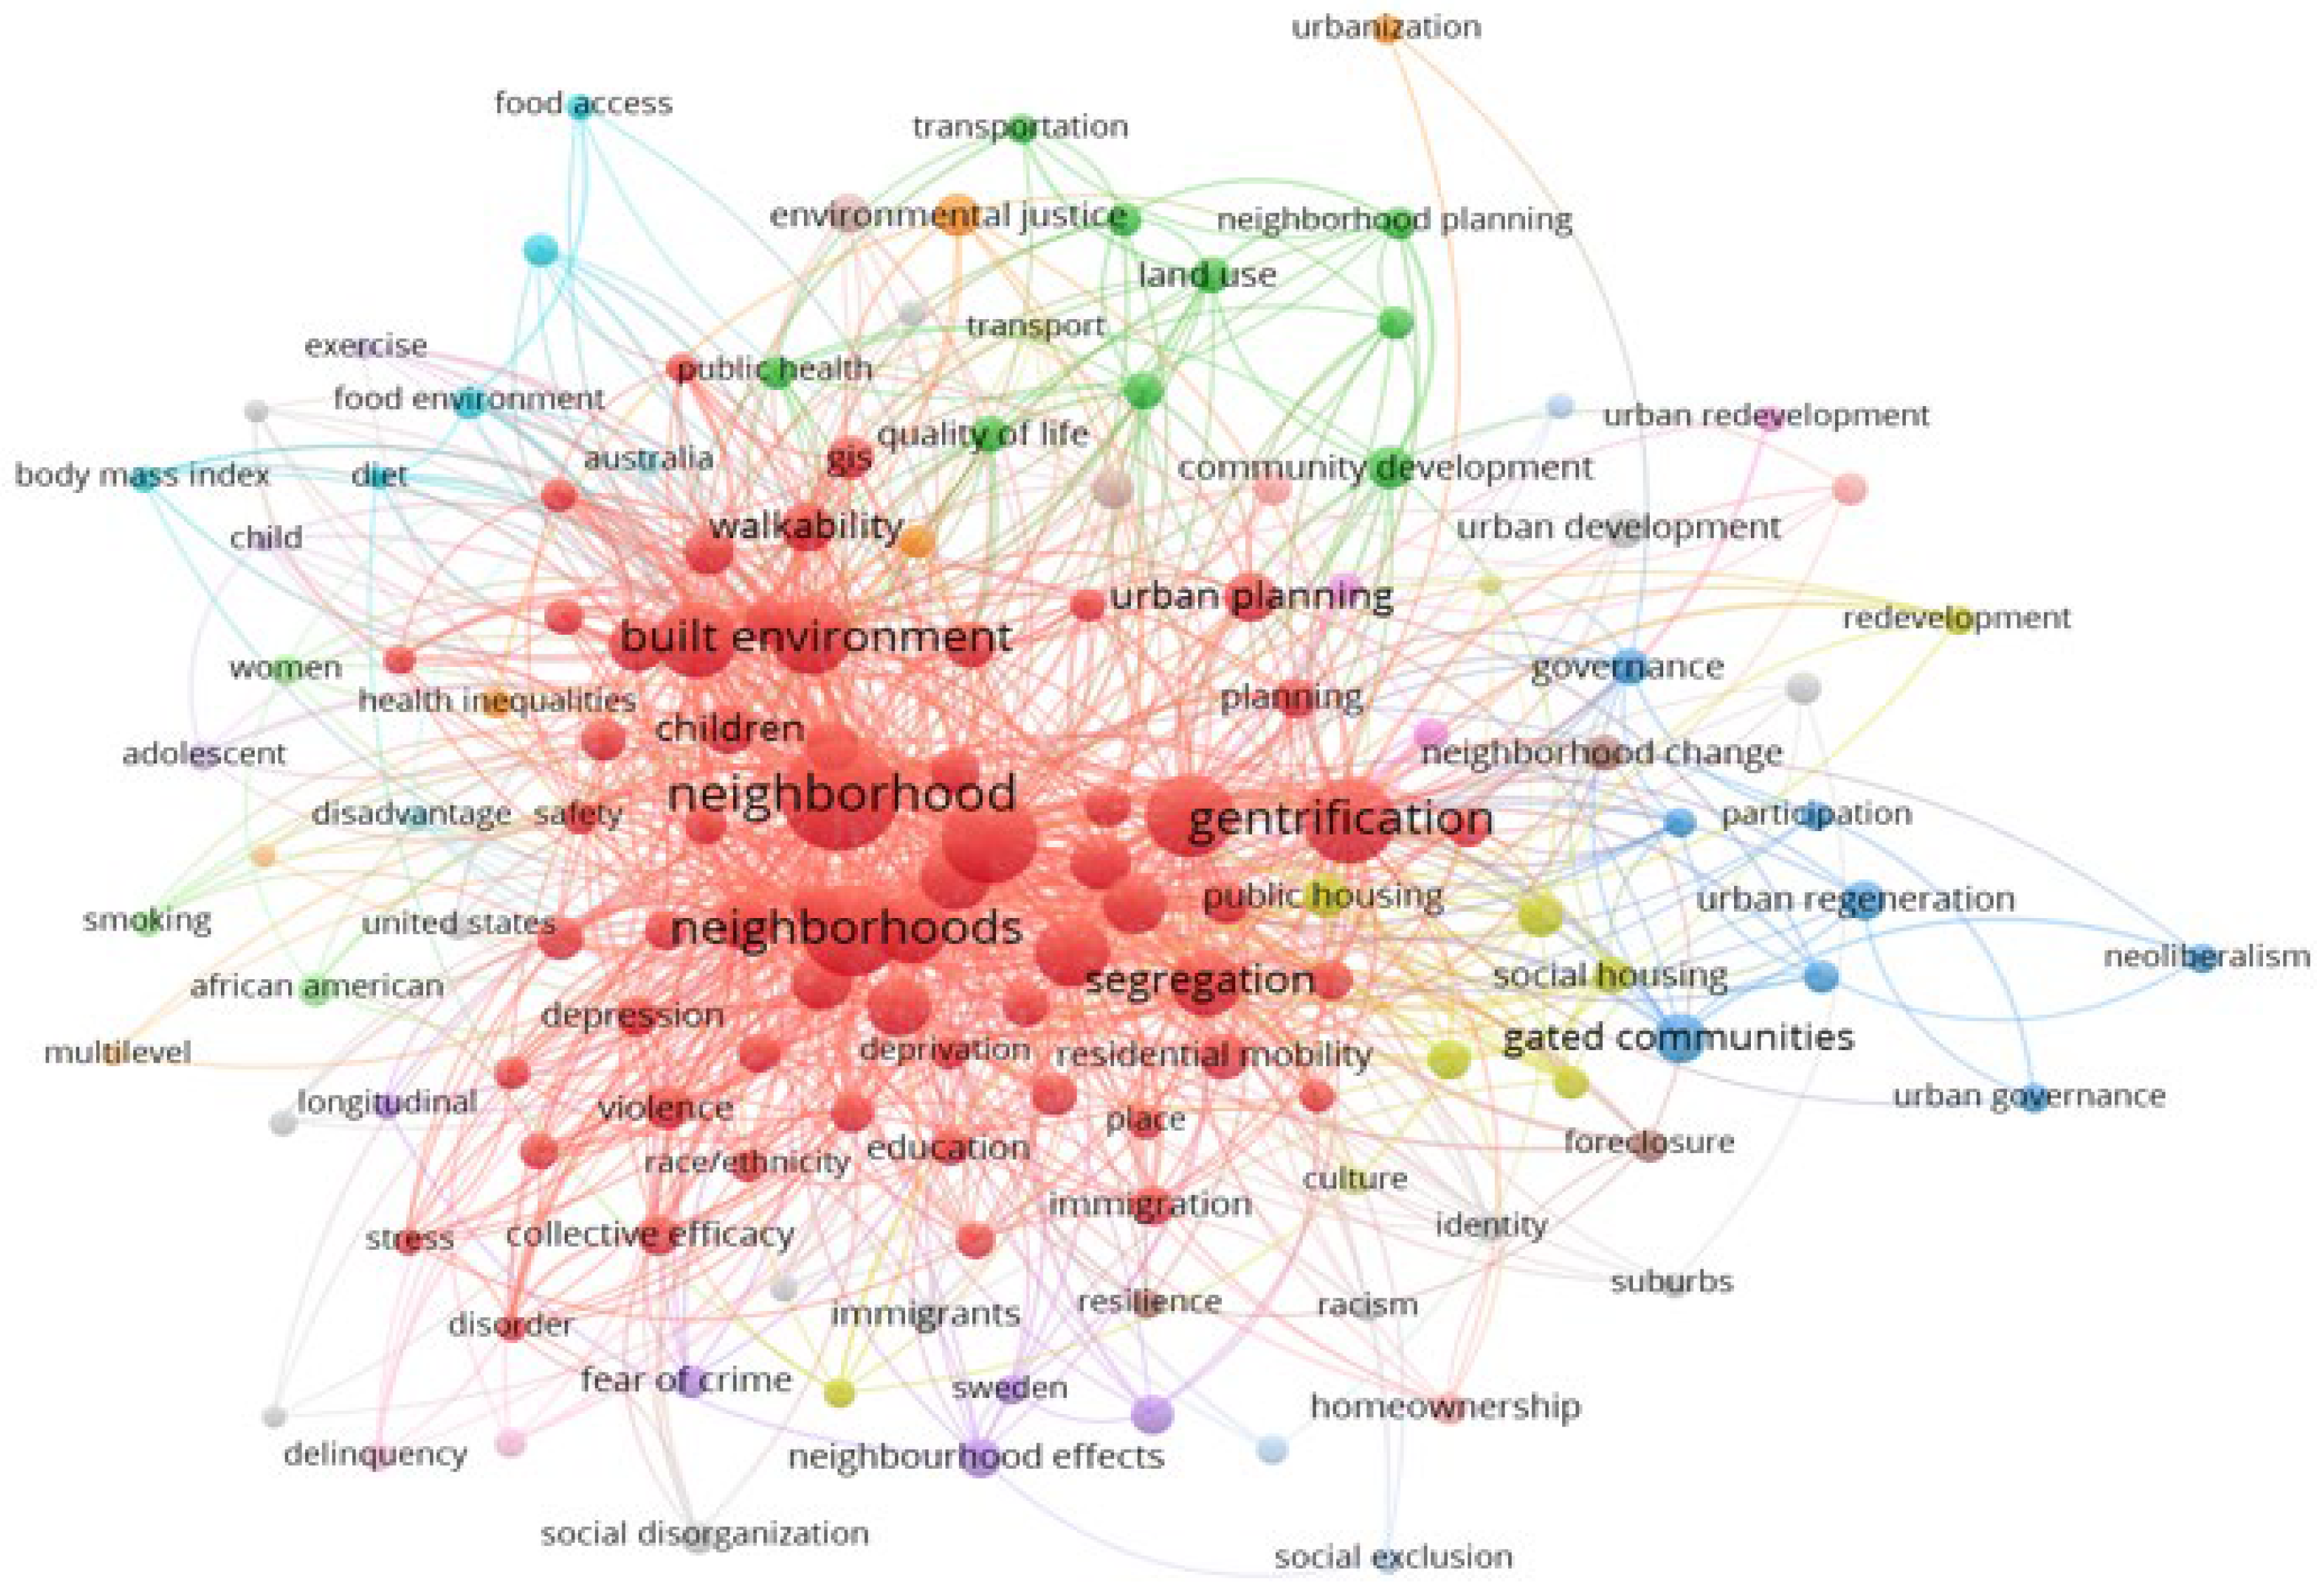
3.6. Keywords and Conceptual Analysis

The analysis of the cooccurrence of titles, keywords and abstract terms of neighbourhood research provides critical insight into the core topics, concepts and research trajectory of this field of study (Figure 5). The bigger the node size, the higher the occurrence of a term in the documents while the edge between terms gives an indication of closeness, so that a shorter edge suggests a stronger relationship [38]. The various colours—red, green, blue, yellow, grey, gold, violet, brown and sky blue, highlight eight clusters. For instance, in the red cluster (largest), noticeable keywords such as gentrification, neighbourhood/s, built environment and segregation, suggest a focus on urban geography and sociological issues. Cluster blue keywords, such as governance, neoliberalism and participation, suggest urban governance. The keywords in the gold cluster (e.g., redevelopment and social housing) represent a neighbourhood housing focus. Frequently occurring words, such as fear of crime, neighbourhood effects, racism and exclusion, found in grey, violet and brown clusters, suggests a focus on neighbourhood social conditions and adverse neighbourhood outcomes. The keywords in the green cluster (e.g., land use, community development and transportation), suggest a neighbourhood planning concern. Food, environment, exercise, quality of life and health inequalities, suggest a concern with the relationship between nutrition and wellbeing and the physical environment, i.e., neighbourhood health effects. Also worthy of mention are some core keywords in the red cluster (i.e., neighbourhood/s, collective efficacy, place, deprivation, residential mobility and walkability), which are perhaps more indicative of a more conceptual focus.
The keyword map clearly illustrates that neighbourhood scholarship cuts across a diverse range of issues, particularly social and environmental topics. There are, however, some notable omissions. There are no economic-related keywords—none about work, livelihoods, economic sectors, businesses or social enterprise, economic division, or economic development, for example. Furthermore, there are no nodes related to some key aspects of poverty such as food security or fuel poverty. Overall, this may suggest that neighbourhood research has understudied some key neighbourhood-related problems.

3.7. Discussion: The State of Neighbourhood Research

From the publication trend analysis, we see a sharp increase in publication between 2018 and 2020, and a valid question to ask is whether this rise will continue in the coming years. We are unclear if this represents a real rise in interest, perhaps representing the second or third stages of Price’s law, which holds that the trajectory of scientific publication has four main stages; emergence, exponential growth, consolidation and decline [65,66]. The rapid growth could also be explained by (1) a shift of interest into this field, (2) scholars having the same interests as before but publishing more in Scopus listed outlets, (3) more scholars working in this field, (4) changing nature of academia and the ‘publish or perish’ culture, (5) a combination of any of the above.
The global north orientation corroborates a recent finding [67], but also highlights a major knowledge gap in developing countries, which should be a concern to urban scholars and development policy actors. The present situation largely reflects a world of rich-country academics studying ‘first world’ built environment and social problems, and diseases of the relatively privileged [21,68,69], while the most difficult, dangerous and urgent neighbourhood problems are found in developing country cities [70,71]. The countless cross-scale challenges that cities in the third world face should provide enough impetus to re-orient the current trend of neighbourhood research. Differences between places represent some of the most egregious inequalities in global north societies. This and the fact that neighbourhoods are often the object of (often flawed) policy responses inevitably has generated a response from researchers, particularly those who are trained in spatial fields such as geography, planning and urban sociology. The rise in interest in recent years, as well as the reasons discussed in the section about the numbers of papers, might also be to do with a rise in neighbourhood inequalities or their persistence in the face of the inadequate policy.
From the results, the domain of neighbourhood research can be categorised into four main groups, with neighbourhood effects and neighbourhood environmental characteristics being the most dominant focus areas. In terms of sources, the journals Urban Studies, Health and Place, Social Science and Medicine, Journal of Urban Health and Cities are the top journals in the subfield. More so, neighbourhood research has an urban face, as the above journal names suggest. From the analyses, while most studies have focused on social and environmental issues, economic issues in neighbourhoods were found to be understudied and scarce. For instance, livelihood strategies, which are critical for building local level resilience [72,73] is yet to receive the necessary attention. Also evidently lacking in the analyses are education-related papers. However, there is a possibility that the keywords may not be the best terms to identify place-based education research, as there is a different linguistic tradition, where words like ‘school board areas’ (in the spatial sense) or catchment areas might be used more frequently [74]. Linguistic tradition may also partly explain apparent regional disparities. Nonetheless, the analysis here is still suggestive of a major gap that future research may consider, especially in developing countries. Focusing on these areas would not only be relevant in enhancing urban resilience, but also provide evidence that could contribute to assessing the United Nations’ Sustainable Development Goal 11 (Make cities and human settlements inclusive, safe, resilient and sustainable). The role of education and livelihood in building sustainable and resilient communities is widely acknowledged.

4. Conclusions

This study aimed to provide a macroscopic overview using bibliometric analysis of the main characteristics of neighbourhood research publications in order to better understand the academic landscape. It is acknowledged that the results presented here do not reflect the entire picture of the subfield. This is because Scopus does not cover all journals and books, and hence, some relevant publications (particularly those in languages other than English) are likely to have been missed in the current collection. However, this paper provides a useful contribution to understanding some of the temporal dynamics, authorship trends, subject areas, collaborations and spatial origins of neighbourhood research, as well as pointing out some glaring omissions which deserve greater scholarly attention.
The study has helped to understand the evolution of neighbourhood research over the past three decades. It has been shown that in terms of publication records, institutional contribution and international collaboration, the United States stands out. Countries in North America (the United States and Canada), Europe (e.g., United Kingdom and the Netherlands), Oceania (Australia) and Asia (mainly China), are the major loci of neighbourhood knowledge production. The most published and cited authors are also US-based. Evidently, neighbourhood research has been biased, given the geographic distribution of studies. Indeed, it could be argued that neighbourhood research is under United States hegemony.
Given that almost all the top scholars are from the developed world, it would be interesting for future bibliometric works to trace the geographical origin of the empirical content of neighbourhood studies, which is often not clear in abstract and citation databases. This will help to understand the linkage between the country of origin and the study country. Such an analysis would help to make a case for developing countries, such as serving as a laboratory for empirical analysis and theoretical application. Further analysis on how the concept of neighbourhood has been applied in different contexts (e.g., between the North and the South and between North America and Europe) would be important in shaping understanding of the global distribution and production of knowledge.

Author Contributions

Conceptualisation, G.B.; Data curation, G.B. and K.K.; Formal analysis, G.B.; Methodology, G.B.; Software, G.B.; Supervision, K.K.; Validation, K.K.; Visualisation, G.B.; Writing—original draft, G.B.; Writing—review & editing, K.K. All authors have read and agreed to the published version of the manuscript.

Funding

This research was conducted as part of the GCRF Centre for Sustainable, Healthy and Learning Cities and Neighbourhoods (SHLC) activities. SHLC is funded via UK Research and Innovation as part of the UK Government’s Global Challenges Research Fund (Ref: ES/P011020/1).

Institutional Review Board Statement

Not applicable.

Informed Consent Statement

Not applicable.

Data Availability Statement

Not applicable.

Acknowledgments

Special thanks to Ya Ping Wang of the University of Glasgow for his comments and suggestions on the earlier draft. We also thank the three anonymous reviewers for their comments.

Conflicts of Interest

The authors declare no conflict of interest.

Appendix A

Search string
(TITLE-ABS-KEY (“neighbourhood”) OR (“neighborhood”) OR (“urban neighbourhood”) OR (“urban neighborhood”) OR (“urban neighbourliness”) OR (“urban neighborliness”) OR (“urban locale”) OR (“urban locality”) OR (“urban small area”) OR (“urban community” AND NOT animal AND NOT community AND NOT interest AND NOT profession AND NOT ecological AND NOT religious AND NOT consumer AND NOT international AND NOT crofting AND NOT minority AND NOT online) OR (“city neighbourhood”) OR (“city neighborhood”) OR (“urban suburb”) OR (“urban village”) OR (“urban vicinity”) OR (“urban hood” AND NOT clothing AND NOT fashion) OR (“urban catchment area” AND NOT water AND NOT river AND NOT hydrology) OR (“neighbourhood effects”) OR (“area effect”) OR (“area effects”) OR (“neighbourhood change”) OR (“neighborhood change”) OR (“urban enclave”) OR (“urban ghetto”) OR (“urban slum”) OR (“gated community”) OR (“urban residential area”) OR (“neighbourhood gentrification”) OR (“neighborhood gentrification”) OR (“urban housing estate”) OR (“neighbourhood participation”) OR (“neighborhood participation”) OR (“neighbourhood crime”) OR (“neighborhood crime”) OR (“neighbourhood ethnicity”) OR (“neighborhood ethnicity”) OR (“neighbourhood segregation”) OR (“neighborhood segregation”) OR (“neighbourhood social network”) OR (“neighborhood social network”)) AND PUBYEAR > 1989 AND PUBYEAR < 2021 AND (LIMIT-TO (SUBJAREA , “SOCI”)) AND (LIMIT-TO (LANGUAGE, “English”)) AND (LIMIT-TO (DOCTYPE, “ar”)

References

  1. The Young Foundation. How Can Neighbourhoods Be Understood and Defined? Available online: https://youngfoundation.org/publications/how-can-neighbourhoods-be-understood-and-defined/ (accessed on 15 March 2020).
  2. Olowoporoku, O.; Salami, A.; Akintifonbo, O. Assessment of Residents’ Neighbourhood Confidence in an African Traditional City: The Abeokuta Experience. Econ. Environ. Stud. 2017, 17, 757–775. [Google Scholar] [CrossRef]
  3. Getis, A. Analytically derived neighbourhoods in a rapidly growing West African city: The case of Accra, Ghana. Habitat Int. 2015, 45, 126–134. [Google Scholar] [CrossRef] [PubMed] [Green Version]
  4. Subramanian, S.V.; Jones, K.; Duncan, C. Multilevel Methods for Public Health Research. In Neighborhoods and Health; Kawachi, I., Berkman, L.F., Eds.; Oxford University Press: New York, NY, USA, 2003; pp. 65–111. [Google Scholar]
  5. Kawachi, I.; Subramanian, S.V. Neighbourhood influences on health. J. Epidemiol. Community Health 2007, 61, 3–4. [Google Scholar] [CrossRef] [PubMed]
  6. Anderson, M.B. Neighbourhood. In The International Encyclopaedia of Geography; Richardson, D., Castree, N., Goodchild, M.F., Kobayashi, A., Liu, W., Marston, R., Eds.; Wiley and Sons Ltd.: Hoboken, NJ, USA, 2017. [Google Scholar]
  7. Brower, S. Good Neighbourhoods: A Study of In-Town & Suburban Residential Environments; Praeger: Westport, CT, USA, 1996. [Google Scholar]
  8. Schnell, I.; Goldhaber, R. The Social Structure of Tel-Aviv-Jaffa neighbourhoods. Environ. Behav. 2001, 33, 765–795. [Google Scholar] [CrossRef]
  9. Forrest, R.; Kearns, A. Social cohesion, social capital and the neighbourhood. Urban Stud. 2001, 38, 2125–2143. [Google Scholar] [CrossRef]
  10. Galster, G. On the Nature of Neighbourhood. Urban Stud. 2001, 38, 2111–2124. [Google Scholar] [CrossRef]
  11. Martin, D.G. Enacting neighbourhood. Urban Geogr. 2003, 24, 361–385. [Google Scholar] [CrossRef]
  12. Bjarnesen, J. The ambivalence of neighbourhood in urban Burkina Faso. Anthropol. S. Afr. 2015, 38, 331–343. [Google Scholar] [CrossRef]
  13. Levanthal, T.; Brooks-Gunn, J. The neighbourhoods they live in: The effects of neighbourhood residence on child and adolescent outcomes. Psychol. Bull. 2000, 126, 309–337. [Google Scholar] [CrossRef] [Green Version]
  14. Pattie, C.; Johnston, R. People Who Talk Together Vote Together: An Exploration of Contextual Effects in Great Britain. Ann. Assoc. Am. Geogr. 2000, 90, 41–66. [Google Scholar] [CrossRef]
  15. Sampson, R.J.; Morenoff, J.D.; Gannon-Rowley, T. Assessing neighbourhood effects: Social processes and new directions in research. Annu. Rev. Sociol. 2002, 28, 443–478. [Google Scholar] [CrossRef] [Green Version]
  16. Loo, B.P.Y.; Lam, W.W.Y.; Mahendran, R.; Katagiri, K. How Is the Neighborhood Environment Related to the Health of Seniors Living in Hong Kong, Singapore, and Tokyo? Some Insights for Promoting Aging in Place. Ann. Assoc. Am. Geogr. 2017, 107, 812–828. [Google Scholar] [CrossRef]
  17. Petrovic, A.; Manley, D.; van Ham, M. Freedom from the tyranny of neighbourhood: Rethinking sociospatial context effects. Prog. Hum. Geogr. 2020, 44, 1103–1123. [Google Scholar] [CrossRef]
  18. Kearns, A.; Parkinson, M. The significance of neighbourhood. Urban Stud. 2001, 38, 2103–2110. [Google Scholar] [CrossRef]
  19. Cramm, J.M.; Moller, V.; Nieboer, A.P. Individual- and Neighbourhood-Level Indicators of Subjective Well-Being in a Small and Poor Eastern Cape Township: The Effect of Health, Social Capital, Marital Status, and Income. Soc. Indic. Res. 2011, 105, 581–593. [Google Scholar] [CrossRef] [Green Version]
  20. te Lintelo, D.J.H.; Gupte, J.; McGregor, J.A.; Lakshman, R.W.D.; Jahan, F. Wellbeing and urban governance: Who fails, survives or thrives in informal settlements in Bangladeshi cities? Cities 2018, 72, 391–402. [Google Scholar] [CrossRef]
  21. Kintrea, K.; St-Clair, R.; Houston, M. Shaped by place? Young people’s aspirations in disadvantaged neighbourhoods. J. Youth Stud. 2015, 18, 666–684. [Google Scholar] [CrossRef]
  22. Atkinson, R.; Kintrea, K. Disentangling Area Effects: Evidence from Deprived and Non-deprived Neighbourhoods. Urban Stud. 2001, 38, 2277–2298. [Google Scholar] [CrossRef]
  23. Smit, W.; de Lannoy, A.; Dover, R.V.H.; Lambert, E.V.; Levitt, N.; Watson, V. Making unhealthy places: The built environment and non-communicable diseases in Khayelitsha, Cape Town. Health Place 2016, 39, 196–203. [Google Scholar] [CrossRef] [Green Version]
  24. Wang, Y.; Shaw, D. The complexity of high-density neighbourhood development in China: Intensification, deregulation and social sustainability challenges. Sustain. Cities Soc. 2018, 43, 578–586. [Google Scholar] [CrossRef]
  25. Baffoe, G.; Malonza, J.; Manirakiza, V.; Mugabe, L. Understanding the concept of neighbourhood in Kigali City, Rwanda. Sustainability 2020, 12, 1555. [Google Scholar] [CrossRef] [Green Version]
  26. Drilling, M.; Schnur, O. Neighbourhood research from a geographical perspective. Die Erde J. Geogr. Soc. Berl. 2019, 150, 48–60. [Google Scholar]
  27. Wang, B.; Pan, S.-Y.; Ke, R.-Y.; Wang, K.; Wei, Y.-M. An overview of climate change vulnerability: A bibliometric analysis based on Web of Science database. Nat. Hazards 2014, 74, 74,1649–1666. [Google Scholar] [CrossRef]
  28. Vain, P. Trends in GM crop, food and feed safety literature. Nat. Biotechnol. 2007, 25, 624–626. [Google Scholar] [CrossRef]
  29. Merigó, J.M.; Cancino, C.A.; Coronado, F.; Urbano, D. Academic research in innovation: A country analysis. Scientometrics 2016, 108, 559–593. [Google Scholar] [CrossRef]
  30. Mao, G.; Huang, N.; Chen, L.; Wang, H. Research on biomass energy and environment from the past to the future: A bibliometric analysis. Sci. Total Environ. 2018, 635, 1081–1091. [Google Scholar] [CrossRef]
  31. Jia, X.; Tao, D.; Xinbiao, G. Comprehensive exploration of urban health by bibliometric analysis: 35 years and 11,299 articles. Scientometrics 2014, 99, 881–894. [Google Scholar] [CrossRef]
  32. Li, J.; Hale, A. Output distributions and topic maps of safety related journals. Saf. Sci. 2016, 82, 236–244. [Google Scholar] [CrossRef]
  33. van Leeuwen, T. The application of bibliometric analyses in the evaluation of social science research. Who benefits from it, and why it is still feasible? Scientometrics 2006, 66, 133–154. [Google Scholar] [CrossRef]
  34. Kajikawa, Y.; Junko, O.; Yoshiyuki, T.; Katsumori, M.; Hiroshima, K. Creating an academic landscape of sustainability science: An analysis of the citation network. Sustain. Sci. 2007, 2, 221–231. [Google Scholar] [CrossRef] [Green Version]
  35. de Jong, M.; Simon, J.; Daan, S.; Changjie, Z.; Margot, W. Sustainable–smart–resilient–low carbon–eco–knowledge cities; making sense of a multitude of concepts promoting sustainable urbanization. J. Clean. Prod. 2015, 109, 25–38. [Google Scholar] [CrossRef] [Green Version]
  36. Peris, A.E.; van Ham, M. The Evolution of the Systems of Cities Literature Since 1995: Schools of Thought and their Interaction. Netw. Spat. Econ. 2018, 18, 533–554. [Google Scholar] [CrossRef] [Green Version]
  37. Mariethoz, G.; Herman, F.; Dreiss, A. The imaginary carrot: No correlation between raising funds and research productivity in geosciences. Scientometrics 2021, 126, 2401–2407. [Google Scholar] [CrossRef]
  38. van Nunen, K.; Li, J.; Reniers, G.; Ponnet, K. Bibliometric analysis of safety culture research. Saf. Sci. 2018, 108, 248–258. [Google Scholar] [CrossRef]
  39. Aleixander-Benavent, R.; Aleixandre-Tudo, J.S.; Castello-Cogollos, L.; Aleixandre, J.L. Trends in global research in deforestation. A bibliometric analysis. Land Use Policy 2018, 72, 293–302. [Google Scholar] [CrossRef]
  40. Rodrigues, S.P.; van Eck, N.J.; Waltman, L.; Jansen, F.-W. Mapping patient safety: A large-scale literature review using bibliometric visualisation techniques. BMJ Open 2014, 4, e004468. [Google Scholar] [CrossRef]
  41. Mao, G.; Zou, H.; Chen, G.; Du, H.; Zuo, J. Past, current and future of biomass energy research: A bibliometric analysis. Renew. Sustain. Energy Rev. 2015, 52, 1823–1833. [Google Scholar] [CrossRef]
  42. Fetscherin, M.; Heinrich, D. Consumer Brand Relationships Research: A Bibliometric Citation Meta-Analysis. J. Bus. Res. 2015, 68, 380–390. [Google Scholar] [CrossRef]
  43. Li, W.; Zhao, Y. Bibliometric analysis of global environmental assessment research in a 20-year period. Environ. Impact Assess. Rev. 2015, 50, 158–166. [Google Scholar] [CrossRef]
  44. Wagner, C.S.; Roessner, D.J.; Bobb, K.; Klein, J.T.; Boyack, K.W.; Keyton, J.; Rafols, I.; Borner, K. Approaches to understanding and measuring interdisciplinary scientific research (IDR): A review of the literature. J. Informetr. 2011, 5, 14–26. [Google Scholar] [CrossRef]
  45. van Raan, A.F.J. The use of bibliometric analysis in research performance assessment and monitoring of interdisciplinary scientific developments. Assess. Theory Pract. 2003, 1, 20–29. [Google Scholar] [CrossRef]
  46. van Raan, A.F.J. Assessing the social sciences: The use of advanced bibliometric methods as a necessary complement of peer review. Res. Eval. 1996, 7, 2–6. [Google Scholar] [CrossRef]
  47. Marshakova, I.V. Bibliographic coupling system based on references. Nauchno-Tekhnicheskaya Inf. Seriya 1973, 2, 3–8. [Google Scholar]
  48. Baffoe, G. Rural-urban studies: A macro analyses of the scholarship terrain. Habitat Int. 2020, 98, 102156. [Google Scholar] [CrossRef]
  49. van Leeuwen, T.N.; Visser, M.S.; Moed, H.F.; Nederhof, T.J.; Van Raan, A.F.J. The Holy Grail of science policy: Exploring and combining bibliometric tools in search of scientific excellence. Scientometrics 2003, 57, 257–280. [Google Scholar] [CrossRef]
  50. Verbeek, A.; Debackere, K.; Luwel, M.; Zimmermann, E. Measuring Progress and Evolution in Science and Technology—I: The Multiple Uses of Bibliometric Indicators. Int. J. Manag. Rev. 2020, 4, 179–211. [Google Scholar] [CrossRef]
  51. Elsevier. Scopus Content. Available online: https://www.elsevier.com/solutions/scopus/content (accessed on 20 March 2020).
  52. Beshoff, N.; Akanmu, M.A. Scopus or Web of Science for a bibliometric profile of pharmacy research at a Nigerian university? S. Afr. J. Libr. Inf. Sci. 2017, 83, 12–22. [Google Scholar] [CrossRef] [Green Version]
  53. Akmal, A.; Podgorodnichenko, N.; Greatbanks, R.; Everett, A.M. Bibliometric analysis of production planning and control (1990–2016). Prod. Plan. Control 2018, 29, 1–19. [Google Scholar] [CrossRef]
  54. van Meeteren, M.; Poorthuis, A.; Derudder, B.; Witlox, F. Pacifying Babel’s tower: A scientometric analysis of polycentricity in urban research. Urban Stud. 2015, 53, 1278–1298. [Google Scholar] [CrossRef] [Green Version]
  55. van Eck, N.J.; Ludo, W. How to normalize co-occurrence data? An analysis of some well-known similarity measures. J. Am. Soc. Inf. Sci. Technol. 2009, 60, 1635–1651. [Google Scholar]
  56. Sarkar, S.; Searcy, C. Zeitgeist or chameleon? A quantitative analysis of CSR definitions. J. Clean. Prod. 2016, 135, 1423–1435. [Google Scholar] [CrossRef]
  57. Qasim, M. Sustainability and wellbeing: A scientometric and bibliometric review of the literature. J. Econ. Surv. 2017, 31, 1035–1061. [Google Scholar] [CrossRef]
  58. Cui, X. How can cities support sustainability: A bibliometric analysis of urban metabolism. Ecol. Indic. 2018, 93, 704–717. [Google Scholar] [CrossRef]
  59. Everitt, B.; Landau, S.; Leese, M. Cluster Analysis, 5th ed.; Wiley: Hoboken, NJ, USA, 2011. [Google Scholar]
  60. Price, D.J.S. Little Science, Big Science; Columbia University Press: New York, NY, USA, 1963. [Google Scholar]
  61. Dabi, Y.; Darrigues, L.; Katsahian, S.; Azoulay, D.; De Antonio, M.; Lazzati, A. Publication trends in bariatric surgery: A bibliometric study. Obes. Surg. 2016, 26, 2691–2699. [Google Scholar] [CrossRef] [PubMed] [Green Version]
  62. Li, J.; Hale, A. Identification of, and knowledge communication among core safety science journals. Saf. Sci. 2015, 74, 70–78. [Google Scholar] [CrossRef]
  63. Galster, G.C. The Mechanism(s) of Neighbourhood Effects: Theory, Evidence, and Policy Implications. In Neighbourhood Effects Research: New Perspectives; van Ham, M., Manley, D., Bailey, N., Simpson, l., Maclennan, D., Eds.; Springer: Berlin/Heidelberg, Germany, 2012; pp. 23–56. [Google Scholar]
  64. Cervero, R.; Duncan, M. Neighbourhood Composition and Residential Land Prices: Does Exclusion Raise or Lower Values? Urban Stud. 2004, 41, 299–315. [Google Scholar] [CrossRef]
  65. Wilson, W.J.; Taub, R.P. There Goes the Neighborhood: Racial, Ethnic, and Class Tensions in Four Chicago Neighborhoods and Their Meaning for America; Vintage: New York, NY, USA, 2007. [Google Scholar]
  66. Diez Roux, A.V.; Mair, C. Neighborhoods and health. Ann. N. Y. Acad. Sci. 2010, 1186, 125–145. [Google Scholar] [CrossRef] [Green Version]
  67. Baffoe, G. Understanding the Neighborhood Concept and its Evolution. Environ. Urban. ASIA 2019, 10, 393–402. [Google Scholar] [CrossRef]
  68. Glaster, G.; Anderson, R.; Musterd, S. Who Is Affected by Neighbourhood Income Mix? Gender, Age, Family, Employment and Income Differences. Urban Stud. 2010, 47, 2915–2944. [Google Scholar] [CrossRef]
  69. Kearns, A.; Whitley, E. Perceived neighbourhood ethnic diversity and social outcomes: Context-dependent effects within a post-industrial city undergoing regeneration. J. Urban Aff. 2018, 40, 186–208. [Google Scholar] [CrossRef] [Green Version]
  70. Davis, M. Planet of slums. New Perspect. Q. 2006, 23, 6–11. [Google Scholar] [CrossRef]
  71. Marx, B.; Stoker, T.; Suri, T. The Economics of Slums in the Developing World. J. Econ. Perspect. 2013, 27, 187–210. [Google Scholar] [CrossRef] [Green Version]
  72. Baffoe, G.; Matsuda, H. Understanding the determinants of rural credit accessibility: The case of Ehiaminchini, Fanteakwa District, Ghana. J. Sustain. Dev. 2015, 8, 183–195. [Google Scholar] [CrossRef] [Green Version]
  73. Baffoe, G.; Matsuda. H. Why do rural communities do what they do in the context of livelihood activities? Exploring the livelihood priority and viability nexus. Community Dev. 2017, 48, 715–734. [Google Scholar] [CrossRef]
  74. Nespor, J. Education and Place: A Review Essay. Educ. Theory 2008, 58, 475–489. [Google Scholar] [CrossRef]
Figure 1. Methodological process.
Sustainability 14 03115 g001
Figure 2. Number of neighbourhood publications and cumulative number of neighbourhood publications by year (1990–2020). Source: Scopus database.
Sustainability 14 03115 g002
Figure 3. Author cocitation and clusters of neighbourhood research. The first-named author identifies publications. A threshold of 50 minimum citations was applied and limited to 1000 most productive authors. Cluster 1 (n = 310 items); Cluster 2 (n = 289 items); Cluster 3 (n = 214 items); Cluster 4 (n = 187 items). Note that the figure shows only the most cited and influential authors in each subfield of neighbourhood research. Source: Generated using Scopus collection.
Sustainability 14 03115 g003
Figure 4. Global collaboration on neighbourhood scholarship. Source: Generated from the Scopus collection.
Sustainability 14 03115 g004
Figure 5. Keywords analysis of neighbourhood publications. Source: Generated from the Scopus collection.
Sustainability 14 03115 g005
Table 1. Main information for the Social Sciences collection (1990–2020).
Main InformationNumber
Total documents11,714
Sources130
Timespan1990–2020
Authors17,805
Keywords14,444
Single authored documents2713
Multiple authored documents15,092
Average citations per document27.24
Average citation per year per document2.417
Source: Scopus database computation.
Table 2. Top 25 publishing journals in the Social Sciences collection (1990–2020).
RankJournalNo. of Documents% ShareTotal CitationsIF
1Urban Studies7346.2525,1732.828
2Health and Place7206.1326,8603.29
3Social Science and Medicine6765.7539,0603.616
4Journal of Urban Health3623.0891092.356
5Cities3482.9668124.802
6Housing Policy Debate2982.5488581.927
7Urban Geography2902.4767294.04
8Journal of Urban Affairs2852.4254381.619
9Environment and Planning A2692.2991023.033
10Housing Studies2652.2571622.27
11Urban Affairs Review2171.8563832.192
12Habitat International1971.6845914.31
13International Journal of Urban and Regional Research1961.6761852.975
14Planning1841.57260
15City and Community1821.5522861.133
16American Journal of Community Psychology1661.4173981.509
17Social Science Research1601.3640101.959
18Journal of the American Planning Assoc.1571.3489616.95
19Journal of Planning Education and Research1551.3239813.1
20Children and Youth Services Review1491.2721951.521
21Applied Geography1481.2628863.508
22Journal of Transport Geography1421.2138383.834
23Journal of Housing and the Built Environment1381.1716491.442
24Journal of Urban History1371.179250.453
25Journal of Urban Economics1301.1152532.858
Note: Total number (N) of the publishing journals is 130. The table shows only the top 25. The number of papers is based on the count in the collection. Impact Factor (IF) is the current figure and was searched manually from the individual journal websites. Source: Scopus database.
Table 3. Top 40 most productive and cited authors in the Social Sciences collection.
RankAuthorRecordsh-IndexTotal CitationsInstitution
1Galster, G.65282619Wayne State University, United States
2Giles-Corti, B.48273280RMIT University, Australia
3Hipp, J.R.48231588University of California, Irvine, United States
4Kearns, A.39212372University of Glasgow, United Kingdom
5Musterd, S.36231834Universiteit van Amsterdam, Netherlands
6Subramanian, S.V.35202217Harvard University, United States
7Wu, F.33262534University College London, United Kingdom
8Sallis, J.F.32212551Australia Catholic University
9Immergluck, D.30161197Georgia State University, United States
10Kawachi, I.28202716Harvard T.H. Chan School of Public Health, United States
11Witten, K.2817975Massey University, New Zealand
12Diez Roux, A.V.27222756Drexel University, United States
13van Ham, M.2714850Delft University of Technology, Netherlands
14Browning, C.R.26161251Ohio State University, United States
15Talen, E.25181131University of Chicago, United States
16Owen, N.24181644The University of Queensland, Australia
17Saelens, B.E.24162519Children’s Hospital and Regional Medical Centre, United States
18Cerin, E.23161213Australian Catholic University
19Frank, L.D.23172850The University of British Columbia, United States
20Kestens, Y.22131160Université de Montréal, Canada
21South, S.J.22181639University at Albany, United States
22Sugiyama, T.2214991University of South Australia
23Ellen, I.G.21111363New York University, United States
24Andersson, R.20171121Uppsala Universitet, Sweden
25Webster, C.19141221University of Cardiff, United Kingdom
26Bolt, G.18141221Utrecht University, Netherlands
27Clark, W.A.V.1812783University of California, Los Angeles
28Cohen, D.A.18131010RAND Corporation, United States
29Conway, T.L.18141909University of California, San Diego
30Ellaway, A.18131406University of Glasgow, United Kingdom
31Koohsari, M.J.189497Waseda University, Japan
32Mavoa, S.1812610Melbourne School of Population and Global Health, Australia
33O’Campo, P.18141104University of Toronto, Canada
34Pearce, J.1813583The University of Edinburgh, United Kingdom
35Song, Y.18151240The University of North Carolina at Chapel Hill, United States
36Badland, H.1713630RMIT University, Australia
37Crawford, D.17151492The Institute for Physical Activity and Nutrition, Australia
38Crowder, K.17111018University of Washington, United States
39Freeman, L.17141122Columbia University in the City of New York
40Holloway, S.R.1714618University of Georgia, United States
Note: The 11,714 papers were written by 17,805 authors. The table shows only the top 40 authors. The h-index measures author productivity based on the number of publications and citations within the database. Source: Scopus database.
Table 4. Regional distribution of papers (1990–2020).
RankCountryRecords%CitationsRankCountryRecord%Citations
1United States582349.56197,21031Malaysia370.31696
2United Kingdom10799.1847,90732Colombia360.31822
3Canada7816.6531,33433Poland300.26572
4Netherlands4764.0514,94834Nigeria300.26651
5Australia3853.2815,06235Austria290.25535
6China3743.18695336Greece290.25286
7Sweden1491.27575837Czech Republic280.24413
8Germany1821.55383638Kenya270.23829
9France1341.14317539Ghana270.23586
10Israel1371.17403540Argentina260.22468
11New Zealand1140.97222641Estonia230.20390
12South Korea1100.94363942Egypt200.17294
13Belgium1110.94148643Bangladesh180.15270
14Italy1090.93257444Hungary170.14278
15South Africa1090.93190045Saudi Arabia160.14542
16Denmark930.79202646Pakistan160.14259
17Japan840.71193247Indonesia150.13142
18Turkey820.70122948United Arab Emirates140.12123
19Brazil810.6983649Luxembourg140.12127
20Singapore770.66159050Tanzania120.10146
21India750.64153651Russian Federation120.10208
22India740.63143052Philippines100.09113
23Finland730.62106653Qatar90.08158
24Chile700.6096654Thailand90.0856
25Portugal590.5093955Uganda90.0882
26Switzerland560.4894256Viet Nam80.07369
27Iran540.4677357Ethiopia70.06233
28Taiwan470.4038258Iceland60.05112
29Ireland470.4071959Lebanon60.0583
30Mexico460.39102060Romania60.0559
Note: Total number (N) of countries is 113. The table only shows the top 60 productive countries. Source: Scopus database.
Table 5. Top publishing institutions.
RankInstitutionRecords% ShareCountry
1University of Michigan3242.76United States
2Harvard University2652.26United States
3University of Toronto2492.12Canada
4Arizona State University2392.03United States
5University of Washington2151.83United States
6The University of North Carolina at Chapel Hill1991.69United States
7The University of British Columbia1871.59United States
8University of California, Los Angeles1821.55United States
9Universiteit van Amsterdam1801.53Netherlands
10Johns Hopkins University1761.50United States
11University of Glasgow1711.46United Kingdom
12Rutgers University1671.42United States
13University of California, Berkeley1541.31United States
14Michigan State University1501.28United States
15Northeastern University1501.28United States
16Utrecht University1471.25Netherlands
17University College London1431.22United Kingdom
18University of California, Irvine1421.21United States
19University of Pennsylvania1421.21United States
20New York University1421.21United States
21University of Illinois at Chicago1401.19United States
22University of Minnesota1381.17United States
23The Ohio State University1371.17United States
24University of Southern California1371.17United States
25Pennsylvania State University1321.12United States
26Columbia University in the City of New York1311.11United States
27Wayne State University1291.10United States
28The University of Chicago1281.09United States
29University of Georgia1211.03United States
30The University of Utah1090.93United States
Note: The total number (N) of institutions is 150. The table shows the top 30. Source: Scopus database.
Publisher’s Note: MDPI stays neutral with regard to jurisdictional claims in published maps and institutional affiliations.

