Article

Construction of a Forest Ecological Network Based on the Forest Ecological Suitability Index and the Morphological Spatial Pattern Method: A Case Study of Jindong Forest Farm in Hunan Province

Faculty of Forestry, Central South University of Forestry and Technology, Changsha 410004, China
*
Author to whom correspondence should be addressed.
Sustainability 2022, 14(5), 3082; https://doi.org/10.3390/su14053082
Submission received: 8 February 2022 / Revised: 28 February 2022 / Accepted: 3 March 2022 / Published: 7 March 2022

Abstract

:
Human activities and climate change have resulted in an increasing fragmentation of forest landscapes, and the conflict between biodiversity protection and economic development has become more pronounced. The establishment of forest ecological networks can be a vital part of biodiversity conservation and sustainable forest development. Using Jindong Forest Farm as the study area, this study combines the forest ecological suitability index, morphological spatial pattern analysis, the area method, and the landscape connectivity index (PC, IIC). This will identify ecological source areas in the study area, extract ecological corridors using the minimum cumulative resistance model and the gravity model, and construct a forest ecological network with ecological source areas as points and ecological corridors as edges. This study identified 11 forest patches in highly suitable habitat regions as ecological source regions, and 54 potential corridors were extracted. The study’s results show that a careful analysis of the forest landscape’s ecological suitability and morphological spatial pattern provides a scientific method for the rational selection of ecological source regions and serves as a reference for protecting forest species diversity and sustainable forest development.

1. Introduction

As the backbone of terrestrial ecosystems, forest ecosystems are indispensable for ecological balance and biodiversity conservation [1]. In recent years, irrational forest management has resulted in the loss and fragmentation of forest habitats and the destruction of ecological corridors, resulting in a decrease in forest landscape connectivity and, as a result, biodiversity [2,3,4]. While forests contribute significantly to human economic development, they also have a significant impact on the environment on which humans rely. As a result, forest biodiversity conservation and sustainable forest development have become matters of primary concern [5,6].
Since landscape connectivity refers to how the landscape facilitates or inhibits species movement between habitat patches, improving and maintaining forest landscape connectivity is an effective way to protect forest biodiversity [7,8]. Numerous studies have demonstrated that increasing landscape connectivity can improve species’ viability and maintain genetic diversity by allowing species to move flexibly across the landscape in response to changing resources and threats [9,10]. As a result, improving connectivity is a critical area of research in biodiversity conservation.
Establishing an ecological network is a highly effective way to increase connectivity [11]. An ecological network in the landscape consists of all existing and proposed landscape segments of ecological significance [12]. Forest ecological networks can connect fragmented habitats via ecological corridors and stepping stones to create a comprehensive landscape and biological habitat network that promotes gene exchange and species migration between forest patches, which is critical for organisms’ ability to adapt to the adverse effects of interference and climate change [13,14,15].
The essential step in establishing the forest ecological network is identifying the ecological source area [16]—which is critical for forest ecology conservation—as the areas with the highest ecological quality within the forest landscape [17]. There are numerous techniques for extracting ecological resources. While most of them prioritize forests, water bodies, and natural reserves as ecological sources based on the study area’s actual situation [18], these methods ignore the differences in forest landscape patches caused by varied terrain, soil, vegetation, and cultural conditions. Certain studies employ the minimum area threshold method directly [19], which is straightforward to use but ignores the spatial pattern of forest patches. As a result, this study employs an integrated forest ecological suitability model in conjunction with the morphological spatial pattern method to identify ecological source areas. The forest ecological suitability model can consider the impact of the natural environment and human disturbance on the suitability of forest landscape patches [20]. At the same time, the morphological spatial pattern allows for more precise identification of the critical small-area landscape as the source patch without relying on subjective judgment [21].
The research area for this study is Jindong Forest Farm. It is a national demonstration forest farm located in Hunan Province, China. However, due to the unscientific management policy and the long-term continuous planting of Chinese fir artificial pure forest in the 1980s, a series of problems occurred, including a decline in land quality, biodiversity, and ecological service function [22]. It is critical to improve the Jindong Forest Farm’s management measures. How to identify the most important patches to be protected is a major problem in scientific research. As a result, scientific identification of forest landscape source patches is essential for preserving forest species diversity and ensuring the forest’s long-term viability. We propose the novel integration of the forest ecological suitability model and the morphological spatial pattern to identify priority areas. The objectives are to (1) determine the core area of forest landscape using the forest ecological suitability model, the morphological spatial pattern method, and the area method; (2) assess the connectivity of core area patches using the landscape connectivity index to determine the study area’s ecological source area; and (3) extract the ecological corridor using MCR and the gravity model to build the forest ecological network.

2. Materials and Methods
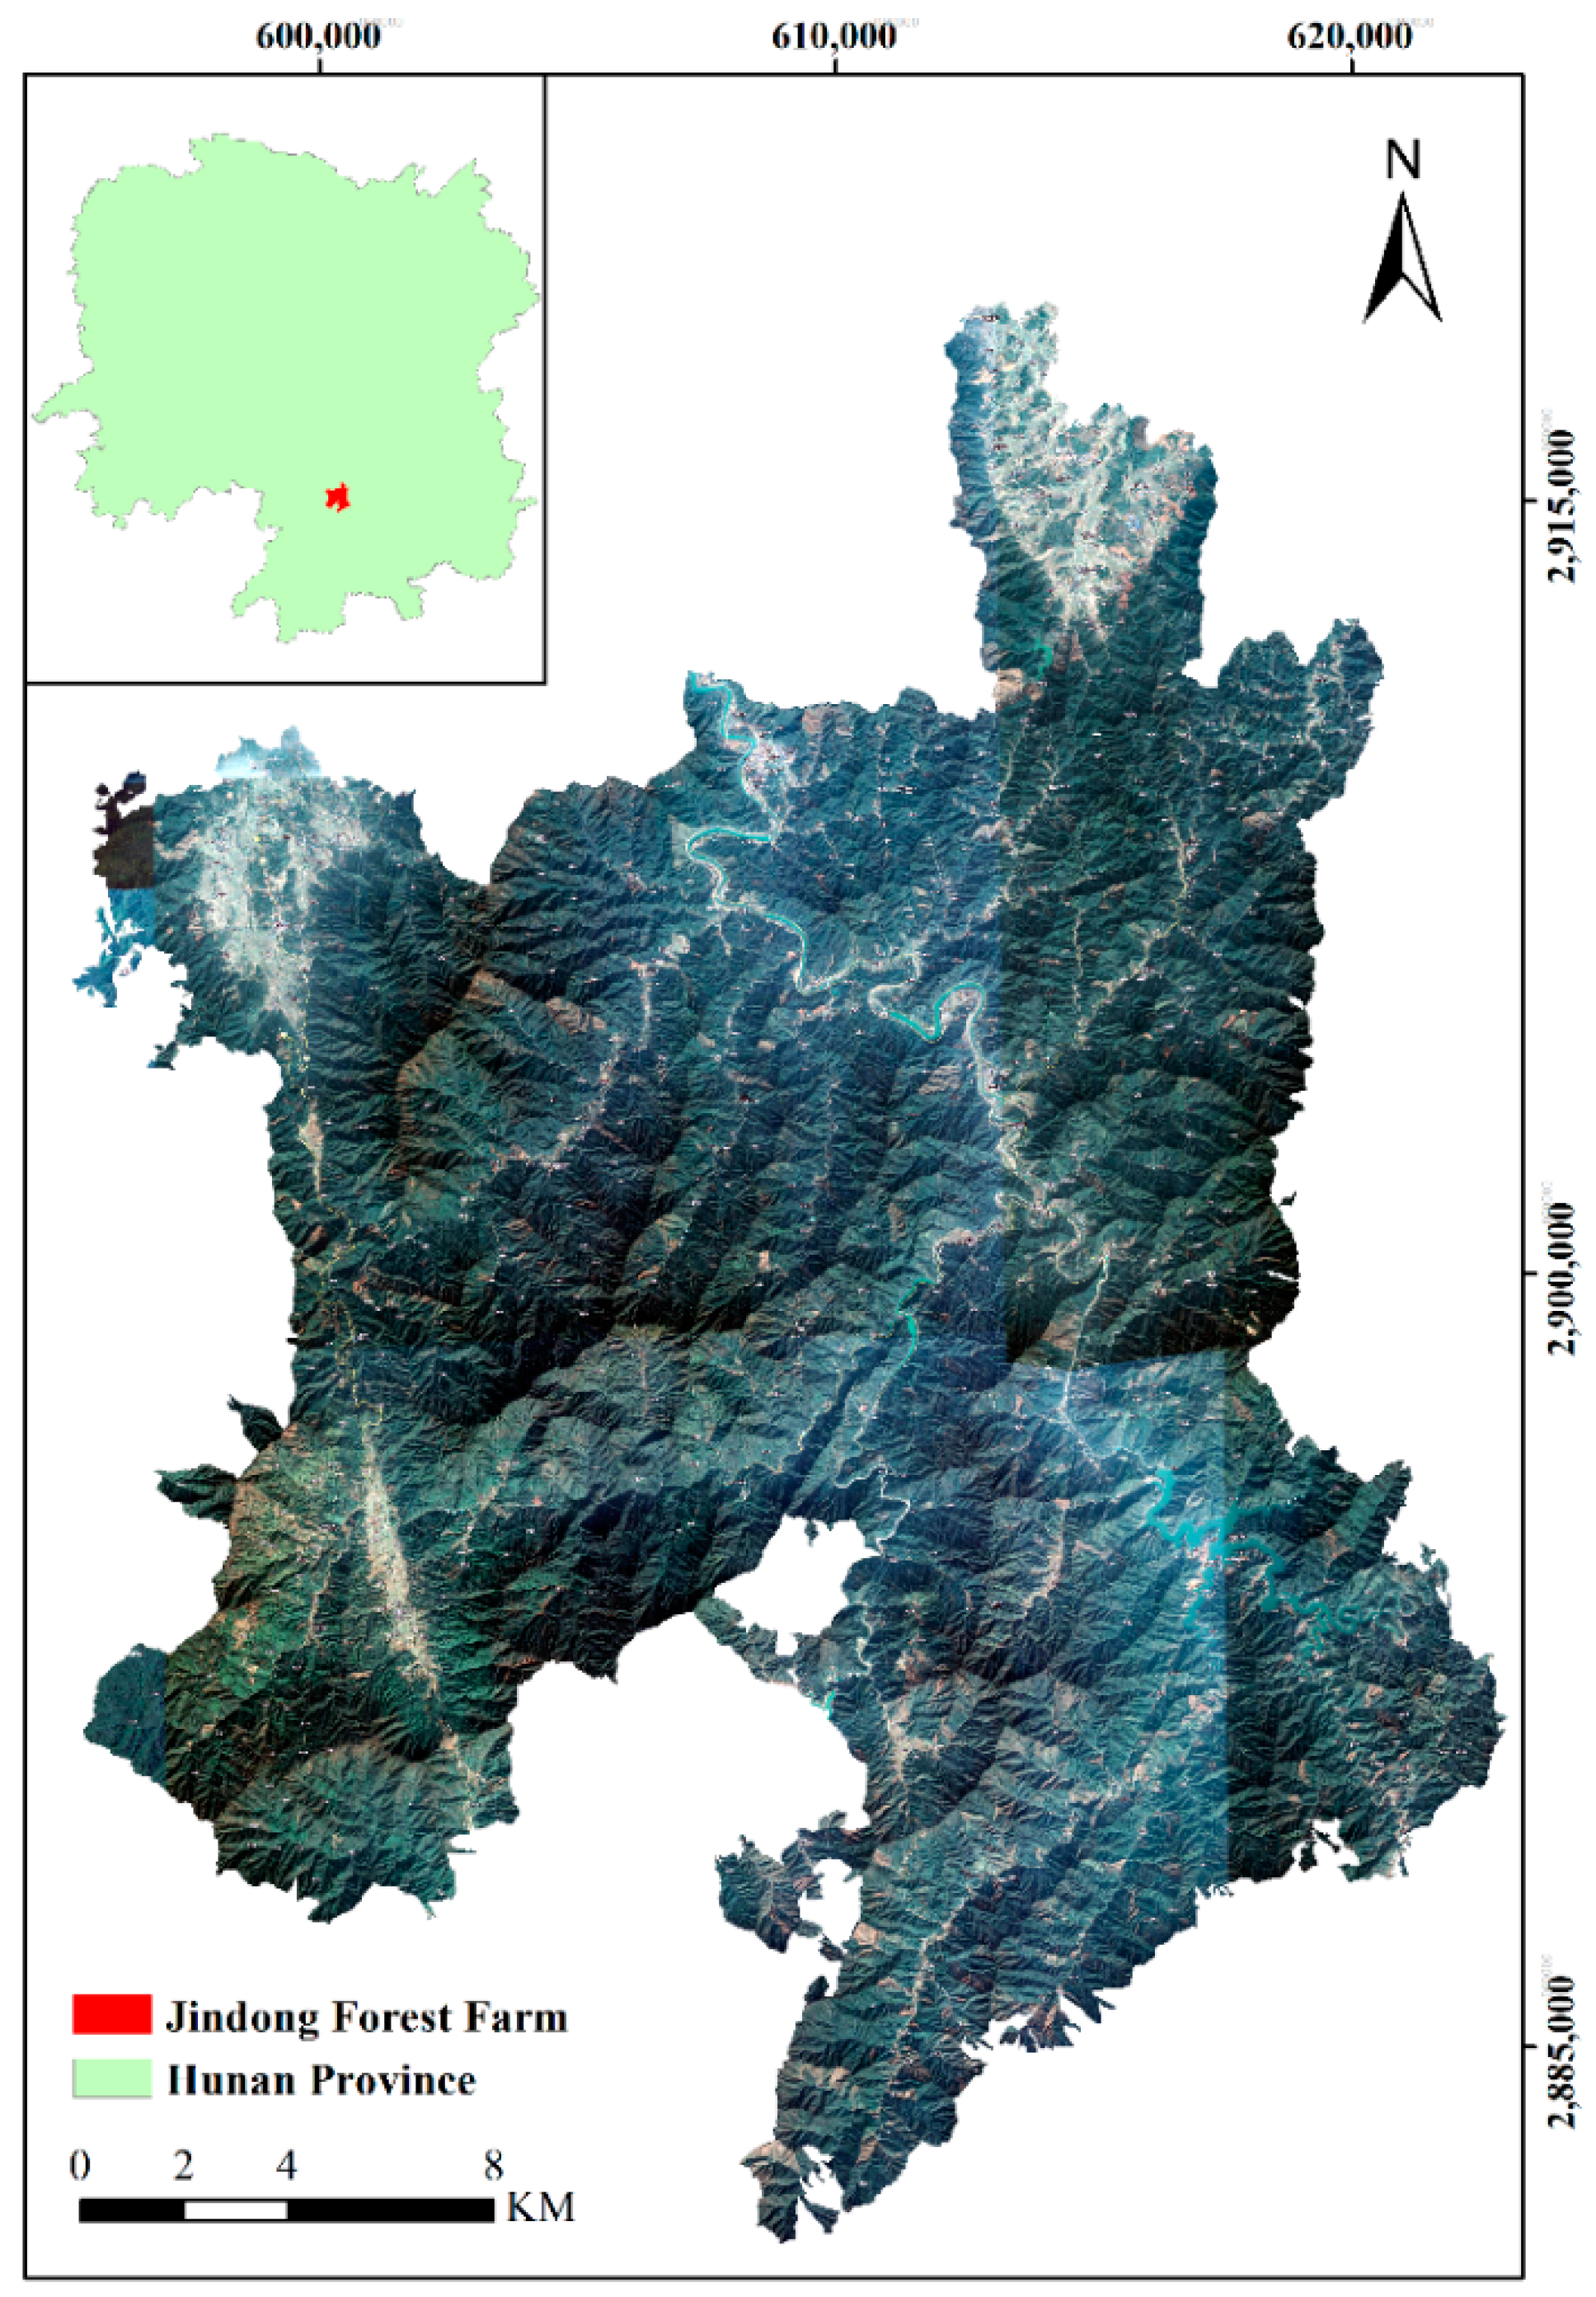
2.1. Study Area

Jindong Forest Farm is located in Yongzhou City’s southern Qiyang County and northeast of the Nanling Mountain System’s Yangming Mountain range (Figure 1). The northeast has a low elevation, while the southwest has a high elevation. The farm’s mountains vary in width and length, measuring approximately 33 km east to west and 36 km north to south. The mountain range is located in the humid subtropical southeast monsoon climate zone. The annual average temperature ranges between 16.5 and 17.7 degrees Celsius, and the annual precipitation ranges between 1600 and 1890 mm. The study sites’ soils are predominantly red, yellow, and yellow-brown mountain soil. The predominant forest type is a subtropical, artificial Chinese fir forest. The major vegetation types are evergreen broadleaf forests, deciduous broadleaf forests, evergreen needleleaf forests, coniferous and coniferous broadleaf mixed forests, and bamboo forests. According to the most recent forest management inventory, the land area under Jindong Forest Farm’s jurisdiction is 53,963 hm2. The forest growth and management area is 50,240.2 hm2, accounting for 93.1%, and the forest coverage rate has reached 87.74%.

2.2. Data Resource

This study’s Digital Elevation Map (DEM) data (1 June 2020) was provided by Geospatial Data Cloud, Computer Network Information Center, Chinese Academy of Sciences (http://www.gscloud.cn, accessed on 7 February 2022). A total of 18,163 sub-classes are based on Hunan Province’s 2014 forest management inventory. BIGMAP provides high-resolution satellite images, vector data for the road network, and vector data for the water system (1 June 2020). The topographic condition index layer’s slope and slope direction data are derived from the Jindong management area’s Digital Elevation Map (DEM) processed with ArcGIS software. The 2014 forest management inventory provided information on the slope position, soil type, soil thickness, vegetation type, forest age, and origin. Data from similar years are used to ensure data consistency, and all data coordinate systems are transformed, unified, spatially corrected, and preprocessed.

2.3. Methods

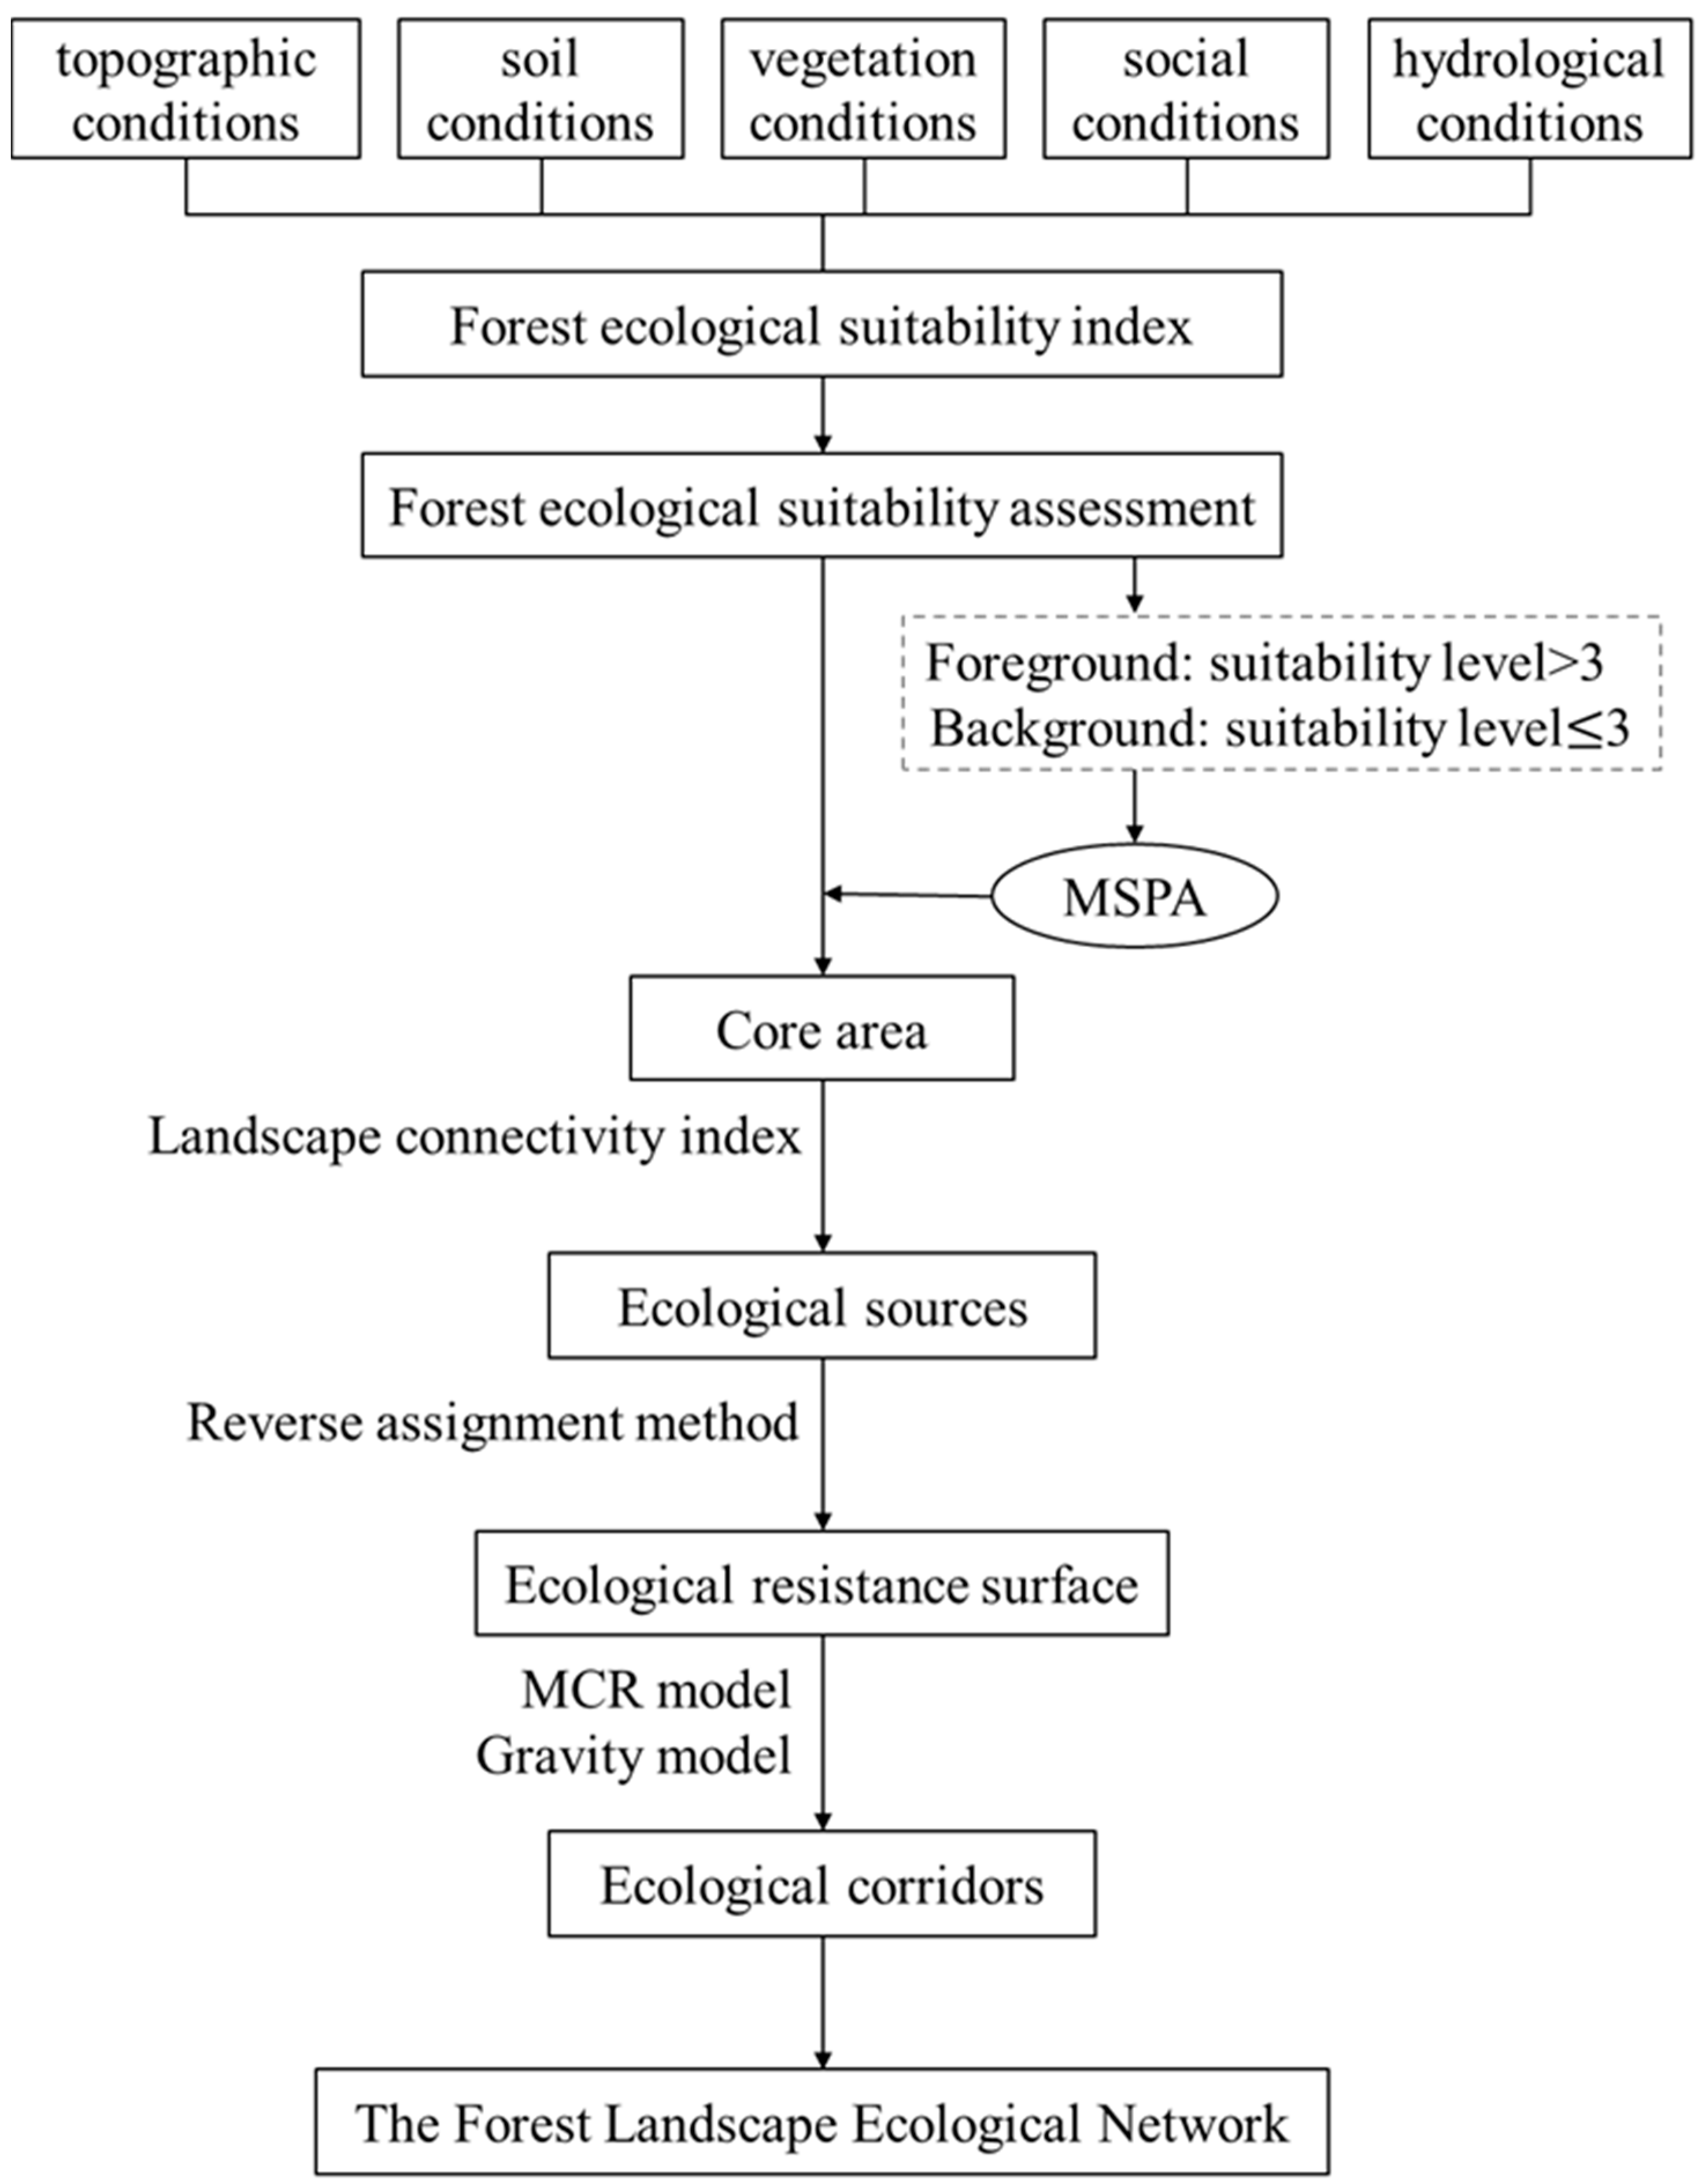
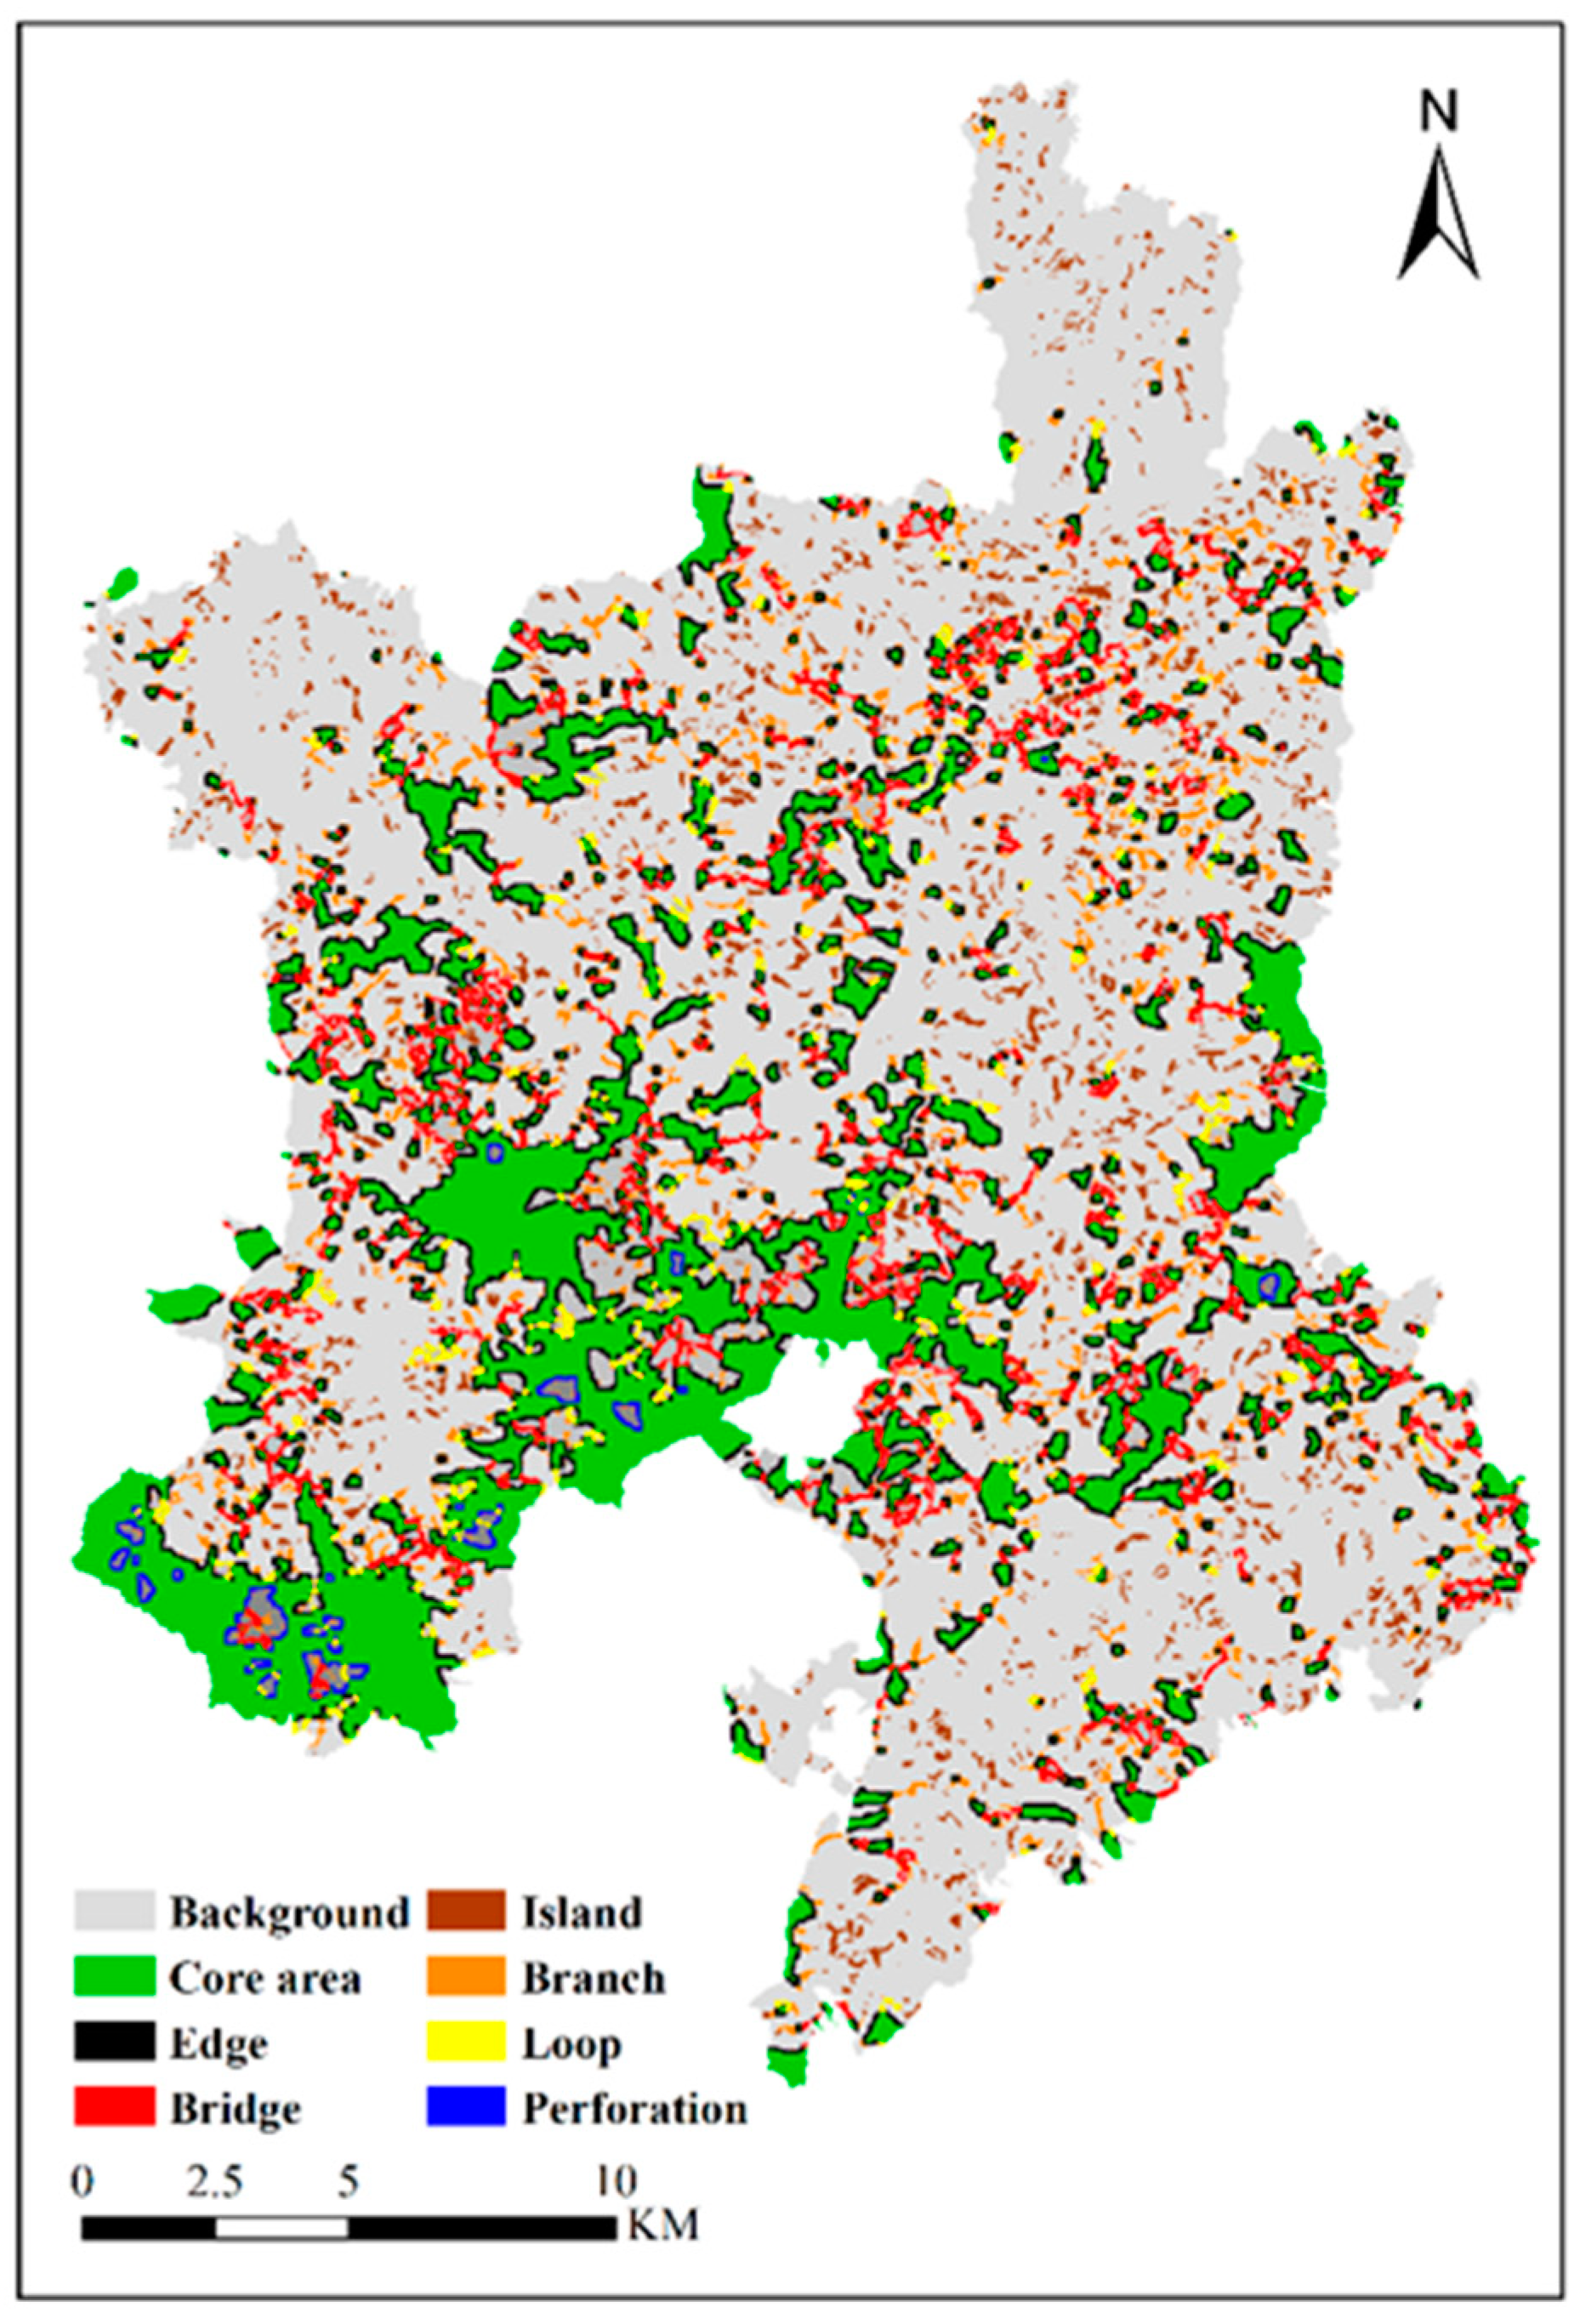
2.3.1. Core Area Identification Based on FESI and MSPA

To comprehensively describe forest ecological suitability from various perspectives, we used five categories of metrics based on relevant research [23,24,25,26] and the study area’s characteristics. Among the metrics are the following: (1) Topographic conditions: slope aspect, slope position and slope; (2) soil conditions: soil type and soil thickness; (3) vegetation conditions: canopy density, origin and forest age; (4) social conditions: distance from roads, villages and towns; (5) hydrological conditions: distance from water areas.
The forest ecological suitability grade assigned to each influencing factor is based on a classification standard ranging from high to low. It is classified into five categories: most appropriate, more appropriate, generally acceptable, less acceptable, and unsuitable. The Analytic Hierarchy Process (AHP) is used to determine the weights for each suitability index factor (Table 1), and the weighted average model in fuzzy mathematics (Equation (1)) is used to calculate the ecological suitability of each forest landscape class in the area:
S   = i = 1 n w i × P i
where S is the score of the comprehensive evaluation of forest landscape ecological suitability of the evaluation unit; i is the number of evaluation factors and n is the total number of selected evaluation factors; w i is the weight of the i th evaluation factor; P i is the score of the i th evaluation factor.
The vector layers of each factor are analyzed and processed by ArcGIS software. After the vector layers of each factor are converted into grid files (grid accuracy is 30 m × 30 m), the grid files of each factor are weighted and superimposed to obtain the evaluation results of forest landscape patch suitability. The results are normalized to obtain the forest ecological suitability index (Equation (2)):
F E S I i = S i S m i n S m a x S m i n
Referring to the evaluation methods of relevant forest resource evaluation [27], the forest ecological suitability index is divided into five classes according to the principle of equidistant division, corresponding to the lowest suitable habitat, lower suitable habitat, moderate suitable habitat, higher suitable habitat, and highest suitable habitat.
Patches with suitability levels greater than three are considered foreground in the MSPA analysis, while patches with lower suitability levels are considered background. This method places a premium on structural connectivity and depends entirely on land use data. The prospect is then divided into seven distinct, non-overlapping landscapes based on their form (core areas, bridges, edges, branches, loops, islands, and perforations) [21]. The data is converted to a TIFF format binary grid data file. Then, using the eight-neighborhood analysis method and the Guidos Toolbox software, the edge width parameter is set to 2 (a reference to the radius of a circle with an area of 1 hectare), the physical distance is set to 60 m, and the particle size is set to 30 m for MSPA analysis. The seven obtained landscape types are counted.

2.3.2. Evaluation of Landscape Connectivity

The landscape connectivity index indicates the fluency of ecological processes in the landscape. Considering that patches with a small area are not suitable for forest ecological suitability, this study comprehensively analyzes the spatial scale of the study area and the calculation amount involved in the ecological source and selects the core area with a size greater than 1 hectare as the landscape element of the connectivity analysis. Using three types of indexes—namely, the integral index of connectivity (IIC, Equation (3)), the probabilistic connectivity index (PC, Equation (4)), and the patch importance index (dI, Equation (5)) [28]—and using Conefor 2.6 software, the patch connectivity distance threshold is set to 1000 m and the connectivity probability is set to 0.5 [29]. The patches with a dI value greater than or equal to 1 are taken as the ecological source, and the remaining core is divided into the important core area (0.3 ≤ dI < 1) and the general core area (dI < 0.3).
I I C = i = 1 n j = 1 n a i a j 1 + n l i j A L 2
P C = i = 1 n j = 1 n P i j ˙ * a i a j A L 2
d I = I I r e m o v e I × 100 %
where n is the total number of patches in the landscape, ai, and aj are the areas of patch i and patch j, respectively, nlij is the connection between patch i and patch j, AL is the total area of the landscape, and P i j ˙ * is the greatest possibility of direct diffusion of species in patches i and j. I is the connectivity index value of a landscape, which refers to IIC and PC, and I r e m o v e is the connectivity index value of the landscape after removing patch i from the landscape.

2.3.3. Construction of Forest Ecological Network Based on the MCR Model

The Minimum Cumulative Resistance (MCR) method can determine the minimum path of consumption between a source and a target. It is the optimal path for biological species migration and dissemination, as it effectively avoids all forms of external interference [30]. In conjunction with the MSPA and landscape connectivity evaluation results, the vital core area is designated as the study area’s core landscape, and the suitability evaluation results are converted to an ecological resistance surface using the reverse assignment method (Equations (6) and (7)). To construct the resistance surface of the study area, various resistance values are assigned. The reverse assignment formula is as follows:
if   S 4 , r e s i s t a n c e = 1
if   S < 4 , r e s i s t a n c e = e ln ( 0.001 ) 4 × S × 10 3
where S is the ecological suitability value of the forest landscape. The suitability values are divided into four categories: type 1: 0 ≤ S ≤ 1.975; Type 2: 1.975 < S ≤ 2.519; Type 3: 2.519 < S ≤ 3.069; Type 4: 3.069 < S ≤ 4.155. The calculated ecological resistance values are 33, 13, 5, and 1, respectively. The result of the reverse assignment method is transformed into the ecological resistance surface by using the reclassification in ArcGIS.
The Cost Connectivity tool in ArcGIS10.4 spatial analysis is used to generate the minimum path between source and target patches, remove duplicate edges, and construct an interaction matrix based on the gravity model to quantify the interaction intensity between habitat patches and thus determine the relative importance of potential ecological corridors scientifically. According to the matrix results and the reality of the study area, corridors with an interaction intensity greater than 100 are classified as important corridors. In contrast, the remaining corridors are classified as general corridors. The study area’s ecological network diagram is then constructed.
In summary, the flowchart of this study’s analysis and research procedures is as follows (Figure 2).

3. Results

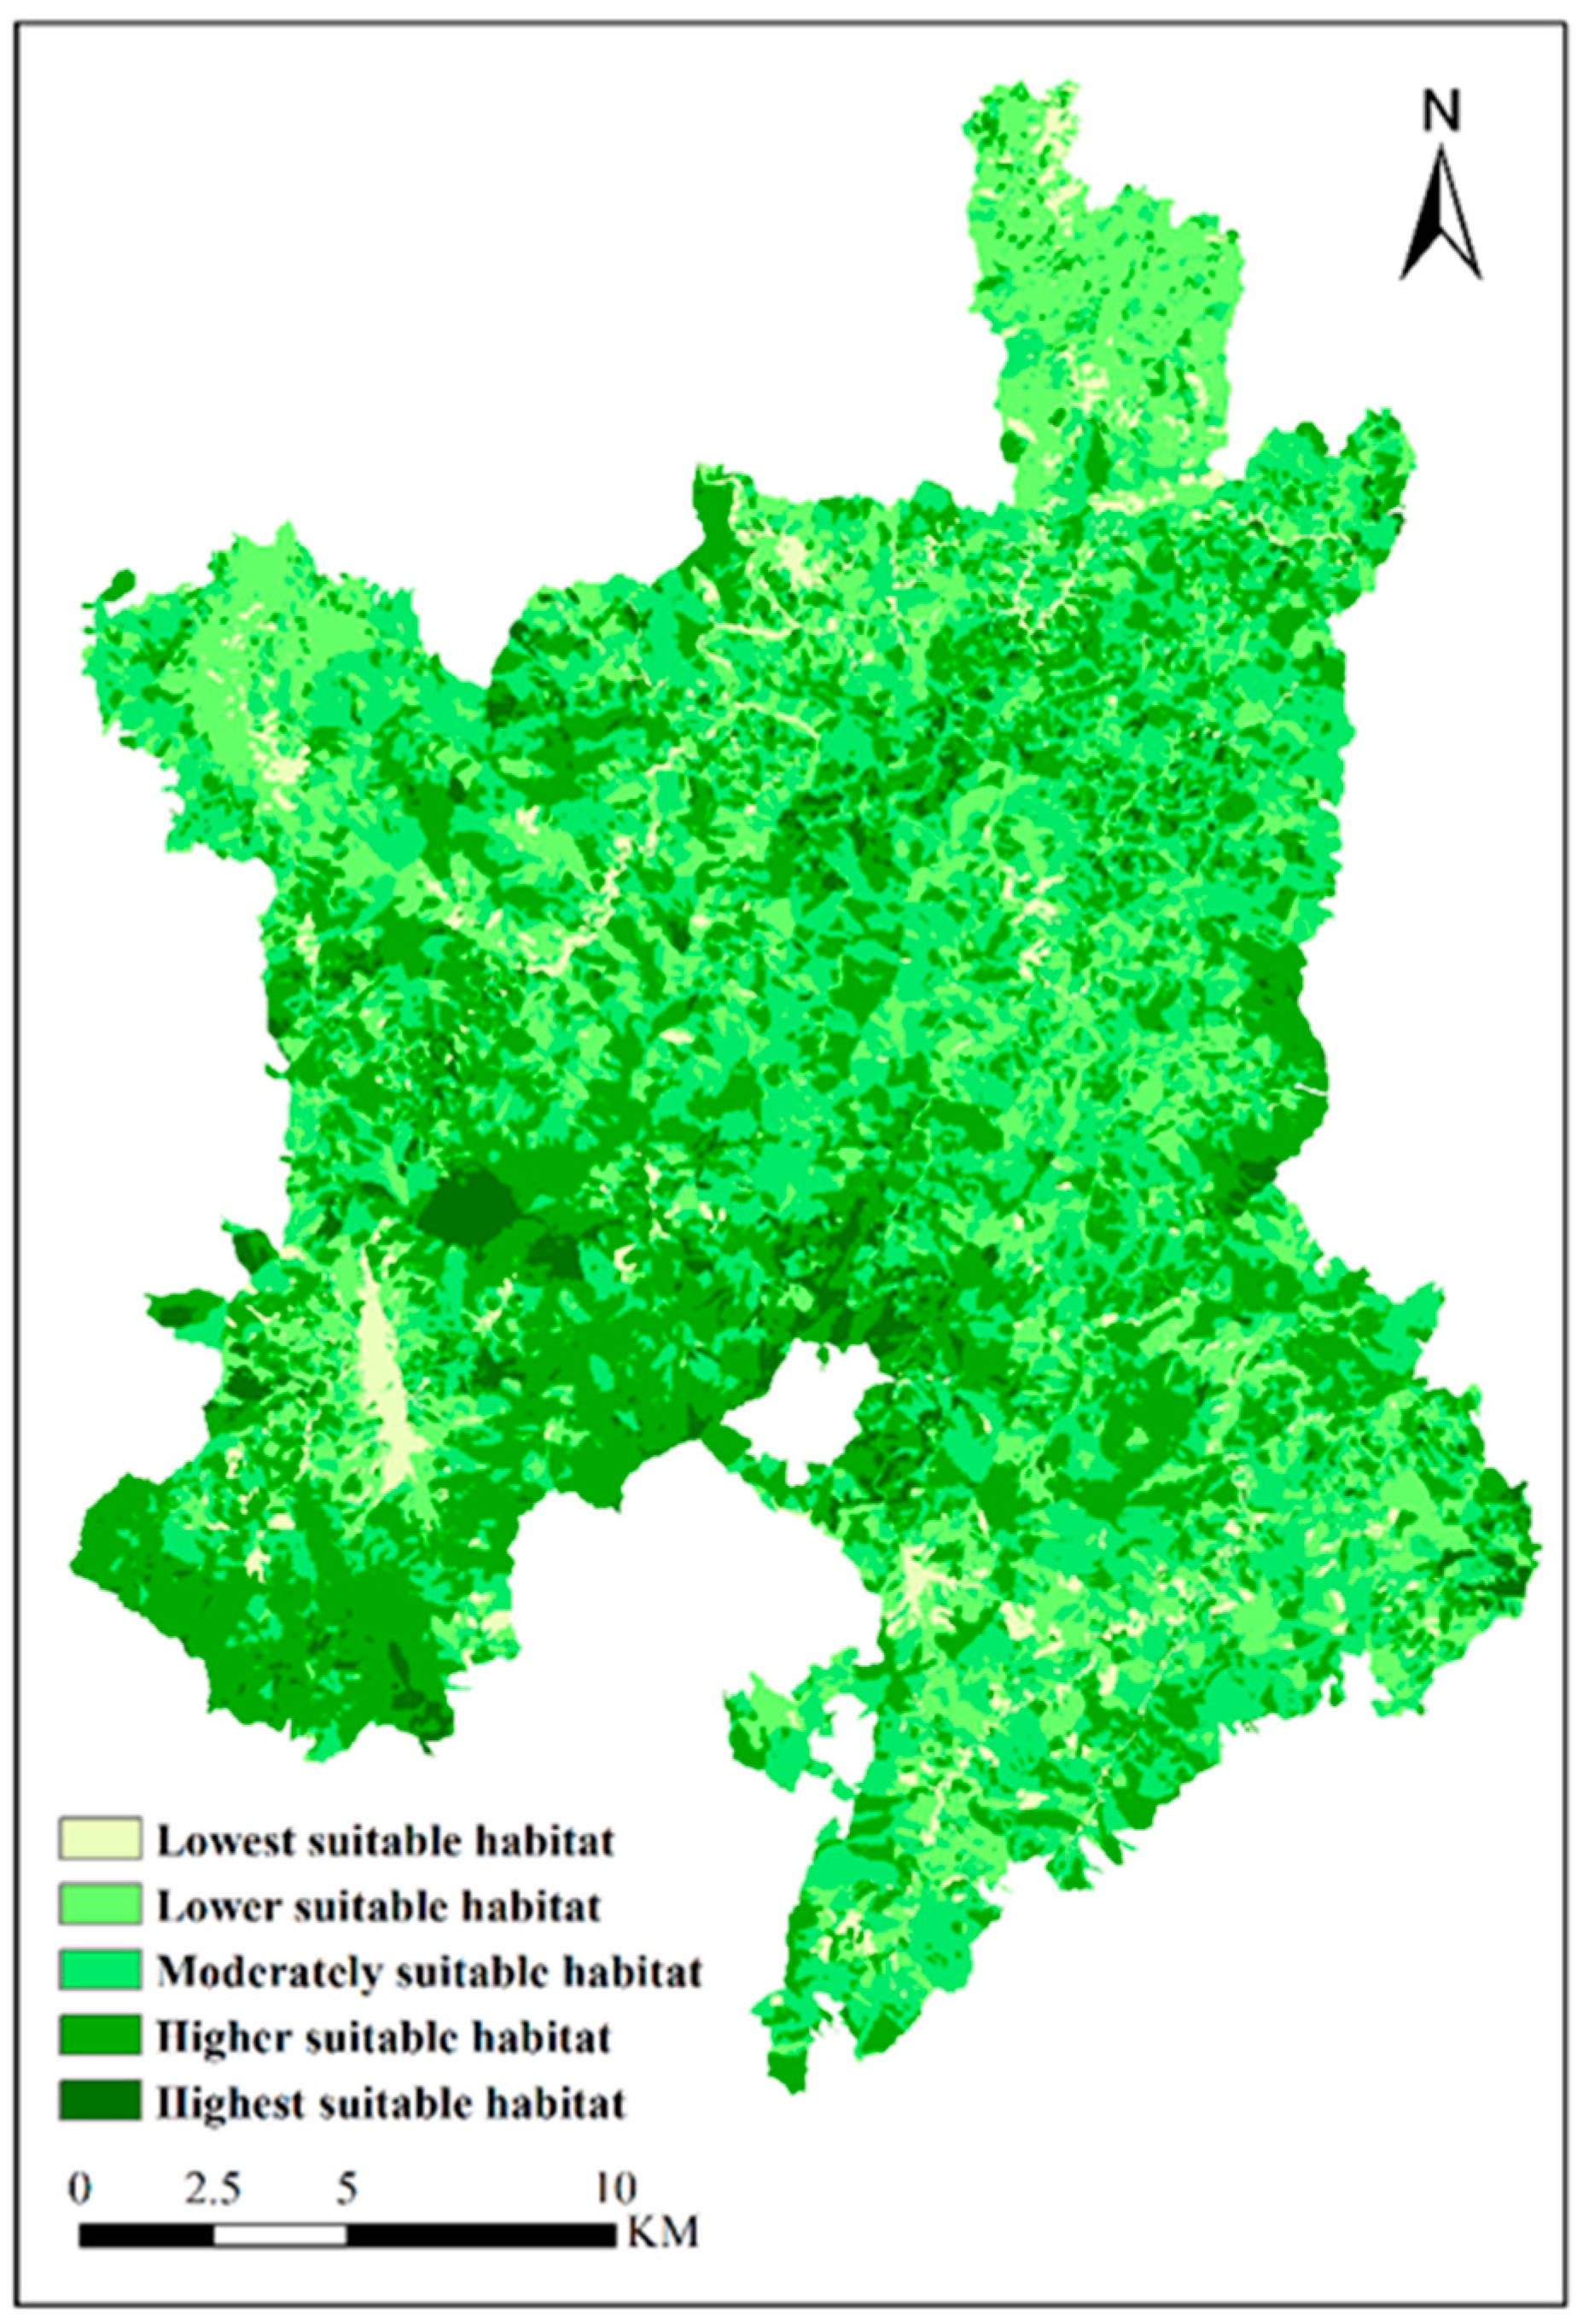
3.1. Distribution of Forest Landscape Suitable Areas and Landscape Types

The slope direction, slope position, slope, soil type, soil layer thickness, canopy density, origin and forest age, distance from the road, distance from villages and towns, and distance from water area are the ten main influencing factors of forest ecological suitability analysis in Jindong Forest Farm, with weights of 0.07, 0.02, 0.04, 0.08, 0.16, 0.13, 0.26, 0.06, 0.06, and 0.12 (CI = 0.001, CR = 0.015 < 0.1), respectively. The obtained suitability index values of the study area are divided into five equidistant grades, that is, the habitat types of the five suitable habitats (Figure 3). The lowest suitable habitat is about 1967.582 hm2, accounting for 0.04% of the study area. The lower suitable habitat area is about 12,843 hm2, accounting for 0.25% of the study area, mainly distributed in the west and north of the study area. The moderately suitable habitat area is about 18,291.69 hm2, accounting for 0.35% of the study area, which is scattered. The higher suitable habitat area is about 17,032.68 hm2, accounting for 0.33% of the study area. The highest suitable habitat area is about 1982.07 hm2, accounting for 0.04% of the study area, mainly distributed in the center and southwest of the study area (Table 2 and Figure 3).
The higher suitable habitat and the highest suitable habitat are taken as the foreground for MSPA analysis, and the landscape types are obtained, as shown in Figure 4. The area of each classification and its proportion are counted. It can be seen that the core area of the study area is about 7312.5 hm2, accounting for 38.6% of the area of the suitability area and 0.14% of the total area of the study area. The core patches in the north and east of the study area are relatively few and scattered, with poor connectivity. The edge area and perforation are the inner and outer edges of the landscape patches, accounting for 31.41% and 1.21% of the area of the suitable area and 0.11% of the total area of the study area. As a constituent element of the ecological network, the influence range of the edge effect needs to be considered. The bridge area is about 2186.52 hm2 as a structural corridor in the landscape, accounting for 11.5% of the suitable area and 0.04% of the total area of the study area, which has essential ecological significance for species migration and diffusion. The branches are interruptions of corridor connection with some connectivity, accounting for 6.57% of the suitable area and 0.02% of the total area of the study area. Island patches are isolated woodland patches that can serve as steppingstones for organisms, occupying a small area and scattered in a fragmented manner in the study area. The loops are a shortcut for animal movement within the patches and facilitate the migration of species within the same patches, occupying 1.94% of the suitable area (Table 3).

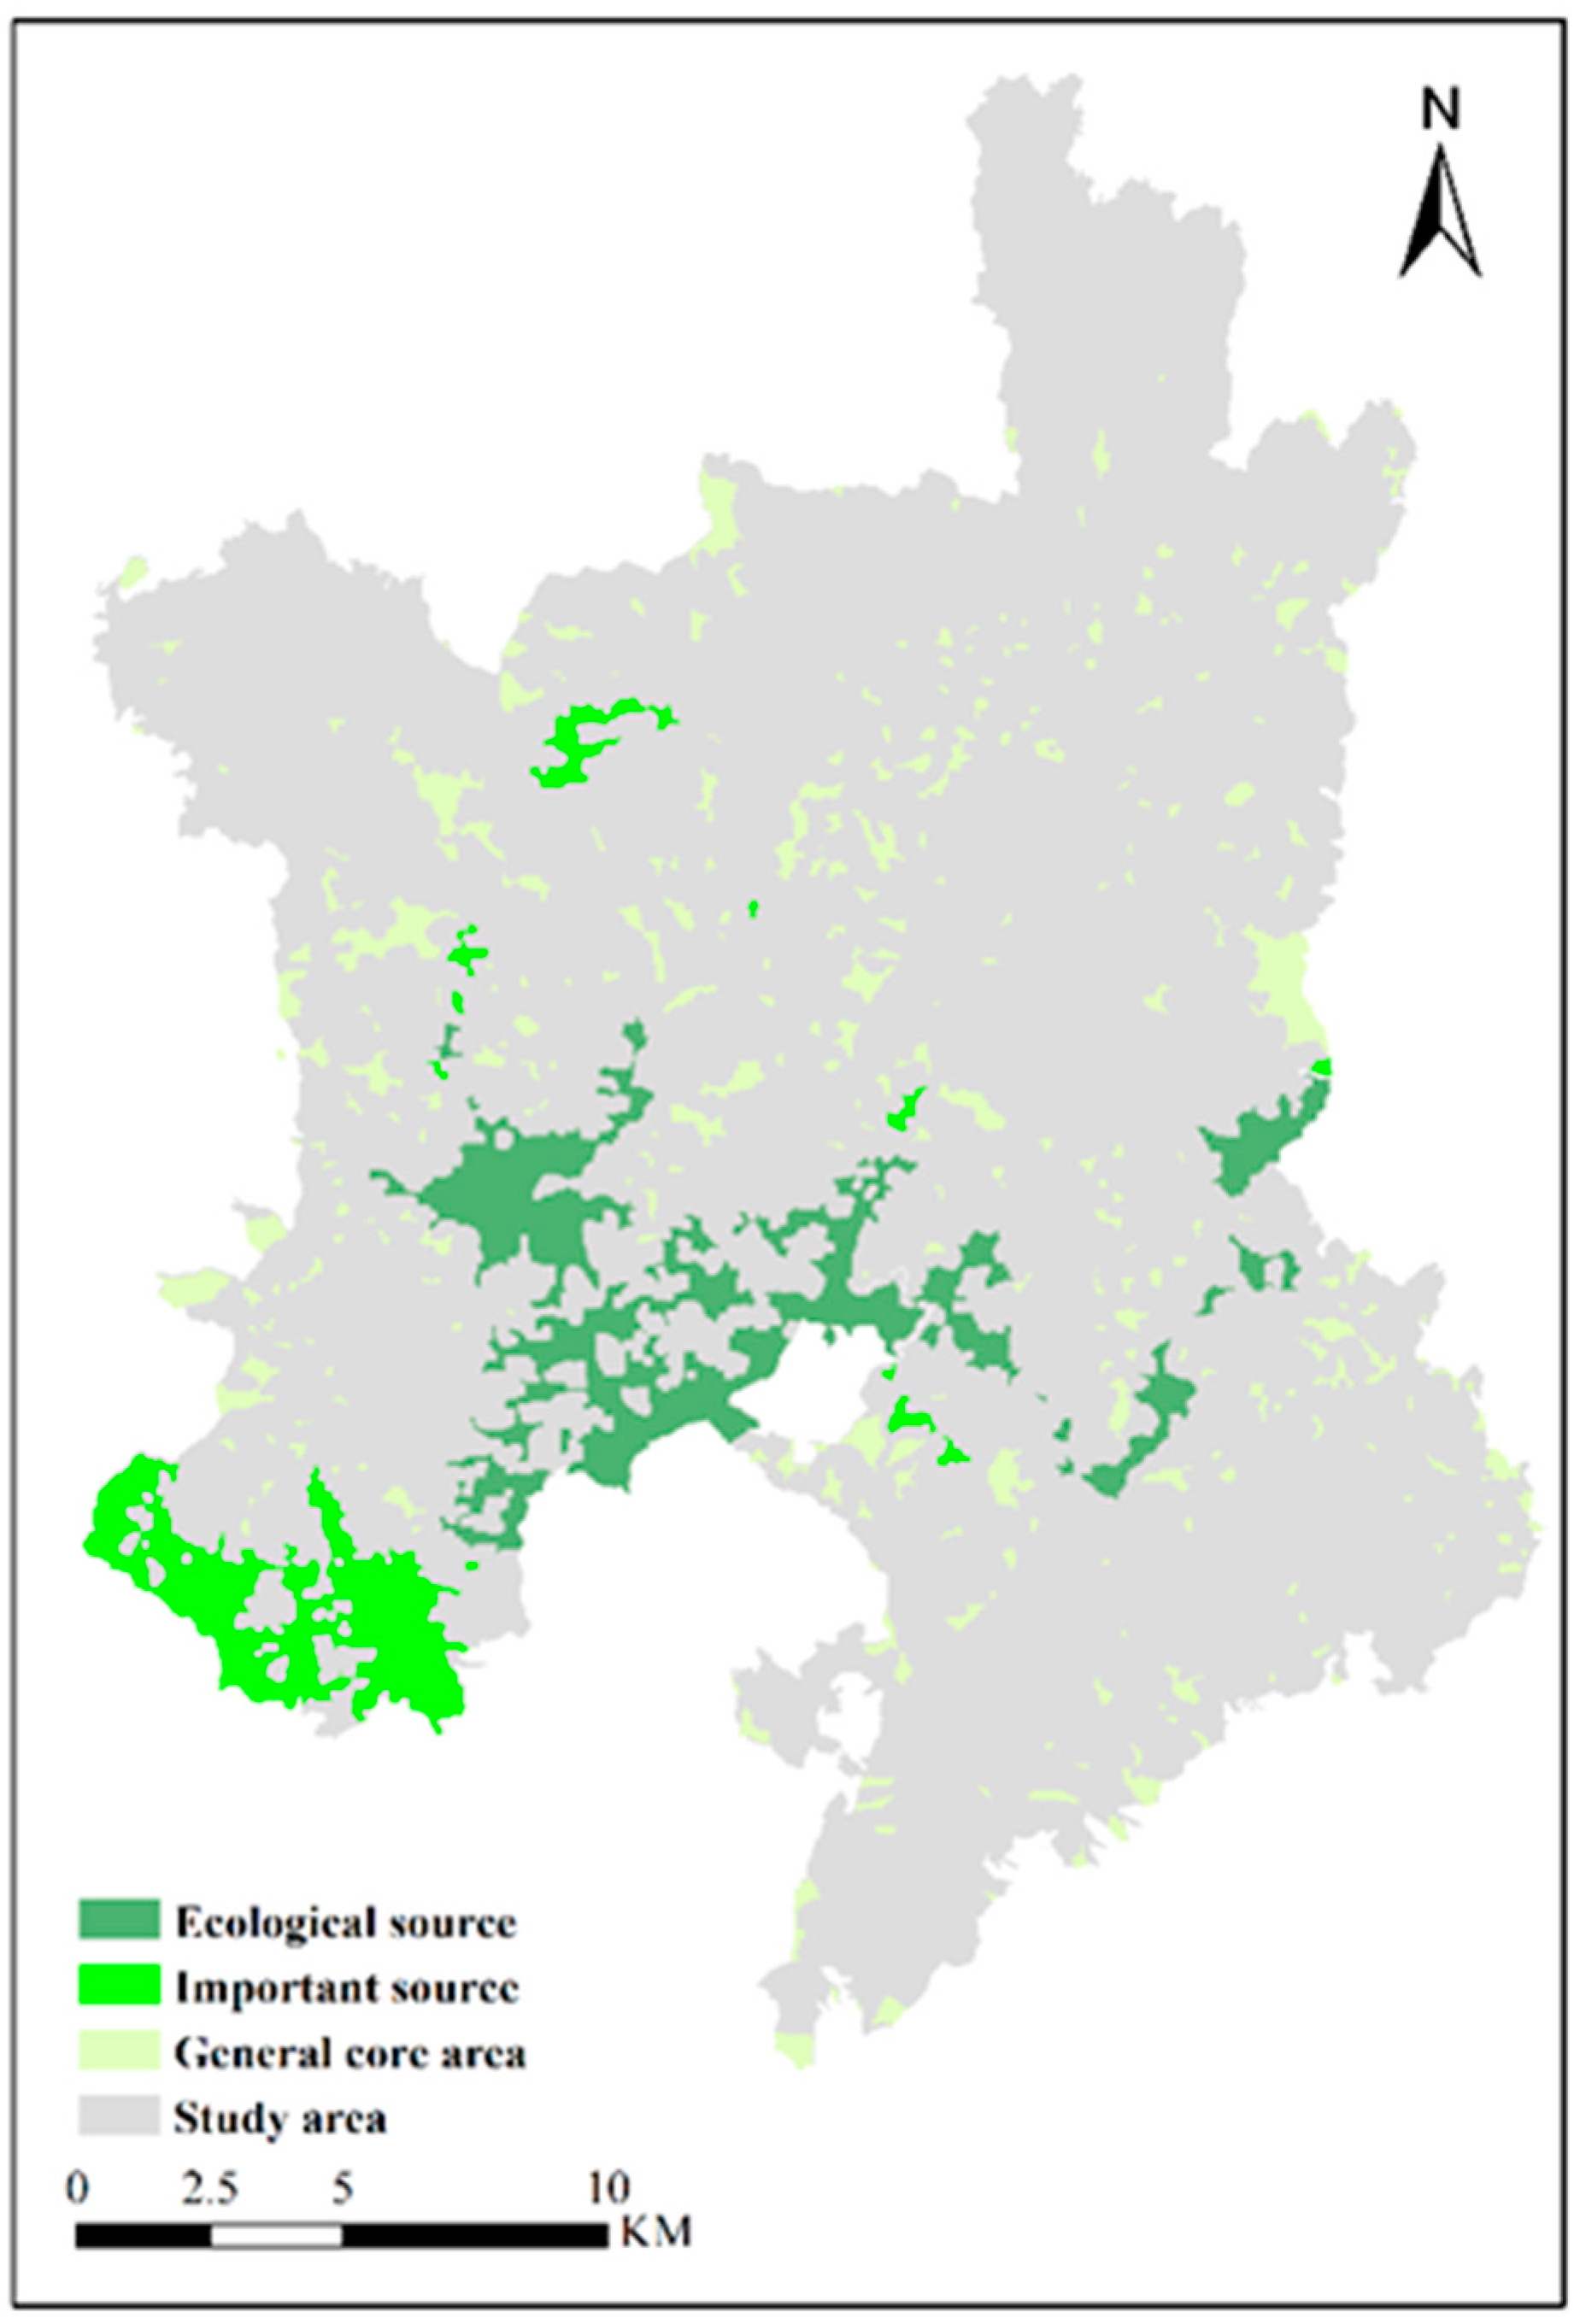
3.2. Landscape Connectivity Evaluation

First, patches less than 1 hectare in the core area are removed to analyze the importance and spatial distribution characteristics of the core area, and 345 patches in the core area are ranked by the importance index value after elimination. The cumulative contribution values of dI are counted and it is found that the number of patches with cumulative contribution values in the top 50% of both dIIC and dPC is only one. The number of patches with cumulative contribution values in the top 90% is also small, indicating that a few patches in the study area significantly affected the overall connectivity level (Table 4). The fourteen patches with the highest dIIC and dPC are selected (Table 5). Patches 301, 281, 188, 251, 284, and 221 appear in the top 10 of the dIIC and the dPC simultaneously, indicating that these six patches are highly important. The patches with the highest dIIC or dPC value significantly impact the overall connectivity relative to the standard patches. They are the areas that needed to be protected and maintained as a priority.
The absence of a generally important patch would not affect the overall connectivity level by more than 0.3%. In comparison, the lack of a very important patch would reduce the general connectivity level by more than 1%. Five of the ten patches with the highest dIIC values are very important, while all ten patches with the highest dPC values have very high importance values. The patches with significant dPC values are considered as ecological source areas. In contrast, the patches with moderately important dPC values are important core areas, and those with generally important dPC values are deemed to be general core areas (Figure 5).

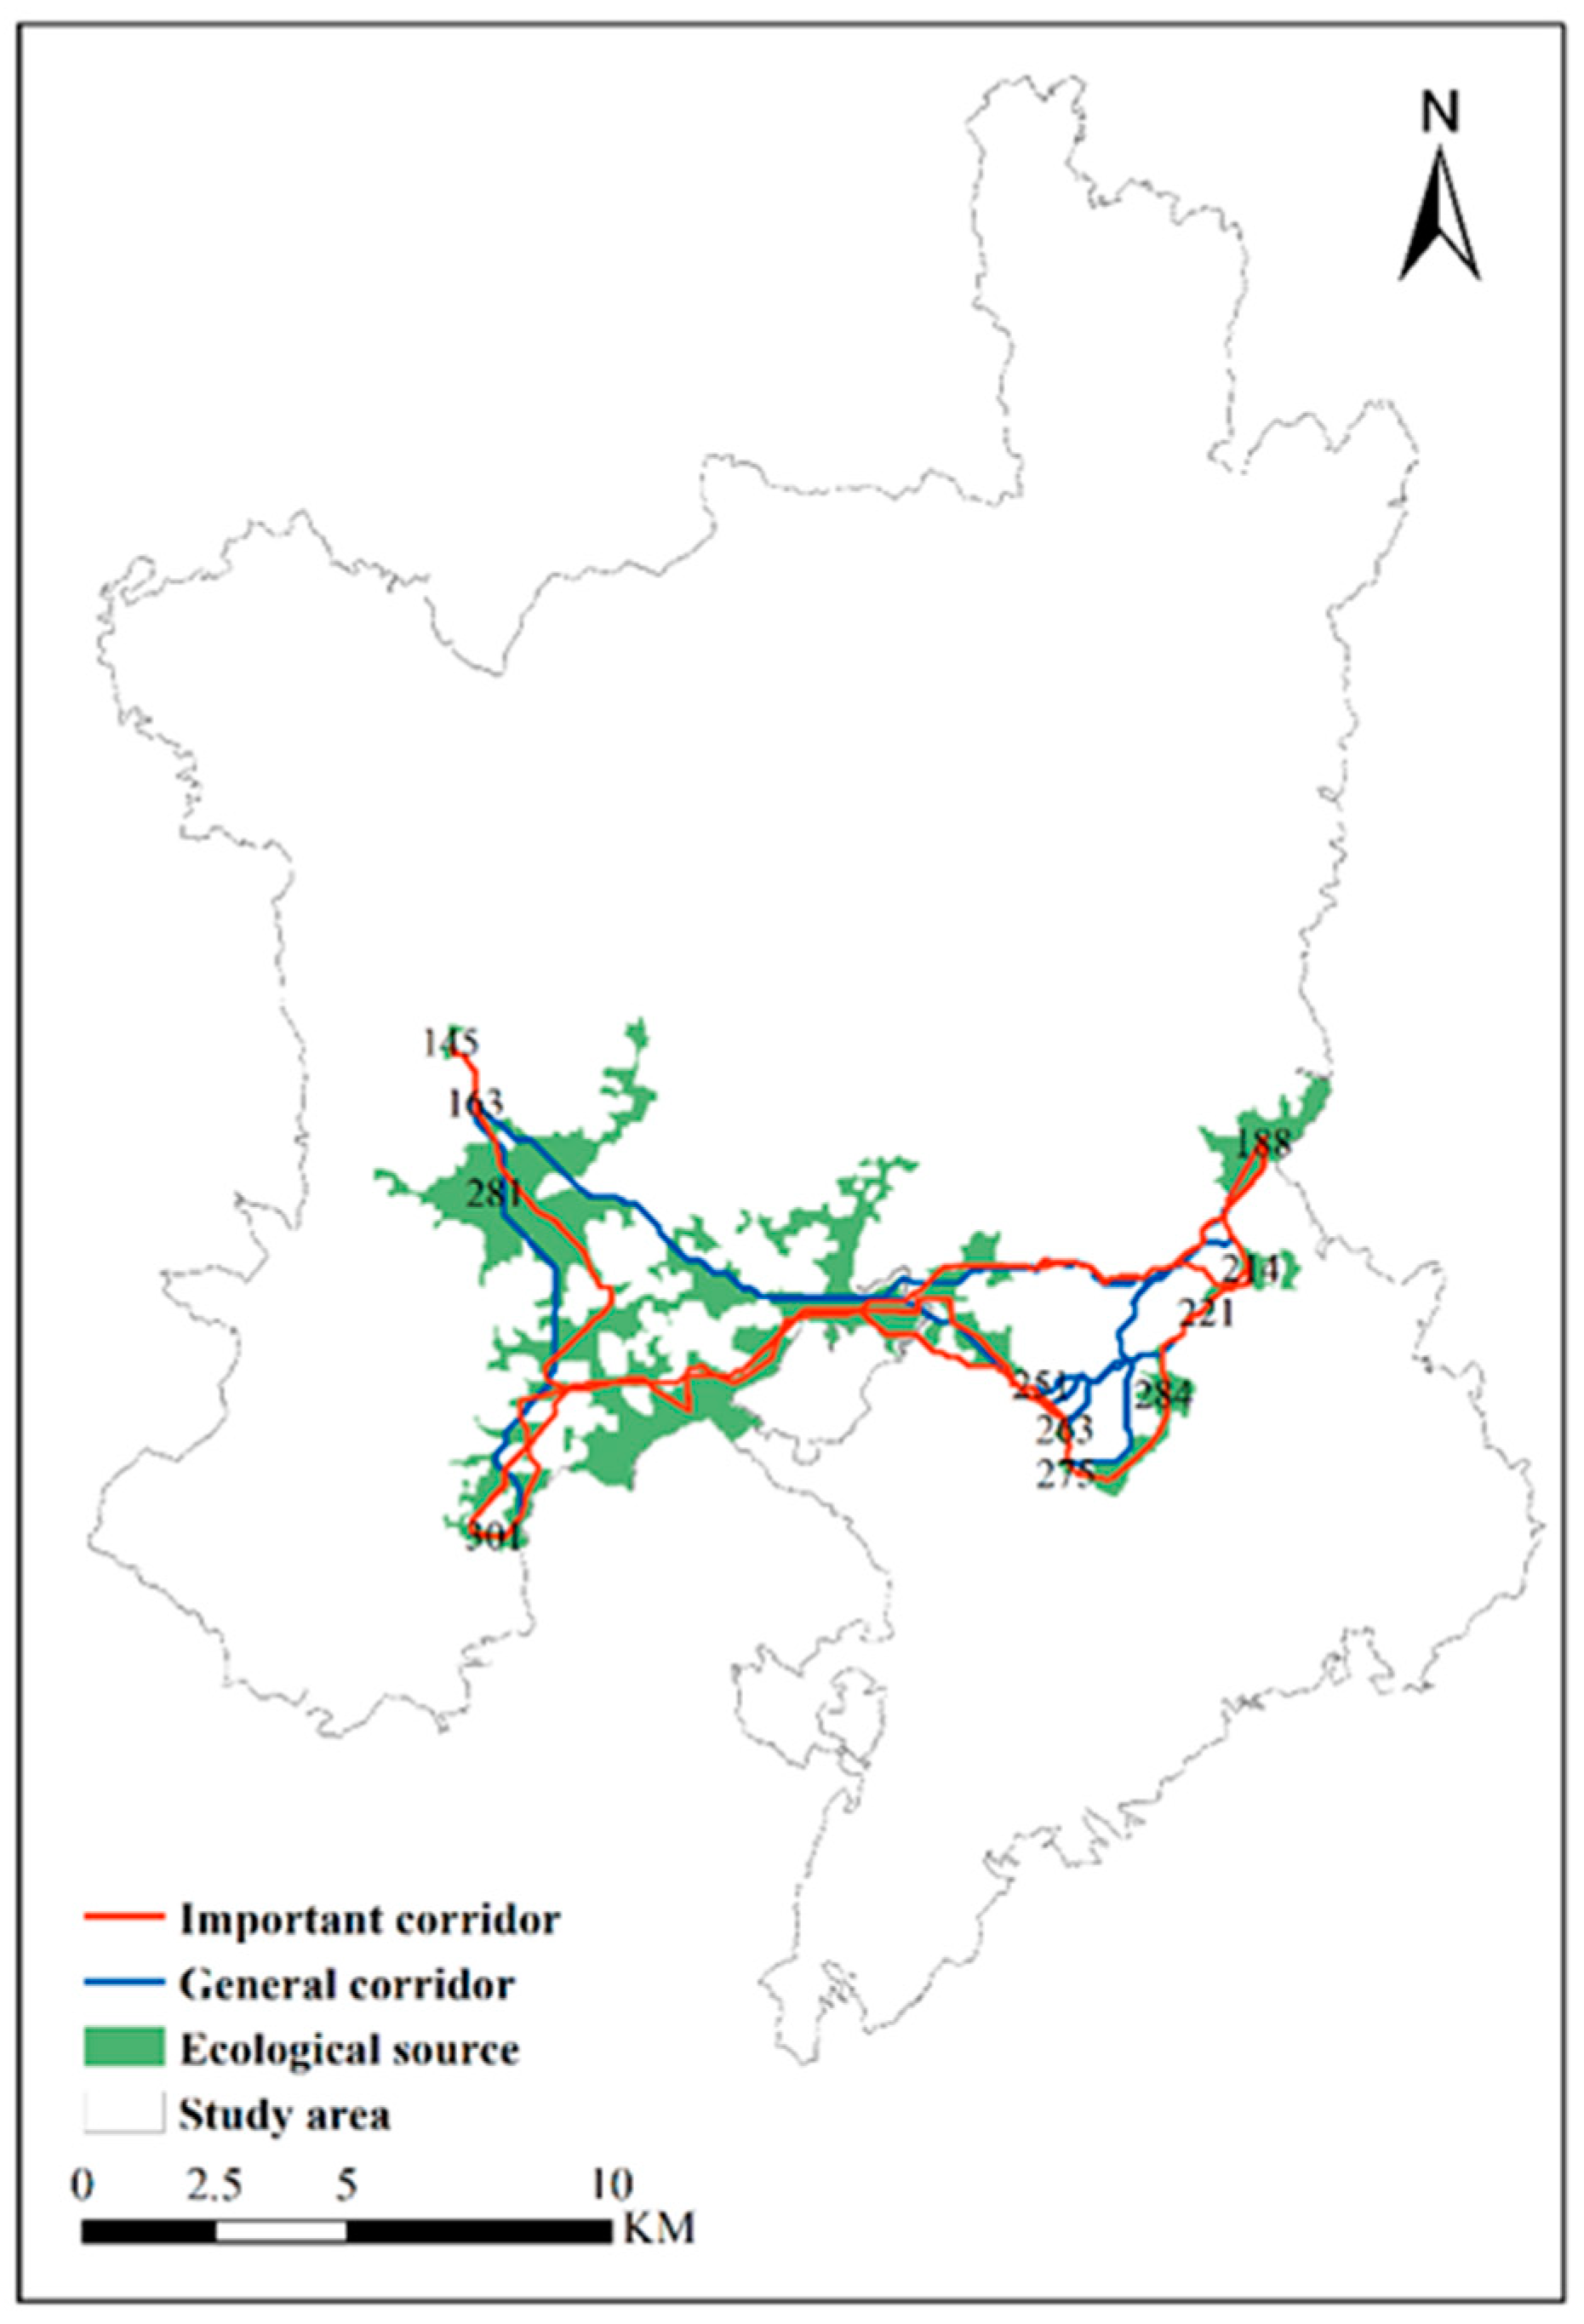
3.3. Construction of Forest Ecological Network Based on MCR Model

The degree to which patches interact indicates the importance of the corridors between them. The ecological network of the study area is identified using the minimum cumulative resistance model and includes a total of 54 potential corridors. According to the matrix results (Table 6) and the actual situation in the study area, 20 important corridors and 34 general corridors are identified, and repeated paths are eliminated to create forest ecological corridors throughout the study area (Figure 6).
As can be seen from Table 6, the most potent interaction between patches 263 and 275 is 6186.85, indicating that the two patches are close together, their landscape resistance is low, their correlation is high, and the possibility of biological migration between these two patches is high. The interaction intensity between patches 284 and 163 is the lowest, indicating significant landscape resistance between these two patches and impeding species migration.

4. Discussion

4.1. Core Area Selection Based on FESI and MSPA Models

As shown in Table 2 and Figure 3, the five landscape types are typically distributed geographically, with the lowest suitable and lower suitable habitats being concentrated in the northern and western parts of the study area, i.e., the towns in Jindong Forestry Farm. Although social conditions have a negligible direct effect on the forest’s ecological suitability, the intensity of human activities will affect the forest vegetation in various ways, rendering it unsuitable for forest vegetation growth. The highest suitable and higher suitable habitats are concentrated in the study area’s south-central region. The corresponding areas contain natural forests close to the water and away from roads, creating an ideal tree growth and development environment.
The combination of the FESI and MSPA models leverages the benefits of both, while mitigating their respective weaknesses. Specifically, the MSPA method simplifies the judging of landscape patterns, but it does not adequately account for landscape differences in practical ecological problems [31,32], while the FESI model can identify differences between landscapes but does not take into account the spatial pattern of the landscape enough [33]. In this study, the forest ecological network construction method based on the FESI and MSPA models integrates morphological spatial pattern analysis and ecological suitability analysis to select the core area, which compensates for the lack of differences between the same forest landscape and identifies the forest patches with more suitable conditions as core areas, considering not only the morphological spatial pattern of the landscape patches but also their ecological suitability. The selection procedure is quantitative and does not rely on the objectivity associated with the traditional artificial selection of natural reserves as source patches.
While the integrated approach has several advantages, it does face some obstacles: (1) Determining the weight of factors used to evaluate forest ecological suitability in a comprehensive evaluation. Because there is no unified standard or authoritative criteria [34], the weight is determined using the traditional analytic hierarchy process. (2) Because MSPA is highly sensitive to the study scale of the landscape, the input data’s pixel size and edge width will lose some elements, and data at different scales will produce inconsistent results [35]. The study area is Jindong Forestry Farm, and because larger particle sizes result in information loss, a study scale of 30 m × 30 m was chosen based on previous research. The magnitude of MSPA should be discussed and studied further in the future. (3) The value of the edge width has a significant effect on the MSPA analysis results. Given the research area’s size and the data’s accuracy, this paper refers to the minimum core area threshold of 1 hectare as the area of the circle, setting the edge width to 2, which references the radius of the circle, and the actual edge width is 60 m.

4.2. Analysis of Landscape Connectivity

Eleven ecological source areas were chosen based on the dPC values of the core areas, indicating that the well-connected core patches were primarily located in the study area’s central and southern regions. Compared to the northern areas, the forest patches in the central and southern areas are more conducive to biological species migration, material, and energy exchange and can provide better habitats for species. Establishing new ecological sources in the study area’s north and southeast areas is necessary.
However, the distance threshold must be set in the Confer2.6 software when calculating landscape connectivity. The distance threshold value affects the IIC and PC values. When the core interval’s distance exceeds the threshold, the software considers the core areas to be disconnected. Increasing the distance threshold typically improves connectivity [20]. Setting the distance threshold requires considering the study area’s size and biological characteristics. The location of the threshold in this study is 1000, with a probability of connectivity of 0.5 [29].

4.3. Analysis of Forest Ecological Network Construction

In landscape planning, it is necessary to strengthen the protection of ecological corridors between patches 263 and 275 to ensure the connectivity of the two patches and the flow of materials and energy and increase the connectivity of corridors between patches 284 and 163 to improve the habitat suitability of corridors.
In general, the ecological corridors created by the MCR model are primarily concentrated in the study area’s central and southern regions. Between the north and south is a significant fault. The study area’s overall connectivity is relatively poor. As a result, new ecological corridors should be planned and constructed in the north and east of the study area to optimize the forest ecological network.
The MCR model presents a problem with the assignment of the resistance surface. The ecological resistance surface is constructed using the reverse assignment method, taking topographic conditions, soil conditions, vegetation conditions, social and hydrological conditions, and forest ecological suitability level results, thereby avoiding the objectivity associated with an artificial assignment. The MCR model identifies potential corridors in the forest ecological network. Then, the gravity model is used to quantitatively evaluate the strength of connections between ecological source areas and identify the more significant ecological corridors. This method can quantify the degree of species diffusion and information flow between forest ecological source areas and can be used to guide forest ecology and corridor planning.

5. Conclusions

This study identifies the core patch using a combination of the FESI and MSPA models, considering the spatial morphological significance of the patches as well as the suitability of the forest landscape patches, thus improving the objectivity of the previous forest ecological network construction, which relied solely on large forest patches as source patches. The connectivity indices PC and IIC were used to quantify the importance of core patches in the study area, which reduced the subjectivity associated with previous ecological source selection. The findings indicate that the study area’s southern and central portions contain source patches with high ecological suitability and important corridors. The forest landscape’s ecological suitability and morphological spatial pattern should be considered comprehensively. In the north and southeast of the study area, new ecological source areas and ecological corridors should be re-planned and constructed to optimize the ecological network system, promote material exchange and energy flow within the study area’s forests, and increase biodiversity. Therefore, our study indicated that the novel integration of the FESI and MSPA models led to an effective approach to identify the most important natural areas to be protected to support decision-making for nature reserve conservation and landscape planning.

Author Contributions

Q.T. participated in all parts of this work. T.T. and P.L. performed part of the experimental data collection. J.L., T.T. and D.W. revised the whole paper. All authors contributed to the experiment design. All authors have read and agreed to the published version of the manuscript.

Funding

The research was supported by the National Natural Science Foundation of China (31470642).

Institutional Review Board Statement

Not applicable.

Informed Consent Statement

Not applicable.

Data Availability Statement

Please contact the authors via email for the data.

Conflicts of Interest

The authors declare no conflict of interest.

References

  1. Zhao, Y.; Wen, Q.; Ai, J. Ecosystem service value of forests in Yunnan province. For. Res. 2010, 23, 184–190. [Google Scholar]
  2. Evans, T.A.; Dawes, T.Z.; Ward, P.R.; Lo, N. Ants and termites increase crop yield in a dry climate. Nat. Commun. 2011, 2, 262. [Google Scholar] [CrossRef] [PubMed]
  3. Hansen, M.C.; Wang, L.; Song, X.P. The fate of tropical forest fragments. Sci. Adv. 2020, 6, eaax8574. [Google Scholar] [CrossRef] [Green Version]
  4. Peter, P.; Matthew, C.H.; Lars, L.; Svetlana, T.; Alexey, Y.; Christoph, T.; Wynet, S.; Ilona, Z.; Anna, K.; Susan, M.; et al. The last frontiers of wilderness: Tracking loss of intact forest landscapes from 2000 to 2013. Sci. Adv. 2017, 3, e1600821. [Google Scholar]
  5. Grantham, H.S.; Duncan, A.; Evans, T.D. Anthropogenic modification of forests means only 40% of remaining forests have high ecosystem integrity. Nat. Commun. 2020, 11, 5978. [Google Scholar] [CrossRef]
  6. Barbier, E.B.; Burgess, J.C. The economics of tropical deforestation. J. Econ. Surv. 2001, 15, 413–433. [Google Scholar] [CrossRef]
  7. Philip, D.T.; Lenore, F.; Kringen, H.; Gray, M. Connectivity is a vital element of landscape structure. Oikos 1993, 571–573. [Google Scholar] [CrossRef] [Green Version]
  8. Matisziw, T.C.; Gholamialam, A.; Trauth, K.M. Modeling habitat connectivity in support of multiobjective species movement: An application to amphibian habitat systems. PLoS Comput. Biol. 2020, 16, e1008540. [Google Scholar] [CrossRef]
  9. Baguette, M.; Van Dyck, H. Landscape connectivity and animal behavior: Functional grain as a key determinant for dispersal. Landsc. Ecol. 2007, 22, 1117–1129. [Google Scholar] [CrossRef]
  10. Saura, S.; Pascual-Hortal, L. A new habitat availability index to integrate connectivity in landscape conservation planning: Comparison with existing indices and application to a case study. Landsc. Urban Plan. 2007, 83, 91–103. [Google Scholar] [CrossRef]
  11. Nikolakaki, P. A GIS site-selection process for habitat creation: Estimating connectivity of habitat patches. Landsc. Urban Plan. 2004, 68, 77–94. [Google Scholar] [CrossRef]
  12. Buček, A.; Maděra, P.; Úradníček, L. Czech approach to implementation of ecological network. J. Landsc. Ecol. 2012, 5, 14–28. [Google Scholar] [CrossRef]
  13. Lin, L. Multi-Objective Planning of Urban Forest Ecological Network in Wuhan. Master’s Thesis, Huazhong Agricultural University, Wuhan, China, 2011. [Google Scholar]
  14. Hargrove, W.W.; Hoffman, F.M.; Efroymson, R.A. A practical map-analysis tool for detecting potential dispersal corridors. Landsc. Ecol. 2005, 20, 361–373. [Google Scholar] [CrossRef]
  15. Cook, E.A. Urban landscape networks: An ecological planning framework. Landsc. Res. 1991, 16, 7–15. [Google Scholar] [CrossRef]
  16. García-Feced, C.; Saura, S.; Elena-Rosselló, R. Improving landscape connectivity in forest districts: A two-stage process for prioritizing agricultural patches for reforestation. Forest Ecol. Manag. 2011, 261, 154–161. [Google Scholar] [CrossRef]
  17. Zhang, Y.-Z.; Jiang, Z.-Y.; Li, Y.-Y.; Yang, Z.-G.; Wang, X.-H.; Li, X.-B. Construction and Optimization of an Urban Ecological Security Pattern Based on Habitat Quality Assessment and the Minimum Cumulative Resistance Model in Shenzhen City, China. Forests 2021, 12, 847. [Google Scholar] [CrossRef]
  18. Dutta, T.; Sharma, S.; McRae, B.H.; Roy, P.S.; DeFries, R. Connecting the dots: Mapping habitat connectivity for tigers in central India. Reg. Environ. Chang. 2015, 16, 53–67. [Google Scholar] [CrossRef]
  19. Zhang, X.; Jin, X.; Han, B.; Sun, R.; Liang, X.; Li, H.; Zhou, Y. Identification and optimization of ecological network in the plain area of the lower Yangtze River: A case study of Jintan District, Changzhou. Acta Ecol. Sin. 2021, 41, 3449–3461. [Google Scholar]
  20. Tang, T.; Li, J.; Sun, H.; Deng, C. Priority areas identified through spatial habitat suitability index and network analysis: Wild boar populations as proxies for tigers in and around the Hupingshan and Houhe National Nature Reserves. Sci. Total Environ. 2021, 774, 145067. [Google Scholar] [CrossRef]
  21. An, Y.; Liu, S.; Sun, Y.; Shi, F.; Beazley, R. Construction and optimization of an ecological network based on morphological spatial pattern analysis and circuit theory. Landsc. Ecol. 2020, 36, 2059–2076. [Google Scholar] [CrossRef]
  22. Li, Q. Study on Target Tree Density of Cunninghamia lanceolata–Phoebe Bournei Mixed Forest in Jindong Forest Farm. Master’s Thesis, Central South University of Forestry & Technology, Changsha, China, 2019. [Google Scholar]
  23. Li, Y.; Hu, Y.; Chang, Y. Effect zone of forest road on plant species diversity in Great Hinggan Mountains. Chin. J. Appl. Ecol. 2010, 21, 1112–1119. [Google Scholar]
  24. Yu, W.; Ren, T.; Zhou, W.; Li, W. Forest fragmentation and its relationship with urban expansion in Guangdong-HongKong-Macao Great Bay Area, China. Acta Ecol. Sin. 2020, 40, 8474–8481. [Google Scholar]
  25. Li, B.; Du, C.; Yuan, H.; Wu, C.; Xu, Y. Site Classification and quality evaluation of Cunninghamia lanceolata plantation in Hubei province. Hubei For. Sci. Technol. 2020, 49, 1–5. [Google Scholar]
  26. Ma, X.; Zhang, H.; Cheng, J.; Lu, X.; Zhang, J.; Sun, L. Site type division of three gorges reservoir area. J. Northeast For. Univ. 2011, 39, 109–113. [Google Scholar]
  27. Yang, R. Ecotourism-Oriented Research on Ecological Suitability Evaluation in Langxiang Town. Master’s Thesis, Harbin Institute of Technology, Harbin, China, 2017. [Google Scholar]
  28. Ye, H.; Yang, Z.; Xu, X. Ecological corridors analysis based on MSPA and MCR model—A case study of the Tomur World Natural Heritage Region. Sustainbility 2020, 12, 959. [Google Scholar] [CrossRef] [Green Version]
  29. Liu, C.; Zhou, B.; He, X.; Chen, W. Selection of distance thresholds of urban forest landscape connectivity in Shenyang City. Chin. J. Appl. Ecol. 2010, 21, 2508–2516. [Google Scholar]
  30. Chen, C.; Shi, L.; Lu, Y.; Yang, S.; Liu, S. The optimization of urban ecological network planning based on the minimum cumulative resistance model and granularity reverse method: A case study of Haikou, China. IEEE Access 2020, 8, 43592–43605. [Google Scholar] [CrossRef]
  31. Huang, H.; Yu, K.; Gao, Y.; Liu, J. Building green infrastructure network of Fuzhou using MSPA. Chin. Landsc. Archit. 2019, 35, 70–75. [Google Scholar]
  32. Vogt, P.; Ferrari, J.R.; Lookingbill, T.R.; Gardner, R.H.; Riitters, K.H.; Ostapowicz, K. Mapping functional connectivity. Ecol. Indic. 2009, 9, 64–71. [Google Scholar] [CrossRef]
  33. Gu, F. Study on the Construction of Ecological Network in Nature Reserves of Fujian Provice. Master’s Thesis, Fujian Normal University, Fuzhou, China, 2017. [Google Scholar]
  34. Chen, Z.; Kuang, D.; Wei, X.; Zhang, L. Developing ecological networks based on MSPA and MCR: A case study in Yujiang county. Resour. Environ. Yangtze Val. 2017, 26, 1199–1207. [Google Scholar]
  35. Ostapowicz, K.; Vogt, P.; Riitters, K.H.; Kozak, J.; Estreguil, C. Impact of scale on morphological spatial pattern of forest. Landsc. Ecol. 2008, 23, 1107–1117. [Google Scholar] [CrossRef]
Figure 1. Location of Jindong Forestry Farm.
Sustainability 14 03082 g001
Figure 2. Flowchart of the analysis and research procedures in this study.
Sustainability 14 03082 g002
Figure 3. Habitat map of forest ecologically suitable areas.
Sustainability 14 03082 g003
Figure 4. Analysis results of MSPA.
Sustainability 14 03082 g004
Figure 5. Distribution of forest ecologically suitable areas in the study area.
Sustainability 14 03082 g005
Figure 6. Ecological corridor of the study area.
Sustainability 14 03082 g006
Table 1. Ecological suitability assignment criteria.
Impact FactorsSuitability Level
Level 1Level 2Level 3Level 4Level 5
Slope aspectShady slopeSemi-shady slopeSemi-sunny slopeSunward slopeFlatland
Slope positionUpMiddleDown
Slope (°)>3626~3516~256~15<5
Soil typeRed soilYellow soilYellow brown soil
Soil thickness (cm)<4041~6061~80>81
Canopy density1%~20%21%~40%41%~70%71%~100%
Origin and forest ageOthersYoung plantation forestPlanted middle-aged\Near-Mature ForestsMature plantation forestNatural forest
Distance from roads (m)<500501~10001001~3000>3001
Distance from villages and towns (m)<500501~10001001~3000>3001
Distance from water (m)>30011001~3000501~1000<500
Table 2. Area proportion of each suitable area type.
FESISuitable ConditionArea (hm2)Proportion of Study Area (%)
(0~0.2]Lowest suitable habitat, where there is a high risk of destruction of the forest landscape1967.580.04
(0.2~0.4]Lower suitable habitat, where forested landscapes may be destroyed12,8430.25
(0.4~0.6]Moderate suitable habitat, forest landscape can be basically maintained18,291.690.35
(0.6~0.8]Higher suitable habitat, forest landscape can be maintained17,032.680.33
(0.8~1]Highest suitable habitat, forest landscape can be fully protected1982.070.04
Table 3. Classification statistics table of MSPA.
Landscape TypeArea (hm2)Proportion of the Suitable Area (%)Proportion of the Total Area (%)
Core area7312.5038.460.14
Edge5972.0731.410.11
Bridge2186.5211.50.04
Islet16,905.988.920.03
Branch1249.176.570.02
Loop368.861.940.01
Perforation230.061.210.00
Table 4. Cumulative contribution values of dIIC and dPC and the percentage of patch number.
dIICdPC
Cumulative Contribution ValueNumber of PatchesPercentage of Patch NumbersCumulative Contribution ValueNumber of PatchesPercentage of Patch Numbers
0~50%10.29%0~50%10.29%
50~90%144.06%50~90%257.25%
90~100%33095.65%90~100%31992.46%
Table 5. Top 10 nodes in the order of dIIC and dPC values.
NodedIICNodedPC
30110.4530122.78
2817.2228110.95
1882.222842.80
771.582211.63
2511.451881.59
320.872141.43
240.831451.23
2840.742751.21
330.742511.16
2210.581631.15
Table 6. Interaction matrix based on gravity model.
Patch Id163188214221284251263281275301
145924.1813.7011.897.744.1911.528.4892.6521.1055.29
163 7.676.724.362.516.794.9560.4112.2335.60
188 1156.79462.8820.2856.7551.32138.94153.6327.87
214 4798.2222.3260.4461.38137.17191.8724.26
221 20.2053.1255.6088.43178.1916.20
284 378.10102.16153.53162.649.09
251 1833.62284.081711.1824.75
263 170.266186.8520.69
281 377.93205.11
275 51.06
Publisher’s Note: MDPI stays neutral with regard to jurisdictional claims in published maps and institutional affiliations.

