Article

Comprehensive Diagnosis Method of the Health of Tailings Dams Based on Dynamic Weight and Quantitative Index

1
Nanjing Hydraulic Research Institute, No. 223, Guangzhou Road, Nanjing 210029, China
2
College of Water Resources & Hydropower, Sichuan University, No. 24 South Section 1, Yihuan Road, Chengdu 610065, China
3
Key Laboratory of Failure Mechanism and Safety Control Techniques of Earth-Rock Dam of the Ministry of Water Resources of P.R., No. 34, Hujuguan Road, Nanjing 210024, China
*
Author to whom correspondence should be addressed.
Sustainability 2022, 14(5), 3068; https://doi.org/10.3390/su14053068
Submission received: 18 January 2022 / Revised: 3 March 2022 / Accepted: 3 March 2022 / Published: 6 March 2022
(This article belongs to the Topic Mining Safety and Sustainability)

Abstract

:
As a dangerous source of man-made debris flow with high potential energy, tailings dams can cause huge losses to people’s lives and property downstream once they break, and their safety control problem is particularly prominent. The health diagnosis of tailings dams is a complex and nonlinear problem full of uncertainty. At present, the health diagnosis of tailings dams is mostly qualitative evaluation or quantitative analysis aiming at a single index, so this study puts forward a comprehensive quantitative diagnosis method of tailings dam health based on dynamic weight. Slope stability, deformation stability and seepage stability are taken as project layers, and the diagnosis index system of the tailings dam is constructed. The quantitative methods of diagnosis indexes of project layers are proposed. For the dam slope stability project, the safety factor and the reliability index of tailings dams are determined based on the Monte Carlo method, which can consider the uncertainty of tailings material parameters. For the deformation stability project, the normal operation values of deformation rate and deformation amount are determined by analyzing the in situ observation data and combining them with the numerical simulation results. For the seepage stability project, through the analysis of seepage and stability, the relationship curve between the depth of saturation line and the safety factor of anti-sliding stability is established. The norms method is used to determine the quantitative standards for the diagnosis indexes of the basic layer. Based on the analytical hierarchy process method and the penalty variable weight method, the method of dynamic weight of the project layer index is proposed. The proposed methods are applied to a practical engineering project. The results show that the methods can accurately reflect the health status of tailings dams. This study provides a new method for evaluating the safety of tailings dams.

1. Introduction

The tailings pond is a place for storing tailings, and the tailings dam is a dam structure around the tailings pond, which is a key project to ensure the normal operation of the tailings pond. At present, there are about 8869 non-coal mine tailings ponds in China, among which there are about 1112 “overhead tailings ponds”, accounting for 14.3%. Tailings pond accidents rank 18th in the ranking of hidden dangers in the world, and their hazards are second only to nuclear radiation and nuclear explosions. [1,2]. On 8 September 2008, the tailings dam of Xinta Mining in Xiangfen, Shanxi Province, China collapsed, resulting in the deaths of at least 277 people and having an extremely bad social impact [3]. On 4 August 2014, the Mount Polley tailings dam in Canada broke due to design reasons, flooded large forests and lakes, and seriously damaged the ecological environment [4]. On 5 November 2015, the Samarco tailings dam in Brazil was liquefied and collapsed due to a small earthquake, which killed at least 19 people and polluted 600 km of rivers, causing the most serious environmental disaster in Brazilian history [5]. In order to ensure the safety of people’s lives and properties, the Chinese government has paid more and more attention to the safe operation of tailings dams in recent years and has put forward higher requirements for the safe operation and risk control of tailings dams. Therefore, the health diagnosis method of tailings dams is put forward in order to assess its operating health state.
The health diagnosis of tailings dams refers to the evaluation of key performance indicators based on the design, operation and monitoring data of the tailings dam during the operation period, and the diagnosis of its health status and defects [6]. At present, very rich research results [7,8,9,10] have been obtained in the health diagnosis of tailings dams, which are mainly divided into qualitative diagnosis and quantitative diagnosis. Most studies [11,12,13,14,15] focus on qualitative diagnosis, represented by the safety checklist method, which lists inspection items according to the relevant laws and regulations, and then scores and summarizes the overall health status of tailings dams by experts. This method is convenient to operate and intuitive in its evaluation results, but it has strong subjective randomness, and its accuracy and credibility are insufficient. In recent years, scholars have gradually introduced new mathematical methods and theories, such as fuzzy theory [16,17,18] and uncertainty measurement theory [19], which have improved the accuracy of safety evaluation. However, the methods are mostly used to deal with the relationship between indexes in the diagnosis system, and the diagnosis of the basic indexes is still mainly qualitative. In terms of the quantitative diagnosis of tailings dam health, because the tailings dams are mostly constructed in stages and the tailings materials have obvious anisotropy, heterogeneity and temporal and spatial variability, it is extremely difficult to quantitatively diagnose their health status. Scholars mainly evaluate the health status of tailings dams by numerical simulation and mathematical models. For example, Wang [20] and Xu [21] used the limit equilibrium method to analyze the stability of tailings dams and diagnose whether the stability of tailings dams meets the requirements; Wang [22] and Li [23] calculated and analyzed the seepage field through numerical simulation and a theoretical model, respectively, and evaluated the seepage safety of tailings dams. Dong established the pre-alarm system based on monitoring data and numerical simulation for tailings dams, and verified the applicability and accuracy of the system [24]. Li applied the strength reduction method to analyze the overall stability of the tailings dam [25]. Dong summarized and compared three common tailings dam stability analysis methods: limit equilibrium method, numerical simulation method and uncertainty method, and analyzed their applicability [26]. These analytical methods are based on monitoring data and test data to diagnose the health status of tailings dams, which is more convincing and scientific than qualitative diagnosis methods. The research is mostly concentrated on a single working condition and a single index. However, there are many factors that affect the health status of tailings dams, and the multi-index and multi-factor evaluation method is more suitable for its safety evaluation. At present, there is little research on comprehensive quantitative diagnosis of tailings dam health. In the comprehensive diagnosis of tailings dam health, the index weights have an important influence on the accuracy of the diagnosis result. Generally, the deterministic weight is used, that is, the weight will not change as the indicator’s health status deteriorates. The method will lead to a state of imbalance. When a certain index deteriorates while other indexes are still in a healthy state, the influence of the deterioration index may be ignored in the traditional diagnosis based on deterministic weight. Aiming at the existing problems in the comprehensive diagnosis of tailings dam health, a comprehensive quantitative diagnosis method of tailings dam health based on dynamic weight is proposed in this study, which provides a new method for reference to the health diagnosis of tailings dams.
The main contents of this paper are as follows: (a) The diagnosis index system is constructed and the health grade is determined. (b) Based on the analytic hierarchy process and the penalty variable weight method, the dynamic weight method of the diagnosis index is proposed. (c) The quantified methods and standards for the basic-layer diagnosis index such as the slope stability, the deformation stability and the seepage stability are proposed. (d) The method was applied to tailings dam I in Brazil, and its applicability and accuracy were verified.

2. Materials and Methods

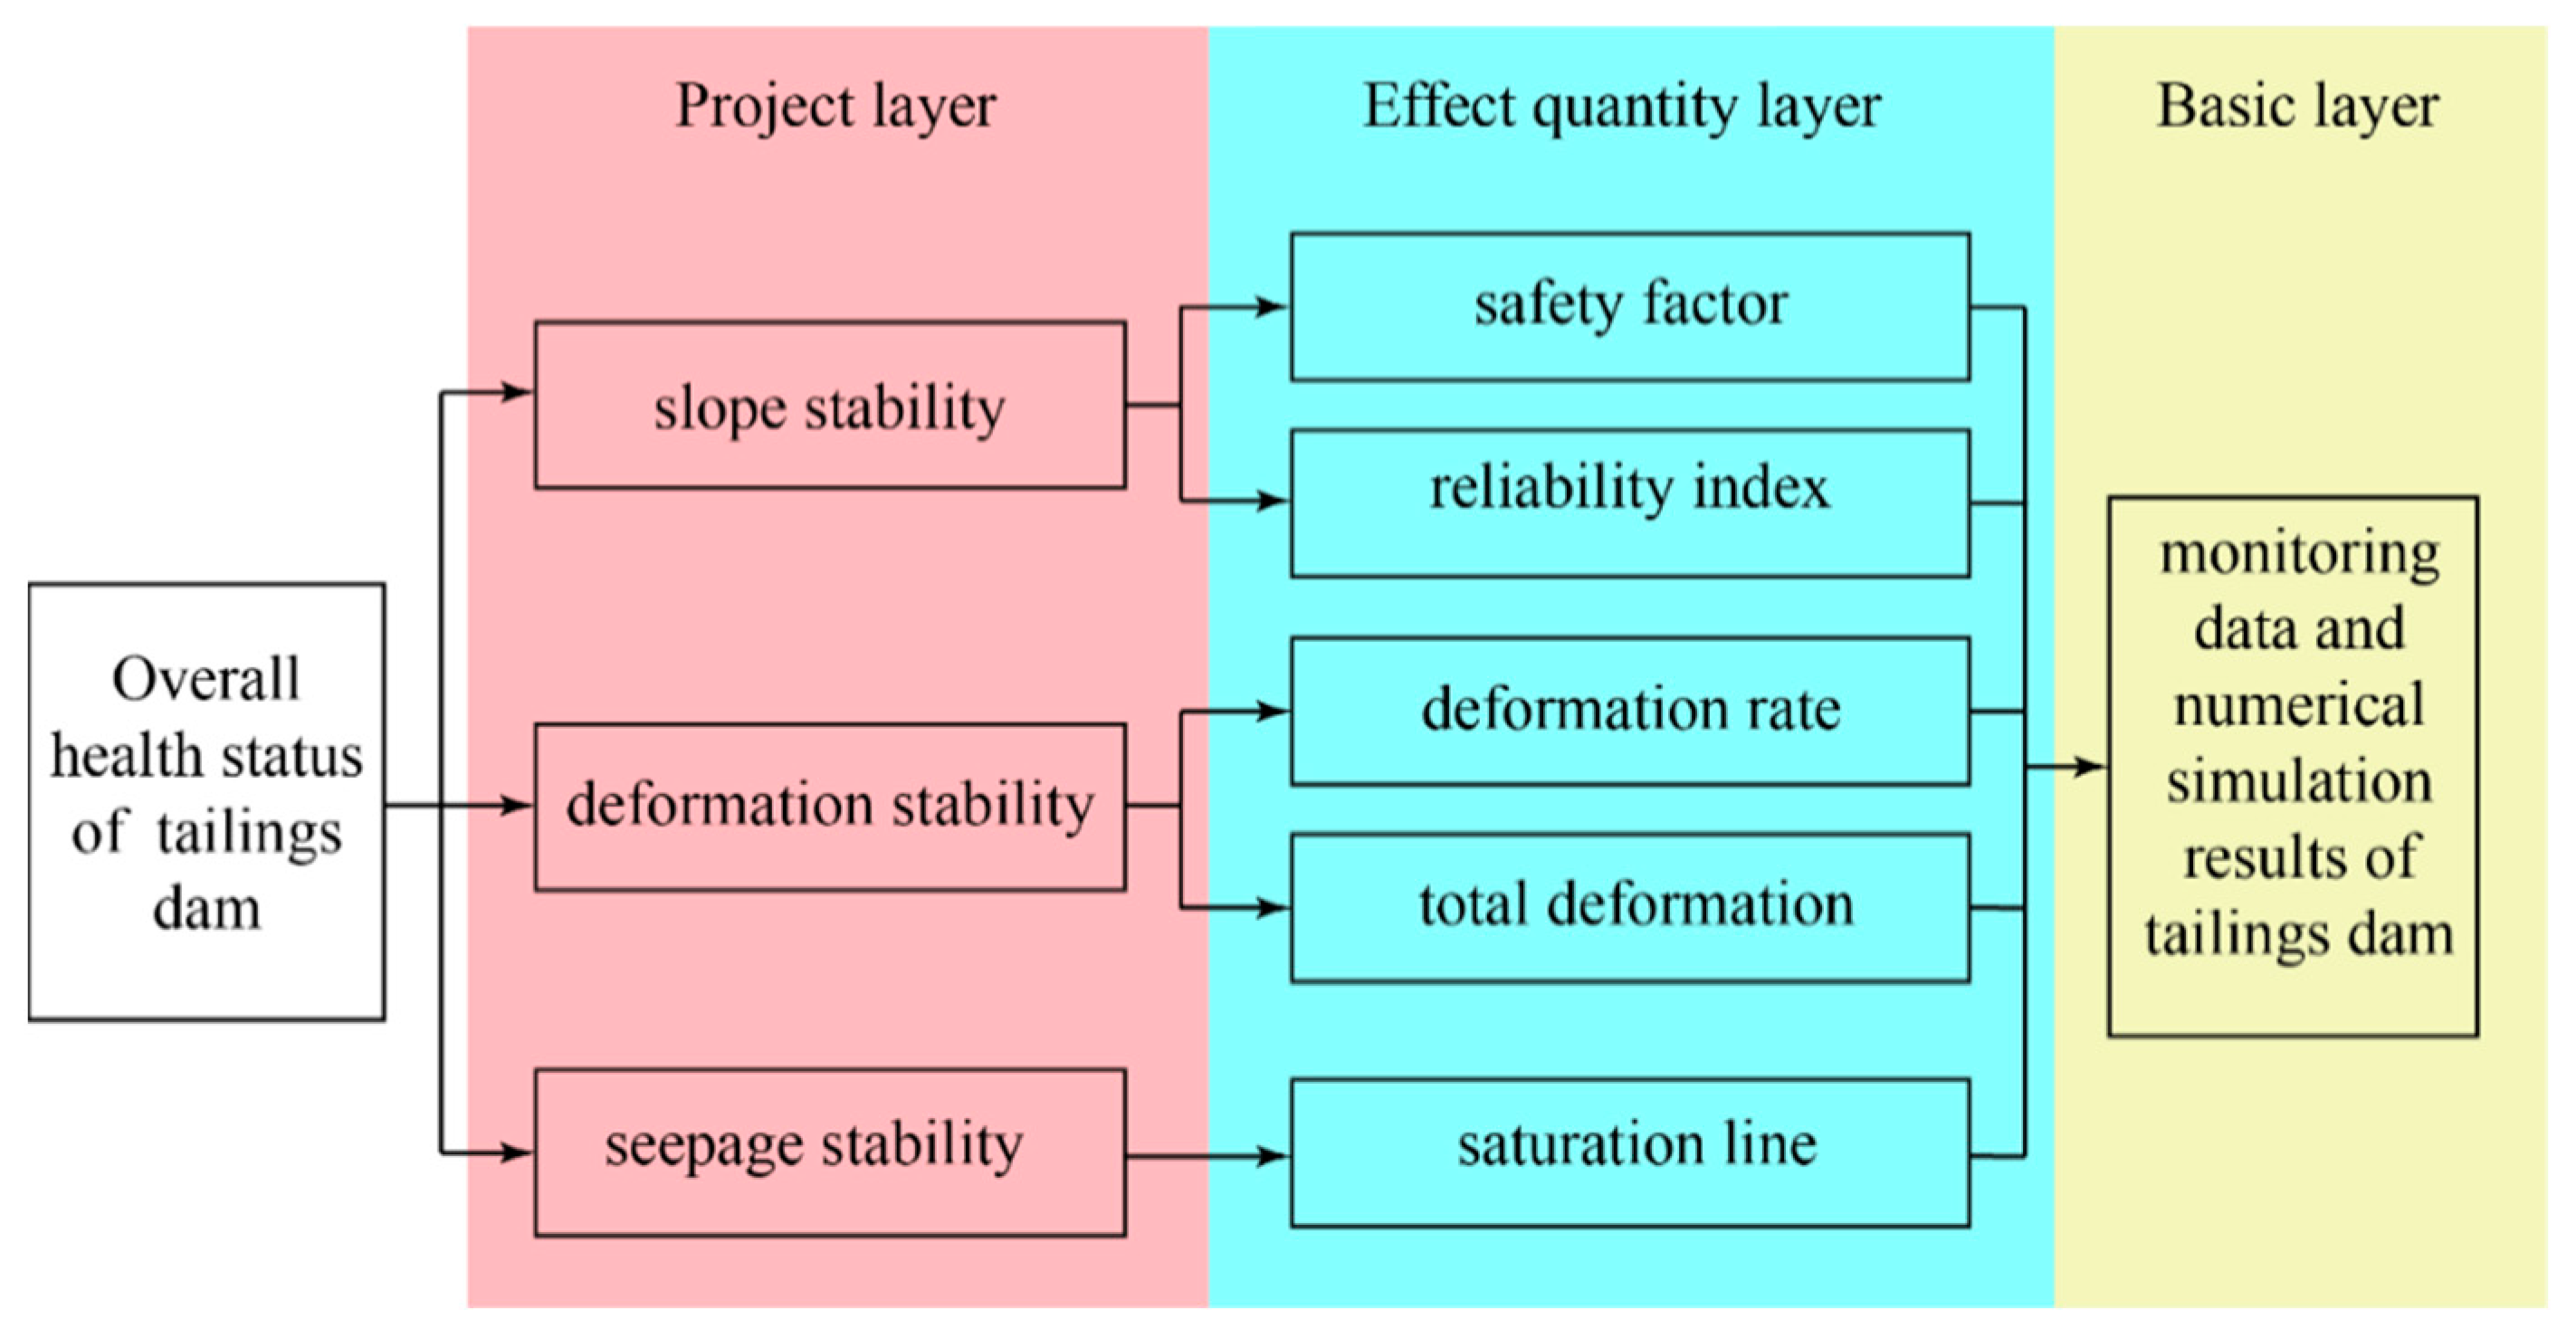
2.1. Construction of Diagnosis Index System for Tailings Dam Health

2.1.1. Diagnosis Index

As the basis of comprehensive diagnosis, whether the diagnosis index is appropriate or not will directly affect whether the diagnosis result is reasonable and accurate. In this paper, the diagnosis index system is divided into a project layer, an effect-quantity layer and a basic layer. With reference to related literatures [27,28] and norms [29,30], combined with the tailings dam failure modes and hazard factors, the health diagnosis index system of tailings dam was established. As shown in Figure 1, the project layer of the index system includes three aspects: slope stability, deformation stability and seepage stability, and the effect quantity layer is obtained by further concretization of the project layer. The slope stability project includes the deterministic safety factor and the reliability index, and the reliability index is added to consider the randomness of physical and mechanical characteristics of tailings. As a non-linear material, tailings will deform significantly during the life cycle of the tailings dam. Normal consolidation deformation is beneficial to the stability of the tailings dam, but for tailings with strong cementation characteristics and structural properties, excessive deformation will cause its strength to be lost. The deformation stability project is divided into two indexes: the deformation rate and the total deformation. The tailings dam is a permeable structure, and the saturation line is the lifeline. Therefore, the depth of the saturation line is taken as an index of the seepage project. The basic layer is the bottom layer diagnosis index in the index system, including the in situ monitoring data of the tailings dam and the corresponding calculation results obtained by numerical analysis based on the structure of the tailings dam and the physical and mechanical properties of the tailings.

2.1.2. Classification of Health Levels

Comprehensive health diagnosis needs to classify the diagnosis results and refer to relevant literatures and norms [29], and the classification is mainly based on the fourth and third levels. For example, the Chinese standard Tailing facilities design code [30] is divided into four levels according to the degree of safety: normal pond, disease pond, risk pond, and dangerous pond. Guidelines on the safe design and operating standards for tailings storage [31] issued by Australia is divided into three levels: high, significant and low. Because the definition of safety degree in the four levels is mainly qualitative description, the boundary between risk pond and dangerous pond is relatively fuzzy. Therefore, the study divides the health levels of tailings dams into three levels. Referring to medical comments on human health, the levels are determined as healthy, diseased, and dangerous.

2.1.3. Standardization Method of Health Value

The effect quantity of each diagnosis index is different, and it is not commensurable. Therefore, the index diagnosis result is processed to make it dimensionless, that is, it is converted into the form of health value, and the influence of index unit and numerical magnitude is excluded. The health value interval is set to [0, 1], in which the health value of 1 is the most ideal health state. The specific classification criteria are shown in Table 1.
The health value of the basic index is calculated by standardized Equation (1):
X = { 1 U ( , u 1 * ) 0.67 + 0.33 u 1 U u 1 u 1 * U [ u 1 * , u 1 )   0.33 + 0.34 u 2 U u 2 u 1 U [ u 1 , u 2 ) 0.33 u 2 * U u 2 * u 2 U [ u 2 , u 2 * ) 0 U [ u 2 * , + )
where X is the index health value; U is the diagnosis parameter of the basic index; u1 is the threshold value of the healthy and diseased level; u2 is the threshold value of the diseased and dangerous level;. u 1 * . and u 2 * . are the upper and lower limits of the diagnosis parameters, respectively, and the health values exceeding the limits are 1 and 0.

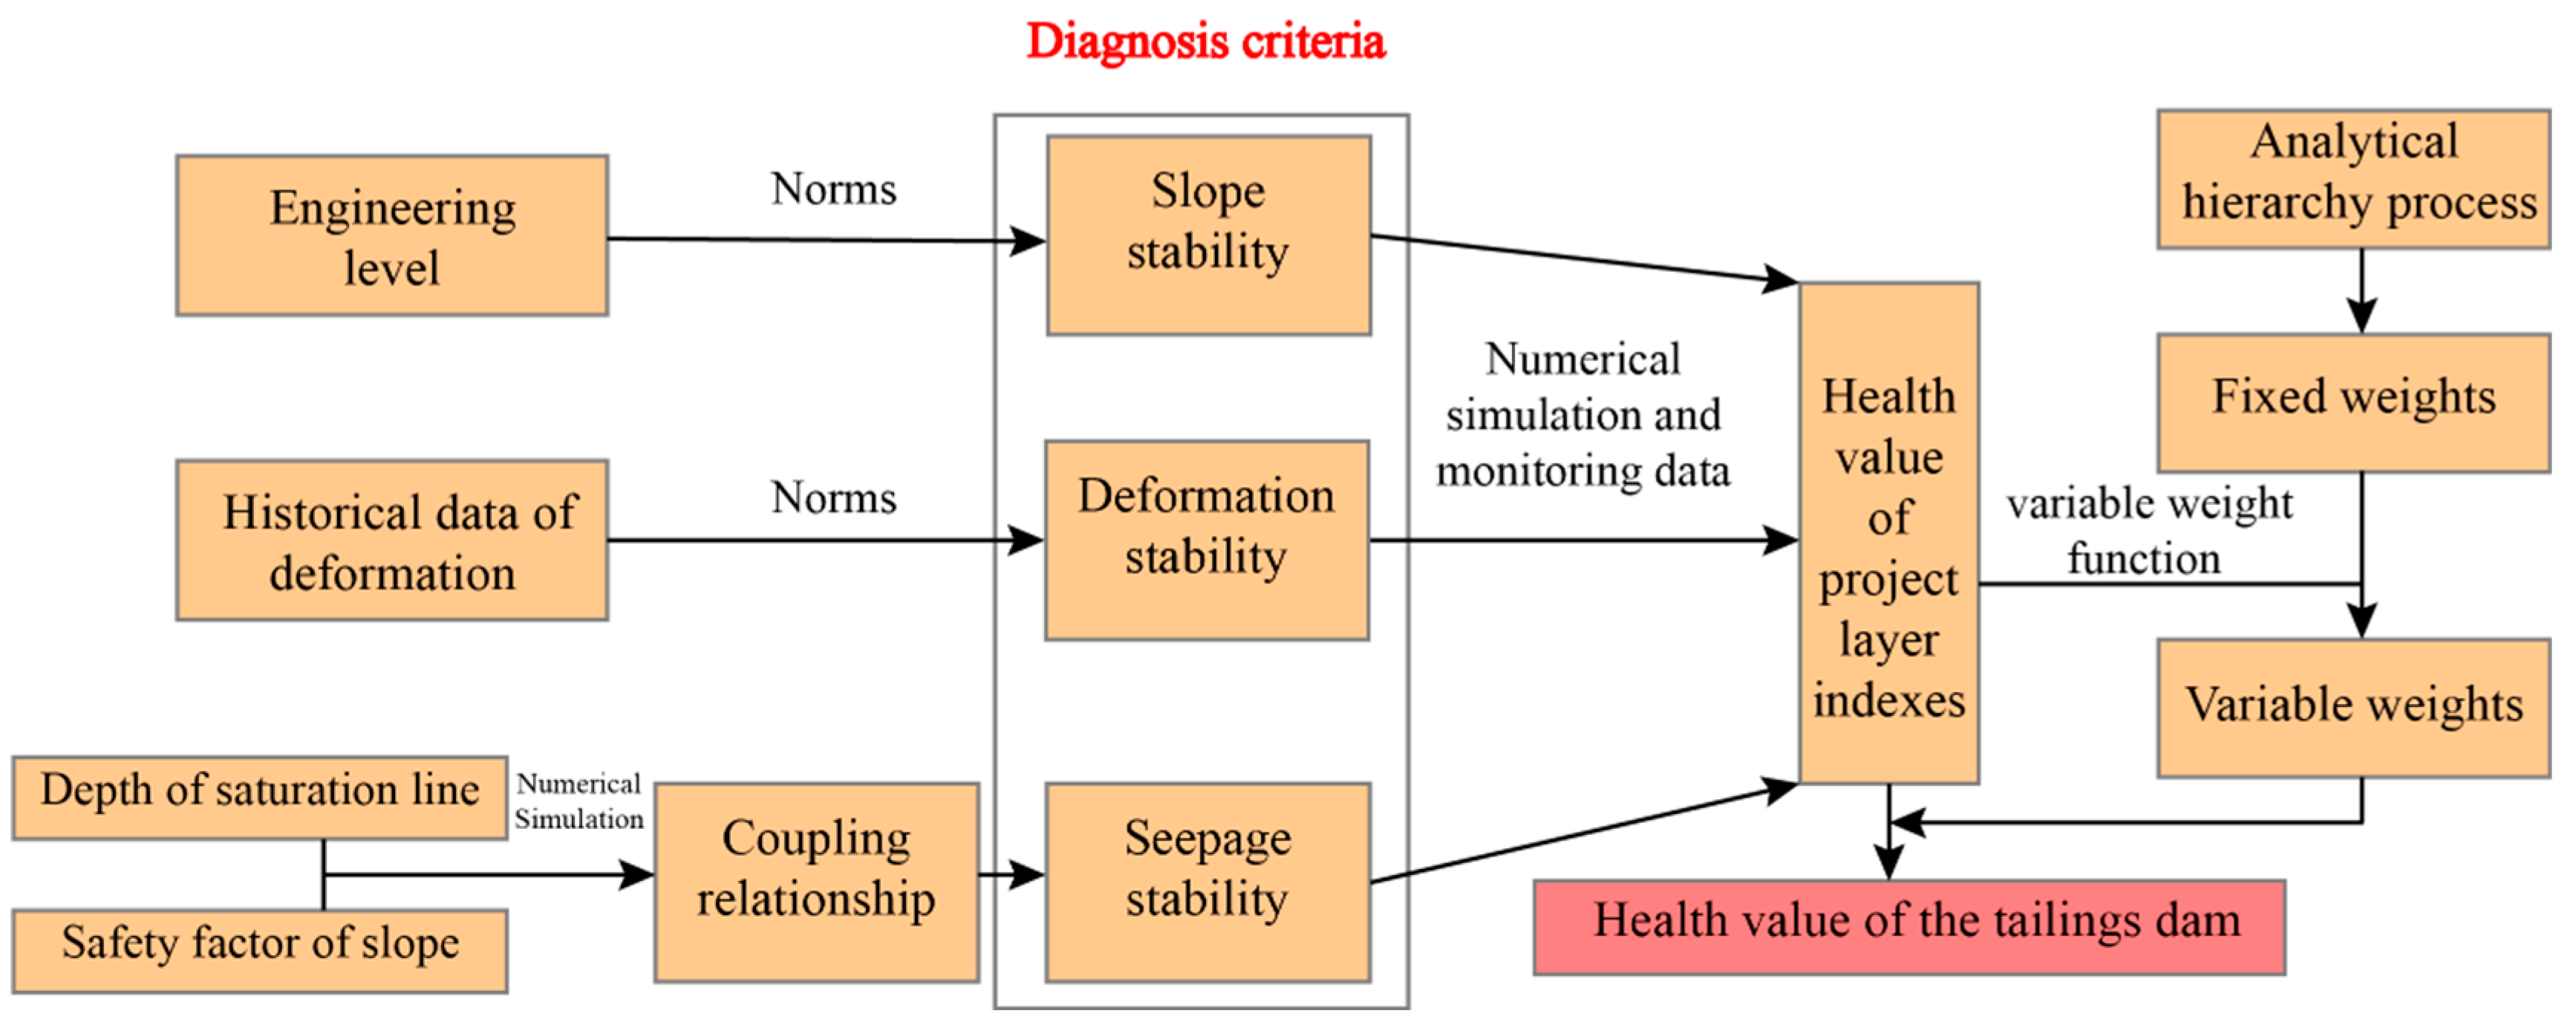
2.2. Determination of Dynamic Weight of Diagnosis Indexes

2.2.1. The Analytical Hierarchy Process

The analytic hierarchy process is a comprehensive evaluation method that combines qualitative and quantitative analysis by objectively describing subjective judgments [32]. It has a wide range of applications in comprehensive evaluation [33]. The steps of the analytic hierarchy process to determine the weight of index are as follows:
(1)
Hierarchical structure reflects the relationship between indexes, and the proportion of each index in the same target layer is quantitatively analyzed by the judgment matrix A = ( a i j ) n × n . The judgment matrix is positive and the reciprocal matrix is constructed by comparing the factors in pairs, and is generally represented by the scale of 1–9.
(2)
The constructed judgment matrix has a certain degree of inconsistency, so its rationality is checked for consistency. When the consistency index CR < 0.1, the consistency of the judgment matrix is considered acceptable, and the weight coefficients are allocated reasonably.
(3)
The maximum eigenvalue λ max and the corresponding eigenvector x are obtained by solving the judgment matrix A = ( a i j ) n × n , and the weights of indexes are obtained by normalizing eigenvector x.

2.2.2. The Penalty Variable Weight Method

The deterioration of each index in the project layer will have a significant impact on the health of the tailings dam. When a certain index deteriorates while other indexes are still in healthy state, the traditional fixed-weight diagnosis ignores the impact of the deterioration index. The penalty variable weight method can adjust the weight of the index according to the change of health value, thereby highlighting the diagnosis index that has deteriorated. The method increases the influence of the index with the lower health value in the comprehensive diagnosis, so as to diagnose the overall health status of the tailings dam more reasonably and accurately.
According to the definition of the penalty variable weight function [34], the three axioms of normalization, continuity and monotonicity need to be satisfied, and, combined with the characteristics of the tailings dam, the variable weight function is constructed as follows:
S ( x ) = { 1 x > 0.67 ln ( 0.67 / x ) 10 + 1 0.33 < x 0.67 ln ( 0.67 / x ) 20 7.08 x 0.33
where S(x) is the value of variable weight; x is the health value of the index. The variable weight function is composed of three sections: non-penalty function, penalty function and heavy penalty function, which respectively correspond to three health states: healthy, diseased, and dangerous. The variable weight value of each index is calculated by Equation (3):
w i ( x i ) = w i ( 0 ) S i ( x ) / j = 1 n w j ( 0 ) S j ( x )
where xi is the health value of the ith index; n is the number of index; w i ( x i ) is the variable weight of the ith index; w i ( 0 ) is the fixed weight of the ith index.

2.3. Diagnosis Method of the Index of Effect Quantity Layer

The data dimensions of each index of the basic layer are different, and the reflections on the health status of the tailings dam are also different. Therefore, according to the characteristics of diagnosis indexes, the reasonable quantitative methods are selected to analyze the indexes, such as numerical simulation, statistical analysis and so on. Then, the norms method and the confidence interval method are used to determine the quantitative standard of the index, to complete the quantitative diagnosis of the indexes.

2.3.1. Slope Stability Project

The typical profile of the tailings dam is selected, and the stability of the tailings dam is calculated by the limit equilibrium method to obtain the slope safety factor corresponding to deterministic parameters. Considering the variability of tailings material and taking the mean and standard deviation of its physical and mechanical parameters as random variables, the reliability analysis is carried out by the Monte Carlo method. A large number of tailings parameter combinations are extracted and their anti-sliding stability safety factors are calculated respectively to determine the probability of the tailings dam break and the reliability index. Quantitative diagnosis is performed by combining the calculation results of the deterministic safety factor and reliability index. The quantitative standard adopts the norms method, and the specific quantitative standard is:
(1)
Regarding the deterministic safety factor index, the minimum safety factor stipulated in the code is regarded as u1, which is the threshold value of the healthy and diseased level. u1*u1 is taken as u 1 * that is the upper limit value. The norm [35] describes that the tailings dams with a minimum safety factor of less than 0.95 times the stipulated value belong to the dangerous reservoir, so this value is taken as u2, which is the threshold value of the diseased and dangerous level, and the safety factor of 1 is taken as u 2 * , which is the lower limit value.
(2)
Regarding the reliability index, referring to the value in the norm [35], the specific values are shown in Table 2.
The second category of destruction is suitable for sudden brittle destruction, and is mostly applied to concrete structures with higher requirements. Therefore, the reliability index of the tailings dam refers to the first category of destruction. According to the corresponding relationship between reliability index and failure probability, the hierarchical corresponding relationship between the structural safety level and the probability of tailings dam failure is shown in Table 3.
In the norms [29], the magnitude of the probability of dam failure is taken as the basis for the classification of risk significance, and the significance difference of different health levels is reflected by enlarging or reducing the failure probability by one magnitude. According to the reference manual, the value in Table 2 is taken as u1, and the value is reduced by two orders of magnitude as u 1 * . The value in Table 2 is enlarged by one order of magnitude as u2, and the u2 is enlarged by one order of magnitude as u 2 * .

2.3.2. Deformation Stability Project

Deformation Rate

The normal operating value of deformation rate is determined by statistical analysis of historical monitoring data, such as curve fitting and statistical regression. The quantitative standard adopts the norms method, which stipulates that the yellow warning value is 1.3 times the normal operating value, the orange warning value is 2 times the normal operating value, and the red warning value is 3 times the normal operating value. Therefore, u 1 * , u 1 , u 2 , and u 2 * are 1, 1.3, 2 and 3 times of the normal operating value respectively.

Total Deformation

After the tailings dam stops filling sub-dam, there is no new load on the upper part, and the deformation of the dam body is mainly the secondary consolidation deformation of tailings. For tailings with cementing properties, creep deformation may lead to loss of strength and eventually instability failure. The quantification of the total deformation index adopts the numerical analysis. Through forward and inverse analysis of the creep deformation of the tailings dam, the total deformation of the dam body can be calculated more accurately. Deformation failure is defined as a penetrating failure area formed by excessive deformation.
Taking the safety factor of deformation as the quantitative index, the greater the safety factor, the greater the safety margin of the total deformation index. When the safety factor is 1, the monitored deformation of the dam body reaches the destruction deformation, that is, the tailings dam is on the verge of instability. Therefore, u 2 * and u 2 take 1 and F s , which is the slope safety factor specified in the norm. Referring to relevant norms and study, u 1 and u 1 * take 2 and 2 * F s .

2.3.3. Seepage Stability Project
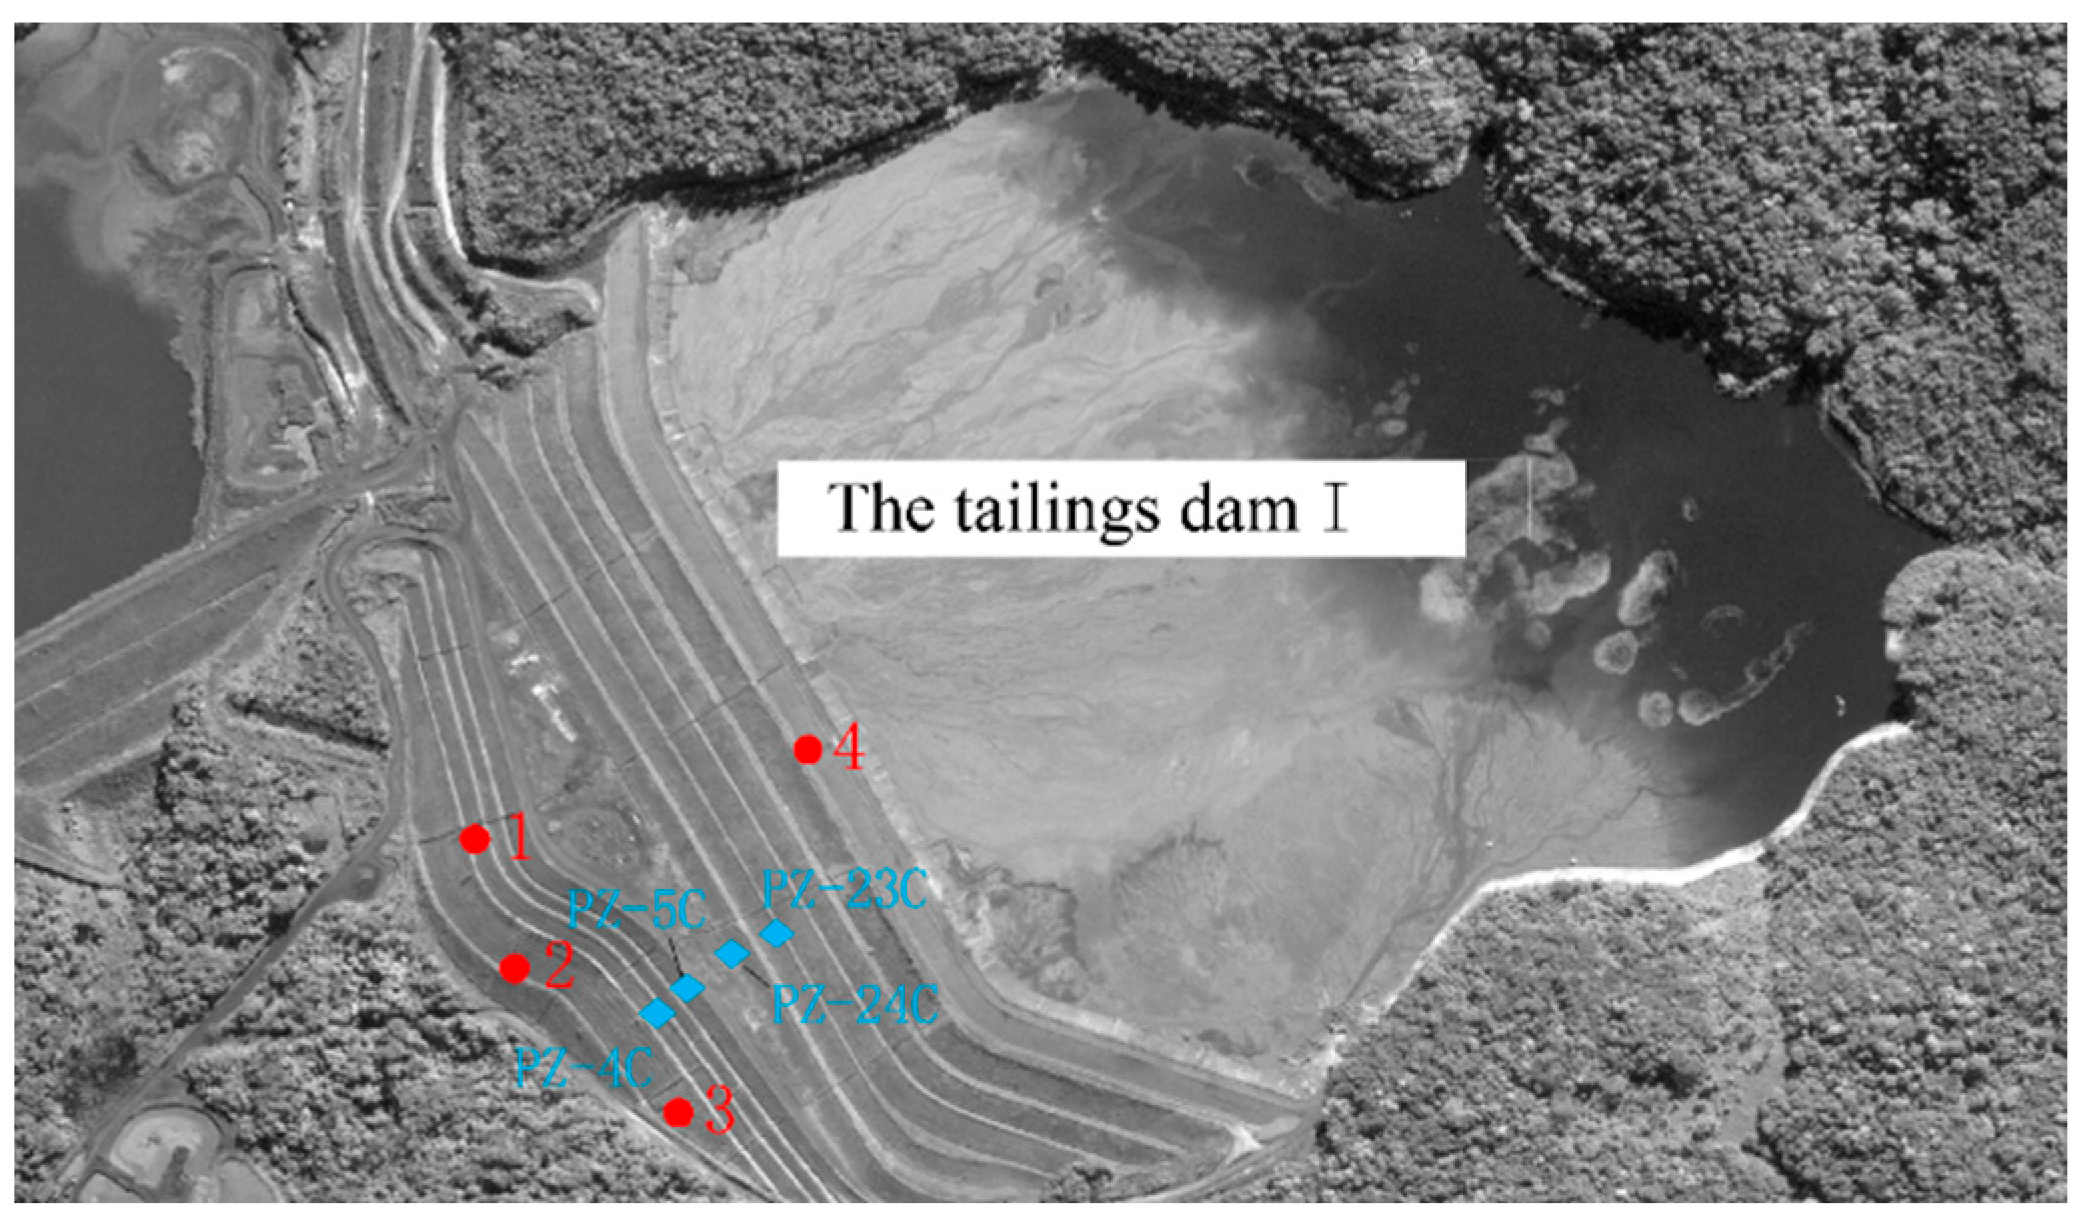
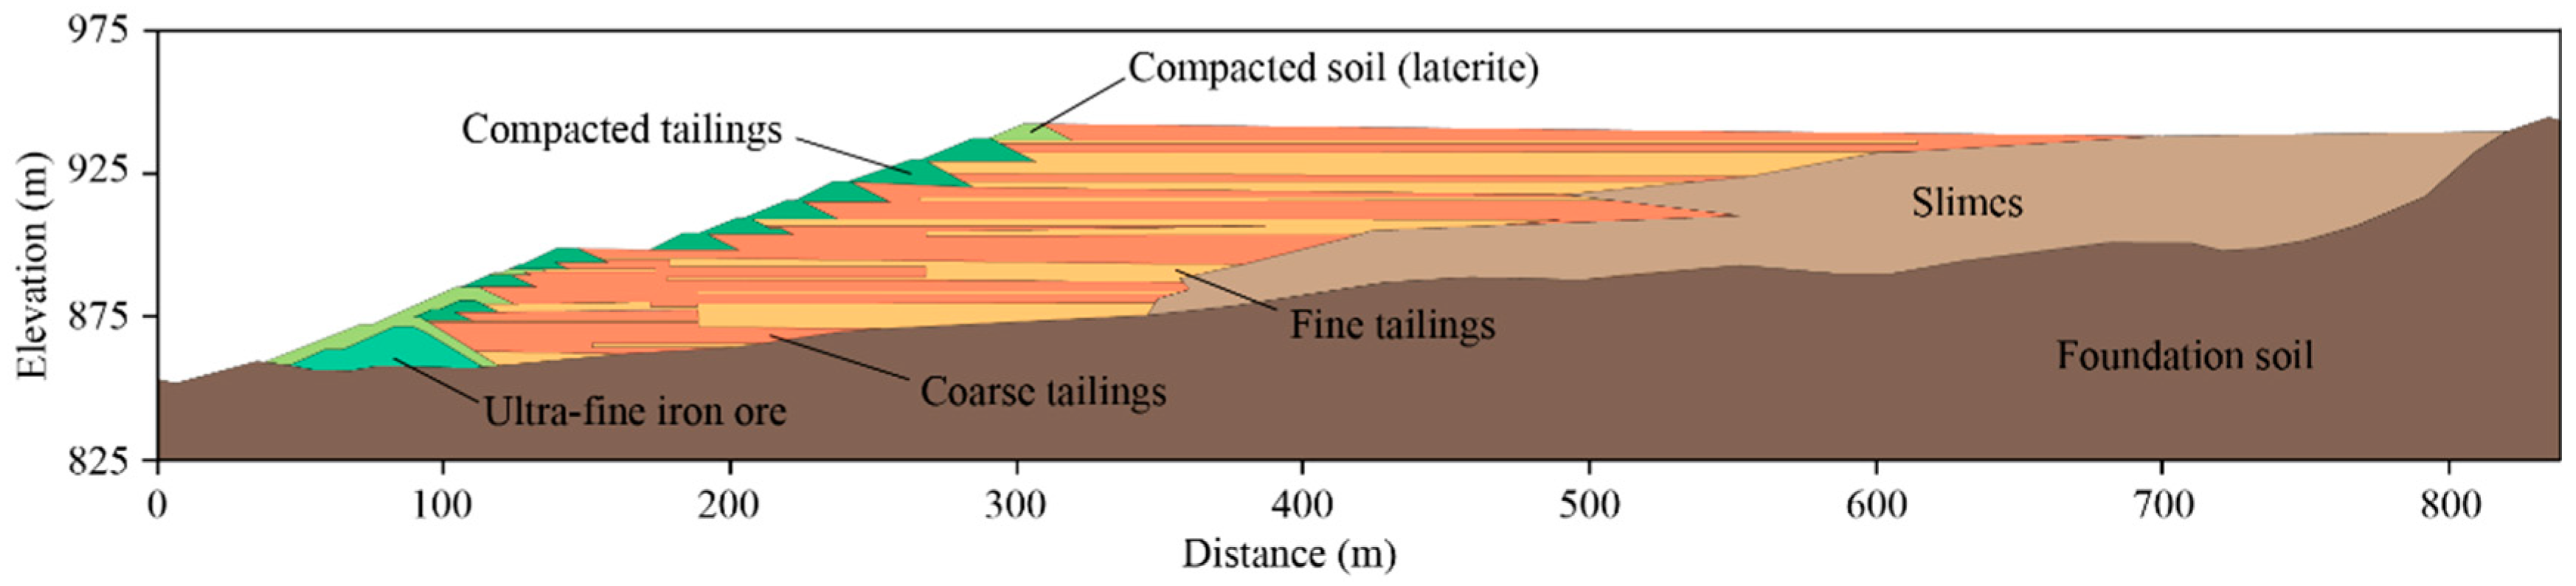
The depth of saturation line of the tailings dam has an important influence on the stability of the slope, so the quantitative basis of the saturation line index is the coupling relationship between the depth of saturation line and the stability of the slope.
The distribution of the saturation line under different dry beach lengths is obtained by seepage calculation. Then, the stability safety factors of the dam slope corresponding to different saturation lines are calculated, so as to establish the coupling relationship between the depth of saturation line and the stability safety factor. According to the relationship curve, u 1 takes the depth of saturation line corresponding to F s . u 1 * is twice of u 1 , and u 2 is 0.95 times of F s . u 2 * is the minimum depth of saturation line specified in the norm.
Finally, the flow chart of this paper can be shown in Figure 2.

3. Case Study

The tailings dam B-I at Córrego do Feijão Iron Ore Mine (dam I) located in Brumadinho, Brazil, was constructed in 1976. The tailings discharge was stopped in July 2016. Before the dam break, the height of the tailings dam was 86 m and the storage capacity was 12.7 Mm3. On 25 January 2019, the tailings dam broke, and about 9.7 Mm3 tailings flowed out of the pond, killing 235 people and flooding an area of about 40 km2 downstream [36]. Figure 3 is the satellite image taken before the dam break, in which ◆ is the monitoring point of the saturation line and ● is the monitoring point of the deformation.

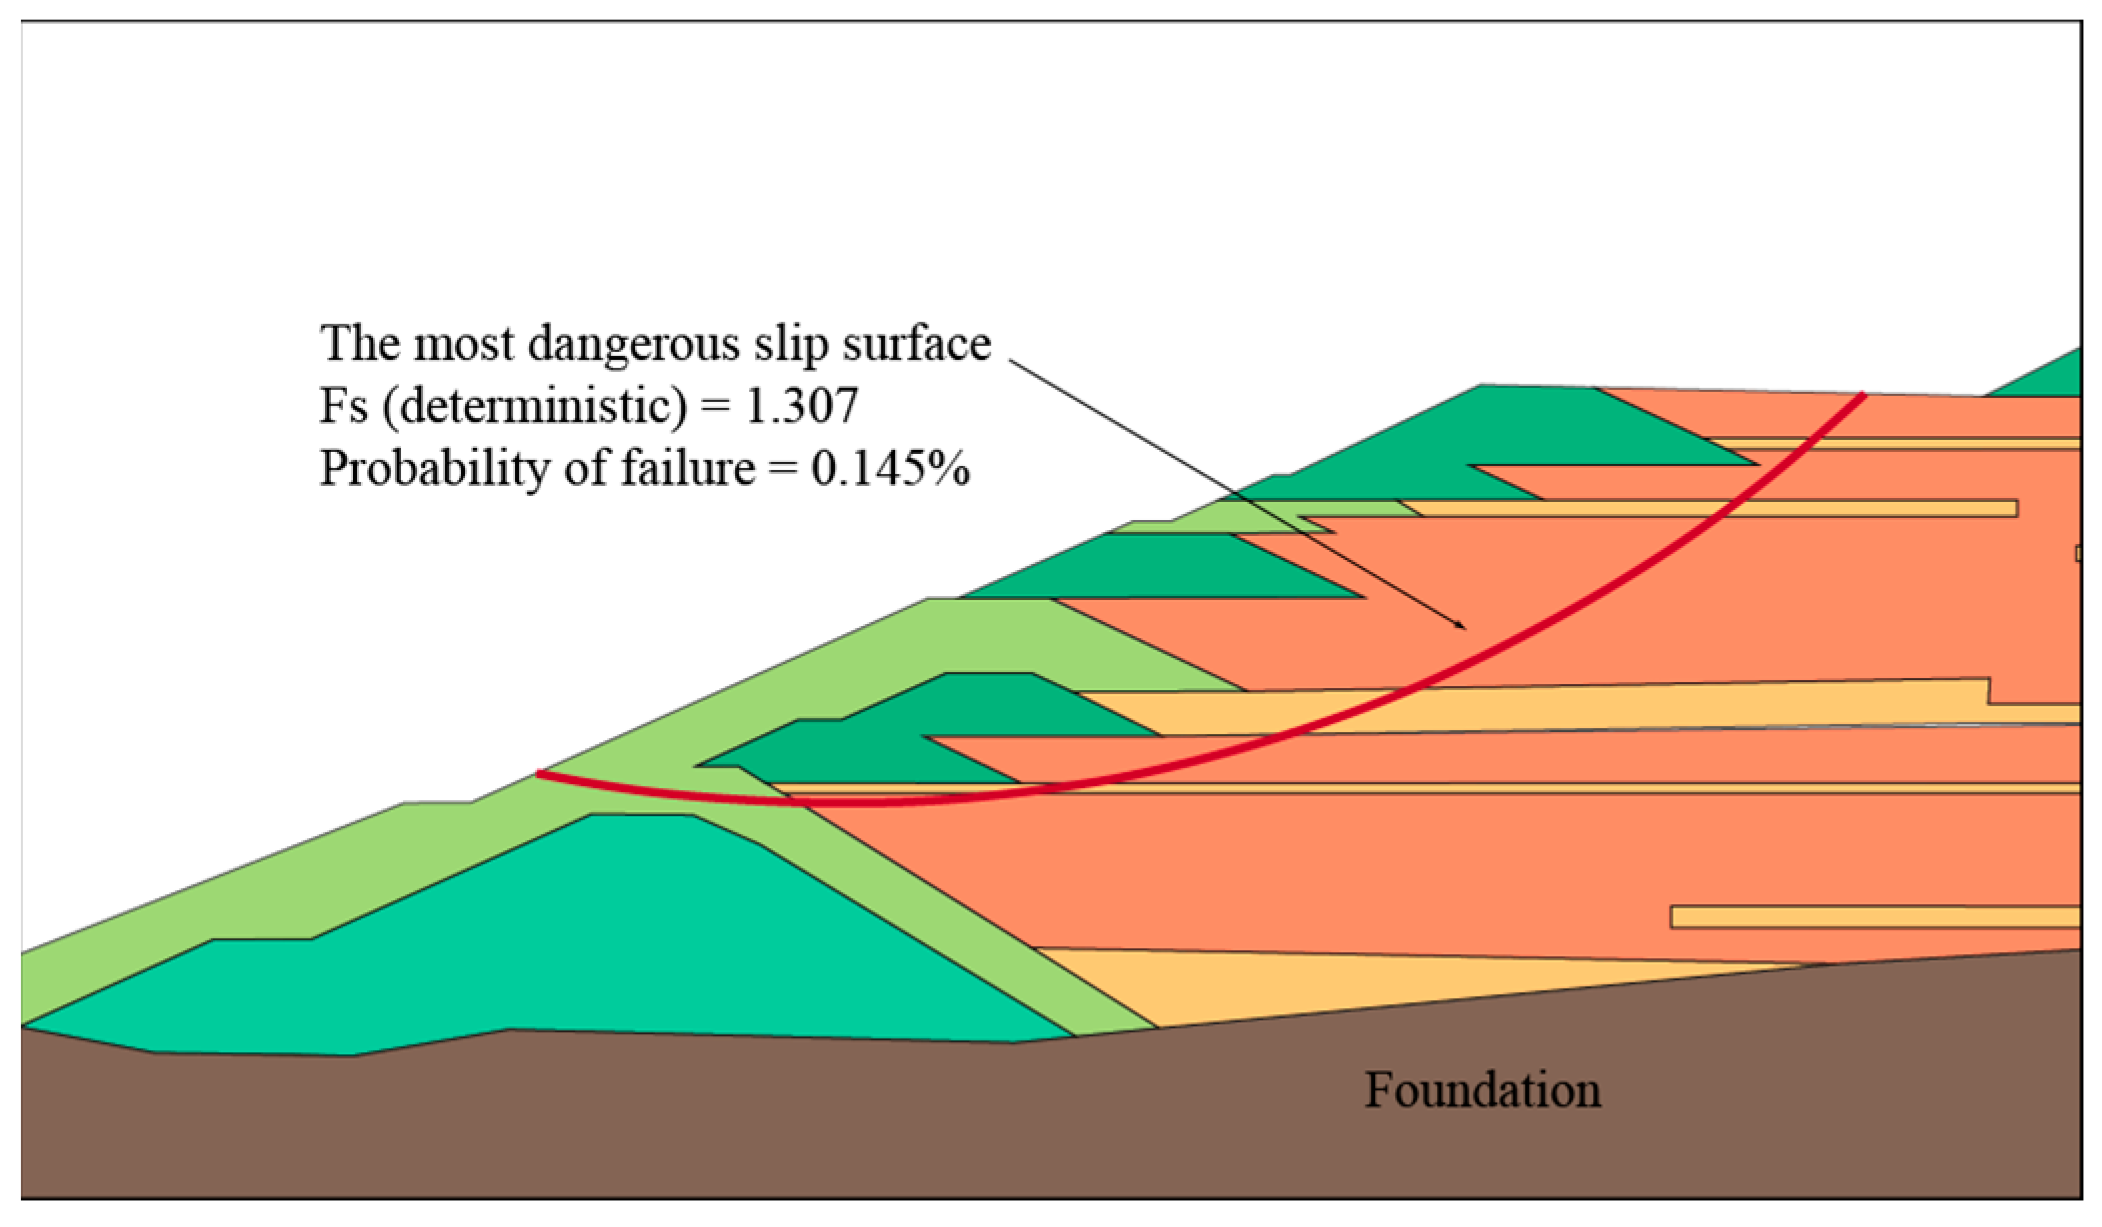
3.1. Diagnosis of the Slope Stability Project

Tailings dam I is a Class 3 dam, and the minimum safety factor specified in the norm [30] is 1.3. According to the quantitative method of the effect quantity index, the quantitative standards of deterministic safety factor index and reliability index are determined. Specific diagnostic criteria are shown in Table 4.
The typical section of the tailings dam is selected to establish a two-dimensional model, as shown in Figure 4. The iron content of the tailings is more than 50%, which makes the bulk density of the tailings very high, about 26 kN/m3. The material parameters required in the stability calculation refer to the test data [37], as shown in Table 5.
The calculation results of stability and reliability are shown in Figure 5. The most dangerous sliding surface of the tailings dam is located between the downstream toe and the fourth sub-dam, and its deterministic safety factor is 1.307, which is basically consistent with the results of the accident investigation report. The failure probability is 1.45 × 10⁻³, and the reliability index is 2.704. The diagnostic results determined by the quantified standard and the Equation (1) show that the health value of the safety factor index is 0.6759, and the health value of the reliability index is 0.4376.

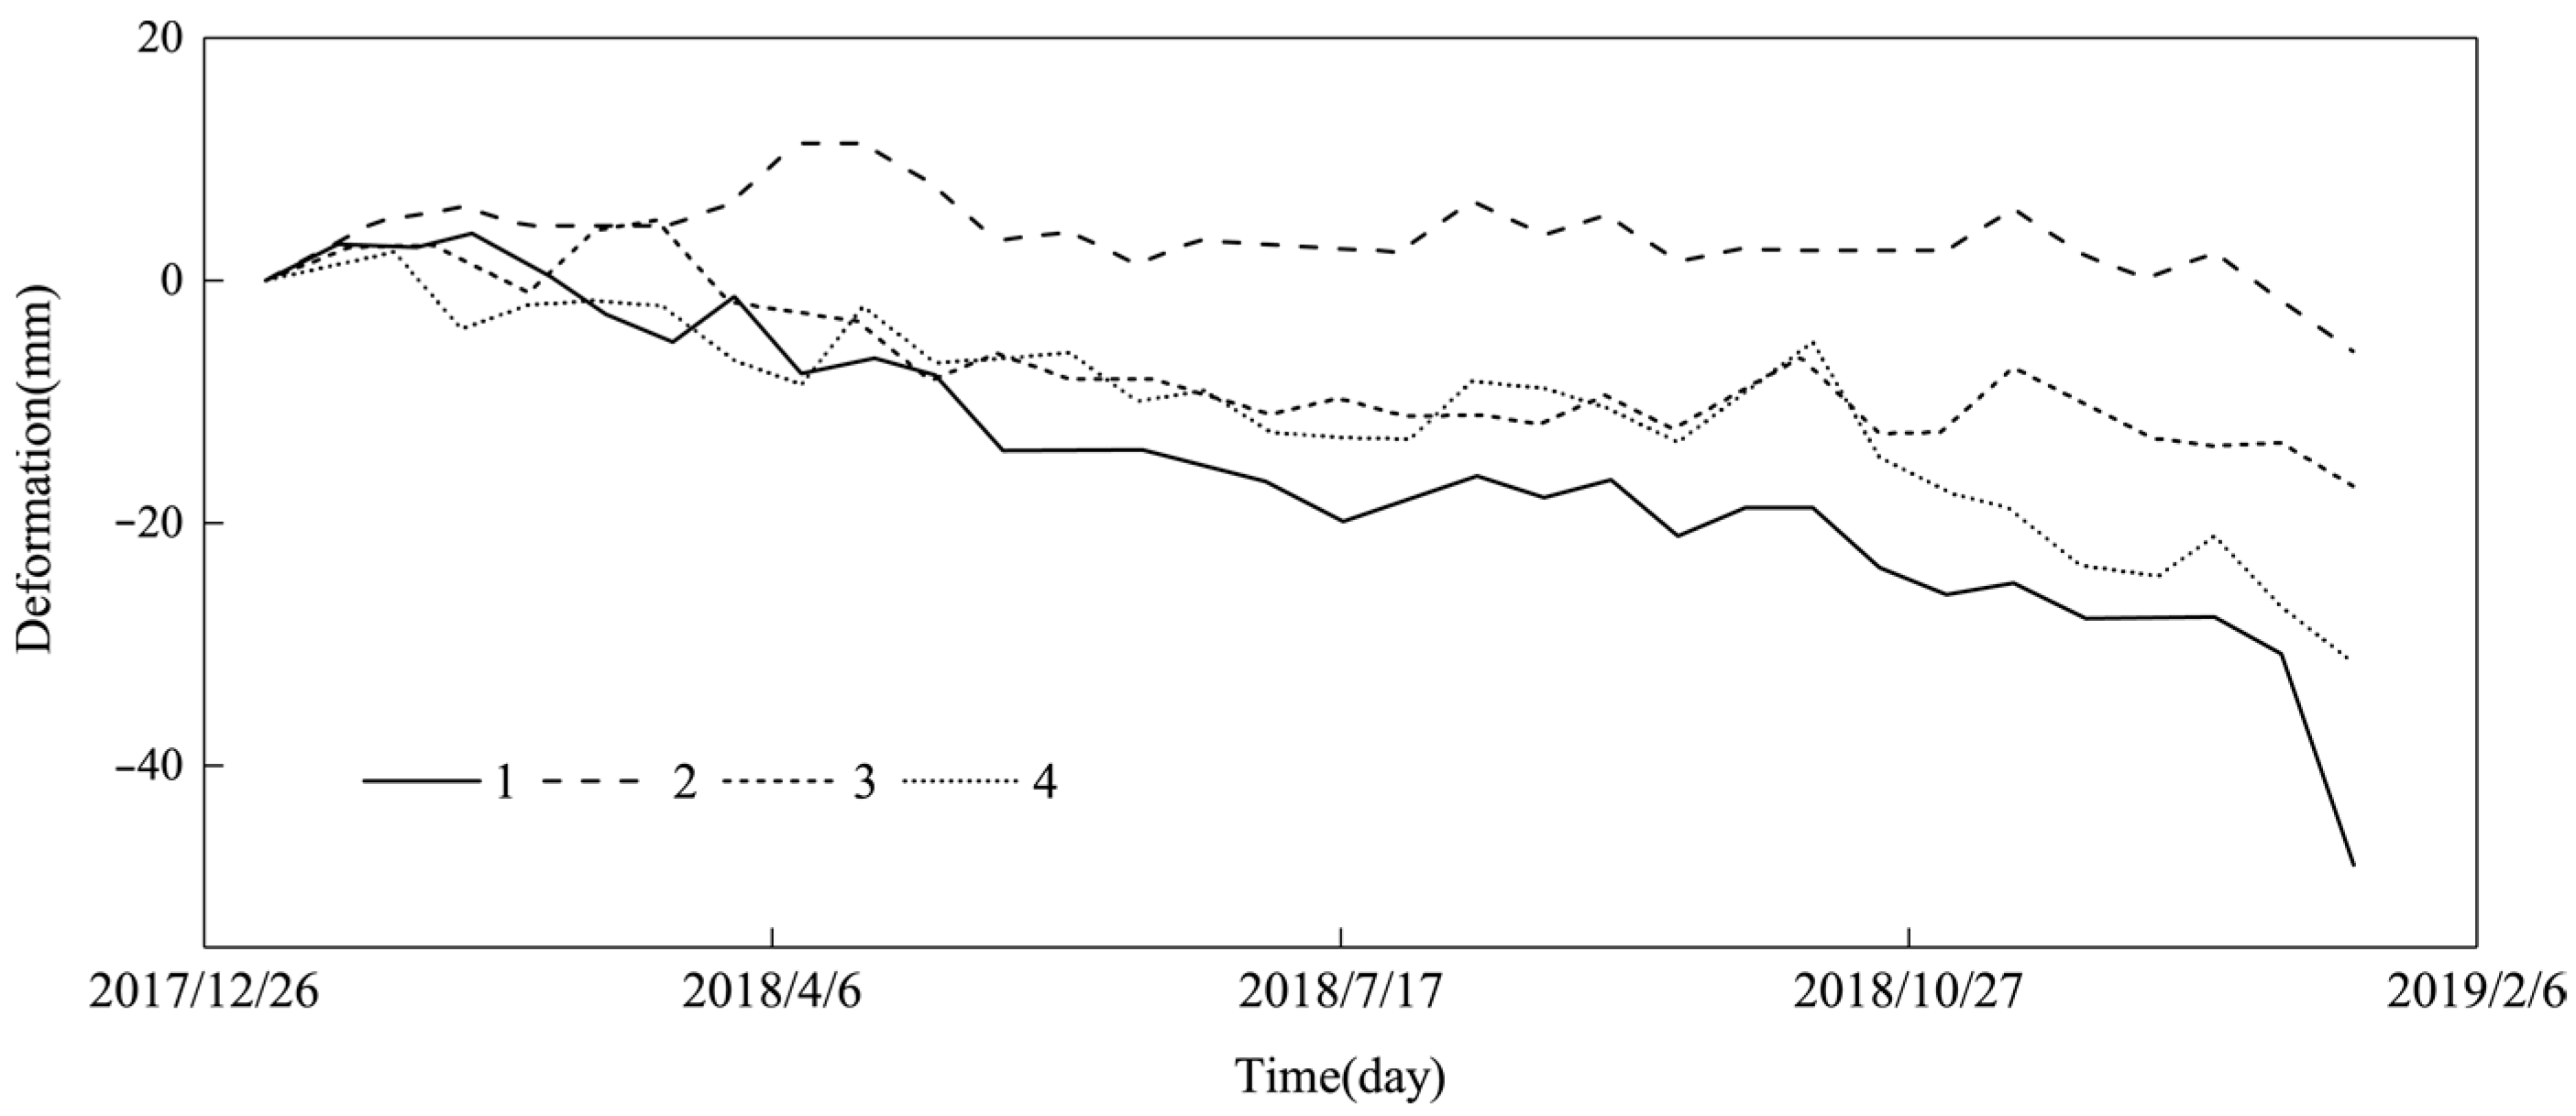
3.2. Diagnosis of the Deformation Stability Project

3.2.1. Deformation Rate Index

The deformation monitoring data is derived from the radar monitoring data, including the vertical component and a small amount of the horizontal component. Because the horizontal component is close to the noise level, the vertical deformation is used for diagnosis of the deformation rate index. Figure 6 shows the vertical deformation curve of the points, with No.1, No.2 and No.3 measuring points located at the bottom of the dam and No.4 measuring point located at the top of the dam.
Based on the monitoring data from 6 January 2018 to 20 December 2018, it can seen that the deformation in the historical period has no obvious acceleration stage, and the overall deformation is uniform. Therefore, the average deformation rate in the period is taken as the normal operation value. According to the determination method of quantification standard, the quantification standard of each point is obtained, which is shown in Table 4. The standard is used to diagnose the average deformation rate of each point within one month before the dam break, and the healthy value of the deformation rate index before the dam break is obtained. The specific results are shown in Table 6.

3.2.2. Total Deformation Index

Because of the high iron content in the tailings, the oxidation of iron will lead to cementation between particles. The test results [37] also show that under the constant load, the continuous creep of the tailings may lead to obvious and rapid strength loss, so the strain-softening model is adopted in the simulation calculation.
The initial stress state is obtained by simulating the accumulation process of the tailings dam. Then the creep deformation is added to the calculation, and the deformation is increased step by step, and the stability of the tailings dam after creep is calculated step by step until the tailings dam is destroyed. The investigation report shows that when the added creep is consistent with the deformation indicated by the monitoring data, the strength loss of tailings will be caused and dam failure will occur. Combined with the diagnostic standard shown in Table 4, the safety factor of the total deformation is 1, and the total deformation index of the tailings dam is determined to be in a dangerous state and the health value is 0.

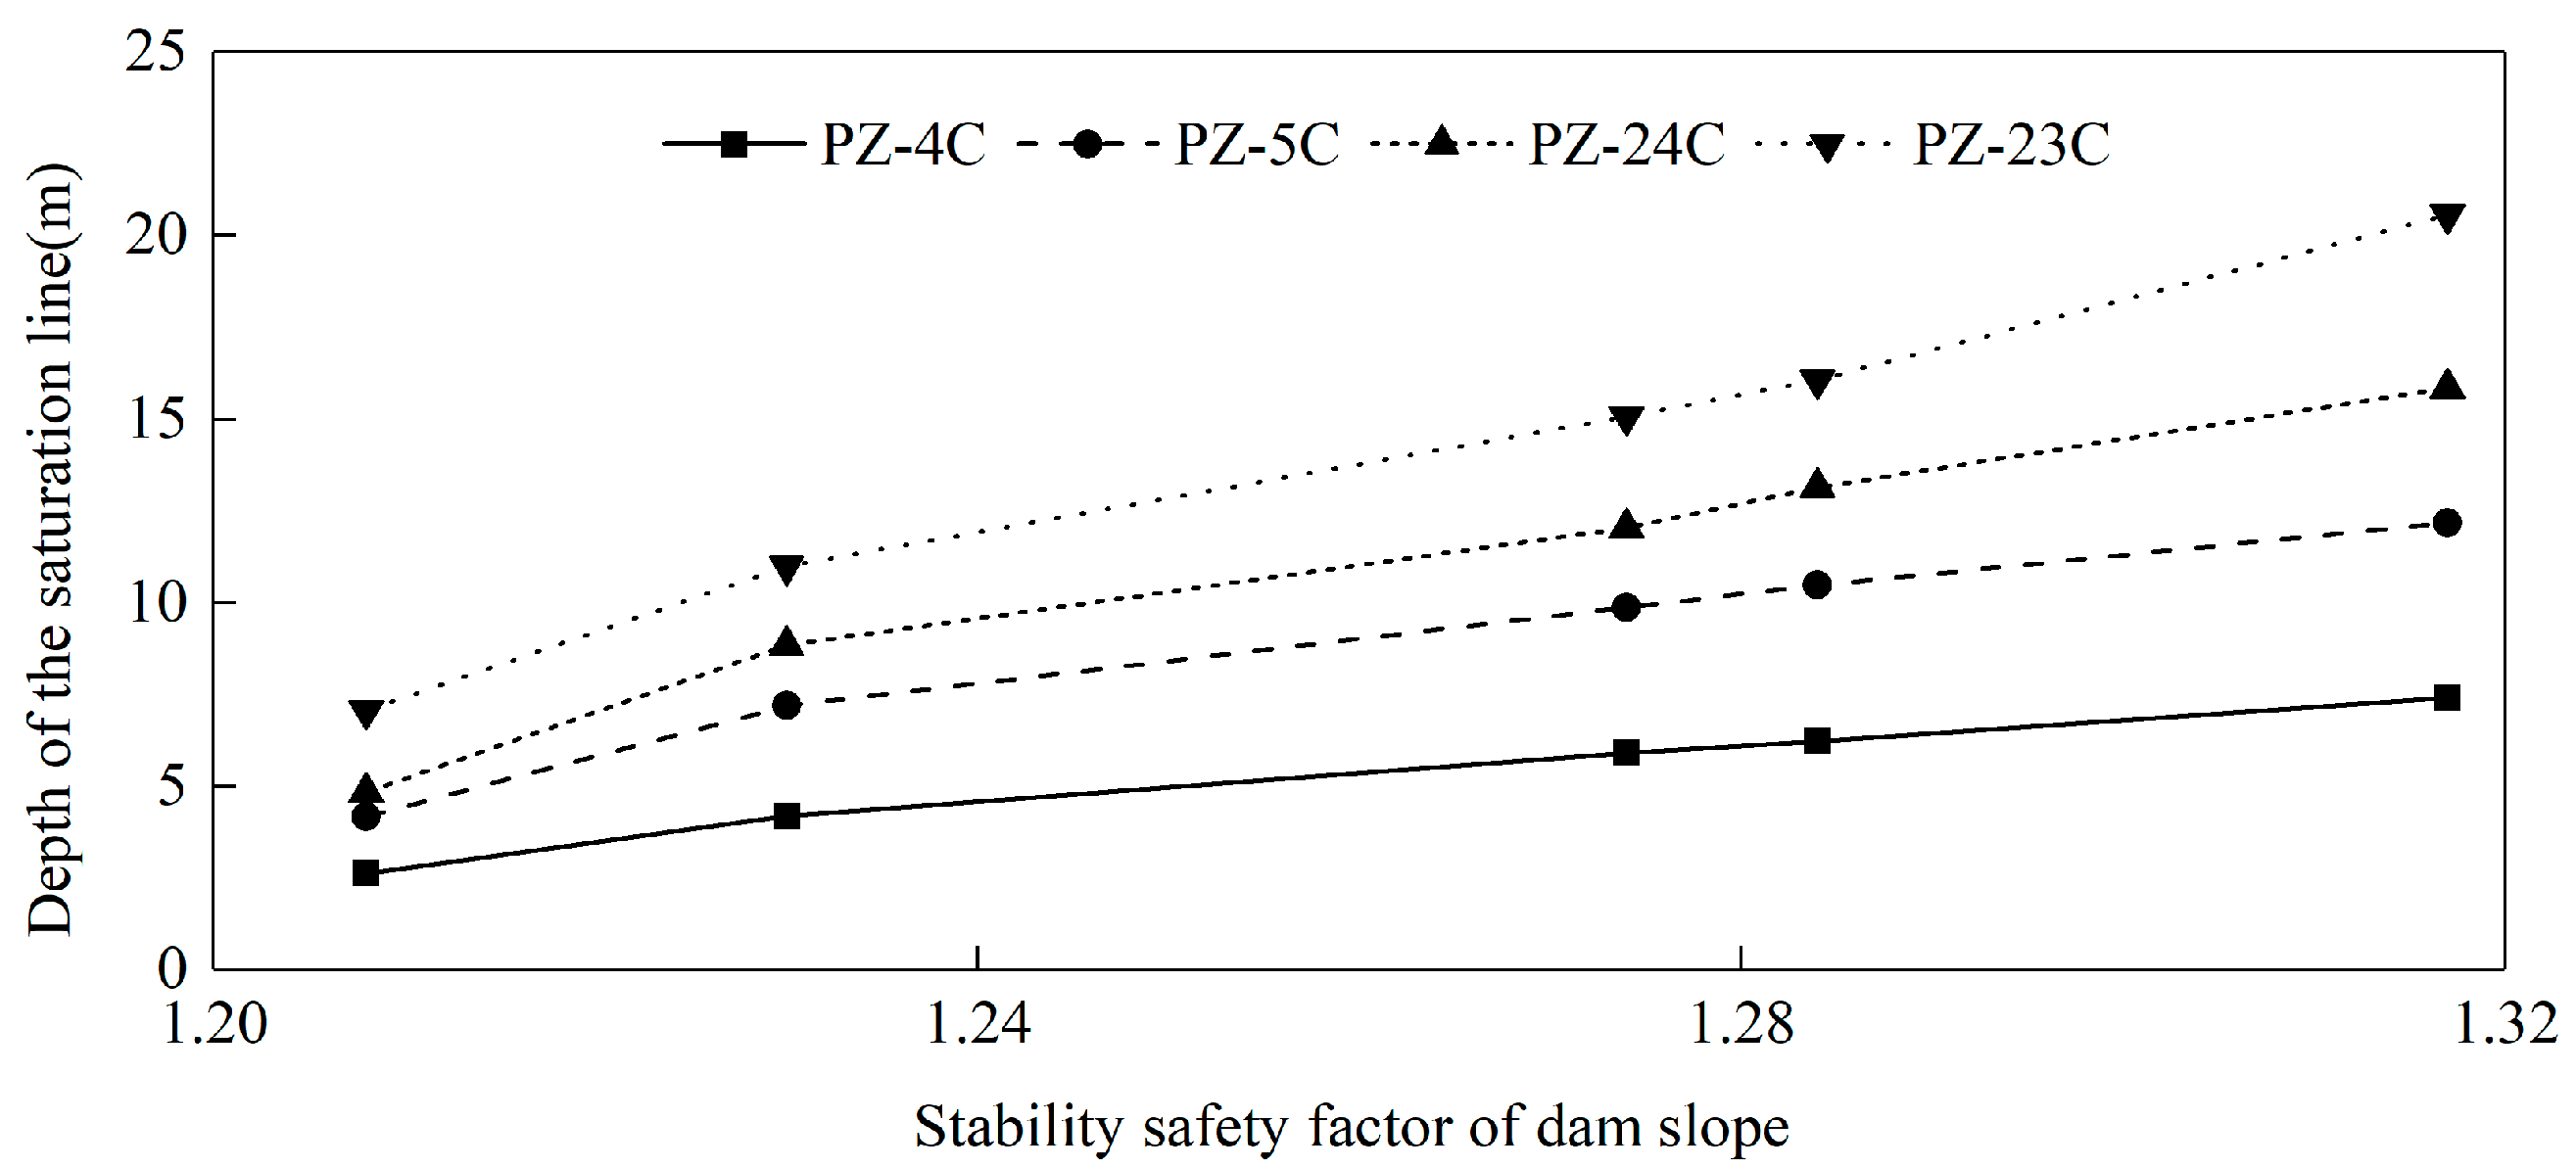
3.3. Diagnosis of the Seepage Stability Project

The seepage field of the dry beach with lengths of 50 m, 100 m, 125 m, 150 m and 200 m is calculated. The results show that the saturation lines all overflow from the drainage body between the fifth and sixth sub-dams, and then flow into the downstream channel through the drainage channel on the dam surface, which is consistent with the actual situation. By calculating the stability safety factor of the dam slope corresponding to the seepage field under various working conditions, the relationship curves between the depth of saturation line at PZ-4C, PZ-5C, PZ-24C and PZ-23C points and the stability safety factor of the dam slope are established, as shown in Figure 7.
According to the curve, the quantification standard of each point is determined, as shown in Table 4. The diagnosis data adopts the average value of the depth of the saturation line within one month before the dam break, and the diagnosis results are shown in Table 7.

3.4. Comprehensive Health Diagnosis

The health value of the project-layer index is obtained by summarizing the health value of the effect quantity index, and the health values of the slope stability project, the deformation stability project and the seepage stability project are 0.5568, 0.2080 and 0.7377, respectively, as shown in Table 8. The slope stability project is in a diseased state, and the deformation stability project is in a dangerous state. Before the dam break, the seepage field of the tailings dam is in good condition, and the depth of saturation line has a downward trend year by year, and the seepage stability project is in healthy state.
The analytical hierarchy process method was used to weight the project-layer indexes, and eight experts were invited to give judgment matrix considering the importance of each index to the overall health status of the tailings dam and the operation characteristics of the tailings dam.
The consistency indexes of the judgment matrices are all less than 0.1, and the consistency test meets the requirements. The weight of the project-layer index is obtained by solving the eigenvalue of the judgment matrices. As can be seen from Table 9, the opinions of experts are relatively unified, and they all think that the slope stability project is more important. Combining the opinions of eight experts by the arithmetic average method, the fixed weights of the project-layer index are w = (0.4483, 0.2612, 0.2905). The health value of the slope stability project falls within the diseased state. Therefore, the penalty function should be adopted in Equation (2), and its value of variable weights should be determined to be 2.5813. Similarly, the values of variable weights of the project layer indexes obtained by Equation (2) are S = (2.8513, 16.3090, 1.000), and the final variable weights calculated by Equation (3) are w0 = (0.2193, 0.7309, 0.0498). The health value of the tailings dam based on dynamic weight is 0.3109 calculated by the weighted average method, that is, the tailings dam before the dam break was in a dangerous state, which is consistent with the actual situation of the tailings dam. The result proves the accuracy and applicability of this method. The health value of the tailings dam based on fixed weight is 0.5283. The traditional diagnosis method based on fixed weight will lead to the distortion of diagnosis results, while the dynamic weight can effectively solve the problem of state imbalance and improve the reliability of diagnosis results.

4. Conclusions

(1)
The index system of comprehensive diagnosis of tailings dam health is established, and the dynamic change of index weight is realized based on the analytical hierarchy process and the penalty variable weight method, which increases the importance of the deterioration index in comprehensive diagnosis and makes the diagnosis result more accurate and reasonable.
(2)
Based on numerical simulation and the statistical analysis method, the diagnosis method of the indexes of effect quantity layer is put forward, and the quantitative standard of each index is determined. The comprehensive diagnosis method of tailings dam health based on monitoring data is put forward, and the quantitative diagnosis of tailings dam health status is realized.
(3)
This method was applied to tailing dam I, and the health value of 0.3109 indicates that the tailings dam is in a dangerous state before the dam failure, which is consistent with the actual situation and verifies the accuracy and applicability of the method.
The comprehensive diagnosis based on the dynamic weight of tailings dam is very valuable. This method overcomes the influence of artificial subjective judgment and provides a new method for evaluating the safety of tailings dams.

Author Contributions

Conceptualization, K.D. and Z.M.; methodology, K.D. and Z.M.; software, K.D.; validation, D.Y.; formal analysis, K.D.; investigation, K.D.; resources, K.D.; data curation, K.D. and D.Y.; writing—original draft preparation, K.D.; writing—review and editing, K.D. and D.Y.; visualization, K.D.; supervision, Z.M. and D.Y.; project administration, K.D.; funding acquisition, Z.M. All authors have read and agreed to the published version of the manuscript.

Funding

This research was funded by the National Key R&D Program of China (No. 2017YFC0804605), and the National Natural Science Foundation of China (51539006, 51909174).

Institutional Review Board Statement

Not applicable.

Informed Consent Statement

Not applicable.

Data Availability Statement

Not applicable.

Conflicts of Interest

The authors declare no conflict of interest.

References

  1. McDermott, R. The Aznalcóllar Tailings Dam Accident—A Case Study. Miner. Resour. Eng. 2000, 9, 101–118. [Google Scholar] [CrossRef]
  2. Fourie, A.B.; Blight, G.E.; Papageorgiou, G. Static liquefaction as a possible explanation for the Merriespruit tailings dam failure. Can. Geotech. J. 2001, 38, 707–719. [Google Scholar] [CrossRef]
  3. Guodong, M. Quantitative Assessment Method Study Based on Weakness Theory of Dam Failure Risks in Tailings Dam. Procedia Eng. 2011, 26, 1827–1834. [Google Scholar] [CrossRef] [Green Version]
  4. Byrne, P.; Hudson-Edwards, K.A.; Bird, G.; Macklin, M.G.; Brewer, P.; Williams, R.D.; Jamieson, H.E. Water quality impacts and river system recovery following the 2014 Mount Polley mine tailings dam spill, British Columbia, Canada. Appl. Geochem. 2018, 91, 64–74. [Google Scholar] [CrossRef]
  5. Burritt, R.L.; Christ, K. Water risk in mining: Analysis of the Samarco dam failure. J. Clean. Prod. 2018, 178, 196–205. [Google Scholar] [CrossRef]
  6. Su, H.Z.; Hu, J.; Wu, Z.R. A study of safety evaluation and early-warning method for dam global behavior. Struct. Health Monit. 2012, 11, 269–279. [Google Scholar]
  7. Xu, Q.; Xu, K. Assessment of air quality using a cloud model method. R. Soc. Open Sci. 2018, 5, 171580. [Google Scholar] [CrossRef] [PubMed] [Green Version]
  8. Wang, Y.; Jing, H.; Yu, L.; Su, H.; Luo, N. Set pair analysis for risk assessment of water inrush in karst tunnels. Bull. Eng. Geol. Environ. 2016, 76, 1199–1207. [Google Scholar] [CrossRef]
  9. Zhu, L. Research and application of AHP-fuzzy comprehensive evaluation model. Evol. Intell. 2020, 13, 1–7. [Google Scholar] [CrossRef]
  10. Do, T.; Laue, J.; Mattsson, H.; Jia, Q. Numerical Analysis of an Upstream Tailings Dam Subjected to Pond Filling Rates. Appl. Sci. 2021, 11, 6044. [Google Scholar] [CrossRef]
  11. Li, W.; Ye, Y.; Hu, N.; Wang, X.; Wang, Q. Real-Time Warning and Risk Assessment of Tailings Dam Disaster Status Based on Dynamic Hierarchy-Grey Relation Analysis. Complexity 2019, 2019, 5873420. [Google Scholar] [CrossRef]
  12. Yuan, L.W.; Li, X.M.; Li, S.M.; Chen, Y.M. Study on Risk Assessment Method for Tailings Pond Disaster Based on Improved Index Weight Method. Adv. Mater. Res. 2015, 1092–1093, 753–761. [Google Scholar] [CrossRef]
  13. Krupskaya, L.; Zvereva, V.P.; Kirienko, O.A.; Imranova, E.L.; Volobueva, N.G. Using an comprehensive method for evaluation of environment state in a zone of influence of a tailing dam. Russ. J. Gen. Chem. 2016, 86, 3012–3014. [Google Scholar] [CrossRef]
  14. Liu, C.; Shen, Z.; Gan, L.; Xu, L.; Zhang, K.; Jin, T. The Seepage and Stability Performance Assessment of a New Drainage System to Increase the Height of a Tailings Dam. Appl. Sci. 2018, 8, 1840. [Google Scholar] [CrossRef] [Green Version]
  15. He, L.; Gao, B.; Luo, X.; Jiao, J.; Qin, H.; Zhang, C.; Dong, Y. Health Risk Assessment of Heavy Metals in Surface Water near a Uranium Tailing Pond in Jiangxi Province, South China. Sustainability 2018, 10, 1113. [Google Scholar] [CrossRef] [Green Version]
  16. Pan, K.; Dong, Y. Risk Assessment of Tailings Pond Based on Triangular Fuzzy Theory. Adv. Mater. Res. 2012, 524–527, 515–519. [Google Scholar] [CrossRef]
  17. Chu, H.; Xu, G.; Yasufuku, N.; Yu, Z.; Liu, P.; Wang, J. Risk assessment of water inrush in karst tunnels based on two-class fuzzy comprehensive evaluation method. Arab. J. Geosci. 2017, 10, 179. [Google Scholar] [CrossRef]
  18. Gu, H.; Fu, X.; Zhu, Y.; Chen, Y.; Huang, L. Analysis of Social and Environmental Impact of Earth-Rock Dam Breaks Based on a Fuzzy Comprehensive Evaluation Method. Sustainability 2020, 12, 6239. [Google Scholar] [CrossRef]
  19. Wang, G.; Tian, S.; Hu, B.; Chen, J.; Kong, X. Regional Hazard Degree Evaluation and Prediction for Disaster Induced by Discharged Tailings Flow from Dam Failure. Geotech. Geol. Eng. 2020, 39, 2051–2063. [Google Scholar] [CrossRef]
  20. Wang, T.; Zhou, Y.; Lv, Q.; Zhu, Y.; Jiang, C. A safety assessment of the new Xiangyun phosphogypsum tailings pond. Miner. Eng. 2011, 24, 1084–1090. [Google Scholar] [CrossRef]
  21. Xu, B.; Wang, Y. Stability analysis of the Lingshan gold mine tailings dam under conditions of a raised dam height. Bull. Eng. Geol. Environ. 2014, 74, 151–161. [Google Scholar] [CrossRef]
  22. Wang, D.; Shen, Z.Z.; Tao, X.H. Three-dimensional finite element analysis and safety assessment for seepage field of a tailings dam. J. Hohai Univ. (Nat.Sci.) 2012, 3, 307–312. (In Chinese) [Google Scholar]
  23. Li, Q.; Gao, S.; Niu, H.K.; Shang, Y.L. Analytical solution to saturation line of tailings pond and its applicability analysis. Rock Soil Mechannics 2020, 41, 9. (In Chinese) [Google Scholar]
  24. Dong, L.; Shu, W.; Sun, D.; Li, X.; Zhang, L. Pre-Alarm System Based on Real-Time Monitoring and Numerical Simulation Using Internet of Things and Cloud Computing for Tailings Dam in Mines. IEEE Access 2017, 5, 21080–21089. [Google Scholar] [CrossRef]
  25. Li, Q.M.; Yuan, H.N.; Zhong, M.H. Safety assessment of waste rock dump built on existing tailings ponds. J. Cent. South Univ. 2015, 22, 2707–2718. [Google Scholar] [CrossRef]
  26. Dong, L.; Deng, S.; Wang, F. Some developments and new insights for environmental sustainability and disaster control of tailings dam. J. Clean. Prod. 2020, 269, 122270. [Google Scholar] [CrossRef]
  27. Tan, Q.W.; Xin, B.Q.; Wan, L.; Dong, Y.; Du, S. Risk evaluation indexes and gradation method of major hazard installations for tailings pond. J. Saf. Sci. Technol. 2018, 14, 99–106. (In Chinese) [Google Scholar]
  28. Jiang, F.; Wu, H.; Liu, Y.; Chen, G.; Guo, J.; Wang, Z. Comprehensive evaluation system for stability of multiple dams in a uranium tailings reservoir: Based on the TOPSIS model and bow tie model. R. Soc. Open Sci. 2020, 7, 191566. [Google Scholar] [CrossRef] [PubMed] [Green Version]
  29. ANCOLD. Guideline on Risk Assessment; Australian National Committee on Large Dams: Sydney, Australia, 2003. [Google Scholar]
  30. Ministry of Housing and Urban-Rural Development of the People’s Republic of China. Tailings Facility Design Specification; GB50863–2013; China Planning Press: Beijing, China, 2013. (In Chinese) [Google Scholar]
  31. Australia, Western. Guidelines on the Safe Design and Operating Standards for Tailings Storage. Department of Minerals and Energy Western Austrlia. 1999. Available online: https://www.scribd.com/document/235421799/Guidelines-Safe-Design-Operating-Standards-for-Tailings-Storage-Wa (accessed on 1 December 2020).
  32. Ishizaka, A.; Labib, A. Review of the main developments in the analytic hierarchy process. Expert Syst. Appl. 2011, 38, 14336–14345. [Google Scholar] [CrossRef] [Green Version]
  33. Jena, R.; Pradhan, B.; Beydoun, G.; Nizamuddin, N.; Ardiansyah; Sofyan, H.; Affan, M. Integrated model for earthquake risk assessment using neural network and analytic hierarchy process: Aceh province, Indonesia. Geosci. Front. 2019, 11, 613–634. [Google Scholar] [CrossRef]
  34. Li, H.X. Factor space and mathematical frame of knowledge representation (Ⅷ)—Variable weights analysis. Fuzzy Syst. Math. 1995, 3, 1–9. (In Chinese) [Google Scholar]
  35. Ministry of Housing and Urban-Rural Development of the People’s Republic of China. Unified Standard for Reliability Design of Hydraulic Engineering Structures; GB50199–2013; China Planning Press: Beijing, China, 2013. (In Chinese) [Google Scholar]
  36. Palmer, J. Anatomy of a Tailings Dam Failure and a Caution for the Future. Engineering 2019, 5, 605–606. [Google Scholar] [CrossRef]
  37. Robertson, P.K.; Melo, L.; Williams, D.J.; Wilson, G.W. Report of the Expert Panel on the Technical Causes of the Failure of Feijão Dam I. Australia. 2019. Available online: https://www.resolutionmineeis.us/documents/robertson-et-al-2019. (accessed on 1 December 2020).
Figure 1. Diagnosis index system of tailings dam health.
Sustainability 14 03068 g001
Figure 2. The flow chart of diagnosis process.
Sustainability 14 03068 g002
Figure 3. Satellite image of tailings dam I.
Sustainability 14 03068 g003
Figure 4. Typical profile of tailings dam I.
Sustainability 14 03068 g004
Figure 5. Calculation results of stability and reliability of tailings dam I.
Sustainability 14 03068 g005
Figure 6. Vertical deformation curve of the measuring points.
Sustainability 14 03068 g006
Figure 7. The relation curve between the depth of saturation line and the safety factor.
Sustainability 14 03068 g007
Table 1. Classification criteria for health values.
Health LevelHealthyDiseasedDangerous
Health value[1.0, 0.67)[0.67, 0.33)[0.33, 0]
Table 2. Reliability index of hydraulic structure.
Structural Safety Level123
Category of destructionThe first3.73.22.7
The second4.23.73.2
Table 3. Safety level and dam-break probability of the tailings dam.
Structural Safety LevelsTailings DamReliability IndexDam Break Probability
113.71.08 × 10−4
22,33.26.87 × 10−4
34,52.73.47 × 10−3
Table 4. Diagnosis criteria of the effect quantity indexes (tailings dam I).
Project LayerEffect Quantity LayerHealthyDiseasedDangerous
Dam slope stabilitySafety fatorNormal operating conditions[1.690, 1.300](1.300, 1.235](1.235, 1.000]
ReliabilityReliability index[4.348, 3.200](3.200, 2.464](2.464, 1.485]
Probability of failure[6.87 × 10⁻⁶, 6.87 × 10⁻⁴](6.87 × 10⁻⁴, 6.87 × 10⁻³](6.87 × 10−3,6.87 × 10−2]
DeformationstabilityDeformation rate(mm/d)1[0.244, 0.317)[0.317, 0.488)[0.488, 0.732]
2[0.203, 0.264)[0.264, 0.406)[0.406, 0.609]
3[0.222, 0.288)[0.288, 0.443)[0.443, 0.666]
4[0.240, 0.312)[0.312, 0.480)[0.480, 0.720]
Total deformationDeformation safety factor[2.6, 2)[2, 1.3)[1.3, 1]
SeepagestabilityDepth of the saturation linePZ-4C[13.60, 6.80)[6.80, 4.40][4.40, 2.47]
PZ-5C[22.60, 11.30)[11.30, 7.50)[7.50, 2.87]
PZ-24C[28.92, 14.46)[14.46, 9.21)[9.21, 3.20]
PZ-23C[36.50, 18.25)[18.25, 11.46)[11.46, 3.53]
Table 5. Mechanical parameters of the materials.
Parametersγ (KN/m3)c (kPa)φ (°)kh (m/s)kv/kh
Coarse tailings26.50335.00 × 10−60.2
Fine tailings26.00321.00 × 10−70.2
Compacted tailings27.50365.00 × 10−70.2
Ultra-fine iron ore250351.20 × 10−61
Compacted soil (laterite)2012291.20 × 10−91
Slimes230251.00 × 10−70.2
Foundation soil2315309.30 × 10−71
Table 6. Diagnostic results of the deformation rate indicator.
Measuring Points1234
Deformation rate (mm/d)0.820.330.280.42
Health value0.0000.50660.71000.4479
Table 7. Diagnosis results of the saturation line index.
Measuring PointsPZ-4CPZ-5CPZ-24CPZ-23C
Depth of the saturation line (m)14.2921.4815.5510.47
Health value1.0000.96730.69490.2888
Table 8. Health values of each layer index.
Project LayerEffect Quantity LayerBasic Layer
Dam slope stability0.5568Safety fator0.6759Safety fator of dam slope0.6759
Reliability0.4376Reliability index0.4376
Deformation
stability
0.2080Deformation rate0.416110.0000
20.5066
30.7100
40.4479
Total deformation0.0000Deformation safety factor0.0000
Seepage
stability
0.7378Depth of the saturation line0.7378PZ-4C1.0000
PZ-5C0.9673
PZ-24C0.6949
PZ-23C0.2888
Table 9. Weighting results of the project-layer indexes.
ExpertsA1A2A3A4A5A6A7A8Results
project-layerSlope stability0.49340.53960.24020.62500.38740.17400.63370.49340.4483
Deformation0.31080.16340.54990.13650.16920.37150.19190.19580.2612
Seepage0.19580.29700.20980.23850.44340.45450.17440.31080.2905
Consistency index0.05170.00880.01760.01570.01760.01660.00890.0516-
Publisher’s Note: MDPI stays neutral with regard to jurisdictional claims in published maps and institutional affiliations.

