Abstract
China’s grain production has been on a pathway parallel to urbanization in the last 30 years. When the balance between the grain supply and demand is considered, contradiction between farming suitability and actual deviation provides warning of a crisis regarding China’s food security. In this study, we constructed a set of topologic maps to summarize the basic distribution of the farming conditions in China, and Kernel density and Local Moran’s I analyses were con-ducted to investigate the spatial-temporal pattern of China’s regional grain production based on the grain output at the county level from 1985 to 2019. The results show that the high-output zones were concentrated in the regions with superior physical conditions in 1985, and by 2019, the high-output zones had increased in the northern regions (i.e., Northeast China Plain) and decreased in the southern regions (i.e., Southern China). The surplus zones of per capita grain output were concentrated in the regions with high total outputs during 1985–2019. The shortage zones were distributed in the regions with low total outputs and low total outputs or large populations. Based on the above three results, several typical commodity grain bases have lost their dominant role (i.e., the Pearl River Delta); furthermore, the qualified commodity grain bases were compiled at both the national and regional level based on overlay analysis (i.e., the Tarbagatay Prefecture as well as eastern and central Inner Mongolia).
1. Introduction
China’s grain production is not only closely related to the daily lives of residents, but also plays a vital role in the country’s sustainable development and the stability of the world’s food market [1]. Brown pointed out that China’s grain demand will have a negative impact on the global grain supply by the beginning of the 21st century [2]. However, some researchers believe that China plays a positive role in ensuring world food security [3,4]. Hence, in recent years, related studies have mostly focused on the regional comprehensive grain production capacity [5,6,7,8,9], the spatial pattern of the grain output [10,11,12], and the grain supply and demand [13,14,15].
In terms of the regional grain production pattern, natural conditions that affect agriculture (temperature, precipitation, and soil) are fundamental in the formation of the main spatial pattern of grain production in China, which exhibits the traditional pattern of grain transportation from the southern regions to the northern regions during the long-term historical accumulation of agricultural production [5,16]. With the rapid development of urbanization and agricultural modernization [17,18], since the 1990s, the spatial pattern of the grain output has changed from transporting grain to the north to relying mainly on the northern regions due to the conversion of farmland in the southern regions, the expansion of cultivated land in the northern regions [19,20,21,22], the transfer of agricultural labor to non-agricultural industries [23], and the adjustment of the planting structure [24]. Until 2018, the number of provinces with a grain surplus increased to 12 (nine in the north and three in the south). For a long time, China’s domestic grain demand mainly depended on domestic resources [15]. The transformation of the spatial pattern of the grain output surplus and shortage regions was driven by the grain output [25,26,27]. Moreover, due to China’s large population, the grain demand on an individual level is to guarantee nutritional security [28]. The regions with high grain output per capita were mostly concentrated in northern and eastern China, and the ones with low grain output per capita were concentrated in southern and western China [29]. In these studies, the analysis of the spatial pattern of the grain production evolution mainly focused on its transformation direction and production advantages based on the center of gravity of the grain output and the production concentration index based on the administrative regionalization, while less attention was paid to analyzing the spatial agglomerations and the differences in the regional grain production at a fine scale. Moreover, we are also thinking about which regions could become new grain supply areas and what changes have taken place in the existing grain supply areas based on the spatial pattern of grain production evolution. Therefore, the spatial pattern of grain production evolution is meaningful when it is considered in connection with the commodity grain bases. The development of China’s commodity grain bases could safeguard national grain reserves and balance the regional grain supply and demand. Commodity grain bases are defined as relatively fixed farming areas where there is fertile soil and good climatic conditions on a large scale, with high output of grains both by total and per capita. The typically national commodity grain bases have been formed by favorable agricultural natural conditions and a high surplus of the total and per capita grain output, including the Songnen Plain and Sanjiang Plain in Heilongjiang and Jilin, the Dongting-lake Plain in Hunan, the Jianghan Plain in Hubei, the Chengdu Plain in Sichuan, the Poyang-lake Plain in Jiangxi, the Taihu-lake Plain in Jiangsu, the Huaihe Plain in Jiangsu and Anhui, and the Pearl River Delta in Guangdong, which are mainly distributed in the eastern and central parts of China. Thus, we aim to obtain knowledge and reach conclusions helpful in supplementing the current scheme of the National Commodity Grain Bases by the analysis of basic farming conditions and the spatial pattern of grain production evolution by total and per capita output.
We used a topologic map to extract and generalize the spatial patterns of China’s basic farming conditions. Then, we identified the spatial agglomerations of high grain output through kernel density analysis and the grain surplus–shortage regions based on the spatial autocorrelation, and we investigated the evolution of the spatial pattern from 1985 to 2019. Furthermore, based on the spatial patterns of the grain production and the natural conditions favorable for agriculture, a qualified candidate list of commodity grain bases was compiled via spatial overlap analysis. The remainder of this paper is organized as follows. In Section 2, we describe the data and methods. After analyzing the pattern of the basic farming conditions in Section 3.1, the spatial-temporal pattern of China’s regional grain output and regional grain supply and demand is described in Section 3.2 and Section 3.3. In Section 3.4, we further assess qualified candidates for commodity grain bases according to the analysis results of Section 3.1, Section 3.2, Section 3.3. The discussion is presented in Section 4. Finally, the conclusions are summarized in Section 5.
2. Materials and Methods
2.1. Data Collection
2.1.1. Basic Spatial Geographic Data
Digital Elevation Model (DEM) data for China were obtained from Shuttle Radar Topography Mission (SRTM) data. The meteorological datasets for China contained the annual average precipitation, the annual average temperature, and the accumulated temperature of 10 °C. These datasets and spatial soil type distribution data for China, with a spatial resolution of 1 km, were provided by the Data Center for Resources and Environmental Sciences, Chinese Academy of Sciences (RESDC). The Geographic Information System (GIS) vector data for China’s county administrative divisions and China’s agricultural regionalization collected in 2013 were used. China’s agricultural regionalization includes Northern arid and semiarid region, Northeast China Plain, Huang-Huai-Hai Plain, Loess Plateau, Middle-lower Yangtze Plain, Sichuan Basin and surrounding regions, Qinghai-Tibet Plateau, Yunnan Guizhou Plateau, and Southern China.
2.1.2. Statistical Data
(1) The grain output data for the provincial unit were obtained from China rural statistical yearbook during 1978–2016, which did not include data for the Hong Kong Special Administrative Region, the Macao Special Administrative Region, and Taiwan Province. In addition, the data for 2017–2019 could not be matched with the former because of different statistical indices used. We managed to derive the data for the entire period from 1978 to 2019 using substituted indices and data. In this study, the definition of grain is consistent with that in the statistical yearbook, which consists of paddy, wheat, maize, tubers, and beans.
(2) The grain output and population data at the county level from 1985 to 2016 was obtained from China statistical yearbook (county-level), which did not include data for the Hong Kong Special Administrative Region, Macao Special Administrative Region and Taiwan Province. Similar to the above situation, the trend for 2017–2019 was deduced and the data for the entire period (1985–2019) were also derived.
(3) Due to the change in the scopes or names of county-level administrative divisions in different years, we used the scopes and codes of China’s county-level administrative divisions in 2013 as the benchmark to revise the administrative units that only change names in other years.
2.2. Methods
2.2.1. Graph-Image Thinking
Graph-image thinking is one of the important methods in cartography and geo-graphic information science. This method uses graphs such as maps, abstract maps, statistical graphs, charts, and tables of features to extract and generalize geographic objects and processes [30,31]. Therefore, the country was divided into regions with different basic farming conditions, and we used topologic maps to geometrically deform these regions, which ensured the correct relative position between the polygon features without maintaining the correct shape, area, and distance. In addition, we designed a combination of three-dimensional chart and tables to illustrate the regional characteristics of the basic farming conditions and the differences between regions.
2.2.2. Kernel Density
The Kernel Density calculates the density of features in a neighborhood around those features; thus, some properties of data distribution are obtained, such as the spatial agglomeration area of the analysis object. The attributes could be used to weight some features more heavily than others, depending on their meaning. Density calculations are dependent on accurate distance calculations. We utilized ArcGIS version 10.5 to calculate the kernel density of the total grain output in China from 1985 to 2019, and thereby, the spatial density and the core regions of the total grain output were estimated and identified.
2.2.3. Local Moran’s I
The spatial autocorrelation is a measure of the degree of numerical clustering in a global or local spatial region, and it can be measured by Global Moran’s I or Local Moran’s I. Local spatial autocorrelation is used to evaluate the local heterogeneity of spatial autocorrelation (non-stationarity). Using local spatial autocorrelation, the spatial clustering of elements with high or low values within the region of interest can be identified as well as spatial outliers.
The Local Moran’s I statistic of spatial association is calculated as follows:
where represents an attribute for feature , represents the mean of the corresponding attribute, represents the total number of features, and represents the spatial weight matrix () between features and .
The significant test of can be calculated by the standardized statistics test, which is defined as:
where for Local Moran’s I and is the standard deviation of . A positive value (i.e., a hot spot) indicates agglomeration of high values; a negative value (i.e., a cold spot) indicates agglomeration of low values.
We chose the difference between the per capita grain output at the county level (total grain output/total population) and a 400 kg grain output per capita as the local indicators of the spatial association index cluster patterns, and thus, the spatial agglomeration of the grain surplus and shortage regions were identified.
3. Results
3.1. Pattern of Basic Farming Conditions in China
Grain production is the organic combination of social and natural reproduction, and physical resources are even more important factors, which support and maintain farming activities, of which climate and soil resources determine the pattern, structure, output, and quality of agricultural production to a great extent [32]. Latitude and longitude zonality refer to the change and replacement of geographical environment and its constituent elements along the latitudinal and longitudinal direction, which is mainly manifested in the regular change of climate and soil. The latitude zonality of the natural environment is based on heat and the longitude zonality is based on moisture, which has a direct impact on agricultural production. The type, growth period, and planting system of crops are closely related to temperature, precipitation, and soil type. Therefore, the spatial pattern of the basic farming conditions dominates China’s grain production pattern. Here, using the materials and methods mentioned above, we created a set of “pattern maps and tables” to formulate recognition on the spatial pattern of China’s basic farming condition and to create the framework for China’s grain production division and its evolution in the past 30 years.
The first map is called the location pattern map of basic farming conditions in China (Figure 1), which represents the topography-location of China’s 15 farming regions according to latitude and longitude zonality. From east to west, the north row contains northeastern China (Heilongjiang, Jilin, Liaoning, and eastern Inner Mongolia), northern China (Beijing, Tianjin, Hebei, Shanxi, and middle of Inner Mongolia), close northwestern China (Shaanxi, Gansu, Ningxia, and western Inner Mongolia), and far northwestern China (Xinjiang). From east to west, the second north row contains Liaoning and Shandong Peninsula, the Central Plain (Henan, Anhui, and Southeastern Shandong), Guanzhong and the Qinling-Bashan Mt. Area, Qilian Mt., and the Qaidam Basin (northern Qinghai). From east to west, the middle row contains eastern China (Jiangsu, Zhejiang, and Shanghai), central China (Hubei, Hunan, and Jiangxi), the Sichuan Basin (Sichuan and Chongqing), and the Qinghai-Tibet Plateau (Tibet and Hinterland of Qinghai). From east to west, the south row contains southeastern China (Fujian and Taiwan), southern China (Guangdong, Guangxi, and Hainan), and Yunnan and Guizhou Plateau.
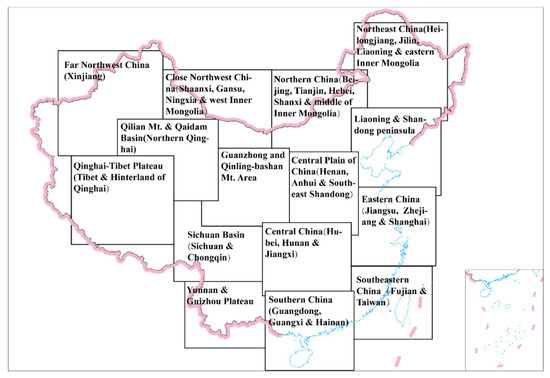
Figure 1.
Map showing the pattern of the basic farming conditions in China.
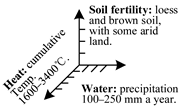
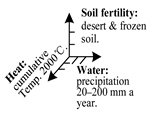
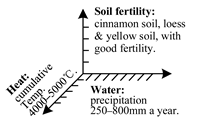
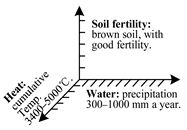
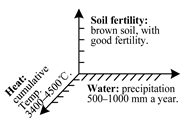
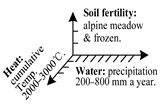
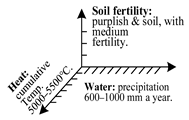
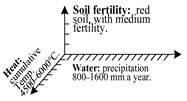
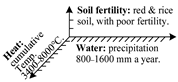
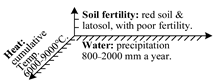
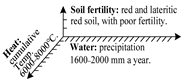
The second is a table named the analytical pattern table of basic farming conditions in China (Table 1) that describes the temperature, water, and soil conditions in each region in China in Figure 1 in an analytical three-dimensional manner in the form of a table and chart.

Table 1.
The analytical pattern table of basic farming conditions in China.
The horizontal row generalizes the temperature conditions in China’s farming regions in terms of latitude zones. Based on the differences in the solar radiation, the following four zones were defined from north to south: the mid and cold temperate zone, the warm temperate and north sub-tropical zone, the mid sub-tropical zone, and the south sub-tropical and tropical zone. The vertical column classifies the water conditions of China’s farming division in terms of longitude zones. Based on the differences in the humidity from east to west, the following four zones were defined: the humid and semi-humid zone, the semi-humid and semi-arid zone, the arid and semi-arid zone, and the extremely arid zone. Each cell of the table not only describes, based on a 3D axis with detailed degree scale marks, the heat index (i.e., the cumulative temperature (°C)), the water index (i.e., precipitation (mm)), and the land index (i.e., the soil type) of each farming region, but also summarizes the farming features and major food products of the regions.
The third is a map named “Summarized pattern of the basic farming conditions in China” (Figure 2), which explains the summarized spatial pattern of China’s 15 farming divisions in the form of a topologic map with an arrow and annotations. The red arrow and the red annotations illustrate the north–south spatial pattern of the farming conditions in China, which correspond to the four columns in Table 1. Each column possesses common farming features, while the strong point and weak point of the different parts within it vary in terms of the heat, water, and soil conditions. The blue arrow and blue annotations illustrate the west–east spatial pattern of the farming conditions in China, which correspond to the four rows in Table 1. Each row presents its farming features and the crops. Based on the integration of the above columns and rows, the unique farming conditions of each region can be determined.
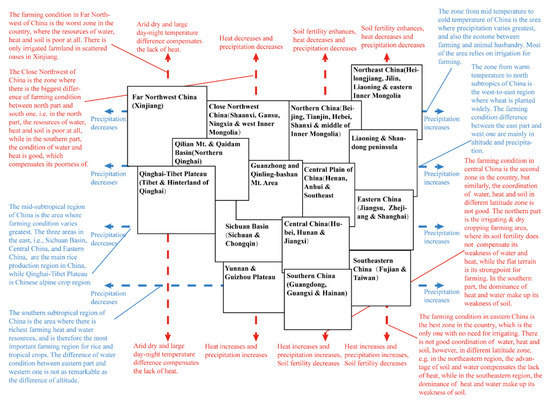
Figure 2.
Summarized pattern of the basic farming conditions in China.
3.2. Spatial-Temporal Pattern of China’s Reginal Grain Output
The 15 farming regions in China described in Section 3.1 are a theoretical and ideal scheme that is mainly based on climatic zonation and soil. However, when China’s geographical features—i.e., the three steps of China’s terrain, monsoon climatic division, and differences between the eastern, central, and western parts—are considered and the agricultural functionality and the statistical unit of the data are taken into account, we can categorize the 15 regions into 9 categories based on provincial administrative regionalization: Northeast China Plain (NECP); Huang-Huai-Hai Plain (HHHP); Middle-lower Yangtze Plain (MLYP); Southern China (SC); Loess Plateau (LP); Sichuan Basin and surrounding regions (SBSR); Northern arid and semiarid region (NASR); Yunnan Guizhou Plateau (YNGZ); Qinghai Tibet Plateau (QHTB). The serial numbers of these regions are in order from the east belts to the west belts and from north to south within each belt. Each farming region is further divided into several areas of provinces.
3.2.1. Analysis of the Whole Country
China’s grain production has evolved in the last 40 years from relatively extensive sowing, lower crops output per unit area and lower total output to decreased sown areas, increased crop output of per unit area, and increased total output, but there has been some fluctuation in these three indices in some periods [33].
First, the overall indices of the country (Figure 3) provide a general impression. In 1978, the sown area exceeded 120.59 million hectares, but the average grain output per hectare was only 2527.34 kg, and thus, the total output was about 304.77 million tons. Then, in 2019, these three indices were 110.12 million hectares, 5623.84 kg, and 619.30 million tons, respectively. These data show that the yield per unit area and the total grain output increased significantly, while the sown area decreased slightly due to the promotion of new farming techniques and improvement of farming facilities and conditions. After obtaining the above overview of the evolution trend, we conducted correlation tests to evaluate the relationships between these three indices; it was found that during the 1978–2003 period, there was a significant negative correlation between the output and the sown area (), and there was a significant positive correlation between the output and the yield per unit area (), which ensured that the output increased during this period. After 2003, the output and the sown area () and the output and the yield per unit area () were significantly positively correlated, indicating that the sown area and the yield per unit area evidently affected the total grain output growth.
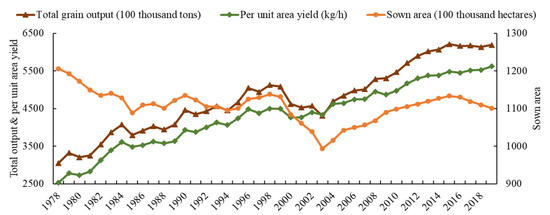
Figure 3.
Variations in grain output, grain yield per hectare, and sown area in China from 1978 to 2019.
Second, the three indices of each region (Figure 4) reflected the spatial difference within the country. MLYP, HHHP, and NECP were the top three in terms of the proportion of the total grain output, having 63.23–68.44% output from 1978 to 2019, which indicates that they were the main farming regions in China. The proportion of the grain output in MLYP has always been the first, but it significantly decreased (by 8.44%) during the study period. Typically, there was a decrease in the proportion of the grain output in MLYP, while the grain output of the entire country increased after 2004. The proportions of the grain output in HHHP and NECP increased by 3.39% and 7.03% from 1978 to 2019, respectively. The proportions of the other six regions were very close, primarily <10%, and their variations throughout the entire period were relatively smooth. This pattern reveals that the farming capacity and features of the nine regions were stable in the long term, so some of the areas in these regions are preferential candidates for the national commercial grain bases.
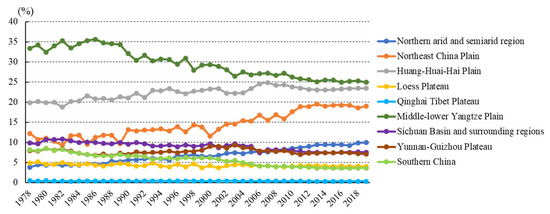
Figure 4.
The proportion of the total grain output in each faming region from 1978 to 2019.
Third, a map showing the spatial pattern of the grain outputs in the nine farming regions (Figure 5) was generated using kernel density analysis. Statistical data were obtained at the county level and then transformed into 1 km grids, thus revealing the agglomeration of different intensities of grain output. In general, the high grain output areas were mostly aggregated in the central and eastern regions of China. The high-output clusters were mainly increased in the northern regions, and decreased in the southern regions during the study period.
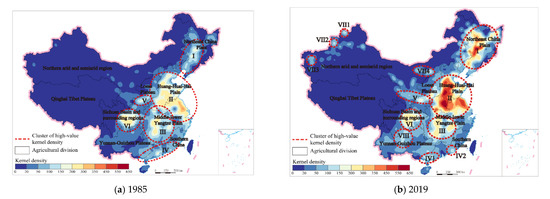
Figure 5.
Spatial pattern of the grain output at the county level throughout China: (a,b) the distribution of the kernel density in 1985 and 2019, respectively.
However, there were some changes in the pattern during different periods. In 1985 (Figure 5a), the high-output clusters were mainly in the regions in eastern, central, and part of the southwestern China, i.e., in Zones I–VI. In 2019 (Figure 5b), there were more kernel centers in central China, i.e., in the second step of China’s terrain. The changes were as follows: (1) The range and intensity of the clusters in Zone I increased. (2) The range of the cluster in Zone V expanded, but there was a marked decline in the cluster’s intensity. (3) The range of the high-output clusters in Zones II–IV and VI narrowed, especially in the Yangtze River Delta in Zone II and in the Pearl River Delta in Zone IV, and only the intensity of the high-output cluster in Zone II increased. (4) New grain output clusters were formed in NASR (Zones VII1–VII4) and YNGZ (Zone VIII) in 2019. In summary, the concentration of the main grain regions has shifted from central and southern China to central and northern China. It did not change in the plains, basins, and oases where there are favorable farming conditions; thus, these areas should be China’s grain centers in the long term.
3.2.2. Analysis of Each Agricultural Division
Based on the obtained understanding of the transformation of the spatial pattern of the grain output throughout China, the spatial transformation and development of the regional grain output are discussed further in this section. We investigated the local farming units based on the subtle features of the geomorphological, climatic, and hydrological factors and the local soil types in order to develop a new farming scheme on the national scale. As shown in Figure 6, there were significant increases in the spatial density and the scale of the core region of grain output at the county level in NASR, NECP, LP, and HHHP from 1985 to 2019. The core regions of grain output mainly developed in the zones with adequate water for irrigation and greater soil fertility. In MLYP, the spatial density of the grain output increased during the study period. Compared with 1985, the range and spatial density of the grain output in Zone I increased in the northern areas, with three crops planted in two years or two crops planted a year and greater soil fertility, covering the northern and central regions of Jiangsu and the northern regions of Anhui. In addition, there was a marked increase in the spatial density of the grain output in Zones II and III1. In SBSR and SC, the range of the core grain output regions decreased until 2019, especially in the Chengdu plain (Zone I1 in SBSR) and the Pearl River Delta (Zone II2 in SC). The spatial density of the grain output in YNGZ significantly increased in southern China from 1985 to 2019, of which the mountain zones on the border between Yunnan and Guizhou (Zone III1) were the most significant core regions. In QHTB, by 2019, the density of the grain output in the core zones (Zones I1, I2, and II) increased significantly due to the abundant sunshine, water resources for irrigation, and a high-output soil for dry crops.
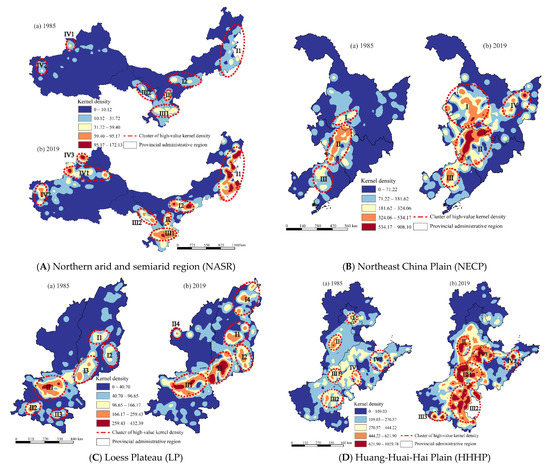
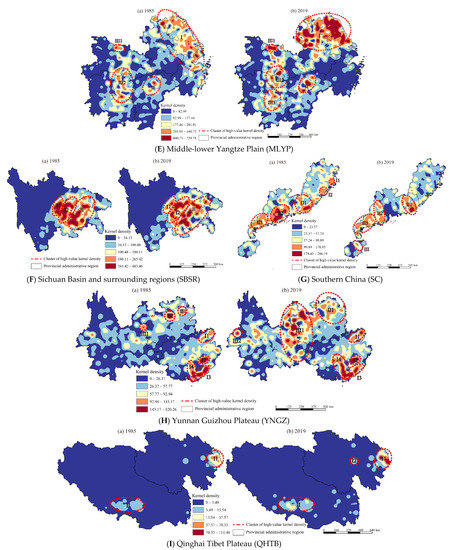
Figure 6.
Spatial pattern of grain output at county level on each agricultural division in 1985 and 2019, respectively.
Each area at the county level is described using names and locations in 1985 and 2019, and the spatial pattern of the grain output of each region is shown in the Appendix A (Table A1), as well as the changes and overall characteristics.
3.3. Spatial-Temporal Pattern of Regional Grain Supply and Demand
3.3.1. Analysis of the Entire Country
In addition to grain output quantity, another index is its surplus–shortage, which reflects the balance between the grain supply and demand. The total amount of the balance depends not only on the generation and sown area but also on the expenditure of grain; therefore, it is unfair to compare the pure surplus–shortage of grain among spatial units with different numbers and densities of residents. The Moran’s I and z-value for the grain surplus–shortage per capita at county level increased from 0.51 to 0.67 and from 39.12 to 49.87, respectively, which indicates an increasingly high global clustered pattern for the grain surplus–shortage per capita from 1985 to 2019.
Then, maps showing the spatial patterns of the grain surplus–shortage (Figure 7a,b) in 1985 and 2019, respectively, were created, revealing the existence of four patterns of high-high, low-low, high-low, and low-high in China.
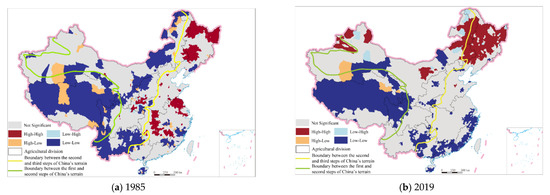
Figure 7.
Spatial patterns of the grain surplus–shortage regions in China in (a) 1985 and (b) 2019.
The high-high pattern represents the core counties and their surrounding counties with relatively high grain output surpluses per capita in a high-land shape model, meaning that the grain output per capita in these counties was much higher than 400 kg, and the spatial differentiation among them was small. In Figure 7a,b, the high-high counties were mostly aggregated in the third steps of China’s terrain in 1985, especially in NECP, and the distribution ranges increased in NASR and NECP until 2019. Moreover, there were discretely distributed high-high counties in HHHP, MLYP, and QHTB, which exhibited a decreasing trend and contained almost no high-high counties until 2019. Furthermore, combined with the high-output clusters, the clusters (Zone I, VII1, VII2, and VII4) were consistent with the distribution of the grain output surplus for per capita in 2019, indicating that the high grain output can ensure the grain supply for per capita in these farming areas in the long term.
The low-low pattern represents the core counties and their surrounding counties with relatively high grain shortages per capita in a low plain shape model, meaning that the grain output per capita in these counties was less than 400 kg, and the spatial differentiation among them was small. The low-low counties were mostly aggregated on the first and second steps of China’s terrain in 1985, and the concentration range decreased on the second step of China’s terrain and increased on the first step of China’s terrain, in the Yangtze River Delta regions and in the southeast coastal areas, by 2019. Combined with the high-output clusters, we conclude that the low-low areas have mainly been concentrated in two locations. The first is in the majority part of QHTB, except for a small area in Huangshui Valley, where there is cold weather and oxygen dilution at high altitudes, which cannot support high grain production and meet the local demand for food. The second is in the southern coastal areas where urbanization has been progressing rapidly, and the population density is much higher than in other areas in China; thus, the grain output cannot meet the local demand of food.
The high-low pattern represents the core counties with surpluses and surrounding counties with shortages of grain outputs per capita in an island shape model, meaning the spatial differentiation among them was large. The high-low counties were mainly aggregated in oasis, basins and valley plains in NASR and QHTB and were distributed around the low-low counties, and they decreased from 1985 to 2019. Compared with the high-output clusters, we can conclude that the high-low areas could be potential farming bases in limited situations.
The low-high pattern represents the core counties with shortages and surrounding counties with surpluses of grain output per capita in a hollow-land shape model, meaning the spatial differentiation among them was large. The low-high counties were mainly aggregated in NECP and NASR and were distributed around the high-high counties, and they decreased from 1985 to 2019. Compared with the high-output clusters, this type of area also cannot be a potential farming base in the future.
3.3.2. Analysis of Each Agricultural Division
Furthermore, we investigated the spatial agglomeration of the grain surplus and shortage regions in each agricultural division from 1985 to 2019 (Figure 8). In NASR, NECP, LP, HHHP, SBSR, and MLYP (Figure 8A–F), the high-high counties were consistent with the core zones of the total grain output, and the low-low counties were aggregated in the regions with a low spatial density of the total grain output. For example, in MLYP, by 2019, the high-high counties were aggregated in northern Anhui and Jiangsu, central Jiangxi, and northern Hubei, which were consistent with the core zones of the total grain output (Zones I, II, and III in Figure 6E). The low-low counties were mostly aggregated in the Yangtze River Delta and Zhejiang where the spatial density of the total grain output was below the medium level. As can be seen from Figure 8G, the high-high counties in YNGZ were aggregated in eastern Guangxi, which had a higher spatial density of the total grain output, and in eastern Yunnan, which had an intermediate density of the total grain output and a small population in 1985. By 2019, the high-high counties were aggregated in Yunnan, which had a higher spatial density of total grain output or a density of the total grain output that was above the medium level, as well as a small population. The low-low counties were mostly located in the regions where the density of the total grain output was below the medium level. Similar to SC (Figure 8H), the high-high counties were aggregated in western Fujian by 2019, which had a density of the total grain output below the medium level and a small population. The high-high counties in QHTB were mainly in southern Tibet (Figure 8I).
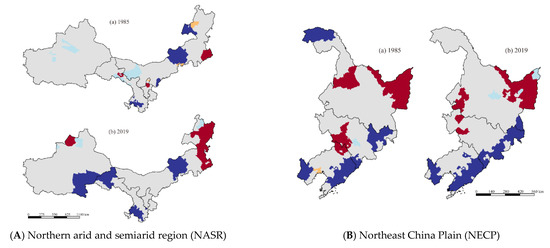
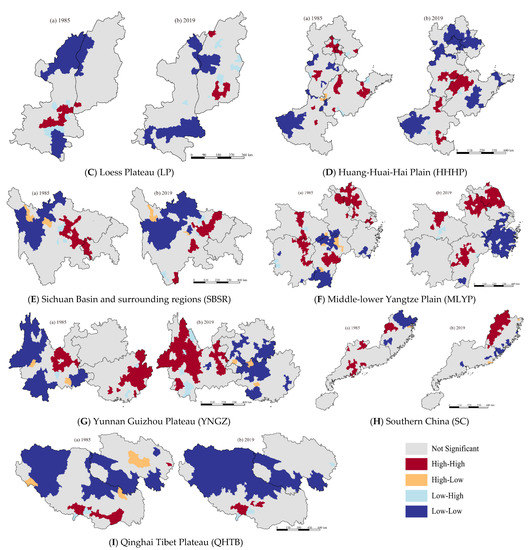
Figure 8.
Spatial patterns of the grain surplus–shortage regions in each agricultural division in 1985 and 2019.
3.4. Identifying Qualified Candidates for Commercial Grain Bases in China
The analysis results presented in Section 3.1, Section 3.2, Section 3.3 are helpful for selecting the candidates for commodity grain bases. Commodity grain bases are defined as relatively fixed farming areas where there is fertile soil and good climatic conditions on a large scale, with high output of grains both by total and per capita, and grain outputs. These grain bases can supply continuously supply grain products to local and surrounding or other regions. However, the names, spatial scopes, and dimensions of the commodity grain bases in China have been dynamically revised since the founding of the Peoples Republic of China (PRC), especially since 1978. The nine well-known national commodity grain bases are mainly distributed in the eastern and central parts of the country. Several farming areas that require irrigation in the northern and northwestern regions, such as those in the Yinchuan Plain in Ningxia and the Hetao Plain in Inner Mongolia, are neglected, while those in the Yangtze Plain and Pearl River Delta have remarkably decreased due to the rapid urbanization in these areas. Furthermore, the names of the commodity grain bases at the county level are much less consistent because no official reports on them have been released. Therefore, we compiled a list of qualified candidate commodity grain bases in China through overlay analysis of the above results at the national and regional levels. The candidates on this list have total grain output densities larger than the medium level, per capita grain outputs greater than 450 kg, and favorable basic farming conditions.
The spatial location of national commodity grain base was vectorized using the descriptive definition and the picture of national commodity grain base [34]. As shown in Figure 9, among the national commodity grain bases, there were significant decreases in the grain production in the Chengdu Plain, the Taihu-lake Plain, and the Pearl River Delta. Furthermore, the counties in the Northeastern China Plain, the Huang-Huai-Hai Plain, central and southern Shanxi, central Shaanxi, the Sichuan Basin, the border between Yunnan and Guizhou, and the Tarbagatay Prefecture in Xinjiang, which account for 67% of China’s total output and had an average per capita grain output of 922 kg in 2019, were selected as the national commodity grain base candidates. Moreover, the counties in NASR (eastern and central Inner Mongolia, central Ningxia, central and western Gansu, and western Xinjiang), QHTB (northeastern Qinghai), and YNGZ (central and western Yunnan) were selected as the regional commodity grain base candidates.
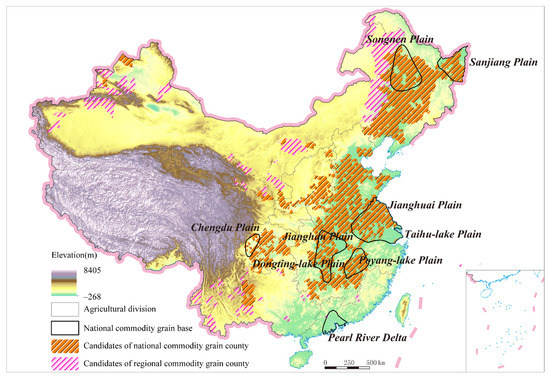
Figure 9.
Candidate counties for national and regional commodity grain county.
4. Discussion
4.1. Qualifying Conditions for China’s Main Grain Producing Areas and Commercial Grain Bases
The qualified candidate list of commercial grain bases presented in Section 3.4 is notably different from the typical list, in which the bases in the drainage areas of the Taihu-lake Plain and the Pearl River Delta have long been the well-known farming regions in China during the last 2000 years. However, they are not included in our candidate list.
The qualifications of grain-producing areas are a combination of multiple conditions, among which the physical features and natural resources are prerequisite and necessary conditions of farming (see Section 3.1), and the social and economic factors are supplementary conditions [24]. Integration of these two types of conditions may constitute sufficient conditions under which adequate grain could be produced to feed a large number of local people, and surplus food, if there is any, can supply surrounding or other regions [33]. The areas in southern China have superior conditions for both farming and urbanization; therefore, the limited cultivated land can only generate enough grain for the local population, and the supply may not even be adequate for all of the residents. Thus, these areas do not qualify as commodity grain bases.
4.2. Potential Trend and Crisis Regarding China’s Grain Production
The qualified candidate list for commodity grain bases shows that the pattern of China’s major grain production is very unbalanced. The commodity grain bases are mainly concentrated in the central, eastern, and northeastern regions of China, as well as a small portion of the northwestern region. The contradiction is that the majority of China’s grain commodity is mainly supplied by areas with relatively poor to moderate conditions, while large areas with excellent farming conditions may not play a vital role in food security. The regions with good basic agricultural conditions are often suitable for human residence and urban development, and the increase in the population and the decrease in land area have been the main contradiction affecting the commercial grain base. Therefore, professional and industrialized production should be further developed in the current commodity grain bases to improve the grain production capacity. For the new commodity grain base counties, the construction of production infrastructure should be strengthened to stabilize the grain production, and the construction of logistic facilities should be increased to improve the rate of grain production.
5. Conclusions
The spatial pattern of the basic farming conditions in China was analyzed, and a set of maps and graphs illustrating this pattern was created. Then, China’s spatial-temporal pattern of grain output and surplus–shortage in the last 30 years was determined. Furthermore, candidates for national and regional commodity grain base counties were selected, and the list is remarkably different from the typical list.
From the perspective of longitude and latitude zonality in China, 15 natural agricultural regions were identified and illustrated based on the interactions between heat, water, and soil types. According to the statistical results, China’s total grain output and output per unit area increased by 103.21% and 122.52% until 2019, respectively, while the sown area decreased by 8.68%. The top three agricultural divisions in terms of the proportion of the total grain output were NASR, NECP, and HHHP, with annual average growth rates of 10.47%, 5.28%, and 3.40%, respectively. SC had the highest rate of decrease (by 8.95%). In addition, based on the kernel density analysis, from 1985 to 2019, the spatial aggregation of the high grain output areas has shifted from central and southern China to central and northern China, where there are favorable farming conditions. The spatial density of the grain output in each agricultural division increased, and the ranges of the core zones expanded, except for SBSR and SC. Furthermore, by 2019, the regions with per capita grain output surpluses were mainly distributed in the high-output zones in NECP and NASR. In addition, the regions with per capita grain output shortages were mainly concentrated in SC, MLYP, and QHTB. The grain output shortage for per capita in SC and MLYP was largely due to decreases in the grain output combined with increases in the population. The regions with per capita grain output surpluses were aggregated in the core zones of the total grain output, and the shortage regions were in the zones with low grain outputs, i.e., in NASR, NECP, LP, HHHP, SBSR, and MLYP. In YNGZ, SC, and QHTB, the surplus regions were in the core zones of the total grain output or with intermediate total grain output densities and small populations. Based on the above three results, several typical commodity grain bases have lost their dominant role (i.e., the Pearl River Delta); furthermore, the qualified commodity grain bases were compiled at both the national and regional level (i.e., the Tarbagatay Prefecture as well as eastern and central Inner Mongolia). Additional research still needs to be conducted, including further exploration and applications. For example, potential commodity grain counties could be identified through evaluation of the grain production potential.
Author Contributions
Conceptualization, Q.Q. and C.L.; methodology, C.L. and Q.Q.; data curation, C.L. and Y.F.; investigation, C.L. and Q.Q.; validation, Q.L. and L.J.; writing—original draft preparation, C.L.; writing—review and editing, Q.Q.; visualization, C.L.; supervision, Q.Q.; project administration, Q.Q. All authors have read and agreed to the published version of the manuscript.
Funding
This research was funded by the Project of National Special Program of Scientific Basic Working, grant number 2013FY112800.
Institutional Review Board Statement
Not applicable.
Informed Consent Statement
Not applicable.
Data Availability Statement
The data presented in this study are available on request from the corresponding author.
Acknowledgments
The authors would like to thank the reviewers and editors for valuable comments and suggestions.
Conflicts of Interest
The authors declare no conflict of interest.
Appendix A
Table A1.
Changes of detailed farming units for the spatial pattern of grain output on each agricultural division from 1985 to 2019.
Table A1.
Changes of detailed farming units for the spatial pattern of grain output on each agricultural division from 1985 to 2019.
| Agricultural Division | Main Farming Areas in 1985 | Main Farming Areas in 2019 | Changes | Overall Characteristics | ||
|---|---|---|---|---|---|---|
| Names | Locations | Names | Locations | |||
| Northeast China Plain | Southwestern Heilongjiang (Zone I) | Plain of Songhuajiang and Nenjiang river | Southwestern Heilongjiang (Zone I) | Plain of Songhuajiang and Nenjiang river | Range expanded and intensity enhanced | The grain output areas mainly developed to the regions in Jilin and Heilongjiang with gentle slope, once-cropping per year, adequate water resource for irrigation, and greatest soil fertility. |
| Middle of Jilin (Zone II) | Plain of Songhuajiang and Nenjiang river | Middle of Jilin (Zone II) | Plain of Songhuajiang and Nenjiang river | Range expanded and intensity enhanced | ||
| Middle of Liaoning (Zone III) | Liaohe Plain | Middle of Liaoning (Zone III) | Liaohe Plain | Range expanded and intensity enhanced | ||
| Northeaster Heilongjiang (Zone IV) | Sanjiang Plain | New area | ||||
| Northern arid and semiarid region | Eastern Inner Mongolia (Zone I1) | Hulunbeir Highland and Tongliao Plain | Eastern Inner Mongolia (Zone I1) | Range stays the same but intensity enhanced | The grain output areas mainly developed to the regions in Xinjiang and Inner Mongolia with gentle slope, once-cropping per year, and adequate water resource for irrigation. | |
| Central Inner Mongolia (Zone I2) | Hetao Plain | Central Inner Mongolia (Zone I2) | Qiantao Plain | Separated into two areas: I2 and I3 | ||
| Western Inner Mongolia (Zone I3) | Houtao Plain | The new area separated from I2 | ||||
| Ningxia (Zone II) | Yinchuan Plain | Ningxia (Zone II) | Yinchuan Plain | Range stays the same but intensity reduced | ||
| Southern Gansu (Zone III1) | Longdong Highland and Longnan Valley | Southern Gansu (Zone III1) | Longdong Highland and Longnan Valley | Range stays the same but intensity reduced | ||
| Western Gansu (Zone III2) | Zhangye and Wuwei Oasis | Western Gansu (Zone III2) | Zhangye and Wuwei Oasis | Range and intensity reduced | ||
| Xinjiang-1 (Zone IV1) | Yili Valley Plain | Xinjiang-1 (Zone IV1) | Yili Valley Plain, southern Junggar Oasis Plain | Range expanded and intensity enhanced, new area | ||
| Xinjiang-2 (Zone IV2) | Kashi Oasis Plain | Xinjiang-2 (Zone IV2) | Kashi Oasis Plain | Range expanded but intensity reduced | ||
| Xinjiang-3 (Zone IV3) | Tacheng Valley Plain | New area | ||||
| Huang-Huai-Hai Plain | The border area among Beijing, Hebei and Tianjin (Zone I) | Haihe Plain | The border area among Beijing, Hebei and Tianjin (Zone I) | Vanished | The grain output areas mainly developed to the regions in Shandong and Henan with gentle slope, triple-cropping two years or double-cropping per year, and adequate water. | |
| The middle of Hebei (Zone II) | Haihe Plain | The middle of Hebei (Zone II) | Haihe Plain | Range stays the same, but intensity decreased | ||
| Northeastern Henan (Zone III1) | Huanghe Plain | Northeastern Henan (Zone III1) | Huanghe Plain | Range expanded and intensity enhanced, almost merged with III1–IV1 | ||
| Southeastern Henan (Zone III2) | Huaihe Plain | Southeastern and Southwestern Henan (Zone III2, III3) | Huaihe Plain and Nanyang Basin | Range expanded and intensity enhanced largely | ||
| Northeastern Shandong (Zone IV2) | Shandong Peninsula Hills | Northeastern Shandong (Zone IV2) | Shandong Peninsula hills | Range decreased and intensity increased | ||
| Southwestern Shandong (Zone IV1) | Huaihe Plain | Northeastern Henan (Zone III1) | Huaihe Plain | Almost merged with III1–IV1. | ||
| Loess Plateau | Central Shanxi (Zone I1) | Taiyuan Basin | Central Shanxi (Zone I1) | Taiyuan Basin | Range and intensity expanded | The grain output areas mainly developed to the regions in Shanxi with gentle slope, triple-cropping two years or double-cropping per year, adequate water resource for irrigation, and greater soil fertility. |
| Southeastern Shanxi (Zone I2) | Changzhi Basin | Southeastern Shanxi (Zone I2) | Changzhi Basin | Range and intensity expanded | ||
| Southwestern Shanxi (Zone I3) | Fenhe-Huanghe Valley | Southwestern Shanxi (Zone I3) | Fenhe-Huanghe Valley | Range and intensity expanded | ||
| Central Shaanxi (Zone II1) | Guanzhong Basin | Central Shaanxi (Zone II1) | Guanzhong Basin | Range and intensity decreased | ||
| Southern Shaanxi (Zone II2 and II3) | Hanjiang Valley | Vanished | ||||
| Northeastern Shanxi (Zone I4) | Datong and Yizhou Basin | New area | ||||
| Northwestern Shaanxi (Zone II4) | - | New area | ||||
| Middle-lower Yangtze Plain | Jiangsu, Shanghai and the northern Zhejiang (Zone I) | Huang-Huai Plain and Yangtze River Delta | Jiangsu, Shanghai and the northern Zhejiang (Zone I) | Huang-Huai Plain and Yangtze River Delta | Range expanded and intensity enhanced in the northern areas, and reduced in the southern areas. | The grain output areas mainly developed to the regions in Jiangsu and Anhui with gentle slope, triple-cropping two years or double-cropping per year, and greater soil fertility. |
| Northern Jiangxi (Zone II) | Poyang-lake Plain | Northern Jiangxi (Zone II) | Poyang-lake Plain | Range and intensity decreased | ||
| Northern Hubei (Zone III1) | Jianghan Plain | Northern Hubei (Zone III1) | Jianghan Plain | Range and intensity decreased | ||
| Southern Hubei and northern Hunan (Zone III2) | Dongting-lake Plain | Southern Hubei and northern Hunan (Zone III2) | Dongting-lake Plain | Range and intensity decreased | ||
| Middle of Hunan (Zone III3) | Hunan Hills | Middle of Hunan (Zone III3) | Hunan Hills | Range and intensity decreased | ||
| Sichuan Basin and surrounding regions | Sichuan-1 (Zone I1) | Chengdu Plain | Sichuan-1 (Zone I1) | Chengdu Plain | Range and intensity decreased | The grain output areas keep stable in the long terms, with superior thermal and moisture conditions and double-cropping or triple-cropping per year, and there are abundant water re-sources for irrigation. |
| Sichuan-2 (Zone I2) | Central Sichuan Hilly Basin | Sichuan-2 (Zone I2) | Central Sichuan Hilly Basin | Range and intensity decreased | ||
| Chongqing (Zone II) | Ridge and Valley Province of Chuandong | Chongqing (Zone II) | Ridge and Valley Province of Chuandong | Range increased and intensity decreased | ||
| Southern China | Eastern coastal area 1 of Fujian (Zone I1) | Fuzhou Plain | Eastern coastal area 1 of Fujian (Zone I1) | Vanished | The grain output areas mainly developed to the regions in Guangdong and Hainan with gentle slope, double-cropping per year, and triple-cropping per year. | |
| Eastern coastal area 2 of Fujian (Zone I2) | Quanzhou Plain | Eastern coastal area 2 of Fujian (Zone I2) | Vanished | |||
| Eastern Guangdong Coastal Area (Zone II1) | Chaozhou-Shantou Plain | Eastern Pearl River Delta of Guangdong (Zone II1) | Chaozhou-Shantou Plain | Range stays the same, but intensity enhanced | ||
| Pearl River Delta (Zone II2) | Pearl River Delta | Middle Pearl River Delta of Guangdong (Zone II2) | Pearl River Delta | Range and intensity decreased | ||
| Western Guangdong Coastal Area (Zone II3) | Zhanjiang Plain | Western Pearl River Delta of Guangdong (Zone II3) | Zhanjiang Plain | Range expanded and intensity enhanced | ||
| Northeastern Hainan (Zone III) | Northeastern Hainan Plain | New area | ||||
| Yunnan Guizhou Plateau | Guangxi-1 (Zone I1) | Guilin Valley Plain | Guangxi-1 (Zone I1) | Guilin Valley Plain | Intensity enhanced | The grain output areas mainly developed to the regions in Yunnan and Guizhou with gentle slope. |
| Guangxi-2 (Zone I2) | Wuzhou Valley Plain | Guangxi-2 (Zone I2) | Wuzhou Valley Plain | Keep the same | ||
| Guangxi-3 (Zone I3) | Nanning-hepu Valley | Guangxi-3 (Zone I3) | Nanning-hepu Valley | Keep the same | ||
| Guangxi-4 (Zone I4) | Yulin-hepu Valley | Guangxi-4 (Zone I4) | Yulin-hepu Valley | Range expanded and intensity enhanced | ||
| Guizhou (Zone II1, II2) | Zunyi Basin | Guizhou (area Zone II1, II2) | Zunyi Basin | Range expanded several times and intensity increased | ||
| Yunnan-1 (Zone III1) | Qujin Valley | Yunnan-1 (Zone III1) | Northeastern Yunnan Area | Range expanded dozens of times, and intensity enhanced much more | ||
| Yunnan-2 (Zone III2) | Tengchong highland Valley | New area | ||||
| Qinghai Tibet Plateau | Qinghai (Zone I1) | Huangshui Valley | Qinghai (Zone I1) | Huangshui Valley | Range and intensity reduced | The areas reduced, meaning that this region is not suitable for farming. |
| Qinghai (Zone I2) | - | New area | ||||
| Tibet (Zone II) | Southern Tibet Valley | Tibet (Zone II) | Southern Tibet Valley | Range and intensity reduced | ||
References
- The State Council Information Office of the People’s Republic of China. Available online: http://www.scio.gov.cn/zfbps/32832/Document/1666192/1666192.htm (accessed on 14 October 2019).
- Brown, L. Who will feed China? Futurist 1994, 30, 14–18. [Google Scholar]
- Chang, C.; Lee, H.; Hsu, S. Food security: Global trends and regional perspective with reference to east Asia. Pac. Rev. 2013, 26, 589–613. [Google Scholar] [CrossRef]
- Duggan, N.; Naarajärvi, T. China in global food security governance. J. Contemp. China 2015, 24, 1–18. [Google Scholar] [CrossRef]
- Lu, Q.; Lu, M. Trends and basic causes of the regional pattern changes in China’s grain production since 1950’s. Prog. Geogr. 1997, 16, 31–36. [Google Scholar]
- Liu, Y.; Wang, G.; Gao, B.; Zhou, Y. Spatio-temporal analysis of grain production at different levels in China-based on statistical data from 1998 to 2010. Res. Agric. Mod. 2012, 33, 673–677. [Google Scholar]
- Cheng, Y.; Zhang, P. Regional patterns changes of Chinese grain production and response of commodity grain base in northeast China. Sci. Geogr. Sin. 2005, 25, 513–520. [Google Scholar]
- Deng, Z.; Feng, Y.; Zhang, J.; Wang, J. Analysis on the characteristics and tendency of grain production’s spatial distribution in China. Econ. Geogr. 2013, 33, 117–123. [Google Scholar]
- Yin, P.; Fang, X.; Tian, Q.; Ma, Y. Distribution and regional difference of main output regions in grain production in China in the early 21st century. Geogr. Sin. 2006, 61, 190–198. [Google Scholar]
- Wang, J.; Liu, Y. The Changes of grain output center of gravity and its driving forces in China since 1990. Resour. Sci. 2009, 31, 1188–1194. [Google Scholar]
- Xin, L.; Li, X.; Tan, M. Changes of comparative advantages of regional grain production in China. Trans. CSAE 2009, 25, 222–227. [Google Scholar]
- Ding, J.; Yang, K.; Ma, C.; Wen, Q. Spatial-temporal evolution of grain production in China. Arid Land Geogr. 2017, 40, 1290–1297. [Google Scholar]
- Yin, P.; Fang, X.; Ma, Y.; Tian, Q. New regional pattern of grain supply-demand in China in the early 21st Century. J. Nat. Resour. 2006, 21, 625–631. [Google Scholar]
- Heilig, G.K.; Fischer, G.; Van, V.H. Can China feed itself? an analysis of China’s food prospects with special reference to water resources. Int. J. Sustain. Dev. World Ecol. 2000, 7, 153–172. [Google Scholar] [CrossRef]
- Xie, G.; Cheng, S.; Xiao, Y.; Lu, C.; Liu, X.; Xu, J. The balance between grain supply and demand and the reconstruction of China’s food security strategy in the new period. J. Nat. Resour. 2017, 32, 895–903. [Google Scholar]
- Veeck, G. Delineating historical and contemporary agricultural production regions for China. Int. J. Cartogr. 2021, 1–26. [Google Scholar] [CrossRef]
- Wang, S.; Bai, X.; Zhang, X. Urbanization can benefit agricultural production with large-scale farming in China. Nat. Food 2021, 2, 183–191. [Google Scholar] [CrossRef]
- Gandhi, V.P.; Zhou, Z.Y. Food demand and the food security challenge with rapid economic growth in the emerging economies of India and China. Food Res. Int. 2014, 63, 108–124. [Google Scholar] [CrossRef]
- Liu, L.; Xu, X.; Liu, J.; Chen, X.; Ning, J. Impact of farmland changes on production potential in China during recent two decades. Geogr. Sin. 2014, 69, 1767–1778. [Google Scholar]
- Liu, Y.; Wang, D.; Gao, J.; Deng, W. Land Use/Cover Changes, the Environment and Water Resources in Northeast China. Environ. Manag. 2005, 36, 691–701. [Google Scholar] [CrossRef]
- Liu, Y.; Wang, J.; Guo, L. The spatial-temporal changes of grain production and arable land in China. Sci. Agric. Sin. 2009, 42, 4269–4274. [Google Scholar]
- Zhang, L.; Zhu, D.; Xie, B.; Du, T.; Wang, X. Spatiotemporal pattern evolvement and driving factors of cultivated land utilization efficiency of the major grain producing area in China. Resour. Sci. 2017, 39, 608–619. [Google Scholar]
- Li, Y.; Ma, W.; Jiang, G.; Li, G.; Zhou, D. The degree of cultivated land abandonment and its influence on grain yield in main grain producing areas of China. J. Nat. Resour. 2021, 36, 1439–1454. [Google Scholar] [CrossRef]
- Zhang, T. Grain Security and Agricultural Structure Adjustment; Chinese Agriculture Press: Beijing, China, 2019. [Google Scholar]
- Liu, Z.; Zhong, H.; Li, Y.; Wen, Q.; Liu, X.; Jian, Y. Change in grain production in China and its impacts on spatial supply and demand distributions in recent two decades. J. Nat. Resour. 2021, 36, 1413–1425. [Google Scholar] [CrossRef]
- Ni, K.; He, A. Analysis on the situation of grain supply and demand in China. World Agric. 2021, 2, 10–18. [Google Scholar]
- Yin, P.; Fang, X.; Ma, Y.; Tian, Q. Distribution and regional difference of food shortage in China in 21st century. Sci. Geogr. Sin. 2007, 27, 463–472. [Google Scholar]
- Pan, J.; Zhang, J. Spatial-Temporal Pattern and its driving forces of per capital grain output in China. Resour. Environ. Yangtze Basin 2017, 26, 410–418. [Google Scholar]
- Hu, T.; Ju, Z.; Zhou, W. Regional pattern of grain supply and demand in China. Geogr. Sin. 2019, 71, 1372–1383. [Google Scholar]
- Liu, Y.; Ma, C.; Su, Z. Visual art design of atlas of Shenzhen based on users’ cognition. J. Geom. 2021, 46, 143–147. [Google Scholar]
- Qi, Q.; Jiang, L.; Zhang, A.; Chen, Y.; Peng, X.; Zou, X.P. Methodology of Geographic Information Science; Science Press: Beijing, China, 2016. [Google Scholar]
- Wang, L.; Liu, A.; Xin, L. Research on Strategy of China’s Grain Security and Cultivated Land Safeguard; Chinese Agriculture Press: Beijing, China, 2019. [Google Scholar]
- China Food Economics Society. China’s Grain Reform and Open in Recent 40 Years; Economic Management Press: Beijing, China, 2019. [Google Scholar]
- Jiang, P. Change in the pattern of grain production. Beijing Plan. Rev. 2020, 3, 165–170. [Google Scholar]


Publisher’s Note: MDPI stays neutral with regard to jurisdictional claims in published maps and institutional affiliations. |
© 2022 by the authors. Licensee MDPI, Basel, Switzerland. This article is an open access article distributed under the terms and conditions of the Creative Commons Attribution (CC BY) license (https://creativecommons.org/licenses/by/4.0/).