1. Introduction
The international migration is global in nature, given that all countries are affected by this phenomenon—either as countries of origin, transit or destination. This phenomenon generates many positive and negative economic, demographic and political effects.
Considering that the forecasts regarding the reduction of the total population, especially of the active one in Romania, are pessimistic, and that the migration process has a special importance for the national economy [
1], this phenomenon overlaps with the accelerated aging of the population [
2].
Regarding the international migration after the 1990s as a result of the collapse of the communist regime and the opening of the country’s borders, Romania faced a migratory process only to the West, mainly to the EU. Much of the migration process [
3] arose from people’s desire to have better paid jobs compared to the local ones, but also for family reunification.
The migration phenomenon has economic effects both for the economy of the countries of origin and for the destination countries. In view of the above, it is important to see what impact the COVID-19 pandemic had on the evolution of migration from Romania and how it was reflected upon the economic growth and living standards.
From the perspective of Romania’s national economy, migration has a series of positive and negative effects. On the one hand, migration leads to an increase in foreign currency remittances to family members in the country, which leads to an increase in income and living standards at the individual level and at a macroeconomic level. This leads to an increase in consumption, to a reduction in social benefits for low-income people, to the reduction of the unemployment rate as a result of the migration of the unemployed and to the increase of the foreign exchange reserves. On the other hand, at the macroeconomic level, migration has a series of negative effects, leading to an exacerbation of the lack of specialists in certain sectors of activity that were already deficient, but also to a change in the structure of the employed population, resulting in increased aging. At the level of individuals, migration has many negative effects because it leads to the breakup of families and the appearance of a whole generation of children who are raised without parents, go to work abroad and suffer psychological traumas that cannot be fully quantified. Only when these children become adults it will be possible to see the implications of the fact that they grew up without the support of their parents, which will make its mark on their adult life. Moreover, as a result of migration, many villages and communes in Romania become almost deserted, with implications for the local education system, because many schools have closed due to a lack of children and young people in those communities, and only the elderly remain, unfortunately without financial and family support. An increasingly worrying phenomenon is the emigration of very intelligent young people for university studies abroad and who in a very small proportion still return to the country due to cultural and socio-economic differences, value appreciation, but also professional opportunities.
Therefore, from the perspective of central and local authorities, identifying a possible migration trend is particularly important in implementing a strategic plan aimed at a series of specific strategies in order to encourage specialists in certain sectors to remain in the country or return from abroad. In addition, the possibility to estimate the migration flow is particularly useful for anticipating the necessary labor force in certain fields of activity and establishing updates of the legislation in the field and the quotas of immigrant workers.
This research has both a theoretical applicability, by establishing a forecast model applicable to the migration phenomenon in Romania, and a practical one, reducing the possibility to anticipate its values and thus offering the possibility to governmental bodies to establish the necessary measures to counteract the negative effects of migration on the national economy.
2. Conceptualization of the Migration Phenomenon
2.1. Genesis and Evolution of the Concept
Migration processes have been known since antiquity, when people were forced to leave their country due to religious persecution, ethnic conflicts, wars or natural disasters. Over time, migration has evolved. In addition to the previous causes, people left their home country in search for a better paid job or more decent living conditions [
4]. So, in the past, population migration was determined by non-economic causes, while current migration is mostly due to economic reasons [
5].
The first references to the migratory phenomenon, in an incipient form, appear in the work of A. Smith “An Inquiry into the Nature and Causes of the Wealth of Nations” (1776), which shows that there was a large wage gap between rural and urban areas in Great Britain at that time, leading to the onset of a large population movement.
The term “migration” first appeared in E. Ravenstein’s “Laws of Migration” (1885), which analyzes data from the United Kingdom, but formulates a series of “laws of migration” that were later developed. According to this author, migration was mainly determined by external opportunities, and the volume of migration is inversely proportional to the distance. Furthermore, a characteristic of migration is that it is not continuous, but occurs in waves [
6].
The notion of migrant has its origin in Latin:
migrantis, and refers to a person who moves from place to place [
5]. Thus, migration means, in a broad sense [
7], “any form of territorial mobility of the population regardless of purpose, duration, regularity”, and in a narrow sense “a movement of people from one locality to another”.
Migration occurs for various reasons, such as: finding a better paid job or greater satisfaction, studying abroad, doing business, but also to achieve family reunification [
8]. Migration gives rise to a series of negative reactions [
9], such as racism, xenophobia, discrimination, segregation, poverty and human trafficking, but also to a series of positive elements, such as those related to cooperation, diversity, tolerance, growth and mobility.
At the end of the 20th century–beginning of the 21st century, migration intensified as a result of a series of factors, such as globalization and the evolution of the means of transport and communication [
10].
The 21st century is bringing a new wave of migrants to Western Europe. It has become the responsibility of the entire European Union [
11,
12] to find viable solutions, because the exodus from the Mediterranean basin is not just a problem for the countries in the region. As is well known, there are different reasons for migration: wars, conflicts, poverty, discrimination, violence and persecution, family, climate change and much more. Migrants from the East, North and Central Africa have changed their route to Western Europe, many of them no longer crossing the unsafe waters of the Mediterranean [
13] but heading to Belarus, being attracted by opportunities to travel with a tourist visa to this country. Belarus is estimated to host between 5000 and 20,000 migrants and refugees from the Middle East and Africa. This new migration route has created tensions on the Belarusian border with other European states. However, it seems that this migration crisis in Belarus was artificially created by Minsk in response to the sanctions imposed by European states regarding the repression of a movement to challenge the political regime in that country in 2020. For now, the refugee crisis in the border between Belarus and Poland is solved because many of the immigrants agreed to go back to their countries, after the experience of living in the forests of Belarus in unfavorable weather conditions and without food, as some of them consumed all their savings in an attempt to reach the EU.
There is also a significant influx of migrants to the UK trying to enter France illegally, which has given rise to numerous tensions between the two states. This route is part of the map of illegal migration, and every day hundreds of immigrants try to cross the English Channel, in Calais, in makeshift boats, risking their lives and often losing them. According to statistics published by the British state, it seems that over 12,500 immigrants crossed the English Channel in 2021.
Therefore, international migration should be better regulated and enforced, as well as the dismantling of illegal migrant trafficking networks, as it must be guaranteed that, by virtue of the respect for the right to immigrate, the fundamental right of citizens is not violated. It should also be borne in mind that in a few decades Europe’s religious structure may change as a result of waves of immigrants from outside Europe, and that the cultural and European values will not be affected.
2.2. Types of Migration
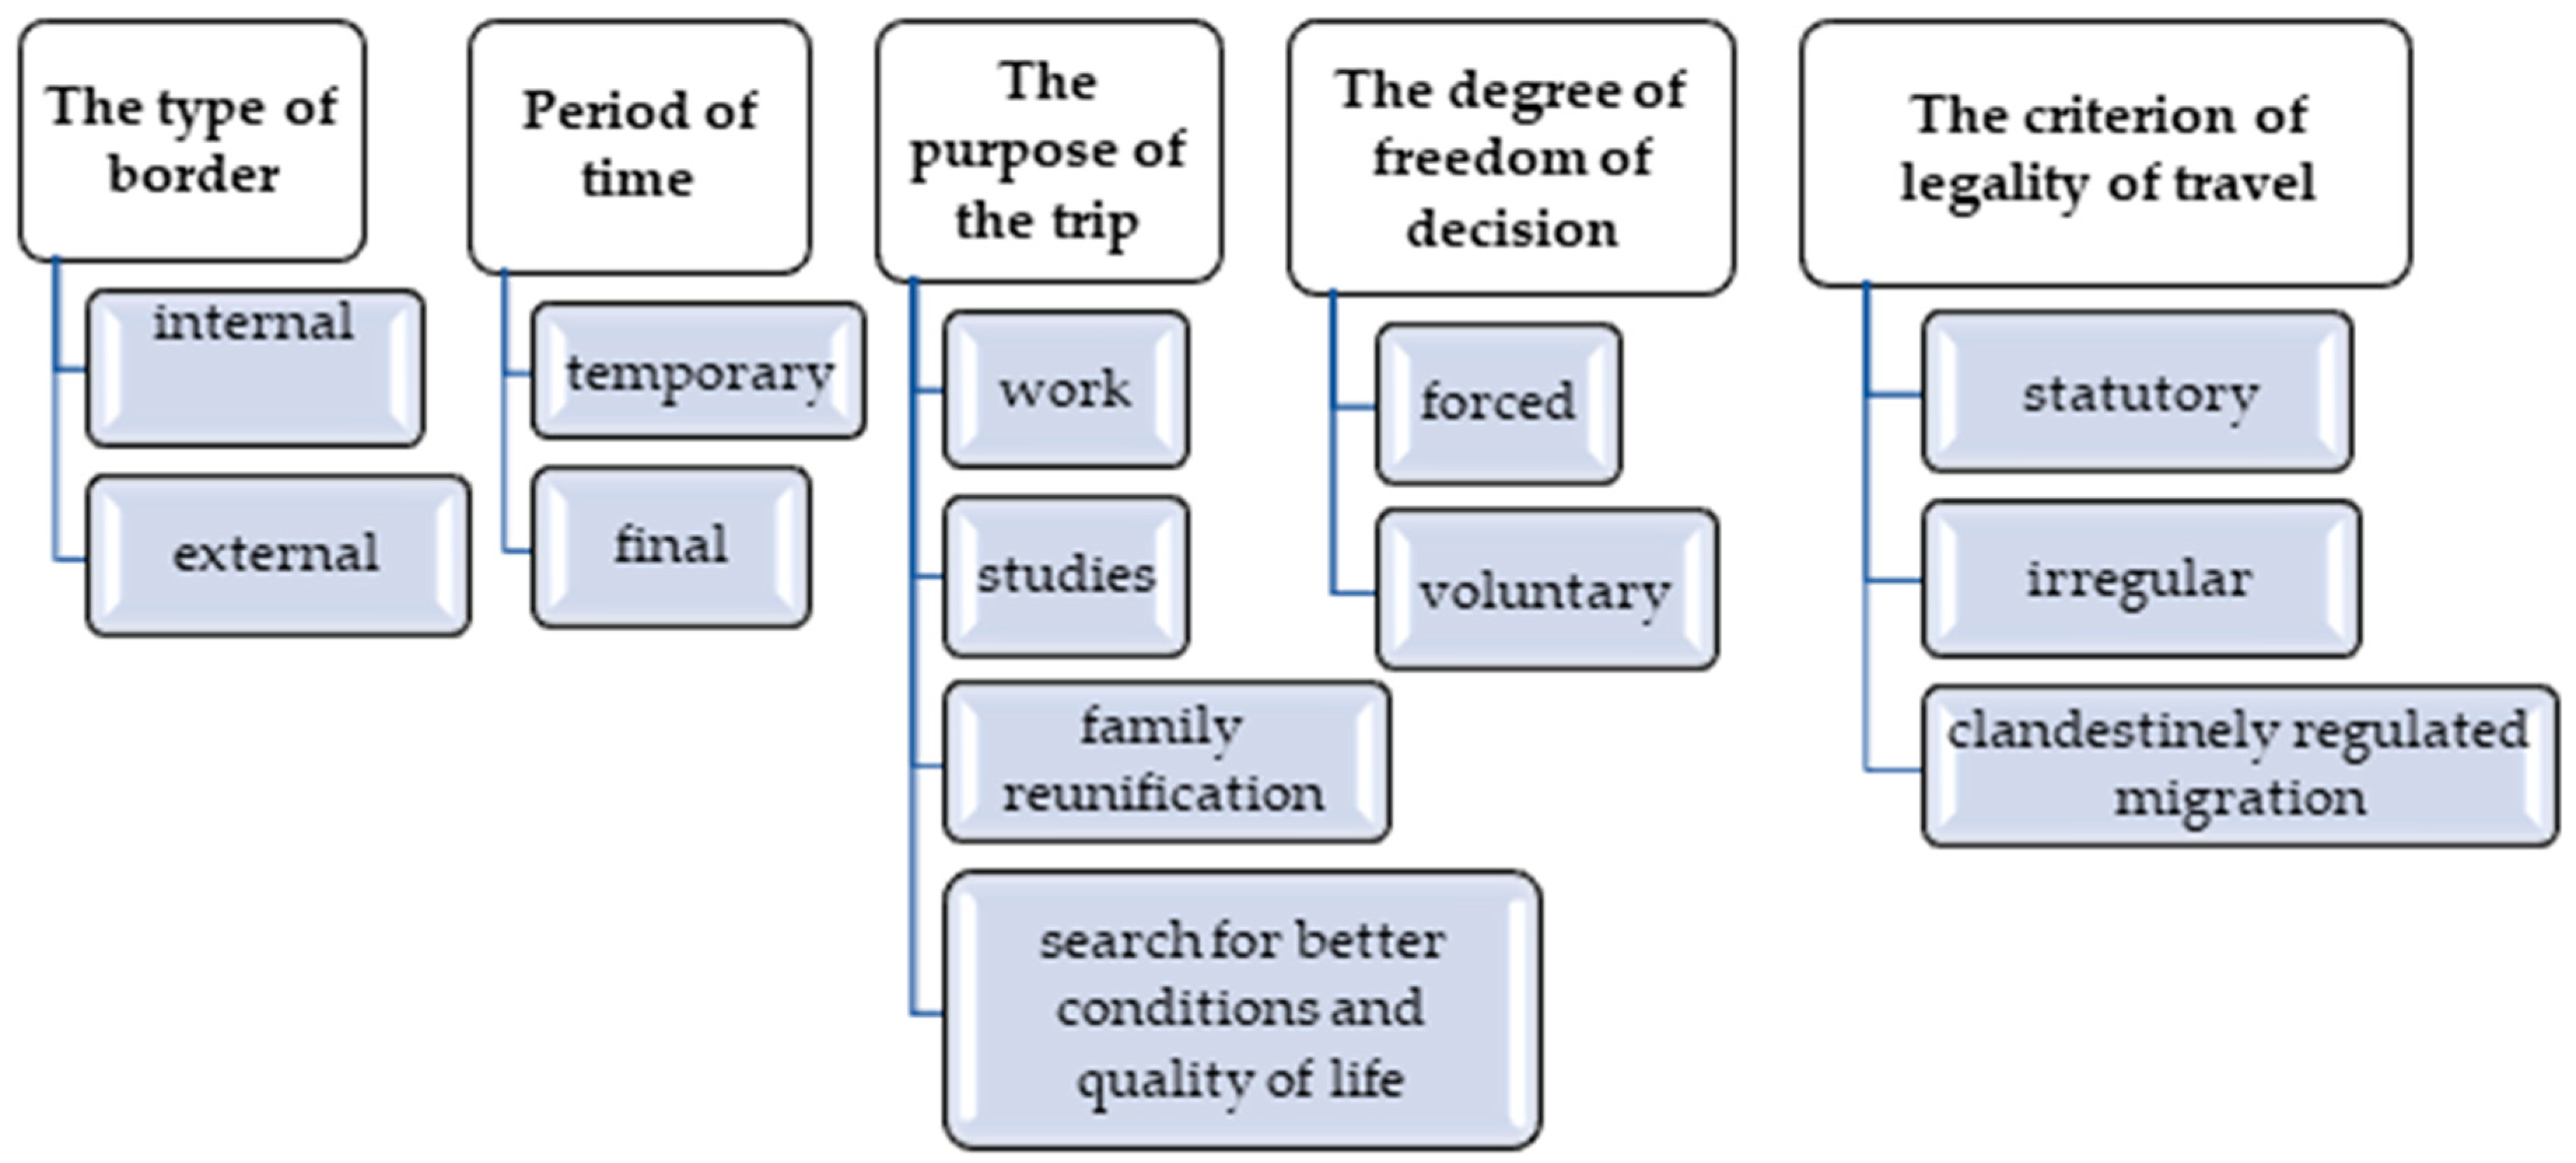
Migration can be classified according to several criteria, depending on the influencing factors [
14,
15,
16], as follows: according to the type of border that migrants cross, the period of time, the purpose of the trip, the degree of freedom of the decision to migrate, the legality of the trip [
17,
18]. This mode of classification is illustrated in
Figure 1.
3. Literature Review
According to the scientific approaches of studies on population migration, both the economic causes of migration and the migration policy of states are addressed and analyzed [
19,
20].
The migration policy [
21] of a state must primarily aim at solving the social, political, legal and financial problems generated by migration processes [
22], as well as regulating migration processes and counteracting illegal migration [
23]. Migration policy [
24] is “a component of the national long-term development strategy, based on the principle of a complex approach to regulating a wide range of relations that would ensure the dynamic development of both workforce recipient and donor countries [
25].”
An important aspect of migration policy [
26] is that it refers to taking the necessary measures so that part of the diaspora [
27] returns home at some point, but also to ensure its integration. The return of the diaspora represents for the country a gain both in terms of workforce and in terms of the fact that they return with more knowledge and a certain civic spirit—enabling the sustainable development of a country like Romania [
28], which faces a massive migration of the active labor force and an acute shortage of skilled workers in certain fields, such as constructions, HORECA, installations, etc. Another aspect of migration policy is the migrants’ integration into society and active life [
29].
The economic approach of population migration research allows for a reflection on this complex phenomenon, the determination of common laws, as well as specific features and the development of regulatory and management measures [
30]. Determining the legitimacy of migration processes, during the last two centuries has been the subject of research by representatives of various economic schools [
31].
Labor mobility is thus determined by the characteristics of contemporary industry, and this mobility, which involves a change of occupation, profession and field of activity obviously does not take place without territorial movements, i.e., population migration [
32]. The economic factors that cause the mobility of the population are conditioned by the need [
33] for the movement of capital, the production process and the forces of production. The mobility of capital from one branch to another, from one region to another, determines the mobility of the active population [
34].
The new economic theory of migration is based on the idea that the decision on migration is taken collectively [
35]. Unlike neoclassical economic theory, which examines the individual as a generator of the migration decision, in the new economic theory of migration the family appears at the center of the decision-making process on migration. Compared to neoclassical economic theory, which presented the difference in the level of wages between countries as the main stimulus in starting migration, the founders of this theory claim that there are much stronger reasons [
36]. Among them, they highlight the minimization of the risks regarding the obtaining of incomes related to the insufficient development of the labor market, of the credit market and of the insurance market in the country of origin. This theory also claims that families send their members to work abroad in order to increase their income in absolute value, but also in comparison with other families. Representatives of the new economic theory of migration say that migrants aim at protecting the family from possible losses of income or property [
37].
Summarizing, we can say, based on the analysis of the theories discussed above [
38], that the specialists who centered on the economic approach in the study of migration focus on various factors, often contradictory, which is explained by the fact that migration is a multidimensional phenomenon.
The sociological approach investigates the problems of the reciprocal relationship of migration and the socio-economic situation in donor and recipient countries [
39]. Within this approach, the “push and pull” theory and the theory of migration networks are of particular interest, in which the problems related to the adaptation of migrants to the new socio-cultural and ethnic environment are researched [
22].
The demographic approach has an essential role in the analysis of migration processes [
40]. Within this approach, the importance of the sustainable effects of population growth is highlighted, as well as the role of population quality as a determining factor of socio-economic development [
41]. Under the current conditions, there has been a massive increase in the population, of which 80% live in developing countries. Recently, there has been a decline in indicators of population reproduction and demographic aging in European countries. This is one of the factors in labor migration, especially from developing countries in a demographic crisis [
22].
Currently, migration is a phenomenon that is taking on more and more forms and produces various effects with a strong impact on society [
42]. Factors that lead to the intensification and diversification of the migratory phenomenon became increasingly varied, being determined by the political, social, economic and technological changes that occurred in the last decades around the world. Therefore, a more efficient management of migration, aiming at increasing its positive impact and mitigating its negative effects, requires highlighting the factors that generate the intensification of the migratory phenomenon [
43].
The analysis of the factors that determine the migratory processes highlighted the importance of the “push” and “pull” factors [
44].
The concepts that explain the multiple aspects related to the migratory phenomenon are based on the push and pull theory initiated by the English scientist Ernst Ravenstein [
45]—German geographer, considered the father of migration theories and the first theorist of migration, because he stated the first laws of migration—and his theory was developed in the 1960s by Everett Lee [
46].
Push factors are mainly related to the country of origin and motivate people to migrate [
47]. This presumes the existence of situations that people want to get rid of: low standard of living, poverty, lack of employment, the spread of economic crises, natural disasters, political crises, social conflicts, overpopulation, terrorism or war, etc. [
48].
Pull factors are mainly related to the destination country and designate the situations that attract people to settle in a new place [
46]. They represent those reasons for migration that migrants consider desirable: higher standard of living, higher wages, personal safety, etc.
Both “push” and “pull” factors are motivated by people’s hope that by migrating to the destination countries, they will live better [
49,
50].
4. Materials and Methods
4.1. Study Description and Data Set
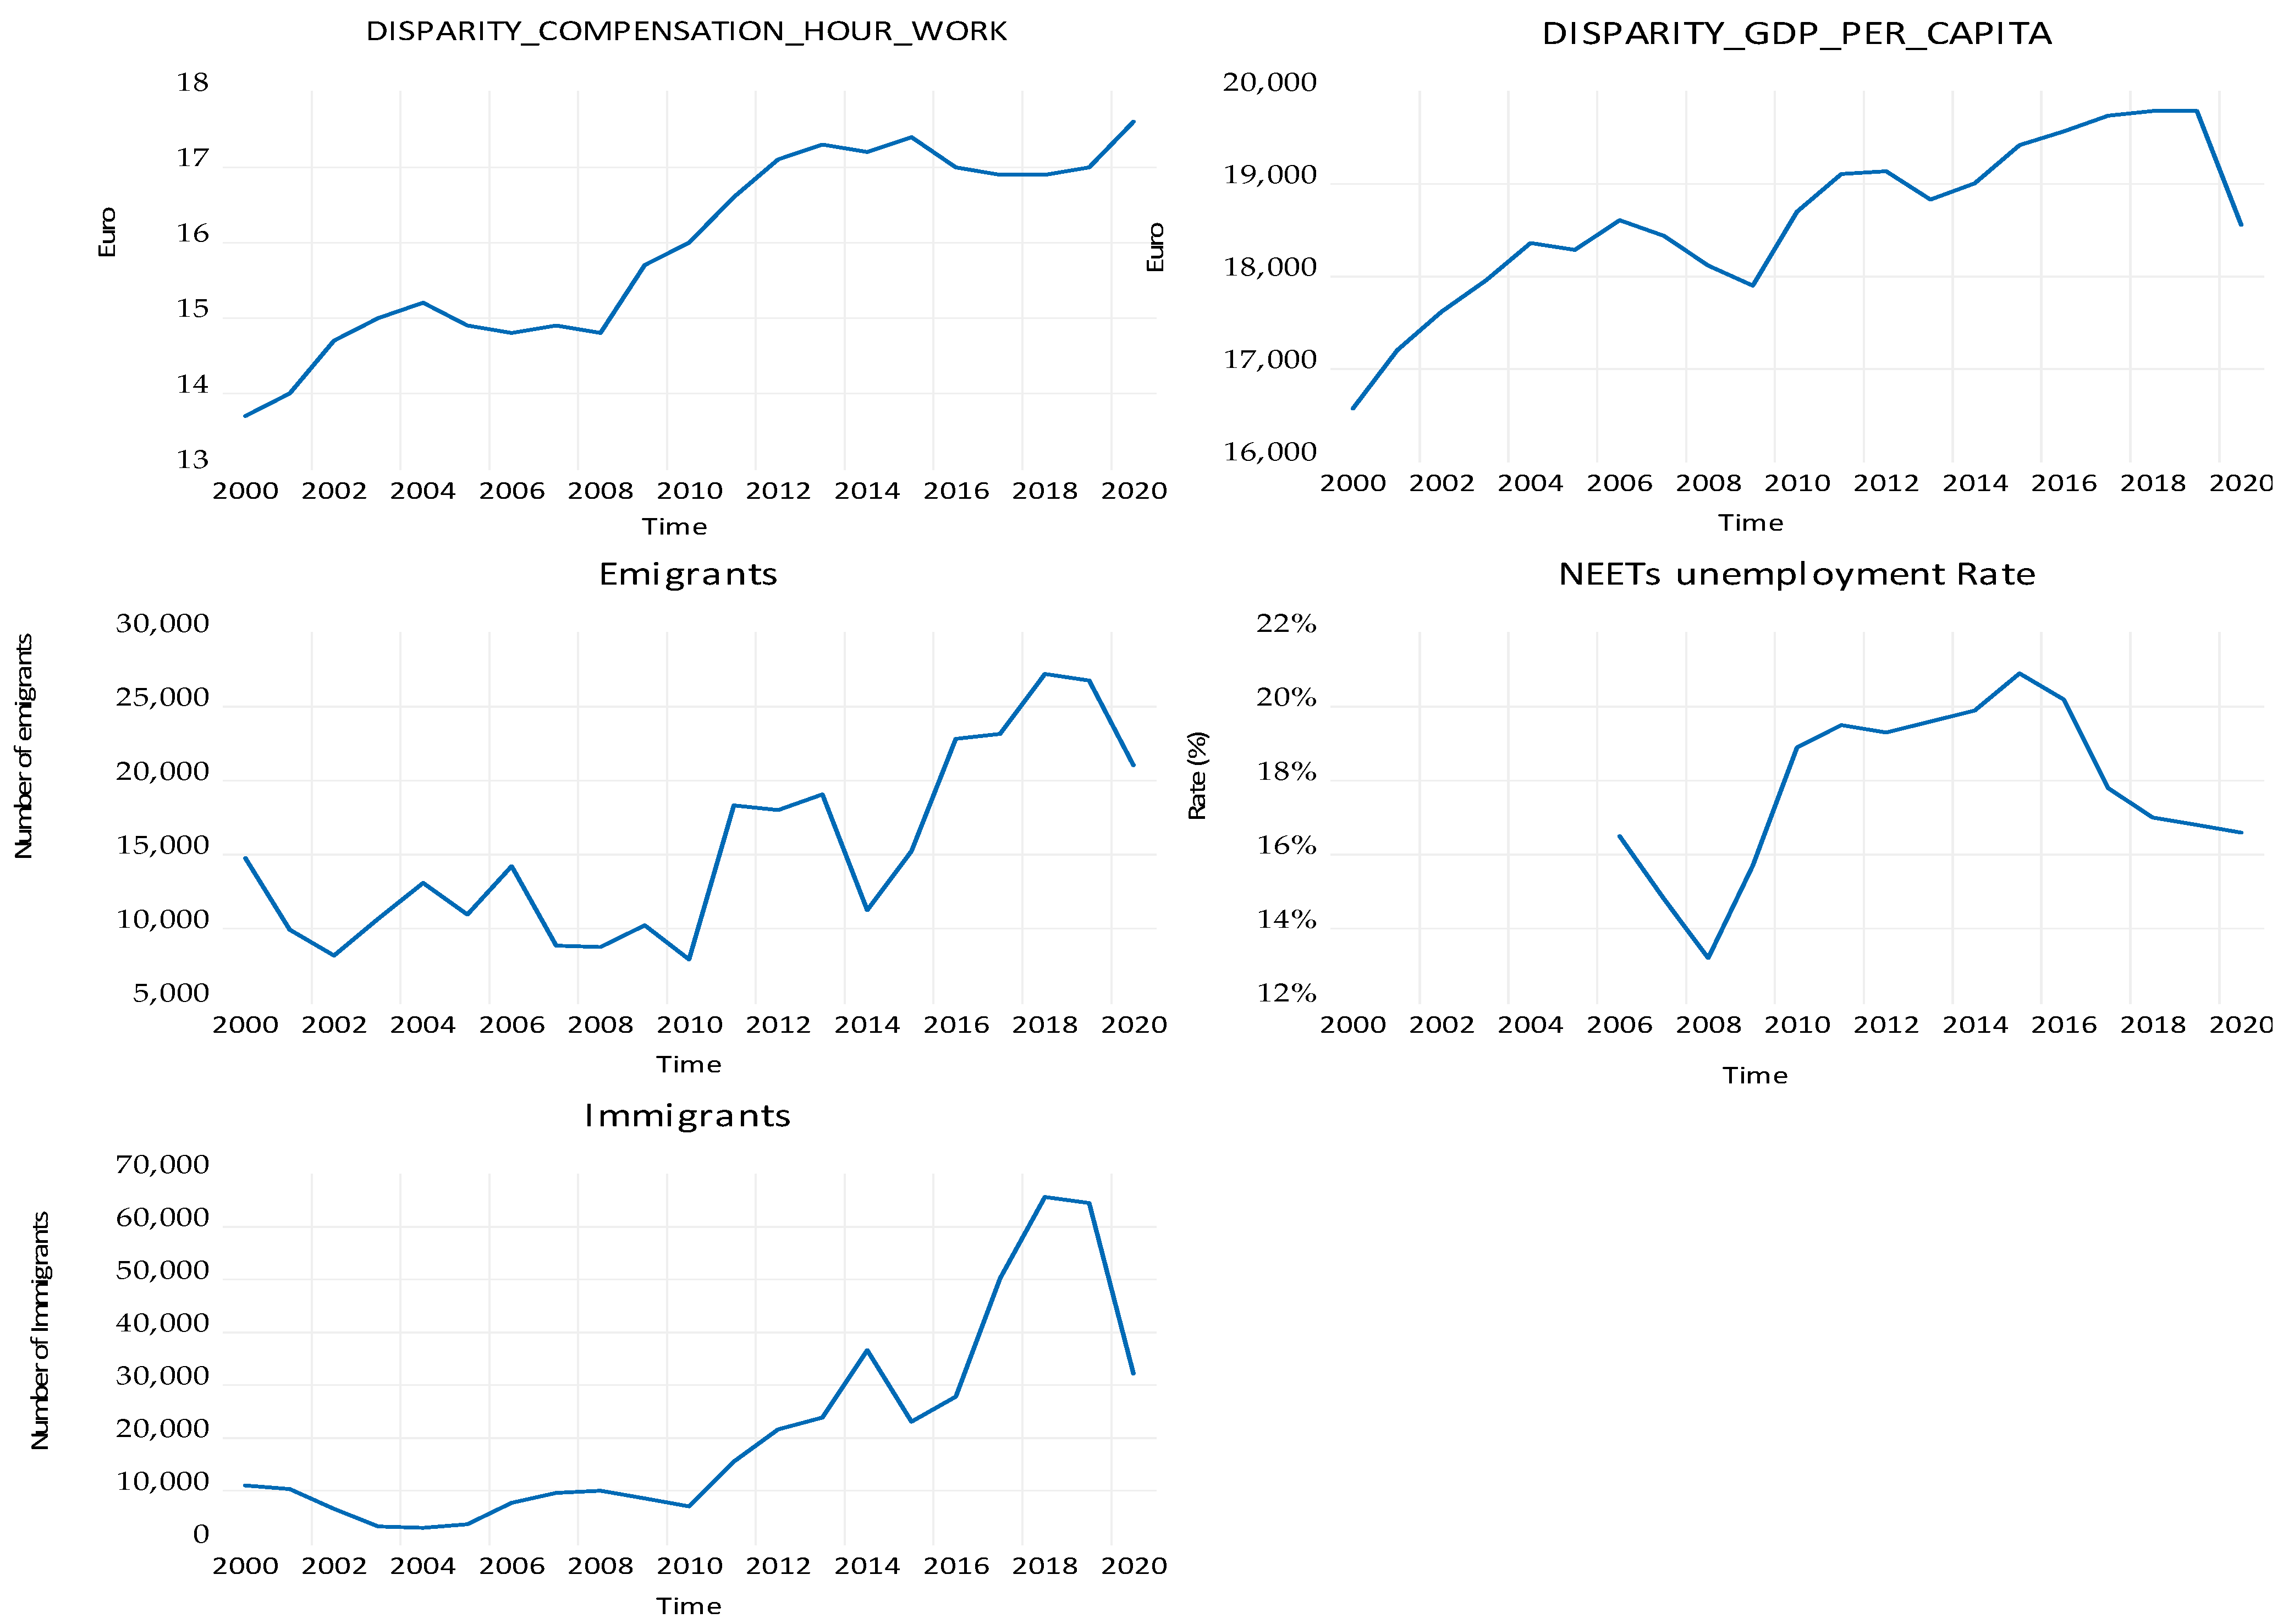
This study considers annual data of emigrants and immigrants, GDP per capita in the EU, GDP per capita in Romania, compensation per hour work in the EU and in Romania, NEETs unemployment rate in Romania, rate risk of poverty in Romania and regional disparities in unemployment rates for regression and VAR analyses.
We have chosen these variables because they can influence the migration process in Romania.
The annual data are obtained from the official website of the National Institute of Statistics of Romania (
www.insse.ro, accessed on 10 January 2021) and Eurostat—the statistical office of the European Union (
https://ec.europa.eu/eurostat/web/main/data/database, accessed on 10 January 2021). The study period is between the years 2000 and 2020.
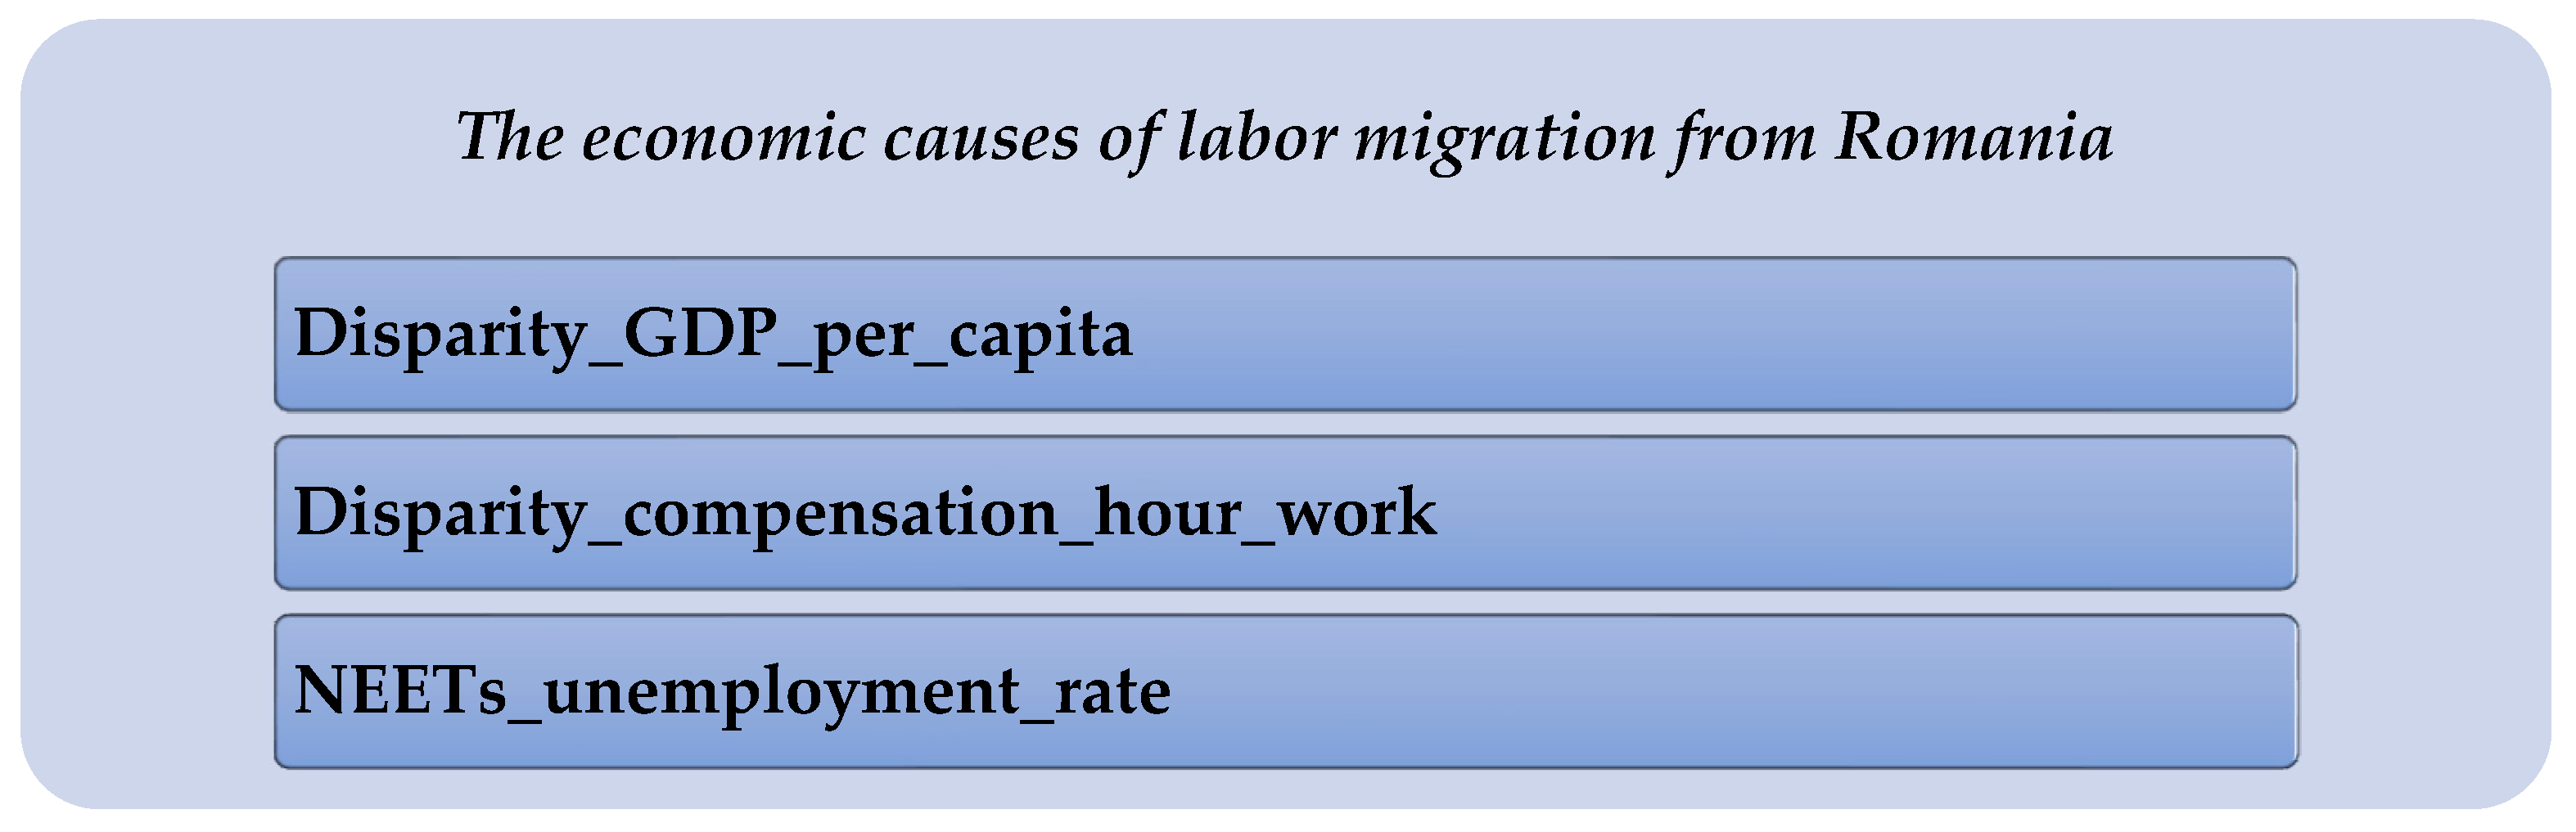
The economic causes of international labor emigration are numerous, but among the most important identified by us, following the study conducted on the migration process in Romania, are:
- (a)
the disparities between the standard of living in different countries, quantified in our study through the variable that measures the gap between GDP per capita in the European Union and GDP per capita in Romania, namely:
- (b)
labor market disparities in net average hourly pay in the U.S. and Romania, quantified by the variable:
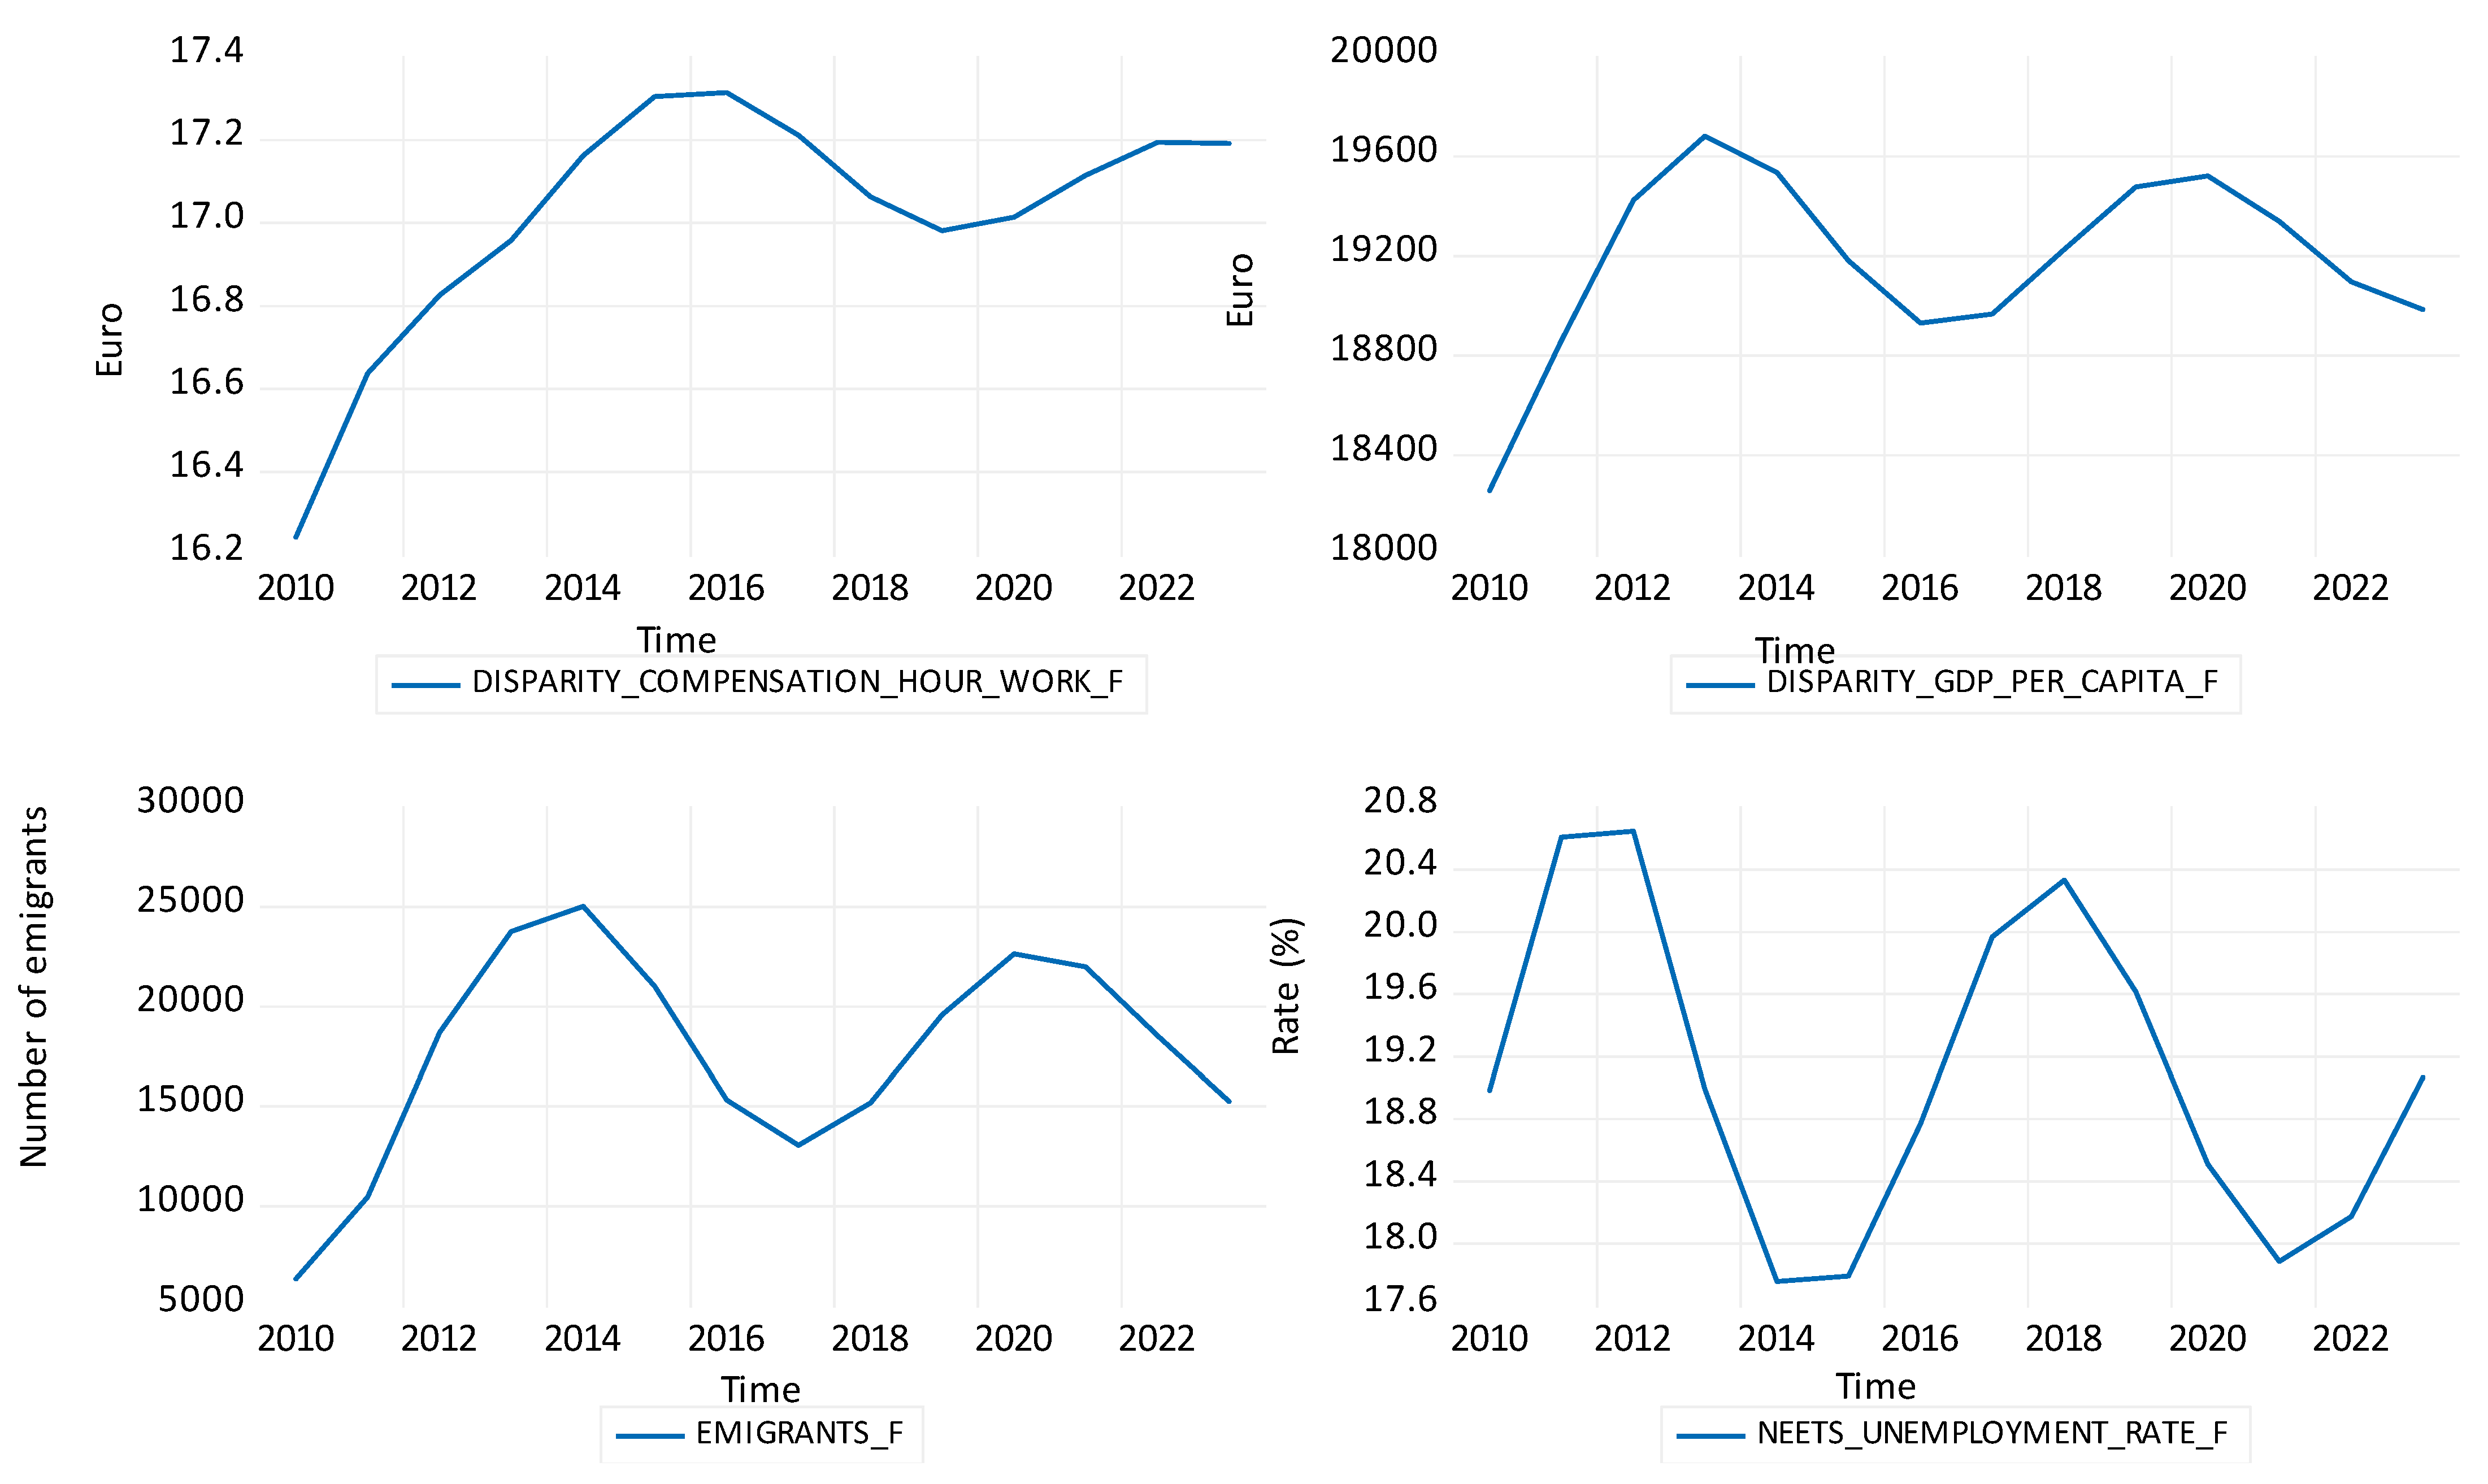
- (c)
the impossibility of young people to pursue a career in their country of origin for various reasons, including the impossibility of finding a job according to their training and skills due to “nepotism” and access to certain positions only through incorrect means, as well as due to the fact that employers require experience in the field, which young people cannot gain due to a non-existent or low use by high schools and universities of the paid internship system, which is very common in other Western European countries. In the study, the variable used was the one that quantifies the unemployment rate at the level of NEETs (Not in Employment, Education or Training), namely: NEETs_unemployment_rate, according to
Figure 2.
There are also other variables that are difficult to quantify, such as the social and psychological ones that determine labor migration. In this sense, H. Olesen considers that “bad governance also plays an important role in the migration of highly qualified professionals”. They react particularly sensitively when they “find that the situation regarding the protection of human rights by the authorities in their country of origin becomes unacceptable. This can take many forms: honest civil servants refuse to engage in corrupt practices; inability to express an opinion freely; career advancement is not based on professional criteria” [
51].
Labor migration from Romania abroad has been widespread in the last 20 years and involves the population from all regions of the country, all age and gender categories, and all ethnic groups in the country. Romanians go to work not only in Latin-speaking countries within the European Union, such as Italy, Spain and France, but also in countries such as the UK, Germany, USA or Canada, going beyond the “Latin world” and the attachment to linguistic affinities in choosing the country for labor migration.
The choice of the destination country for migration is also made according to a series of social factors that are difficult to quantify, such as: family, friends who can provide information to the emigrant, temporary financial or living support and, last but not least, psychological support in the stage of adaptation and finding a job.
The COVID-19 pandemic affected all areas of activity, some more than others, and it also affected the migration process in Romania, in the sense that people have not gone to work abroad in such large numbers as in previous years. The number of emigrants from Romania decreased in the year of the 2020 pandemic by 21.45% compared to 2019, reaching 21,031 people in 2020 compared to 26,775 people in the previous year. The causes that determined the reduction of the emigration phenomenon in Romania were the ban on traveling due to the lockdown imposed by the authorities, people’s distrust and fear of traveling due to the pandemic, but also the increase in unemployment in the countries to which Romanians would emigrate because of the COVID-19 pandemic. This also affected the number of immigrants, which registered a value of 32,250 people in 2020 compared to 64,479 in 2019, decreasing by almost 50% in 2020 due to the COVID-19 pandemic.
That is why it is particularly important for both economic agents in certain fields of activity and government institutions to know the forecasted values for future, medium- and long-term evolution for the migration process, but especially for the number of emigrants from certain key sectors of activity, which have been facing a shortage of specialists for several years, in order to be able to take the necessary measures to determine the return of specialists to the country or to bring other specialists from other countries, such as those in Asia. For this purpose, we will look for the best model that can statistically approximate the previous evolution of this data series and on the basis of which the best forecast can be made.
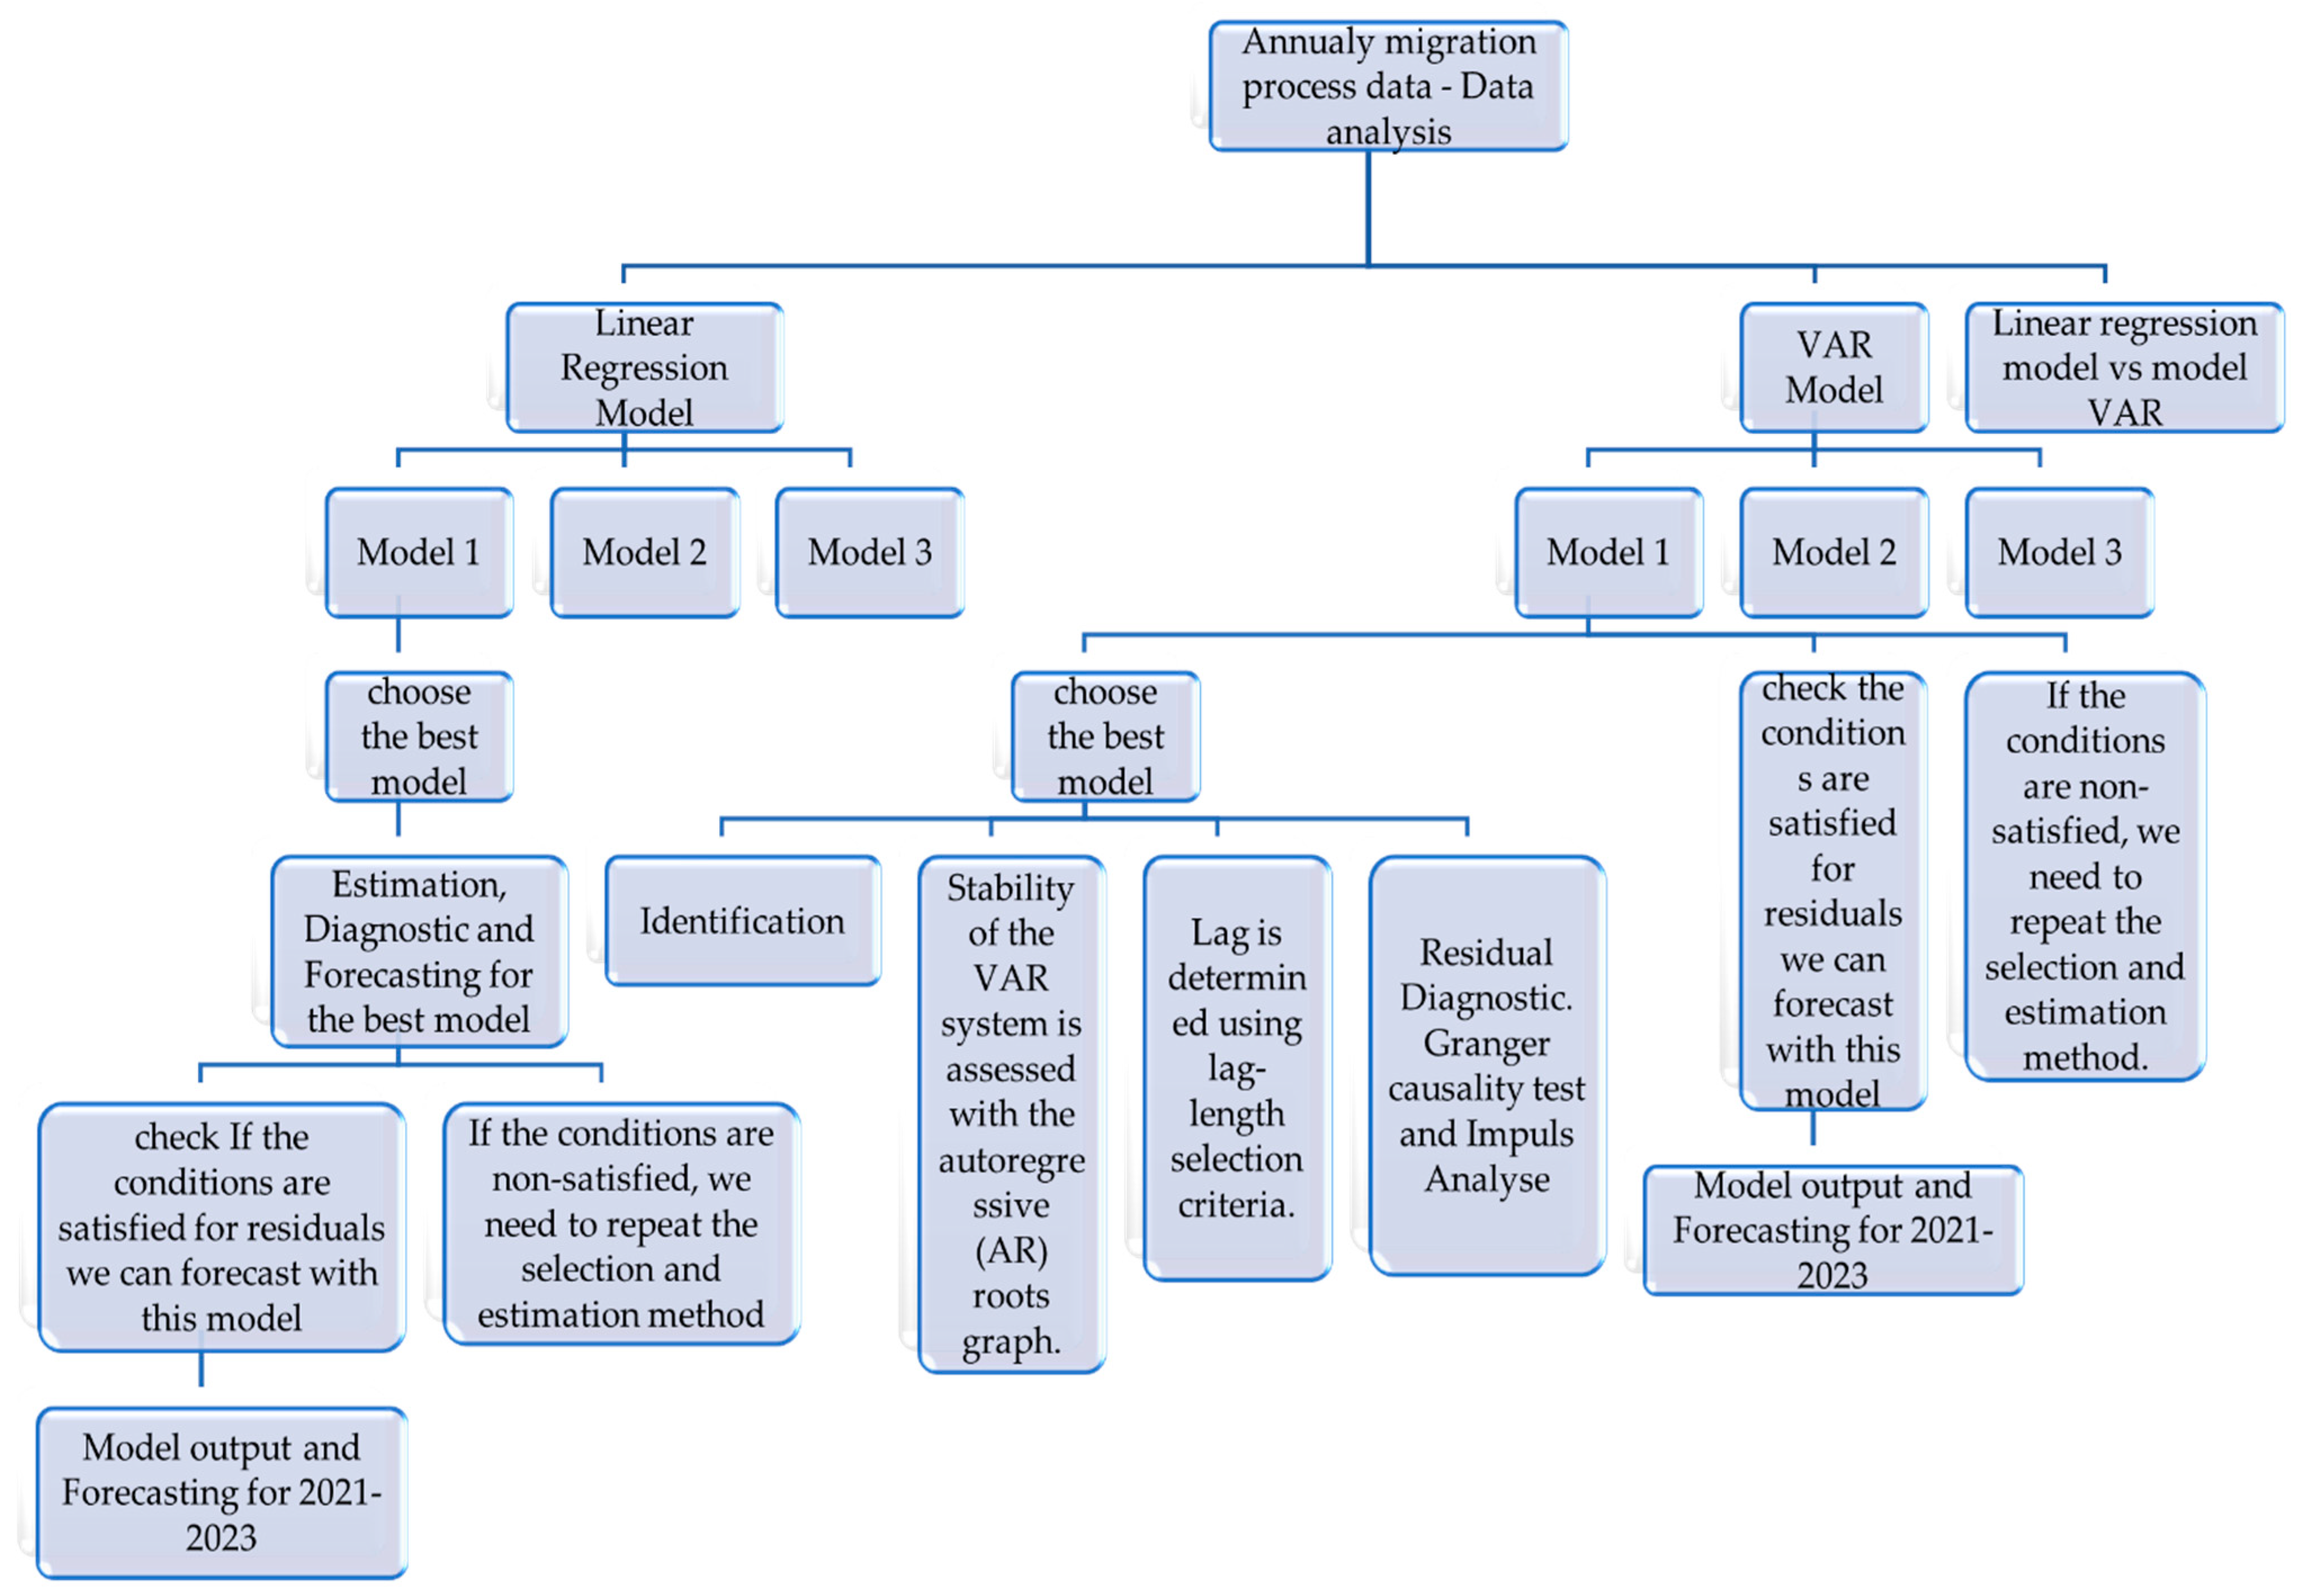
4.2. The Algorithm of the Forecasting System of the Migration Process in Romania in the Post-Pandemic Period
In order to obtain the best forecast model for emigrants, we used the following algorithm for this study based on the methodology mentioned in
Figure 3.
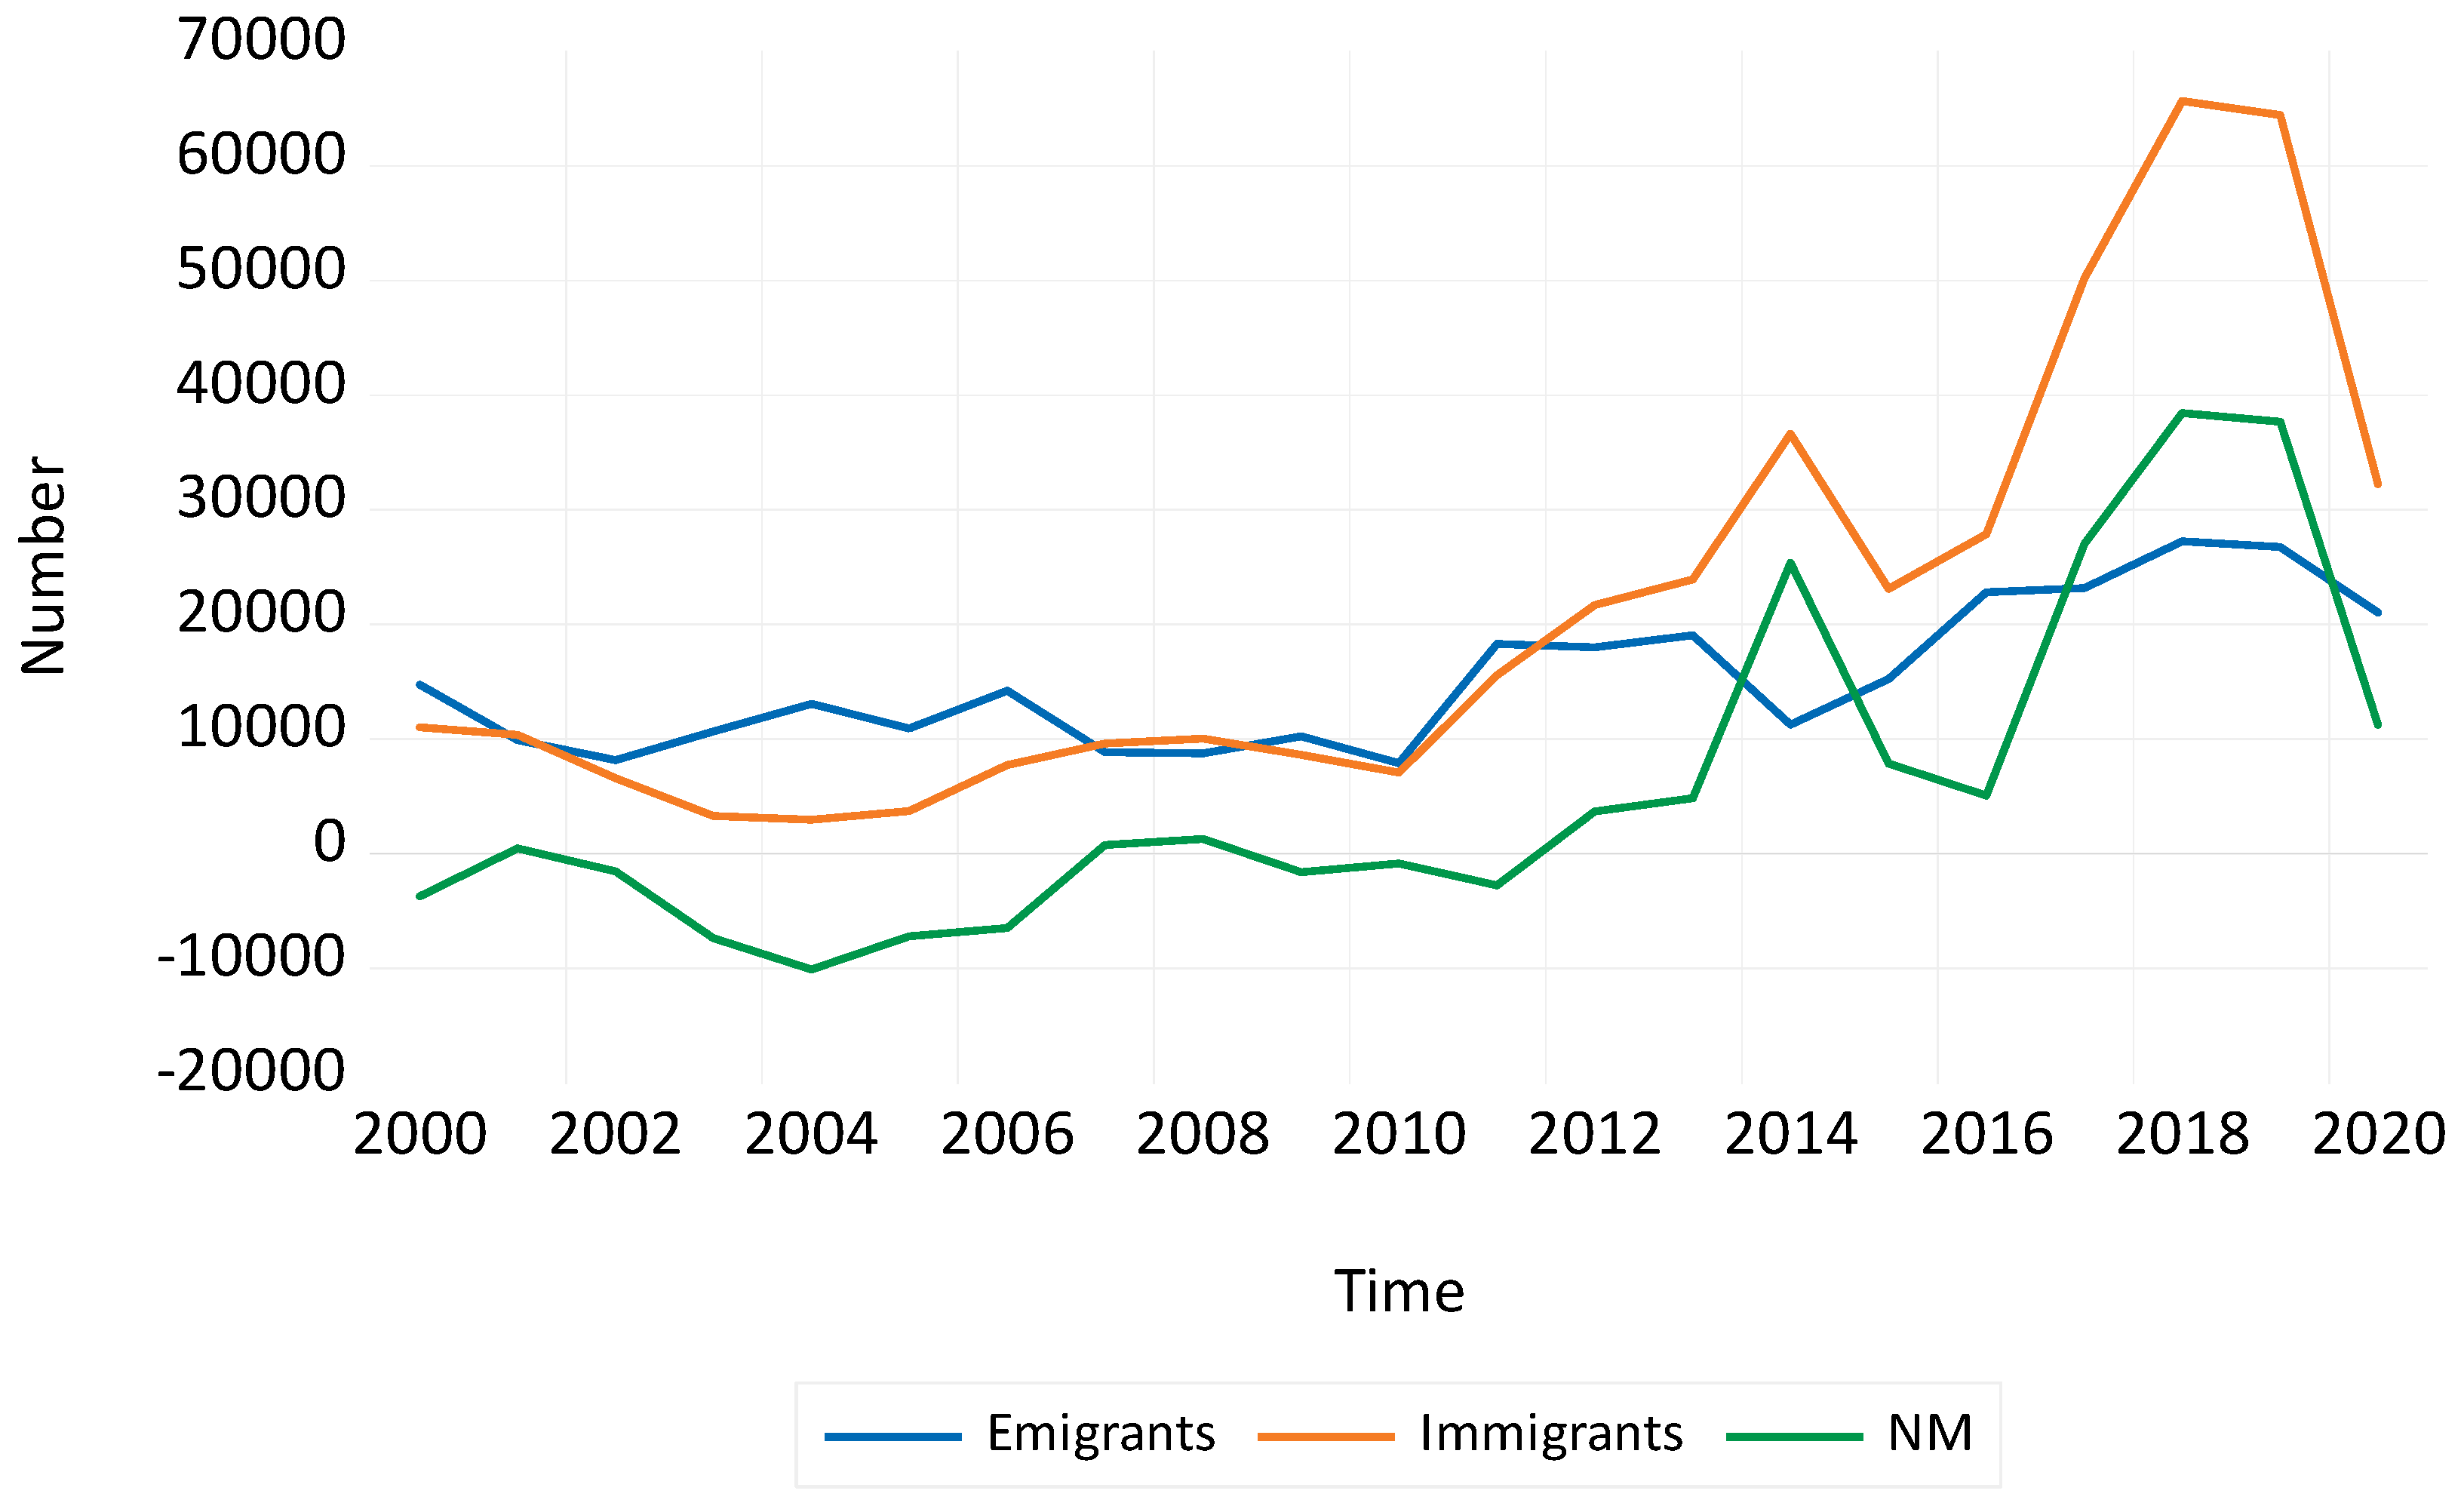
Based on the analysis of
Figure 4, it can be seen that since 2012 net migration in Romania is constantly positive, i.e., the number of immigrants has constantly exceeded the number of emigrants.
Statistical data on the migration process in Romania were processed using the statistical program EViews. Thus, they can be systematized as in
Table 1, and their graphical representation is shown in
Figure 5.
Descriptive statistics for the migration process are presented in
Table 2.
4.3. Estimating a Linear Regression Model
In order to identify and choose the best linear regression model for the migration process [
52] in Romania, respectively the number of emigrants, we studied several possible models [
53] and finally focused on three [
54].
The statistical data regarding the migration process in Romania and the three models were processed with the help of the statistical software EViews. The outputs obtained are shown in
Table 3:
From the analysis of the outputs obtained for model 1, the following elements can be ascertained (
Table 4):
the probability associated with each of the variables is less than 0.05, which highlights the fact that all variables are statistically significant;
the probability associated with the constant C is 0.0001 < 0.05, so this is also statistically significant;
the R-squared is 0.806035, and the Adjusted R-squared is 0.753136;
the Durbin–Watson state is 2.471610, which indicates that the model is stable.
From the analysis of the outputs obtained for model 2, the following elements can be ascertained (
Table 5):
the probability associated with each of the first 3 variables is less than 0.05, which highlights the fact that all variables are statistically significant;
the probability associated with the variable Rate_risk_of_poverty is 0.2329 and is therefore higher than the critical value 0.05, which shows us that it is not statistically significant;
the probability associated with the constant C is 0.0001 < 0.05, so this is also statistically significant;
the R-squared is 0.878300, and the Adjusted R-squared is 0.824211;
the Durbin−Watson state is 3.052782, which indicates that the pattern is unstable.
From the analysis of the outputs obtained for model 3, the following elements can be ascertained (
Table 6):
the probability associated with each of the first 3 variables is less than 0.05, which highlights the fact that all variables are statistically significant;
the probability associated with the variable Regional_disparities_in_unemployment_rates ate_risk_of_poverty is 0.6484 and is therefore higher than the critical value 0.05, which shows us that it is not statistically significant;
the probability associated with the constant C is 0.0001 < 0.05, so this is also statistically significant;
the R-squared is 0.810229, and the Adjusted R-squared is 0.734320;
the Durbin−Watson state is 2.678158, over 2.5, which indicates that the model is unstable.
Thus, based on the analysis of the 3 studied regression models, it is considered that the best model is Model 1 because it is the only one that has statistically significant regression equation coefficients. Moreover, Model 1 also has the Durbin–Watson [
55] state value closest to 2, which shows the stability of the model. According to the AIC, SBIC and HQIC criteria, Model 1 would have been in second place at a short distance from Model 2, which, however, cannot be considered because it is not statistically significant.
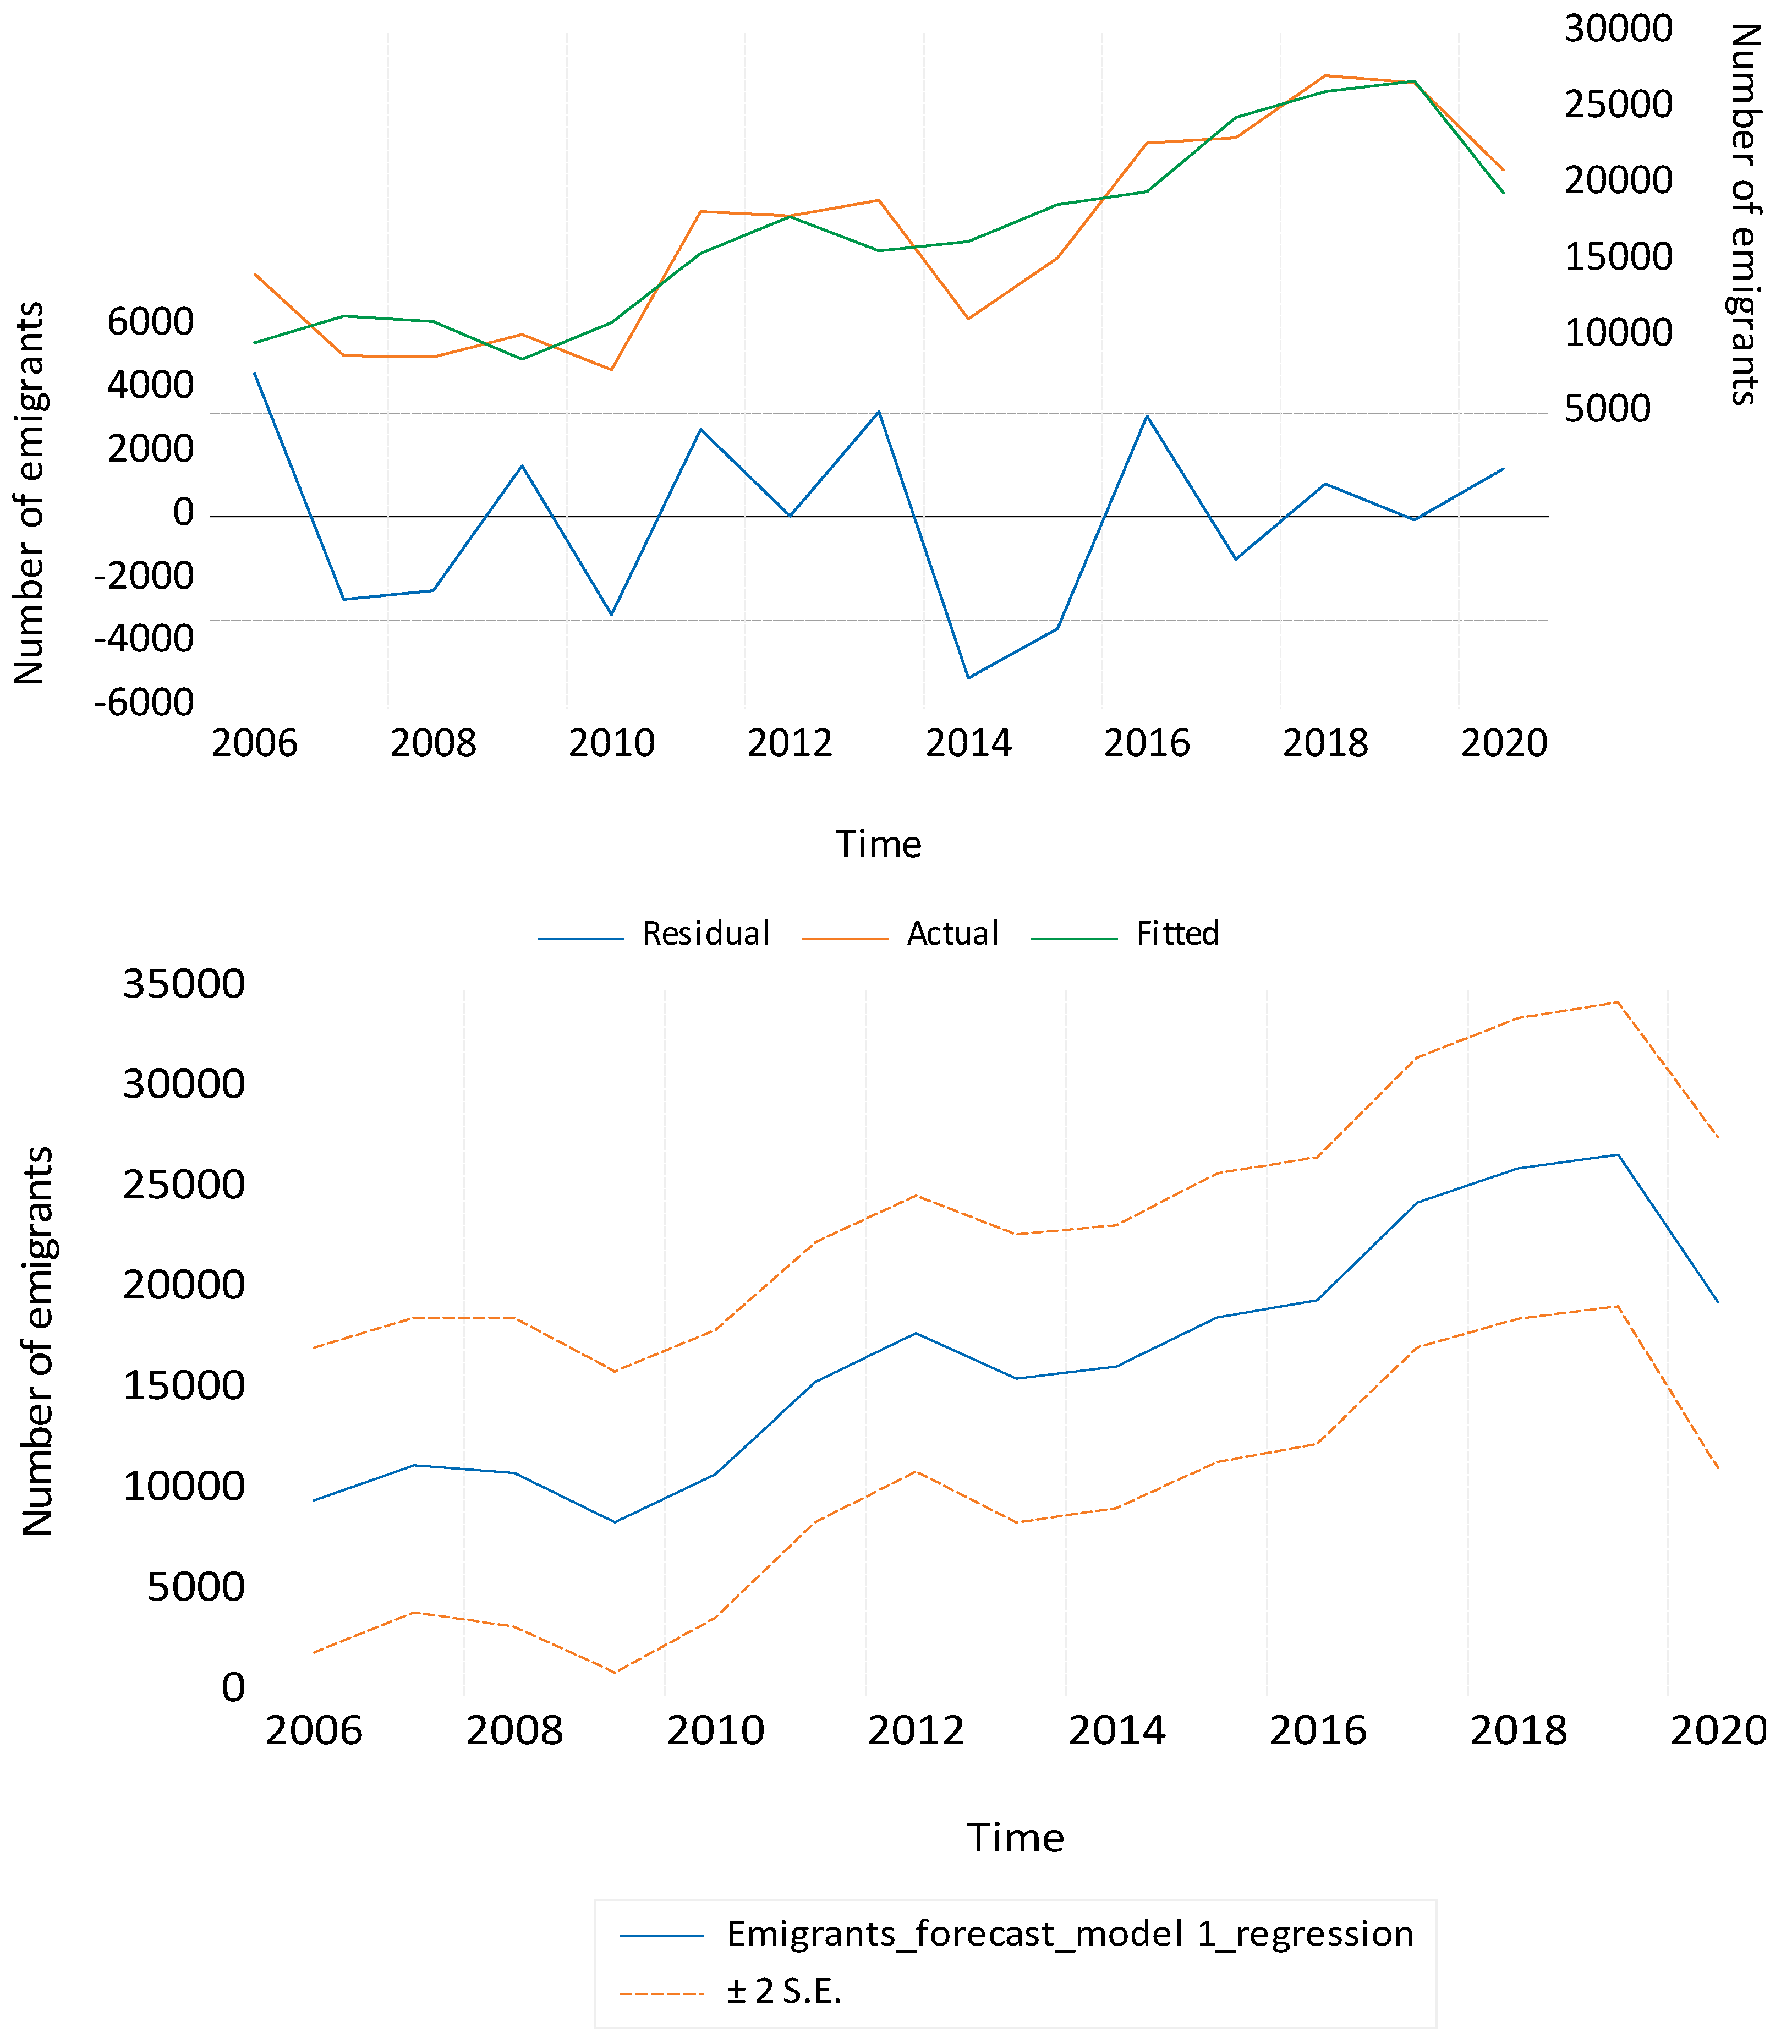
For Model 1—the best model—we will analyze the residuals and make the forecast of the migration process in Romania, respectively of the number of emigrants in the period 2021–2023.
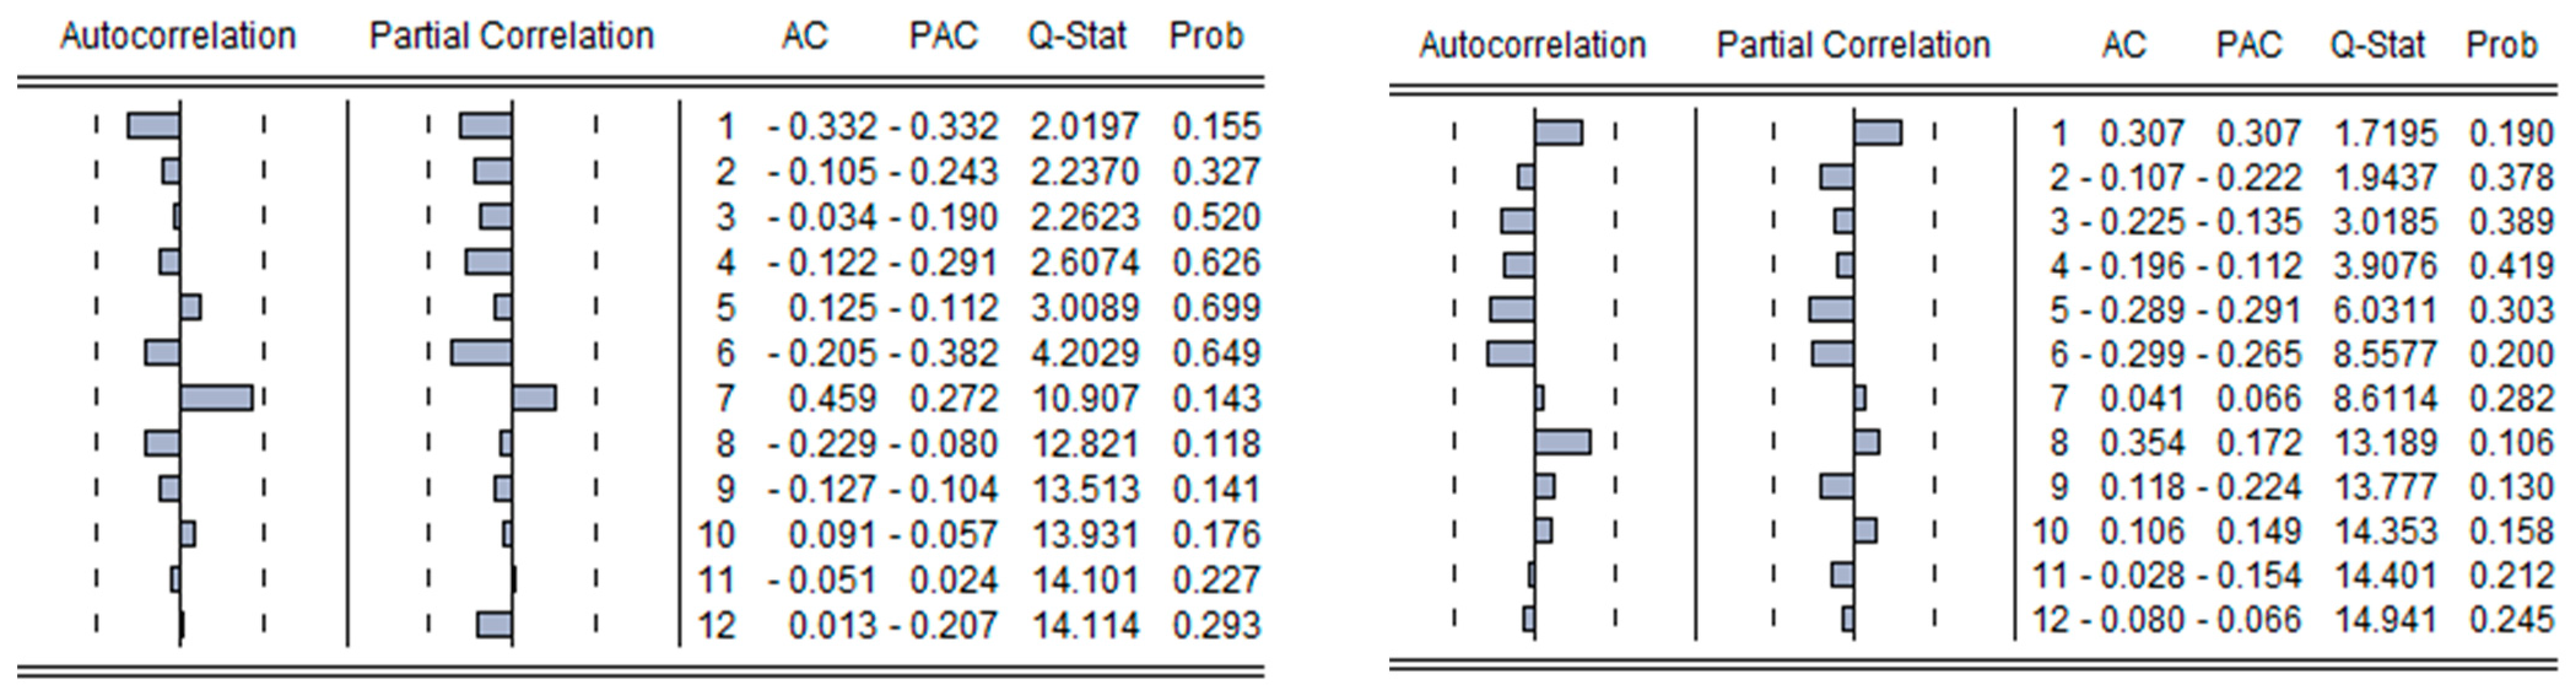
Residuals Diagnostic highlights that the chosen model, Model 1, can be used for forecasting because the Correlogram of Residuals ACF and PACF, as well as the Correlogram of Residuals Squared ACF and PACF, show that residuals do not exceed the confidence interval.
According to the graph in
Figure 6 and
Figure 7, it is observed that only in the period 2014–2015 did residuals exceed the confidence interval.
4.4. Estimating a VAR Model
Considering the identification and choice of the best forecast model for the migration process in Romania, we will also analyze the possibility that it can be quantified using a VAR (Vector Autoregression) model because the variables can influence each other [
56].
Vector autoregression [
57] (VAR) is used to model multivariate time series. Thus, VAR can analyze the dynamics of a migration process and its autoregressive modeling. The VAR makes it possible to visualize more appropriately the interactions between the variables used in the researched models. Thus, in order to determine if the process can be described by a VAR-type process [
58] for forecasting the number of emigrants, we have studied several possible VAR models, of which we finally focused on three possible models [
59].
To choose a VAR model, the following steps must be completed:
Lag is determined using lag-length selection criteria.
A VAR model with appropriate lags is built.
The stability of the VAR system is assessed with the autoregressive (AR) roots graph.
Residual autocorrelation is assessed with the Lagrange Multiplier (LM) test.
The Granger causality test is performed.
The identification of impulse functions.
The statistical data regarding the migration process in Romania and the three VAR models were processed with the help of the statistical software EViews, and we have obtained the following outputs (
Table 7 and
Table 8 and
Figure 8):
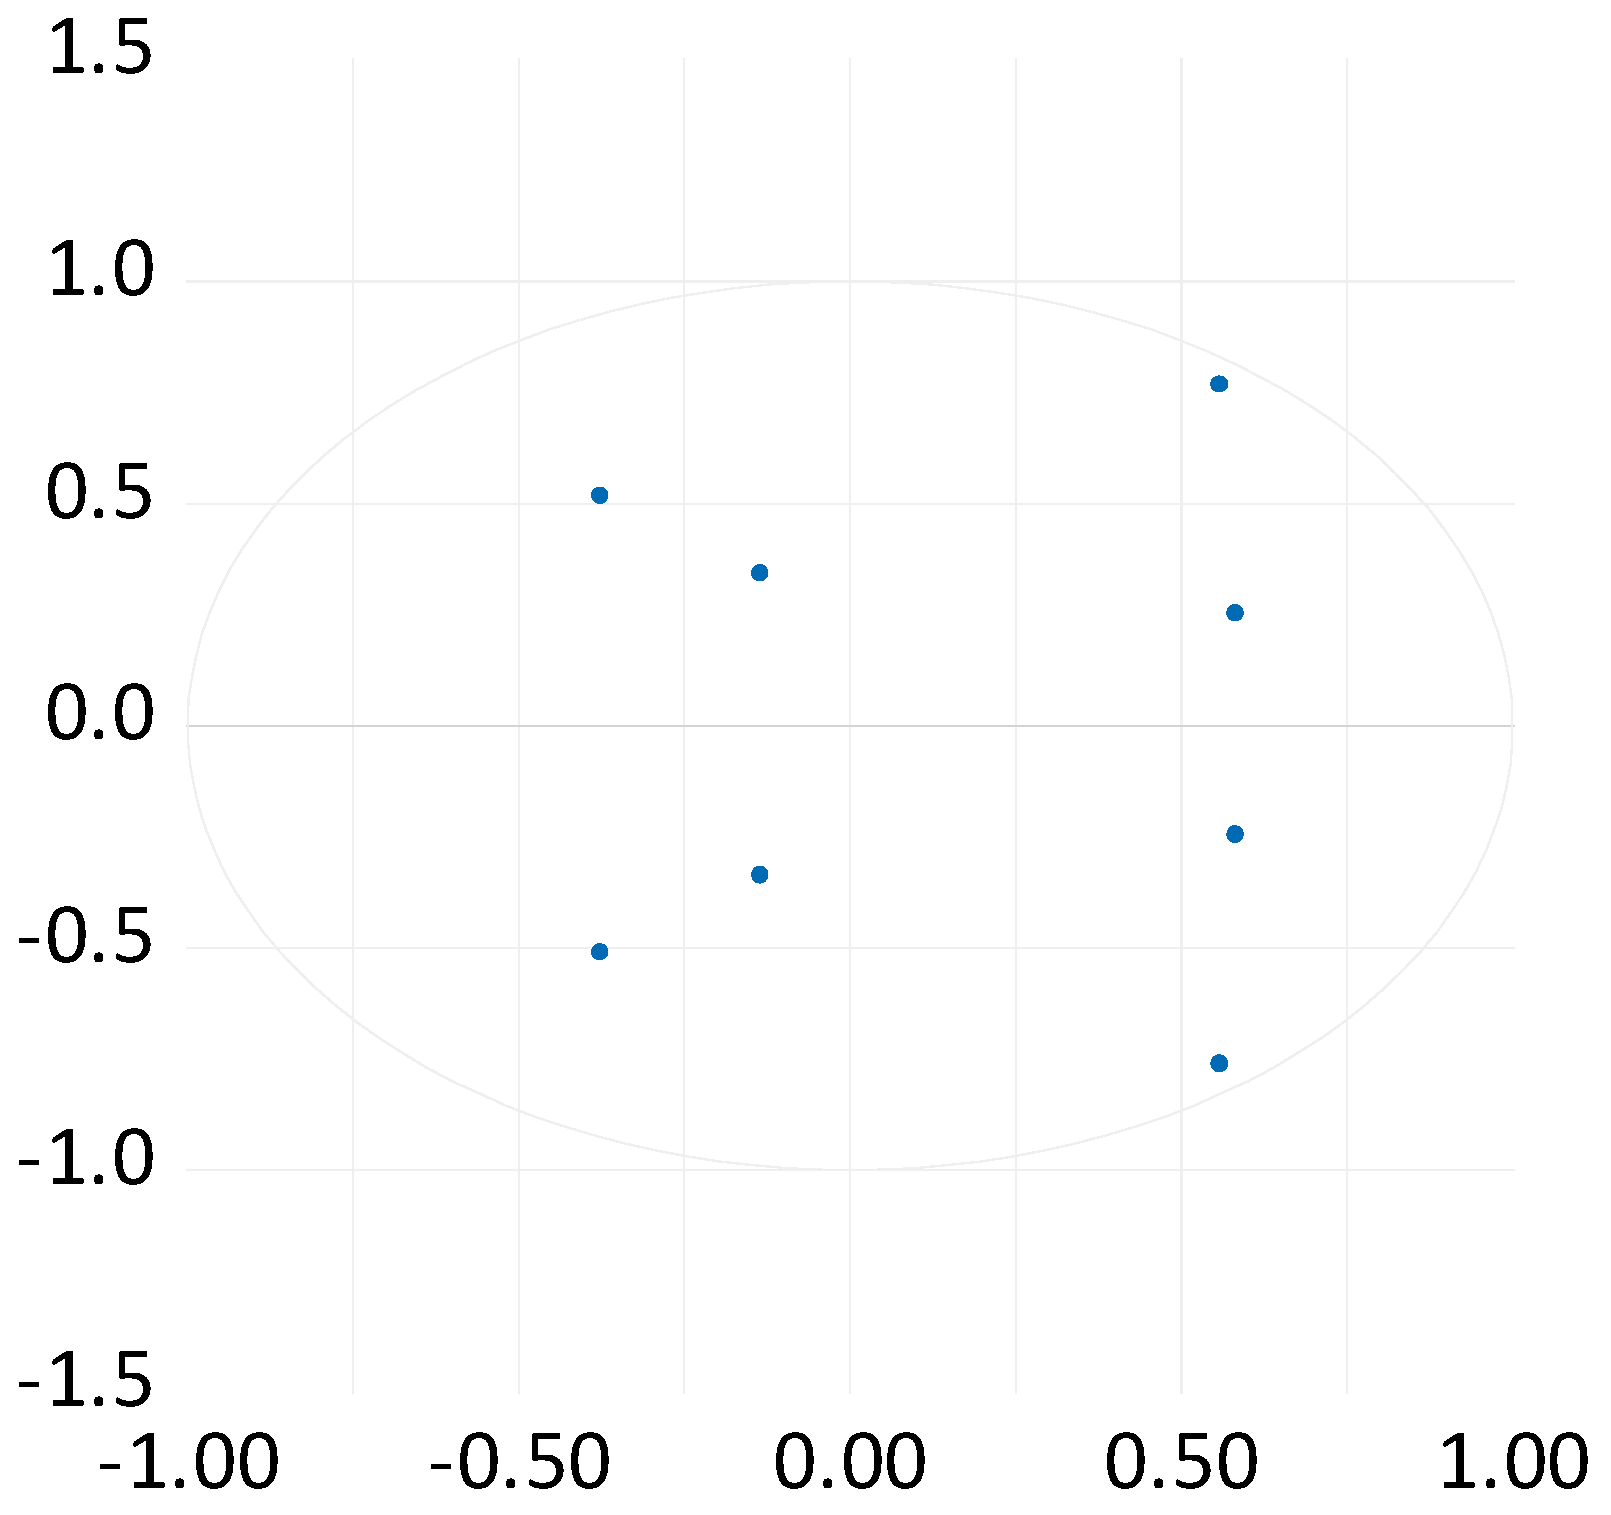
It is found, based on the analysis performed with the help of EViews, that no root lies outside the unit circle and that VAR satisfies the stability condition (
Table 9 and
Table 10 and
Figure 9).
Thus, the Model 1 VAR is stable.
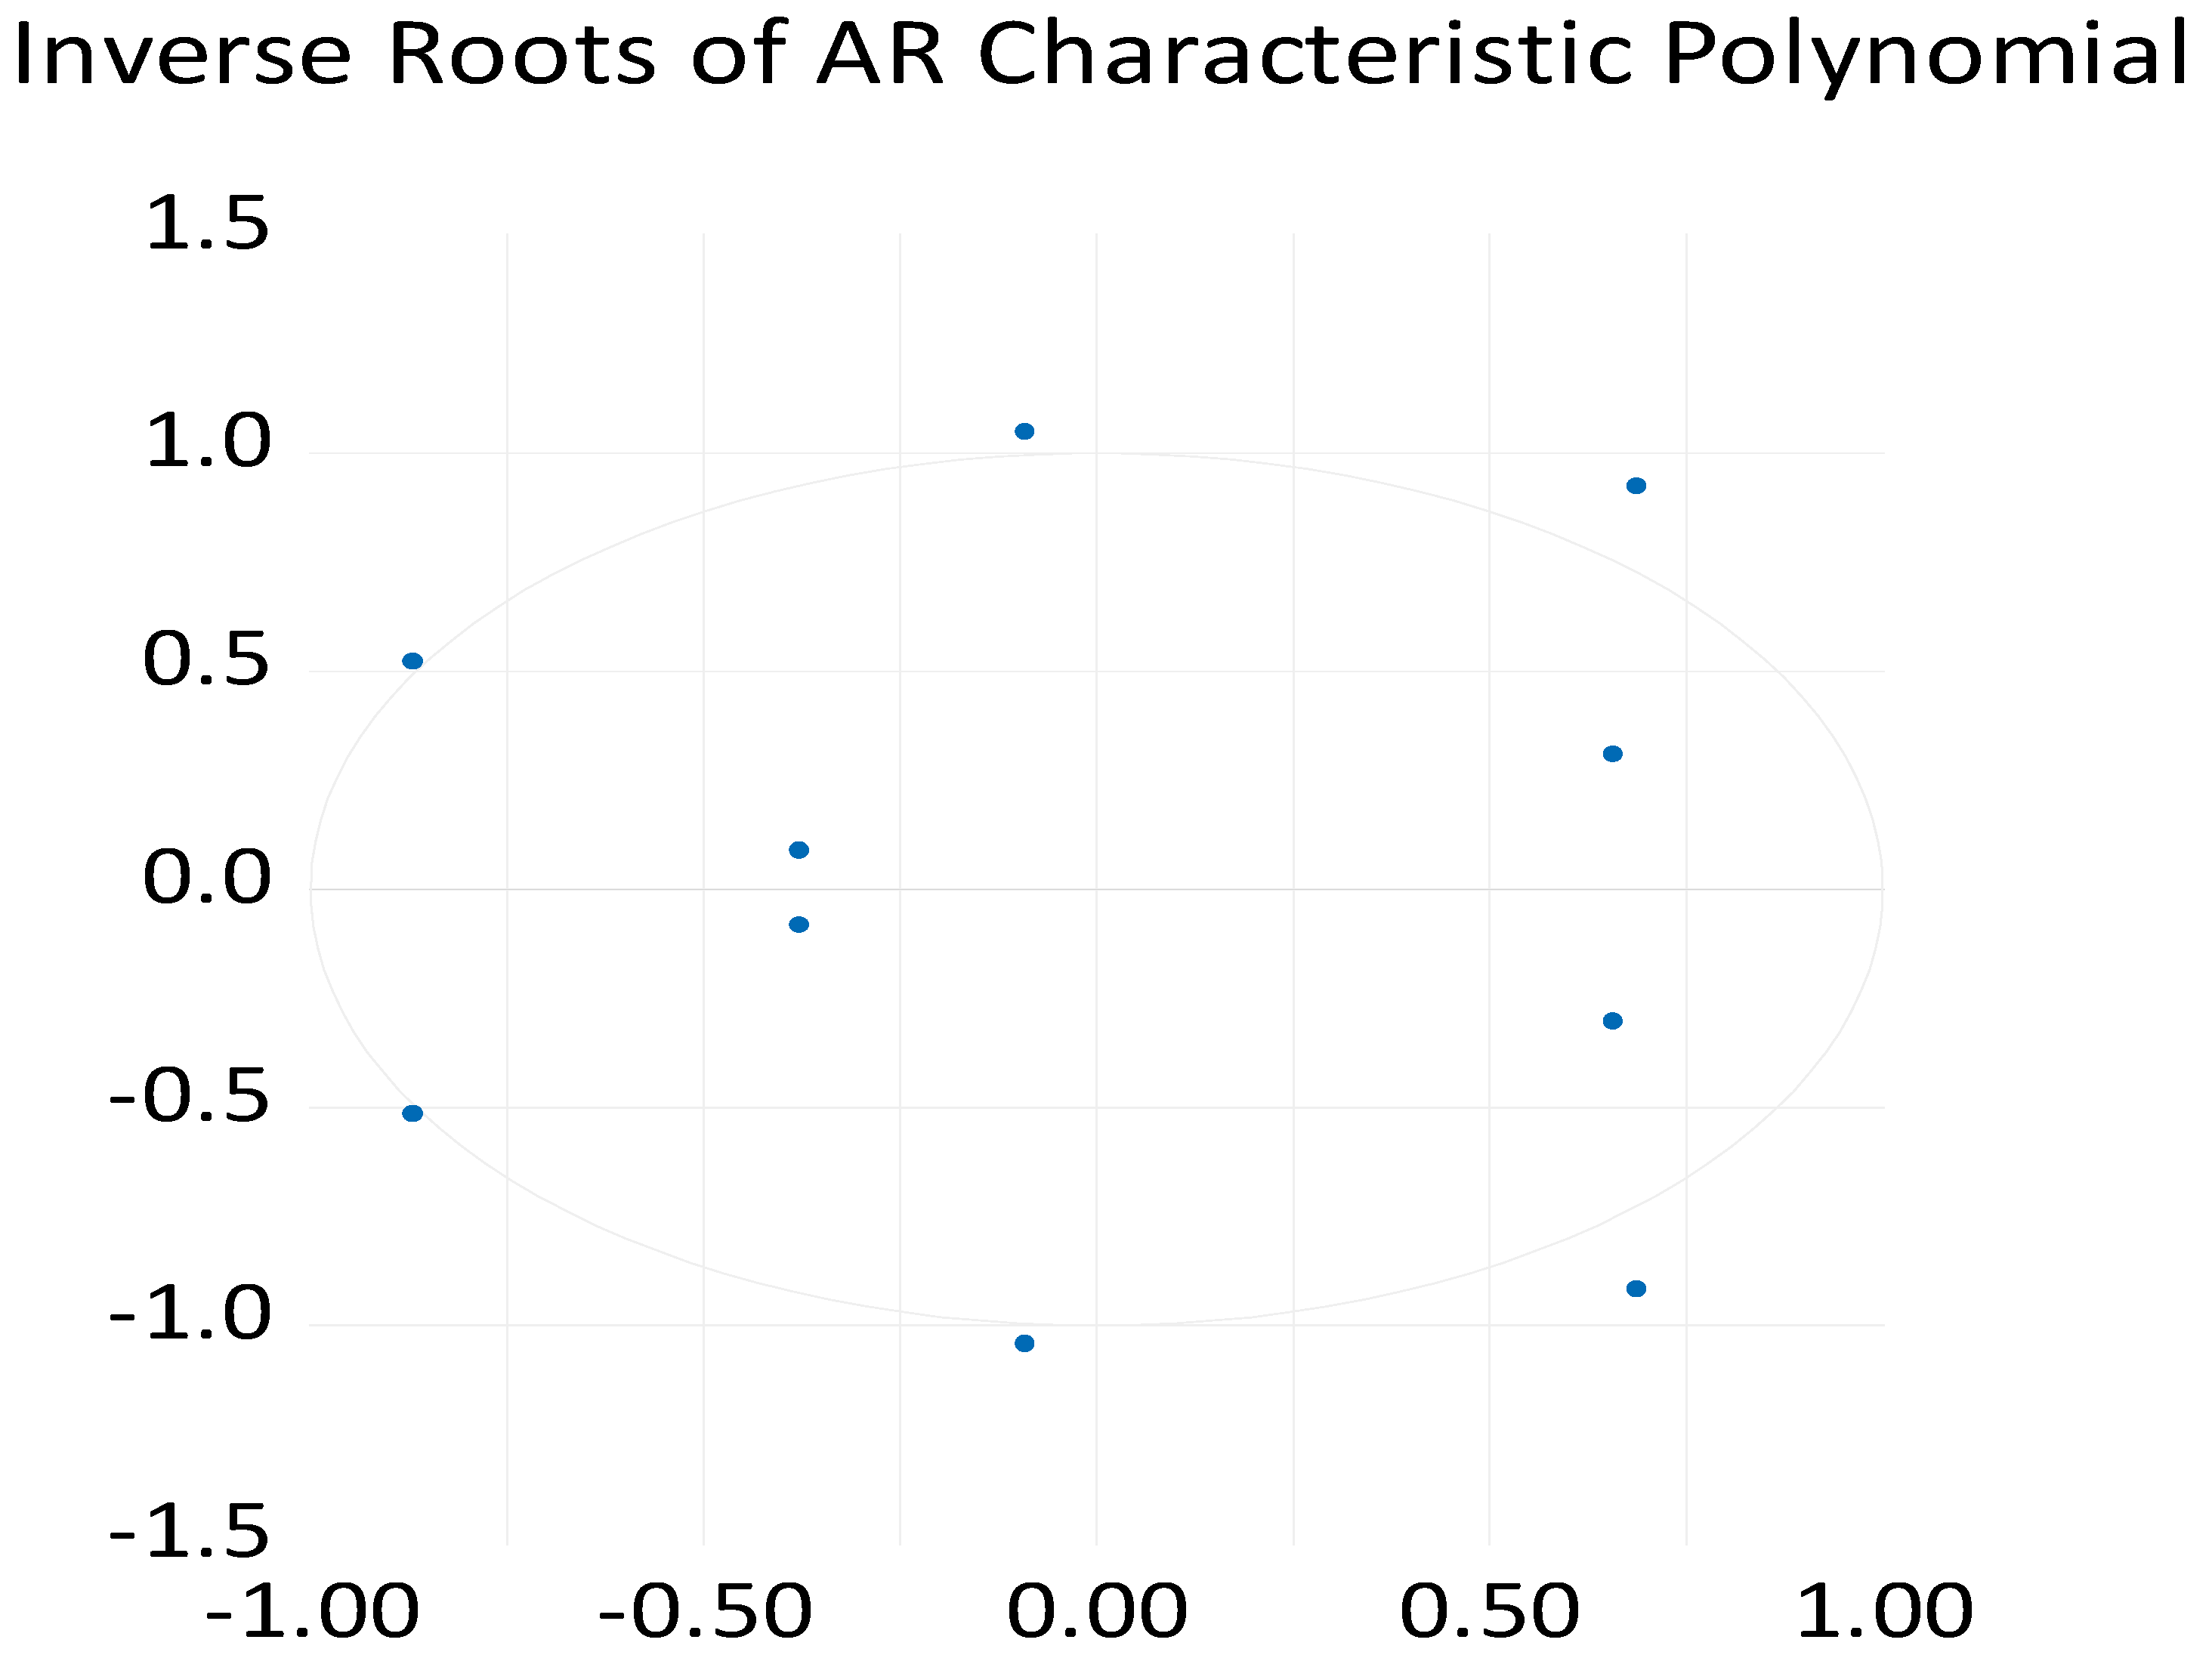
It is found, based on the analysis performed using EViews, that more root lies outside the unit circle and that VAR does not satisfy the stability condition, according to
Figure 9.
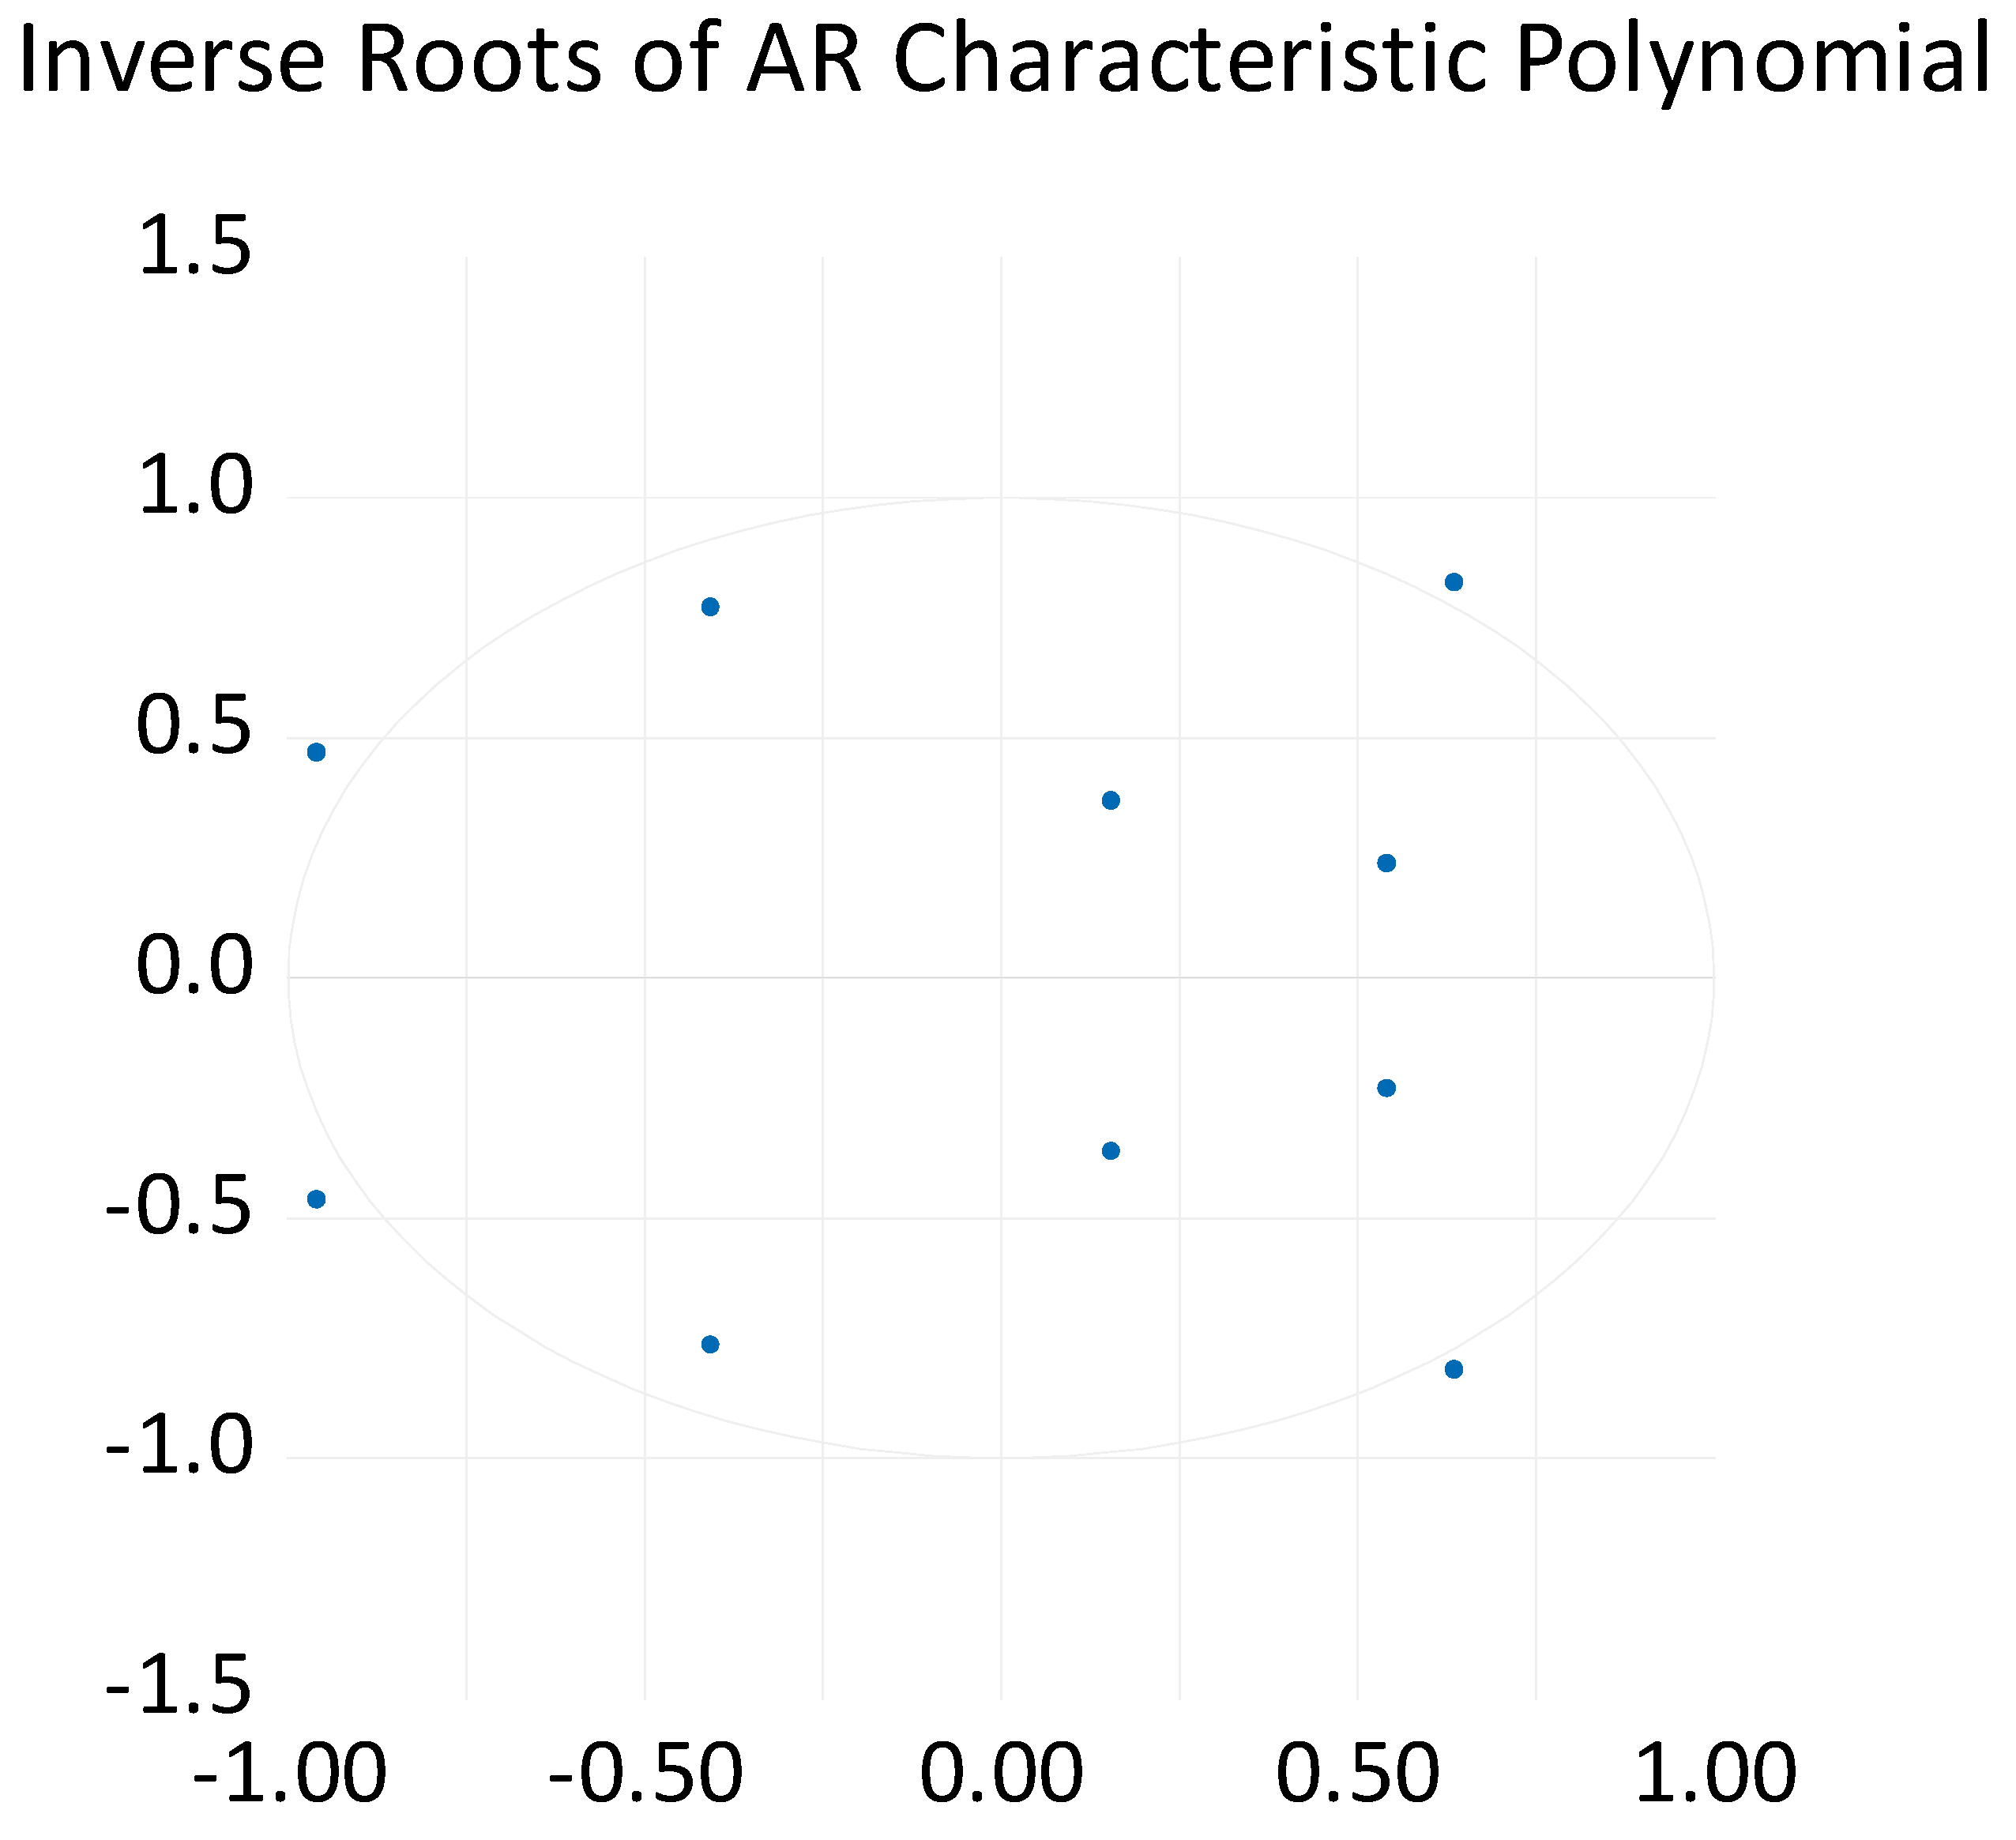
It is found, based on the analysis performed with the help of EViews, that more root lies outside the unit circle and that VAR does not satisfy the stability condition, according to
Figure 10.
Thus, Model 3 VAR is unstable (
Table 13).
Thus, based on the analysis of the 3 VAR type models, the one with no. 1 is chosen as the best model, because it is the only one that is stable, with no roots lying outside the unit circle and with VAR satisfying the stability condition. The other two studied models cannot be considered because they do not meet the stability condition.
For Model VAR 1—the best model—we will analyze the residuals and make the forecast of the migration process in Romania, respectively of the number of emigrants in the period 2021–2023.
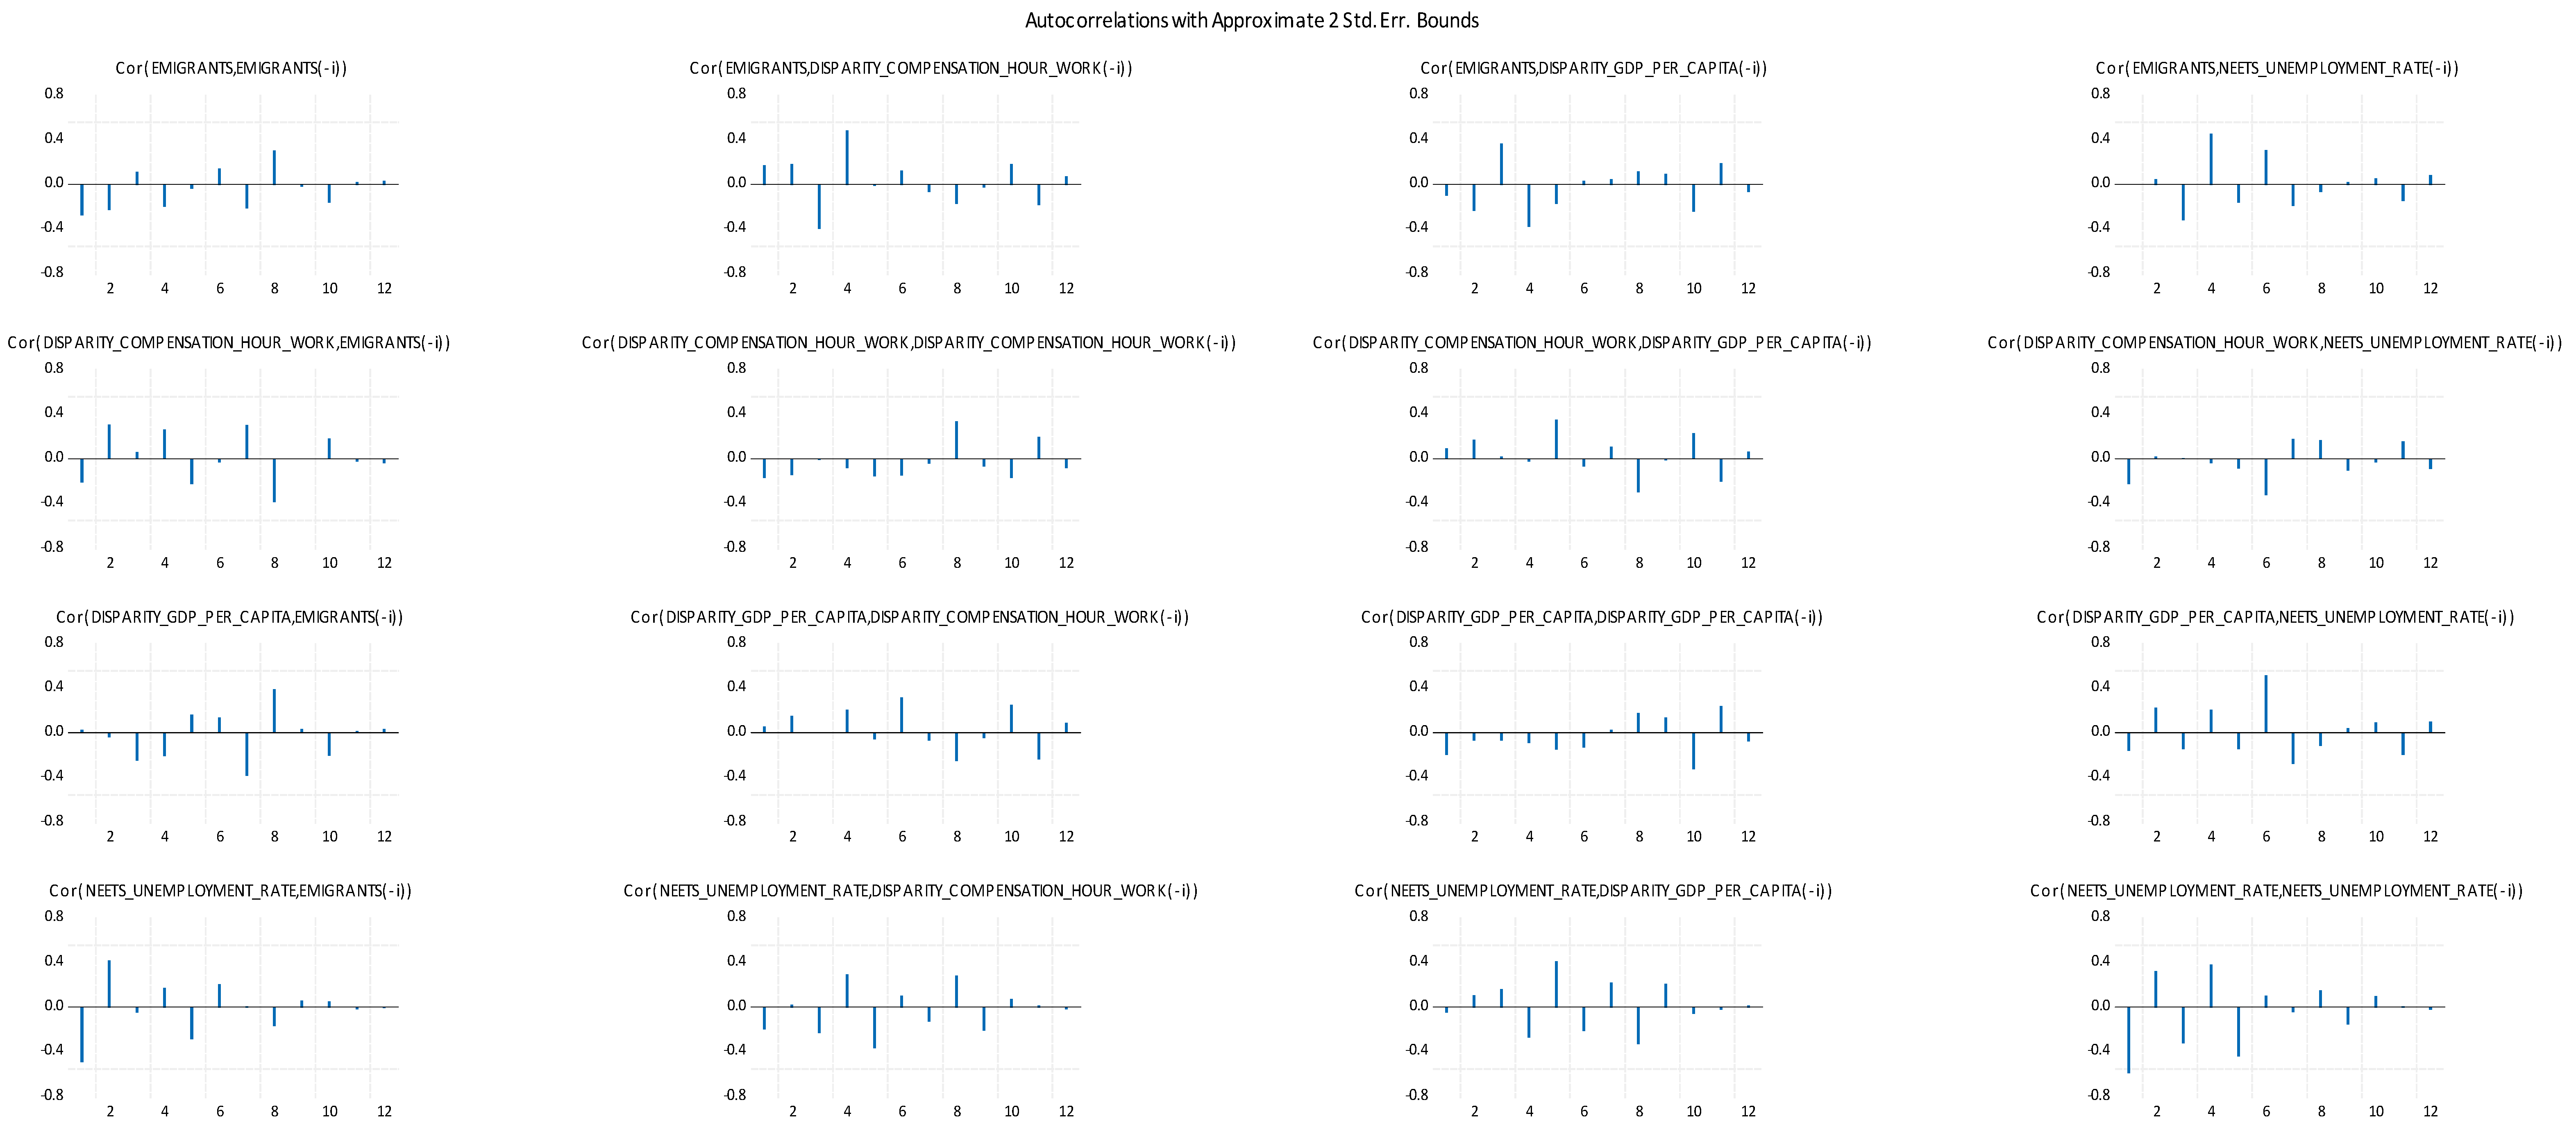
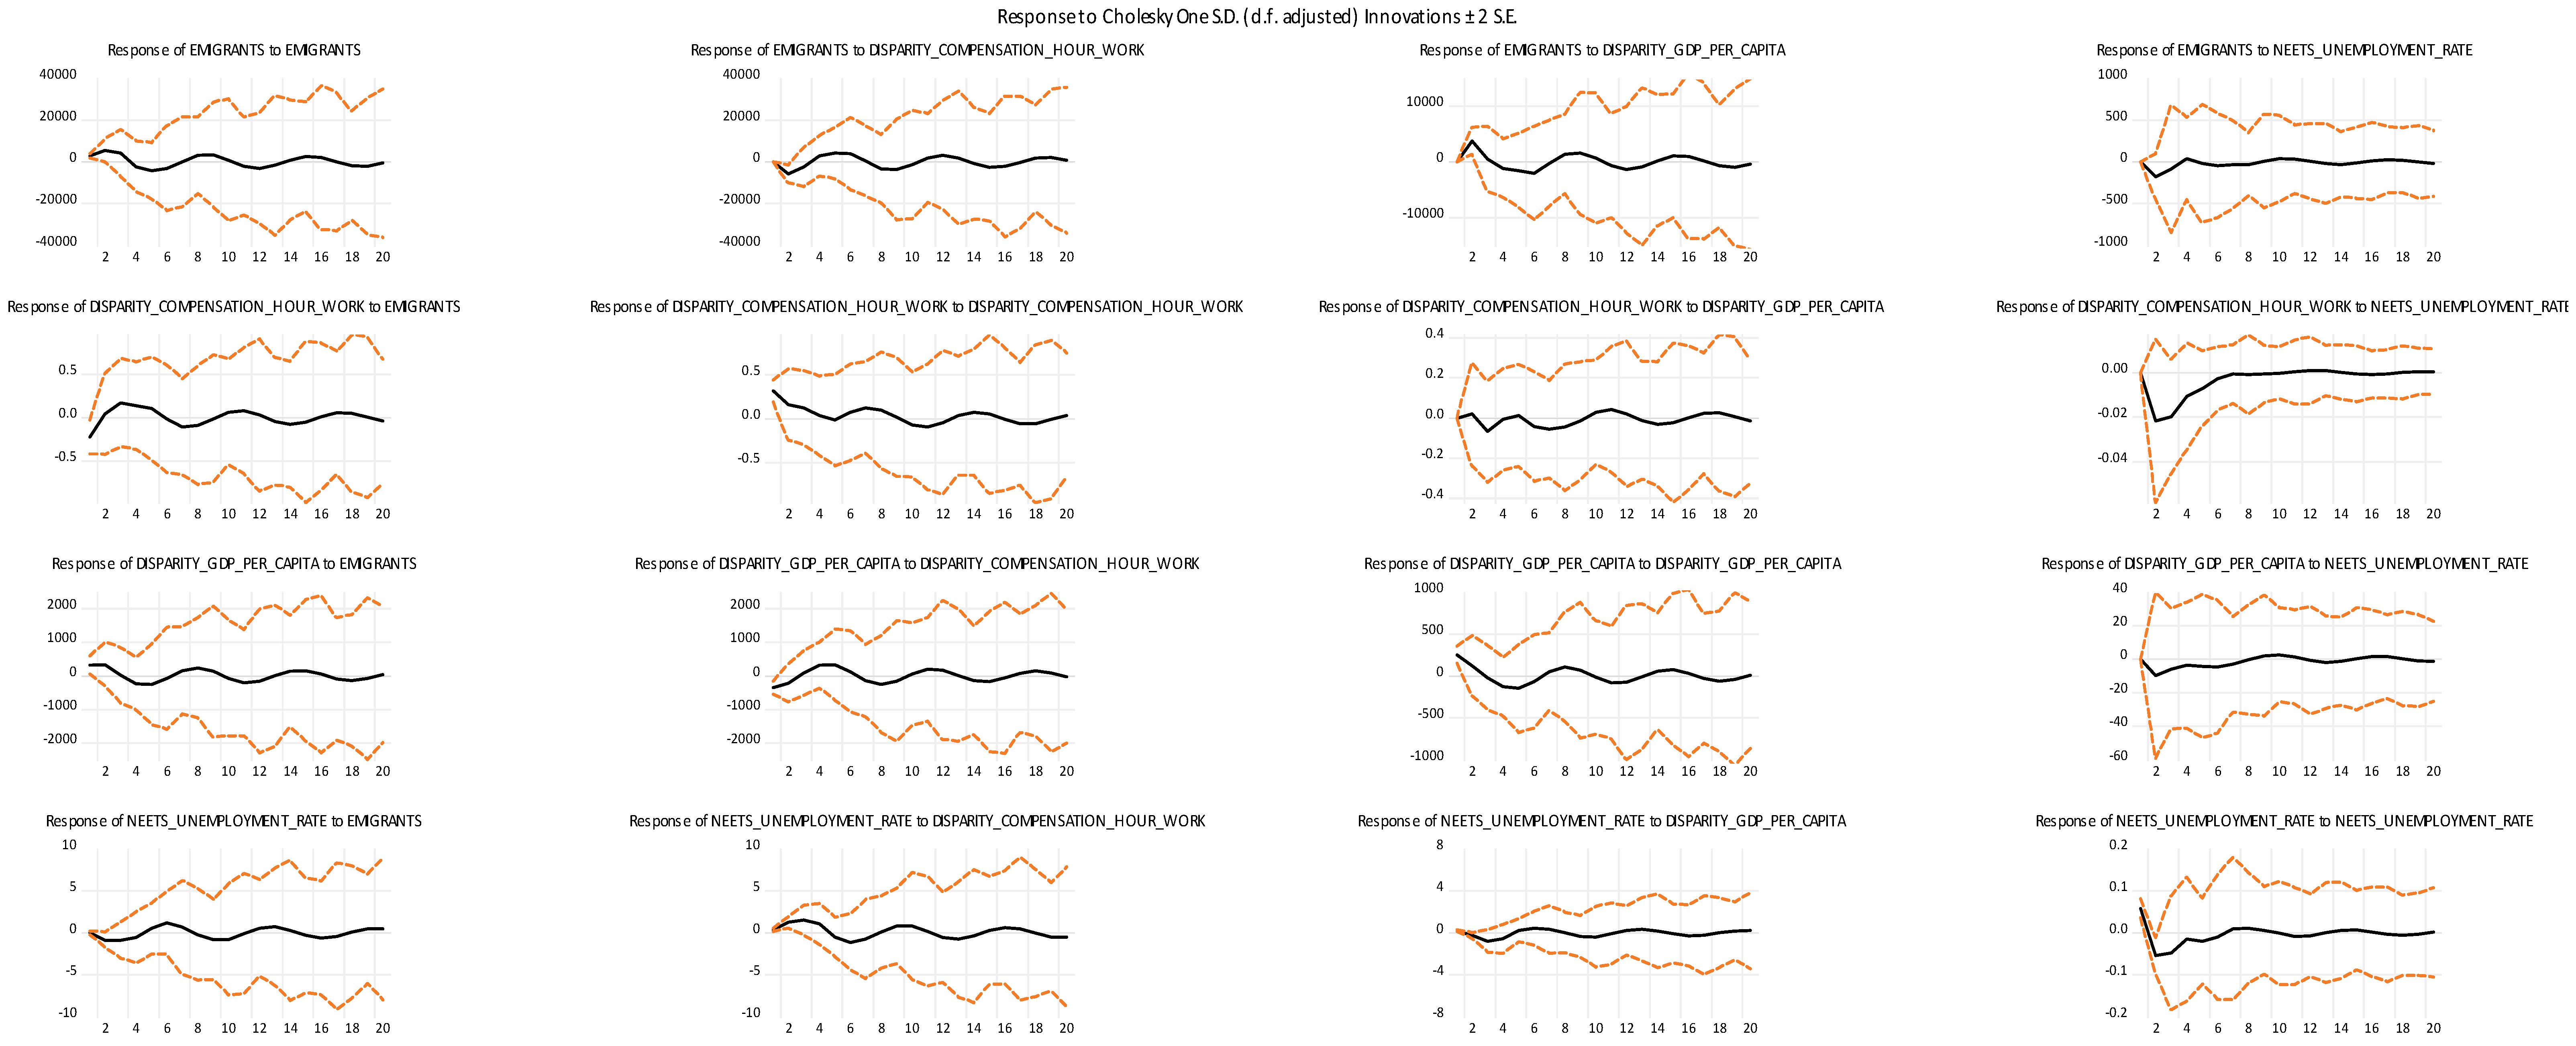
Diagnostic Residuals for the VAR model show that residuals do not exceed the confidence interval. Thus, considering the fact that no roots lie outside the unit circle, i.e., that VAR satisfies the stability condition, and that residuals do not exceed the confidence interval, based on the previous findings, it is considered that VAR is valid, according to
Figure 11 and
Figure 12.
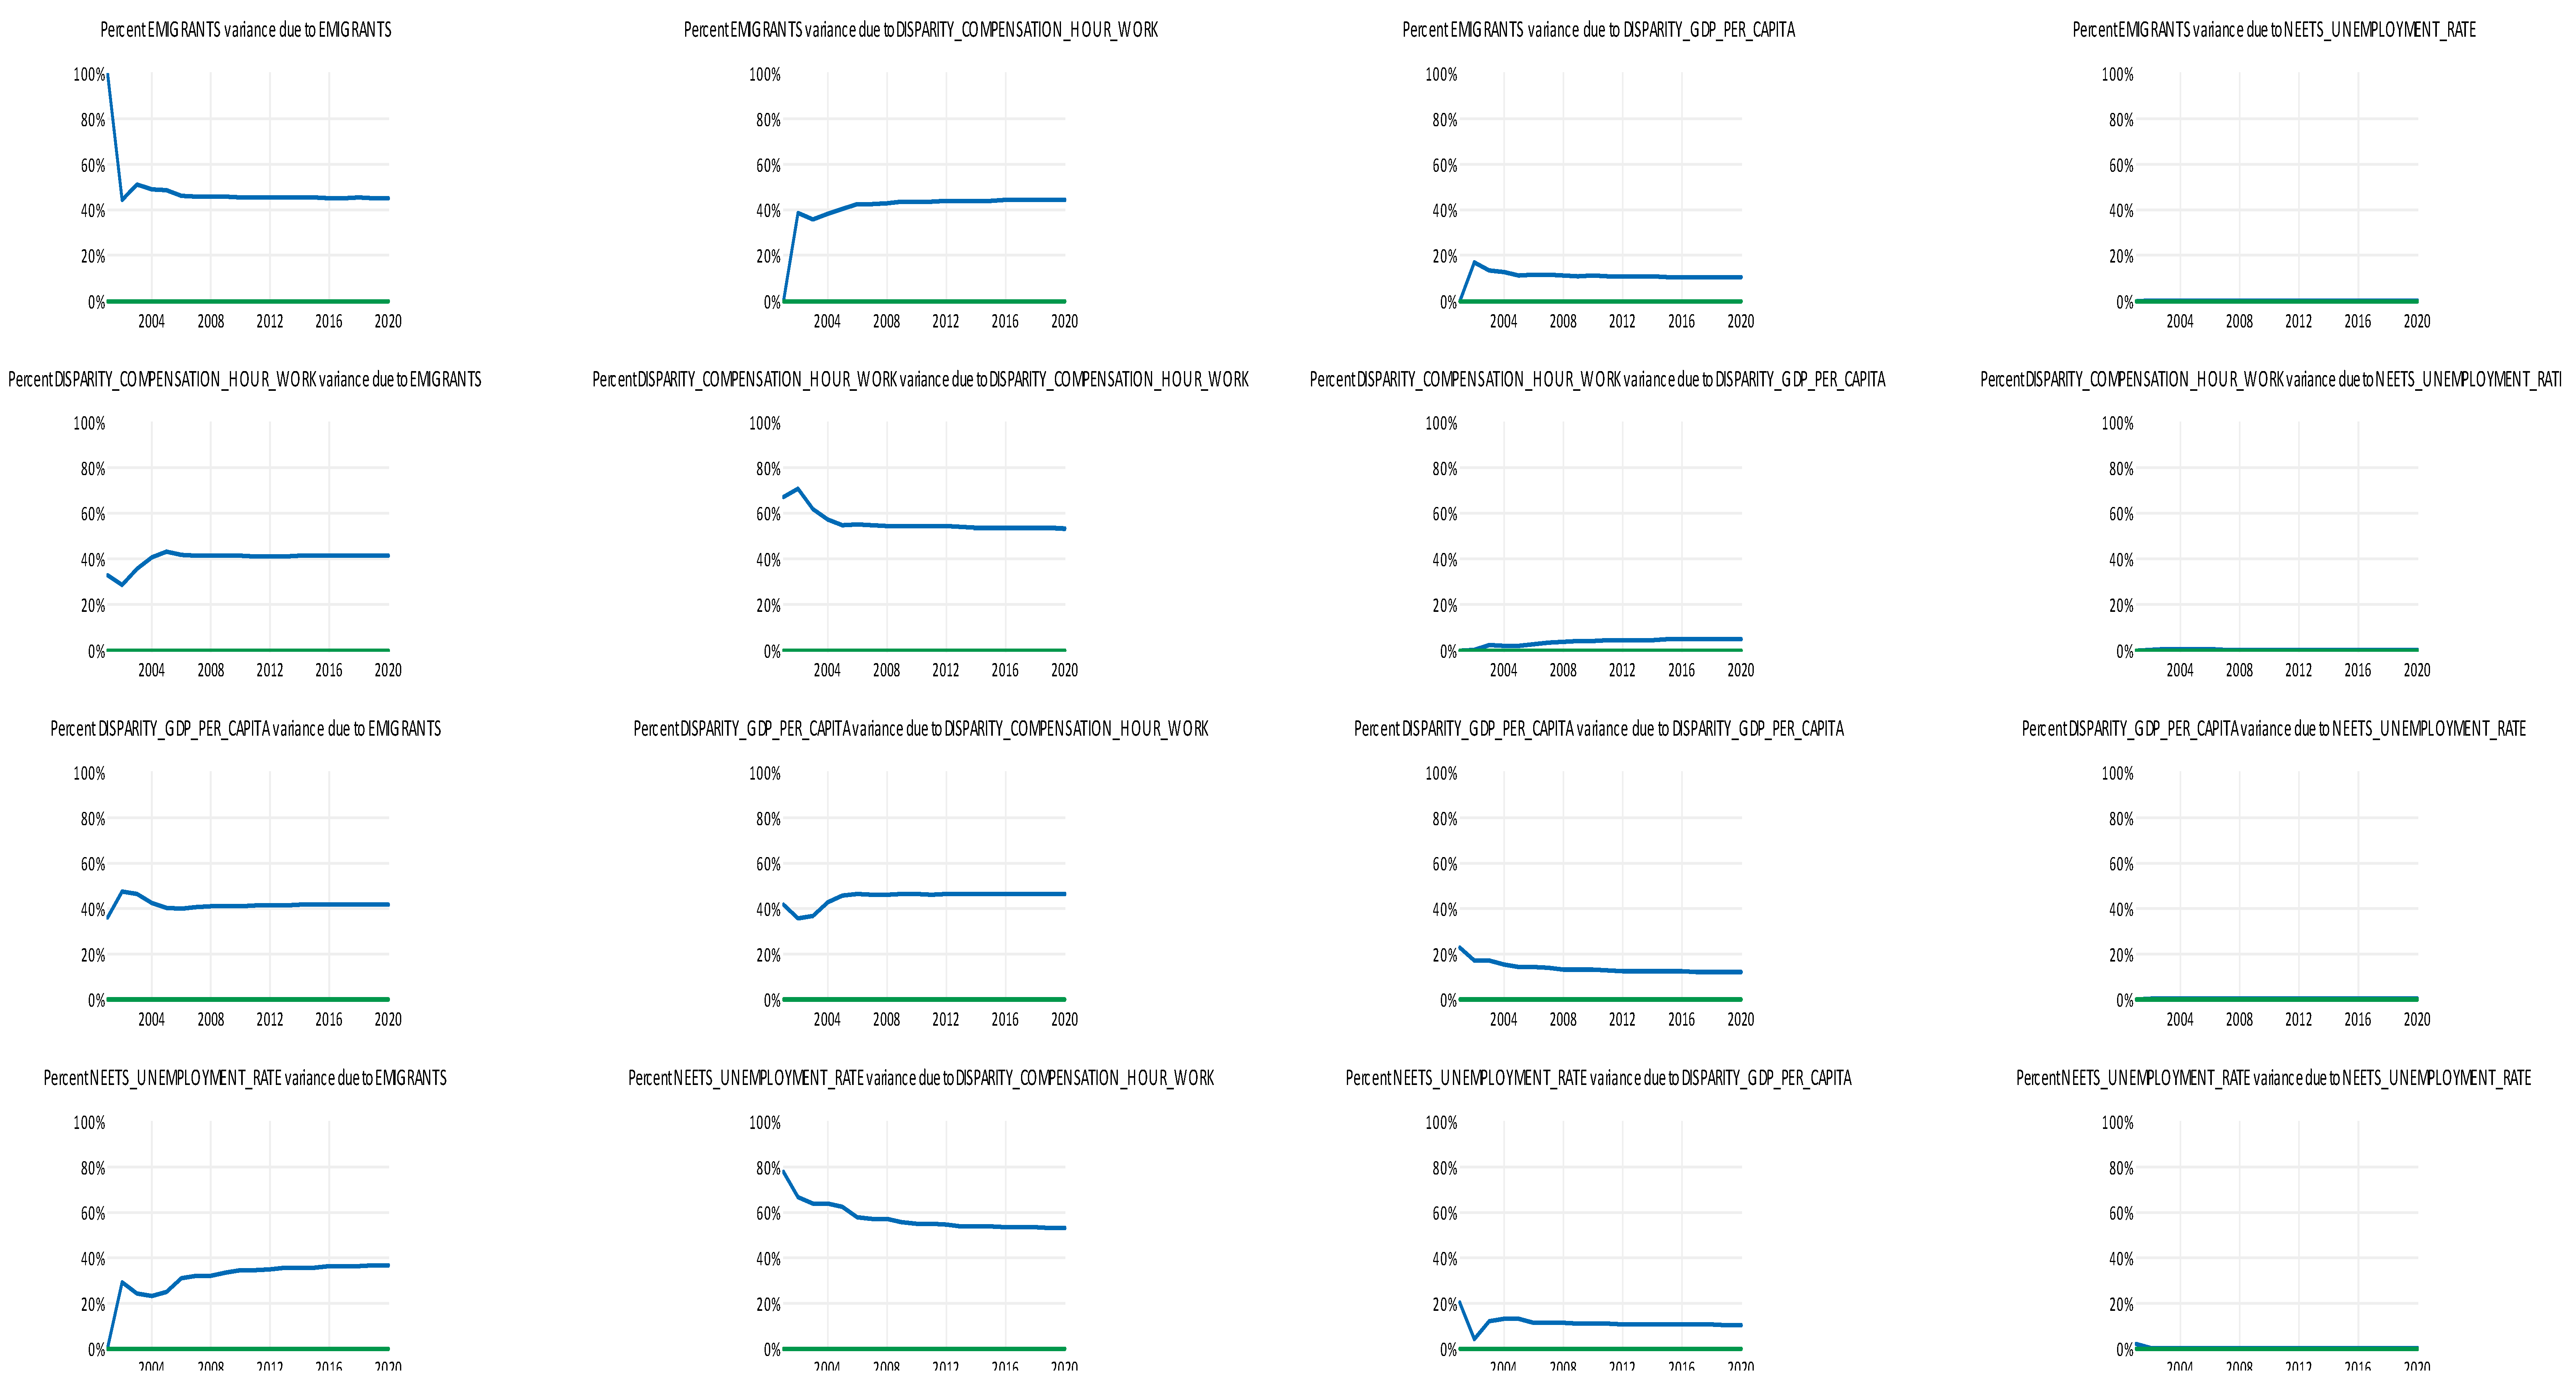
The variance decomposition can be seen in
Figure 13:
The forecast of the migration process in Romania based on the VAR 1 model (
Table 14) can be seen in
Figure 14.
5. Results
Following the study conducted on the forecast of the migration process in Romania, a linear regression model (Model 1) and a VAR-type model (Model VAR 1) were selected.
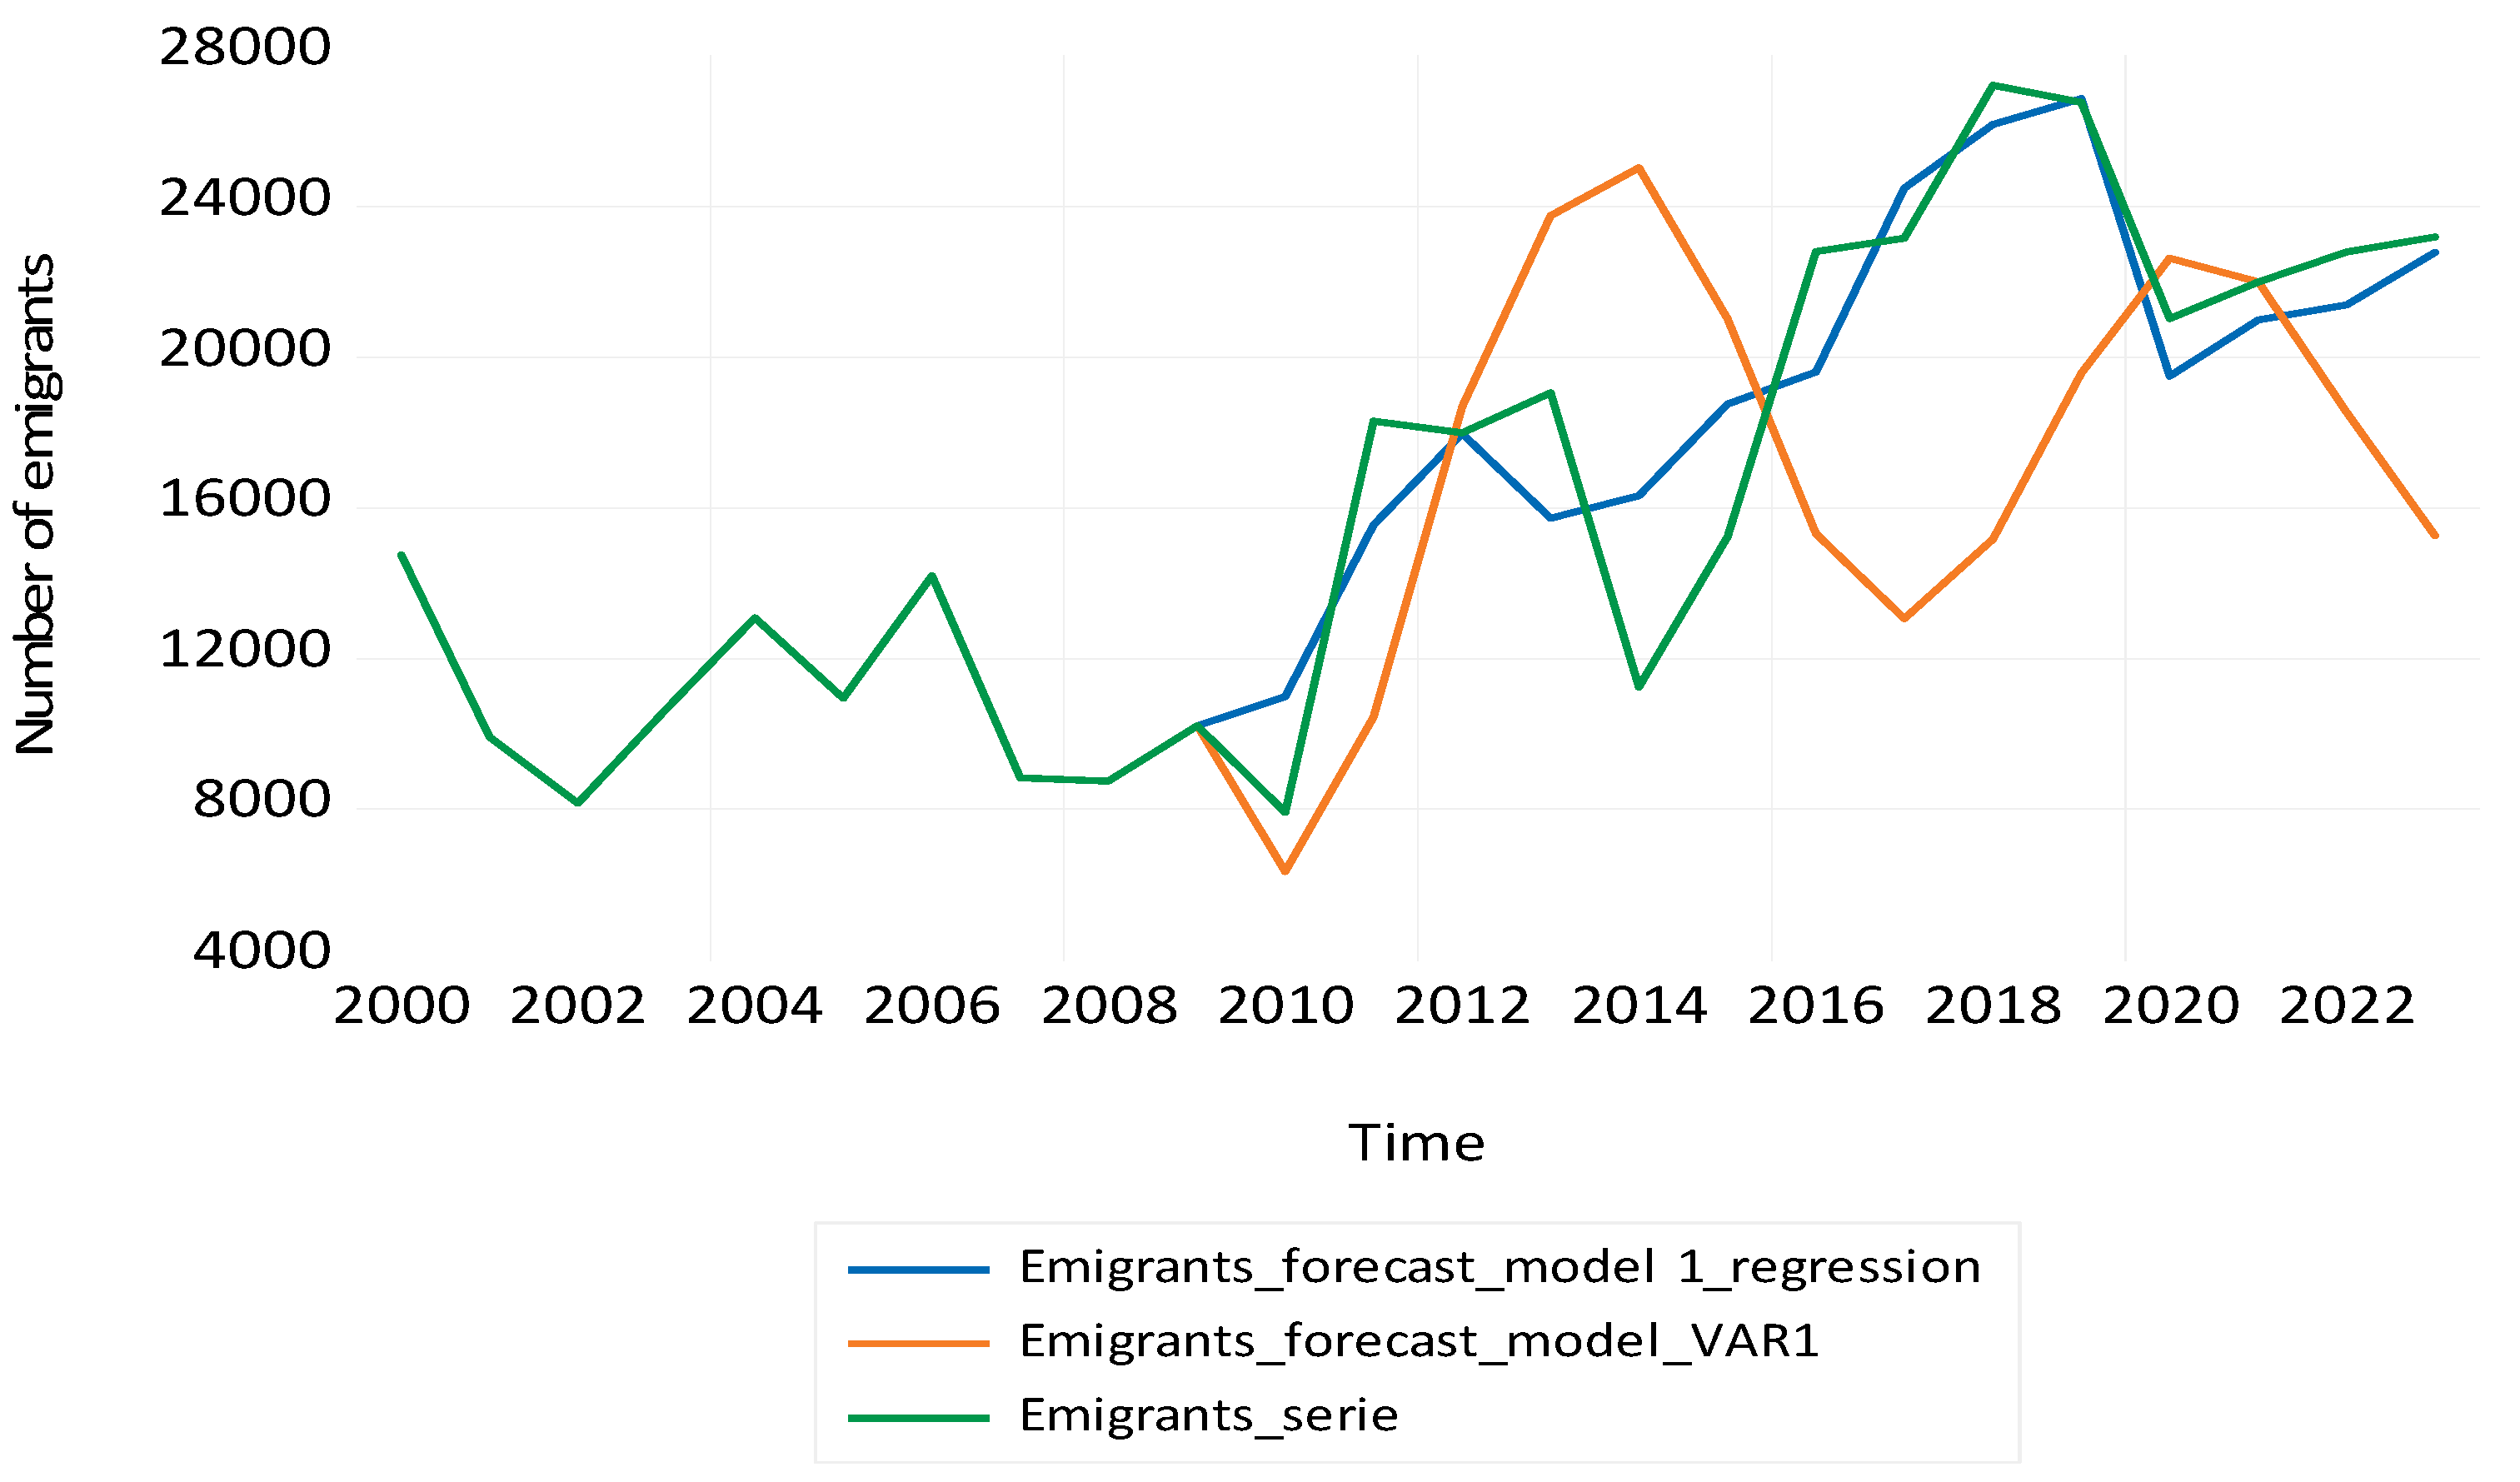
By comparing the two models, chosen with the help of the EViews software, and by opening both forecasts for emigrants by the linear regression method and by the VAR type method, the following results are obtained (
Figure 15):
Therefore the best model for forecast migration process in Romania is Model 1 of linear regression.
This model gives us the opportunity to estimate the values of the migration process in Romania, which is of great practical importance for central government bodies to adapt their migration policies and strategies according to these projected values to mitigate the negative effects of migration on the national economy.
Moreover, the existence of a model that predicts how the migration process will evolve is very useful for any state and for adapting its migration policy according to the expected results that can be estimated for the next period.
6. Discussion
Summarizing the study, we conclude that migration is a phenomenon inseparable from our daily lives, and this is due to factors such as globalization and technical progress. Today’s migration takes on diverse forms, and the causes of migration are increasingly different. Based on the conducted studies, we found that the economic factors are the main factors driving Romanians to become migrants: low wage incomes and lack of employment opportunities. In such a difficult environment, migration is seen as a survival strategy.
One of the positive effects of migration could be considered the money transfers to the families remaining in the country, and thus the migration contributes to ensuring a decent standard of living. Migrants, once they return home, bring not only money, but also new development ideas, new knowledge and entrepreneurial skills that have been acquired as a result of migration. In this way, they obviously contribute to the modernization of the country.
However, migration can also have negative effects, such as the exodus of highly qualified staff or very smart young people who went abroad to study and who mostly stay there and do not return home, but also the decline and aging of the population. Another real phenomenon in Romania, with some special negative consequences in the medium and long term is that of children and the elderly left at home without care; a whole generation that grew up without parents because they went to work abroad and the children were raised by grandparents or other relatives, which is a real social danger because they suffer real psychological traumas. They feel abandoned by their parents and will not have solid family landmarks in their adult lives.
Furthermore, labor migration causes changes in the structure of the employed population in Romania, which has recently faced an acute shortage of specialists in certain fields such as health, construction, but also installers, electricians or HORECA. In recent years, to cover this lack of staff in these fields of activity, Romania has called on workers from Asian countries, such as the Philippines, Afghanistan, Nepal, Pakistan, etc. In order to reduce the emigration of specialists from certain sectors of activity, a series of specific strategies must be implemented and improved. As a result of migration, entire rural areas are transforming and changing their ethnic and cultural identity.
The migration process has become particularly important for Romania in the last 20 years, and its socio-economic, political and cultural effects affect the Romanian state, which is why flexible policies are needed to manage it. To be coherent, we need to have as our main purpose keeping in the country specialists in certain basic economic fields, as well as measures to determine the return of specialists and students who have left to study abroad.
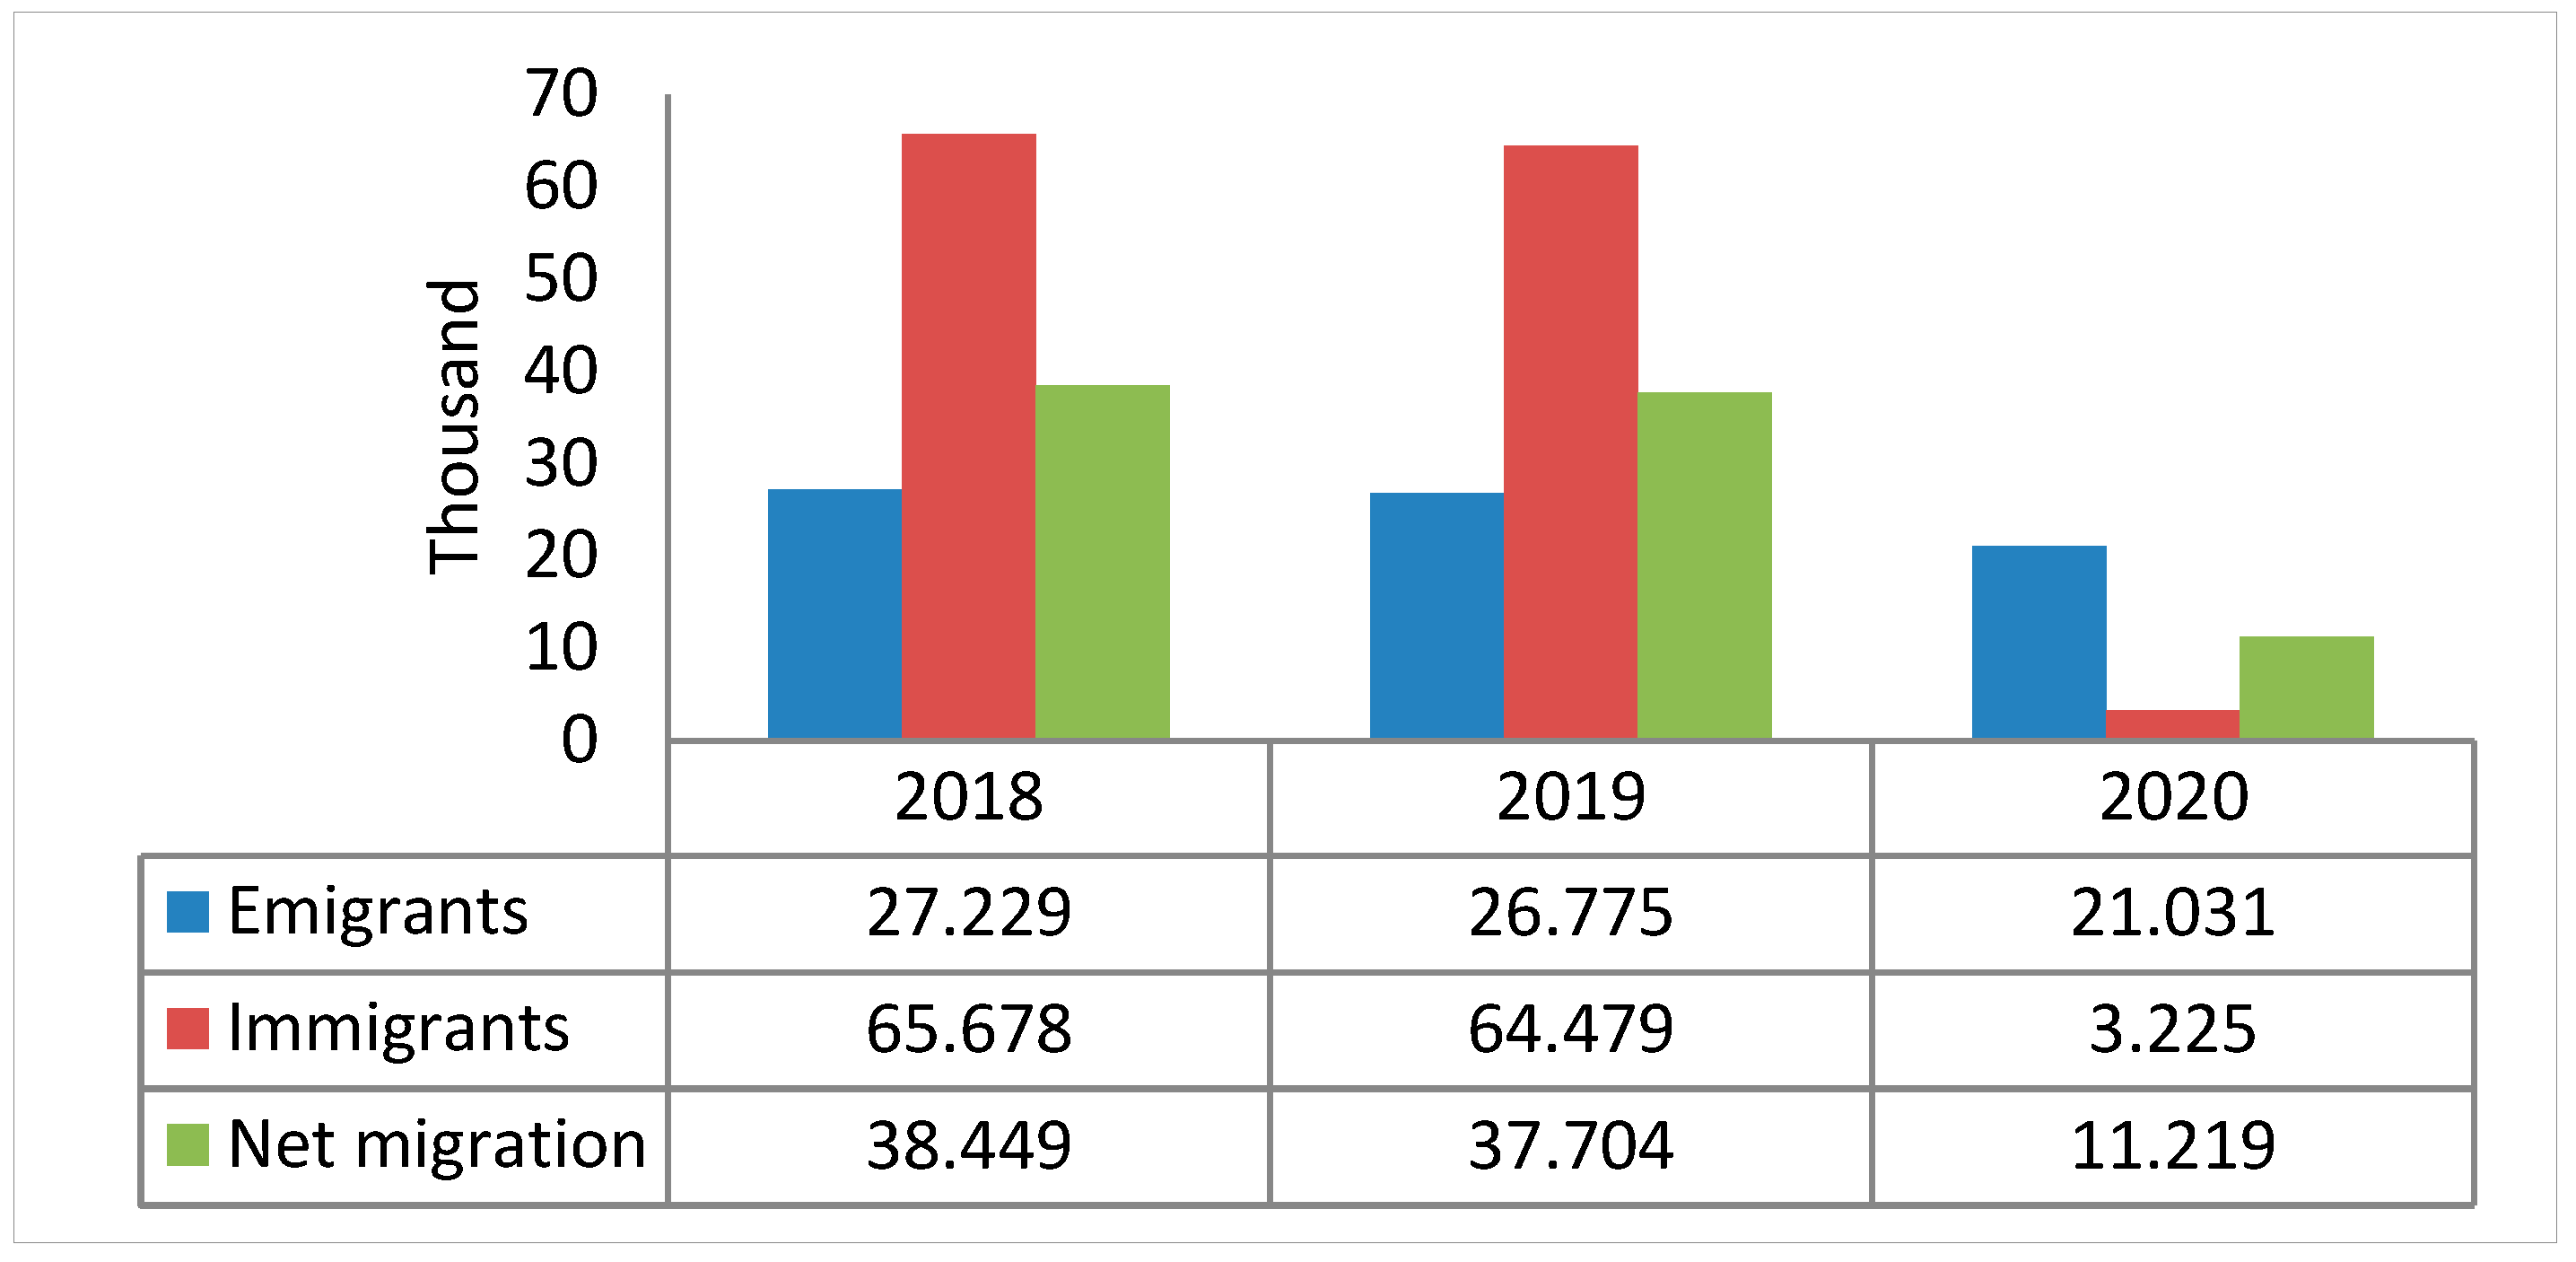
The migration situation in Romania in the pandemic context can be better highlighted with the help of the graph in
Figure 16.
As can be seen, in the case of Romania, the number of emigrants decreased in 2020 by about 5.75 thousand people compared to the previous year, 2019, which represents a significant reduction in the migratory flow by approximately 21.5%. Regarding the flow of immigrants to Romania, their number also decreased by over 32 thousand people, which represents a reduction of approximately 50% compared to the previous year. Net migration in the year of the pandemic decreased to just over 11 thousand people compared to about 38 thousand people in the previous year, which shows a reduction of over 70%, this being the combined result due to the decrease in both the number of emigrants, as well as the number of immigrants. Thus, the pandemic significantly influenced migration from Romania in 2020 as a result of traffic restrictions and the introduction of the green certificate in most destination states of Romanian migrants, as well as due to psychological factors induced by the pandemic at the Indian level, visually and collectively, but also as a result of the restriction of economic activity in the emigration countries. Thus, the emigrants encountered a series of increased difficulties in finding a job.
This reduction in migration from Romania has an important impact on the standard of living of those families who depend on income earned abroad and who suddenly saw themselves without a source of income.
Although the impact of the pandemic on migration has been quite significant, it seems that in the future at least some of the people working abroad intend to emigrate again, in search of a higher income. This will also include Romania, because they have become accustomed to a different standard of living, a different education system and a different health system. Therefore, we intend to study in our future research whether the reduction of migration to and from Romania in the pandemic context was just the manifestation of a shock felt in 2020 or if this downward trend will continue in the future—or, vice versa, whether it may increase and return to values even higher than in the year before the 2019 pandemic due to people’s desire to return to the life they led before the pandemic and to try to recover the lost income in the period 2020–2021. This trend may perhaps be due to increased poverty and the living conditions in the post-pandemic period, with Romania facing a high inflation in 2021 as a result of the increase of the prices for fuels and energy and for all the basic products.
7. Conclusions
Romania’s migration policy should address the solution of the economic, social, administrative, educational and health problems that underlie the decision to emigrate. Thus, by solving them, the number of those who choose to emigrate can be diminished, as well as the emigration rate. Furthermore, another important aspect of the migration policy in Romania should be the establishment of concrete measures that will determine that those who went abroad to work or study will return to their country, because they will cover some of the necessary specialist shortages in different fields of activity, and that they will return with a series of entrepreneurial skills, but also with a civic spirit, of involvement in solving the problems of local communities, which can ensure a sustainable development of the country. The migration policy in Romania should take into account the fact that globalization inevitably leads to labor force mobility and implicitly to a certain rate of emigration, but also of immigration, and that it should ensure the optimization of the ratio between them, but also concrete measures in order to ensure the integration of immigrants, who are often of other religions and cultures, in society and in local communities.
In Romania, migration is generated mainly by a series of economic factors, as highlighted by the conducted study: the disparities between the salary level and the standard of living in Romania compared to other Central and Western European states, but also the youth unemployment rate (NEETs unemployment). In addition to these economic issues, in order to reduce emigration, Romania should also address a number of issues related to the quality of governance, the transparency and efficiency of central and local public administration, bureaucracy, a society based on meritocracy, but also the modernization of the education system and the medical one.
In order to mitigate the negative effects of migration in Romania, the central administration should consider a migration policy aimed at reducing migration, on the one hand, and aiming at compensating for the lack of specialists in certain fields, on the other hand, by increasing quotas of immigrant workers who can be employed in Romanian companies. It is absolutely necessary to make a permanent update of these contingencies, depending on the evolution of the migration phenomenon. For example, a model of measures that has been adopted in Romania in recent years and that has given remarkable results is the one in the medical field, in which a new salary system that is much closer to the values practiced in the European medical system has been introduced. It stopped the exodus of specialists in the field and sometimes even caused the return of some of those who went abroad. Thus, the application of similar measures in other fields of activity could lead to at least partially solving the acute shortage of specialists.
This study is topical, as it addresses the phenomenon of migration in a pandemic context, and it has both a theoretical applicability, by determining a model that can predict the migration phenomenon in Romania, and a practical one, because it can estimate the values of migration and it enables decision-makers to take the necessary measures to counteract the negative effects of migration on the national economy. Thus, for the decision-makers, knowing the migration trend, in the short and medium term, is useful for adopting specific strategies that encourage specialists from certain sectors of activity to stay in the country or to return from abroad. Moreover, the possibility to forecasting the migration flow is useful for anticipating the necessary labor force in certain fields of activity and updating the legislation in the field and the quotas of immigrant workers that can be employed in Romanian companies.
Given that the impact of the pandemic on the migration process in Romania was significant in 2020, we intend to study in our future research whether the reduction of migration from and to Romania was only temporary, being the manifestation of the shock felt or if the downward trend will continue in the near future. We also intend to study the implications of the emigration and immigration rate, but also the trend of the migration process that could return to the pre-pandemic evolution with increasing values due to the degradation of the macroeconomic climate in Romania, to the increased growth of inflation rate in 2021 and the decrease of the purchasing power of money and therefore of living standards.


 ,
, 


