
Crowd Gathering and Thermal Comfort Research in Different Park Shading Spaces

Abstract
:1. Introduction
2. Materials and Methods
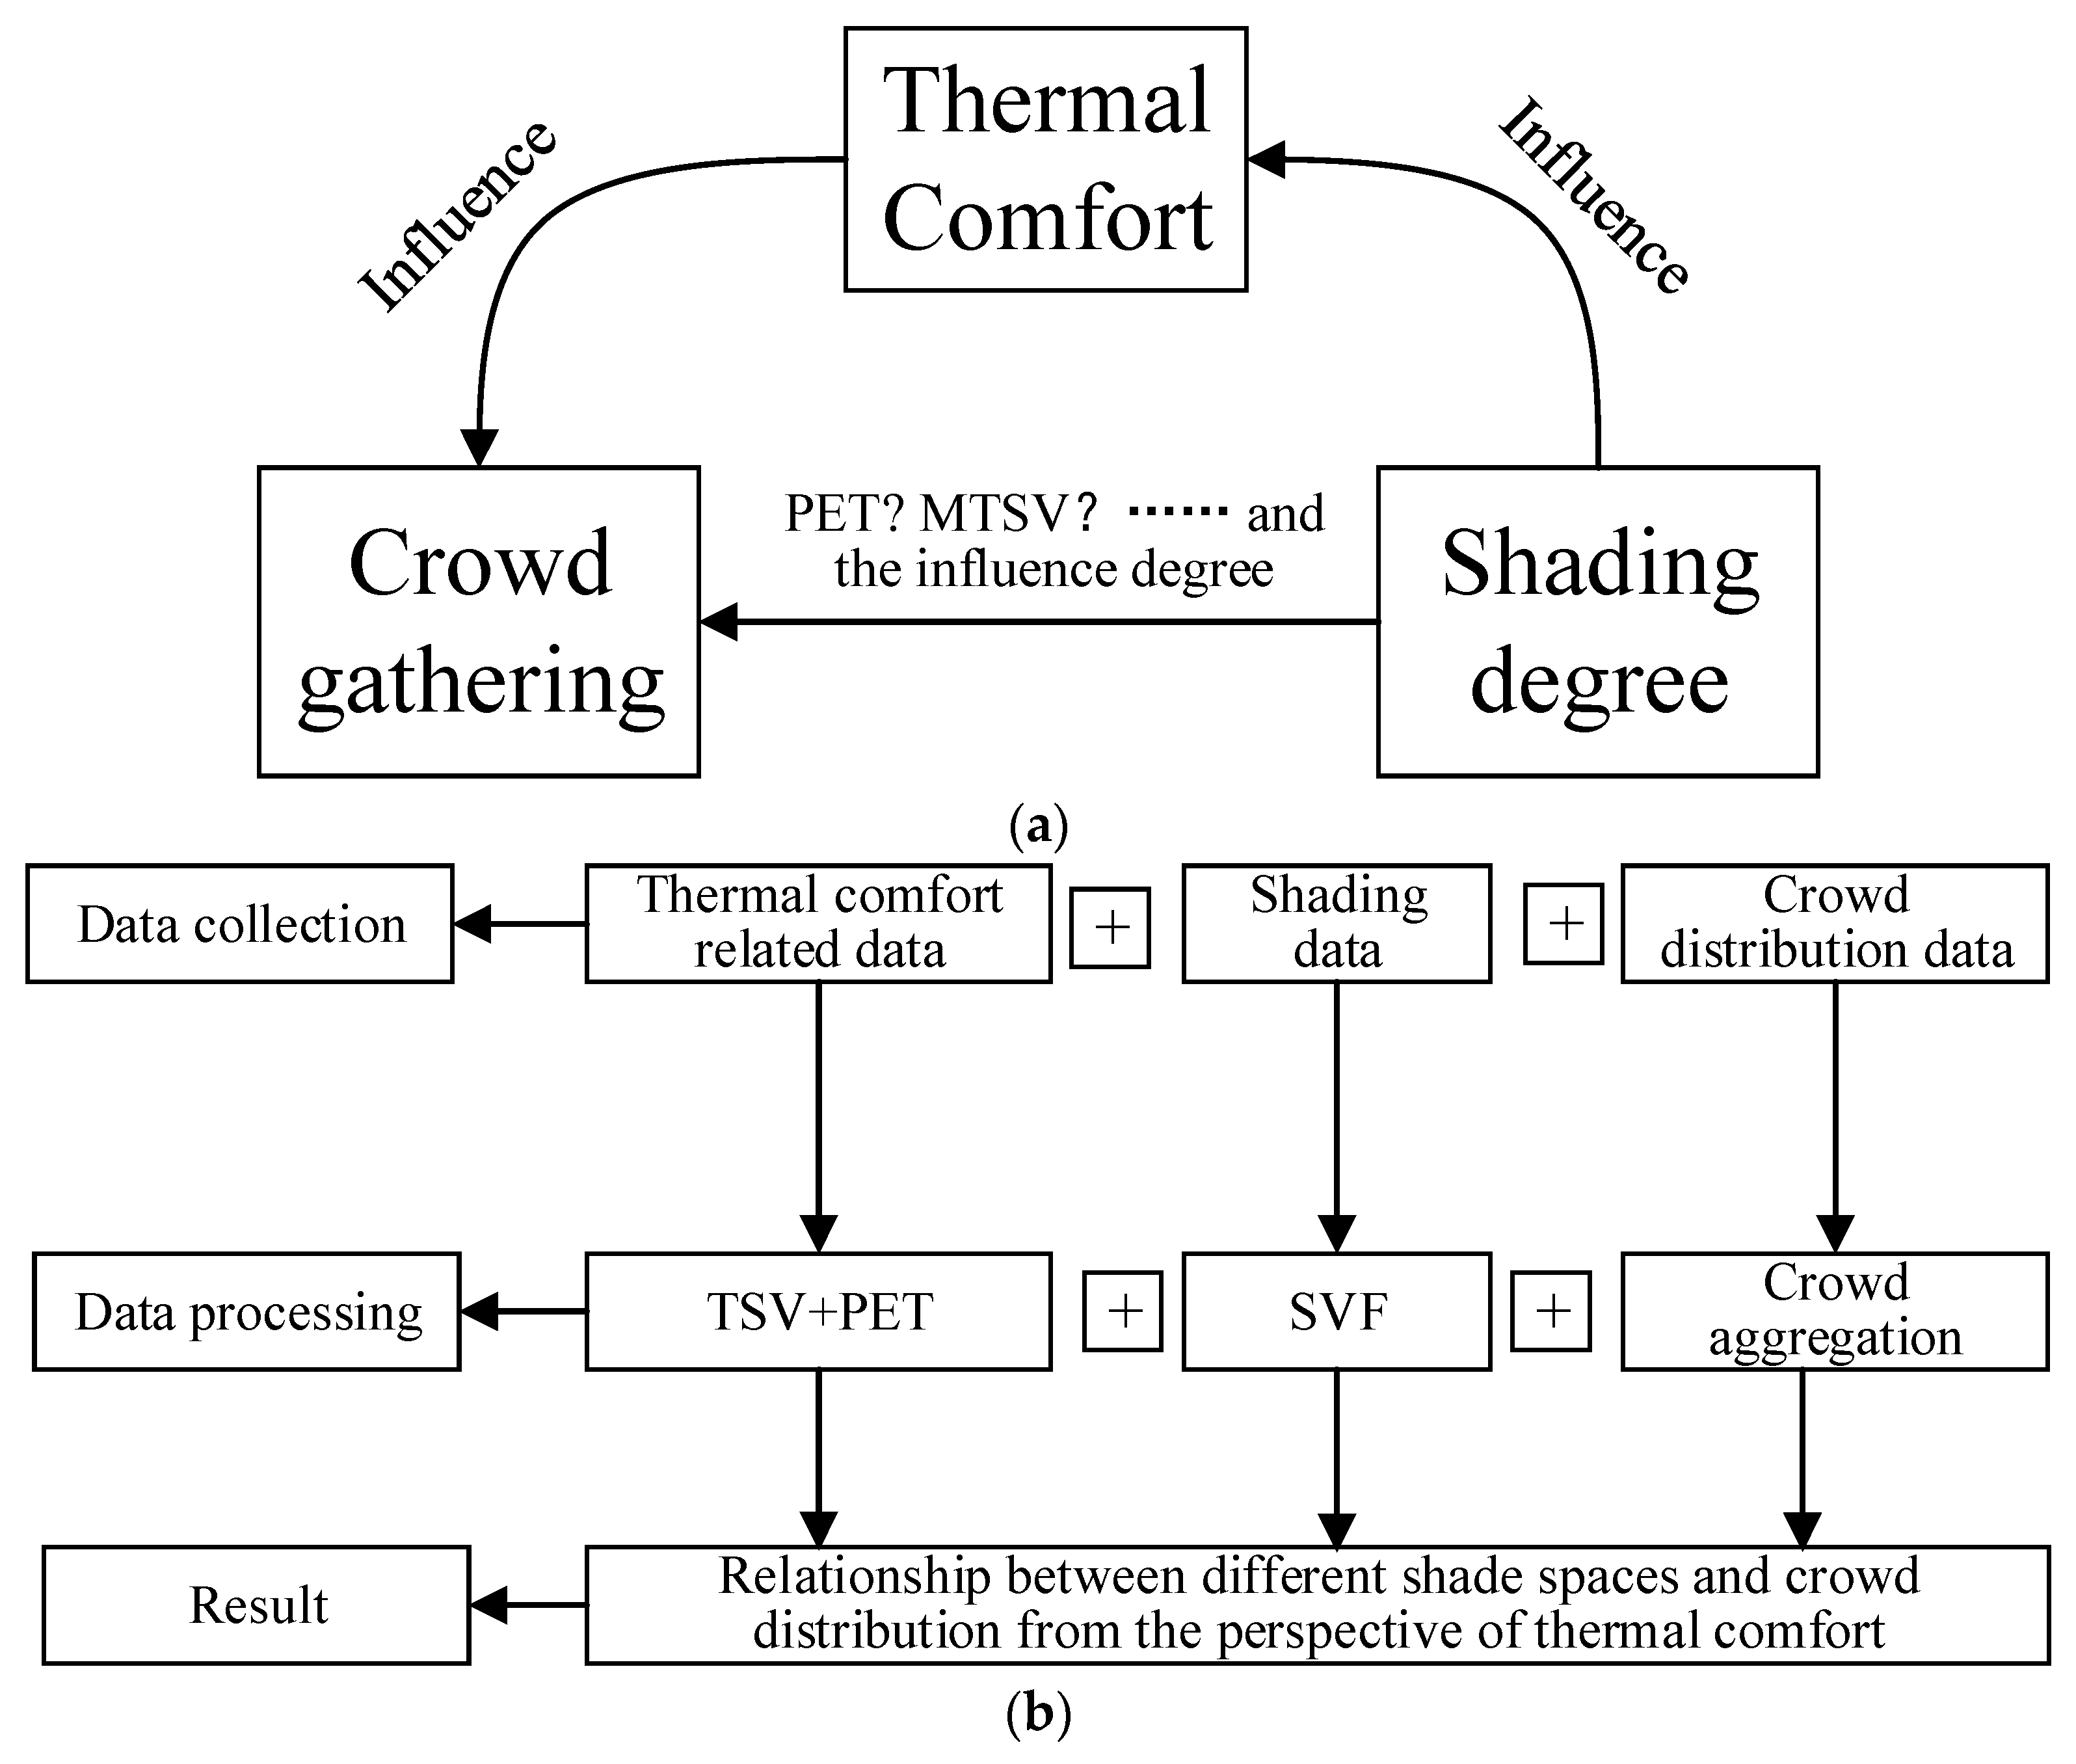
2.1. Research Hypothesis and Research Path
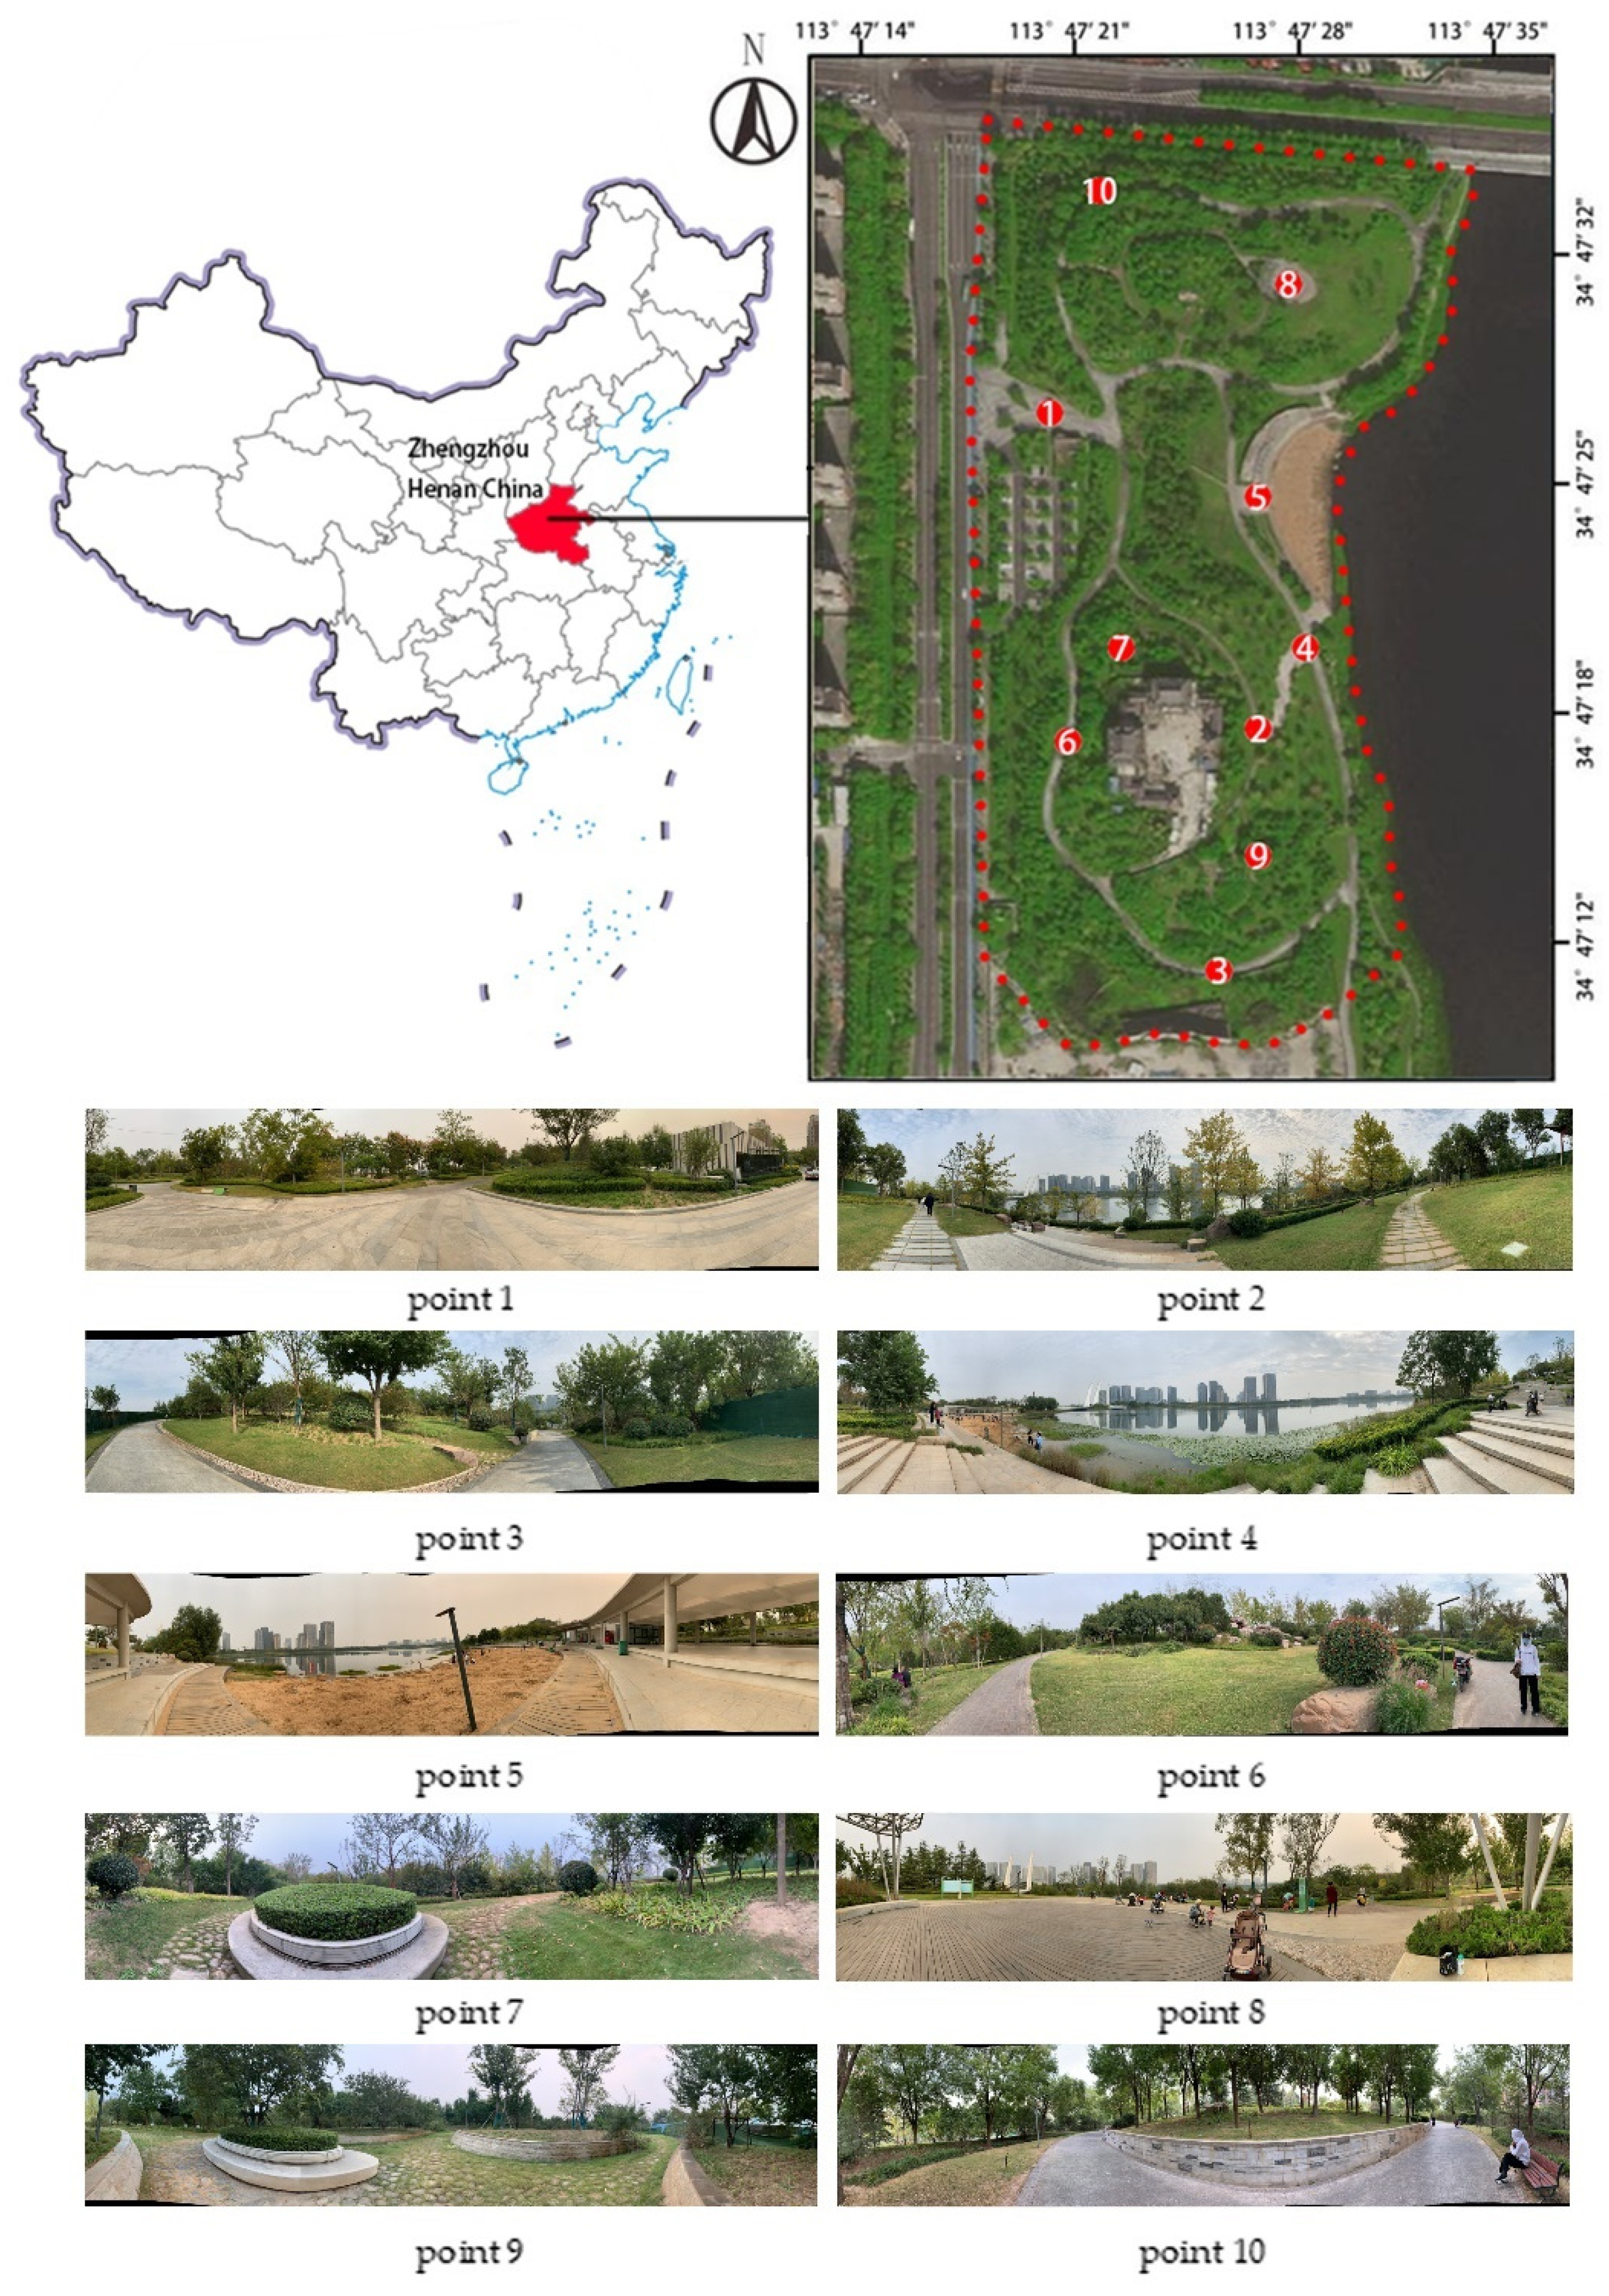
2.2. Research Site
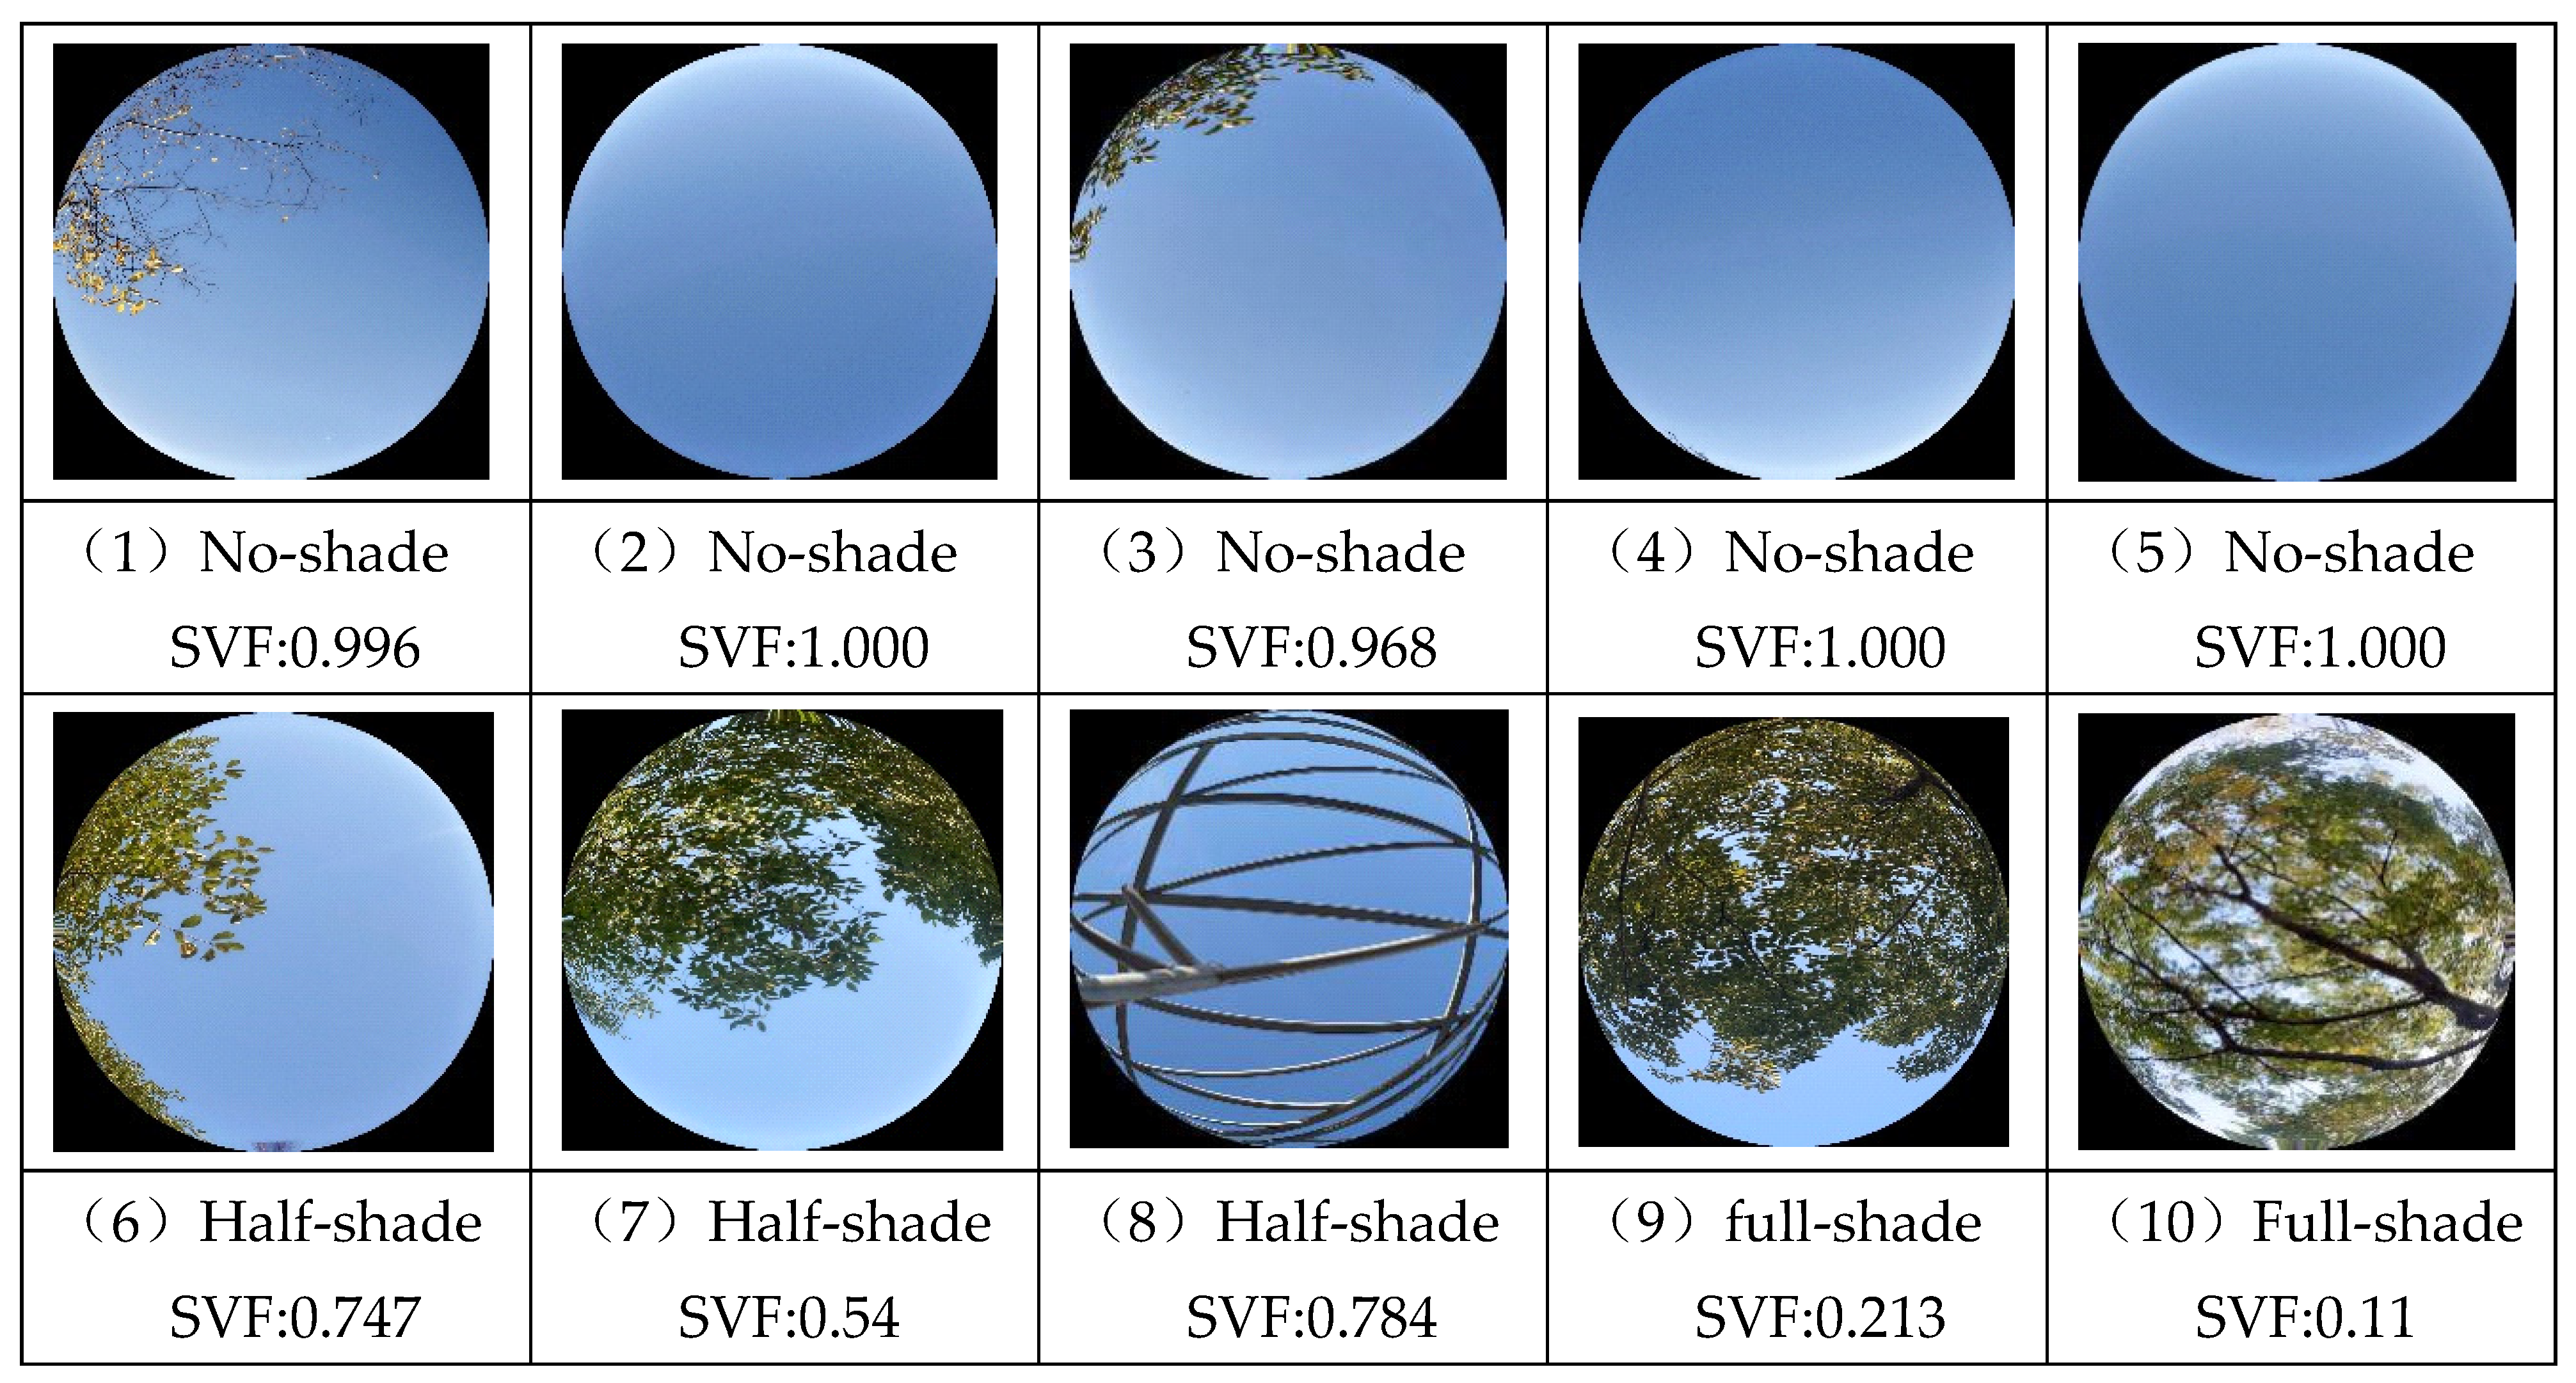
2.3. Data Sources
2.4. Research Methods
3. Research Results
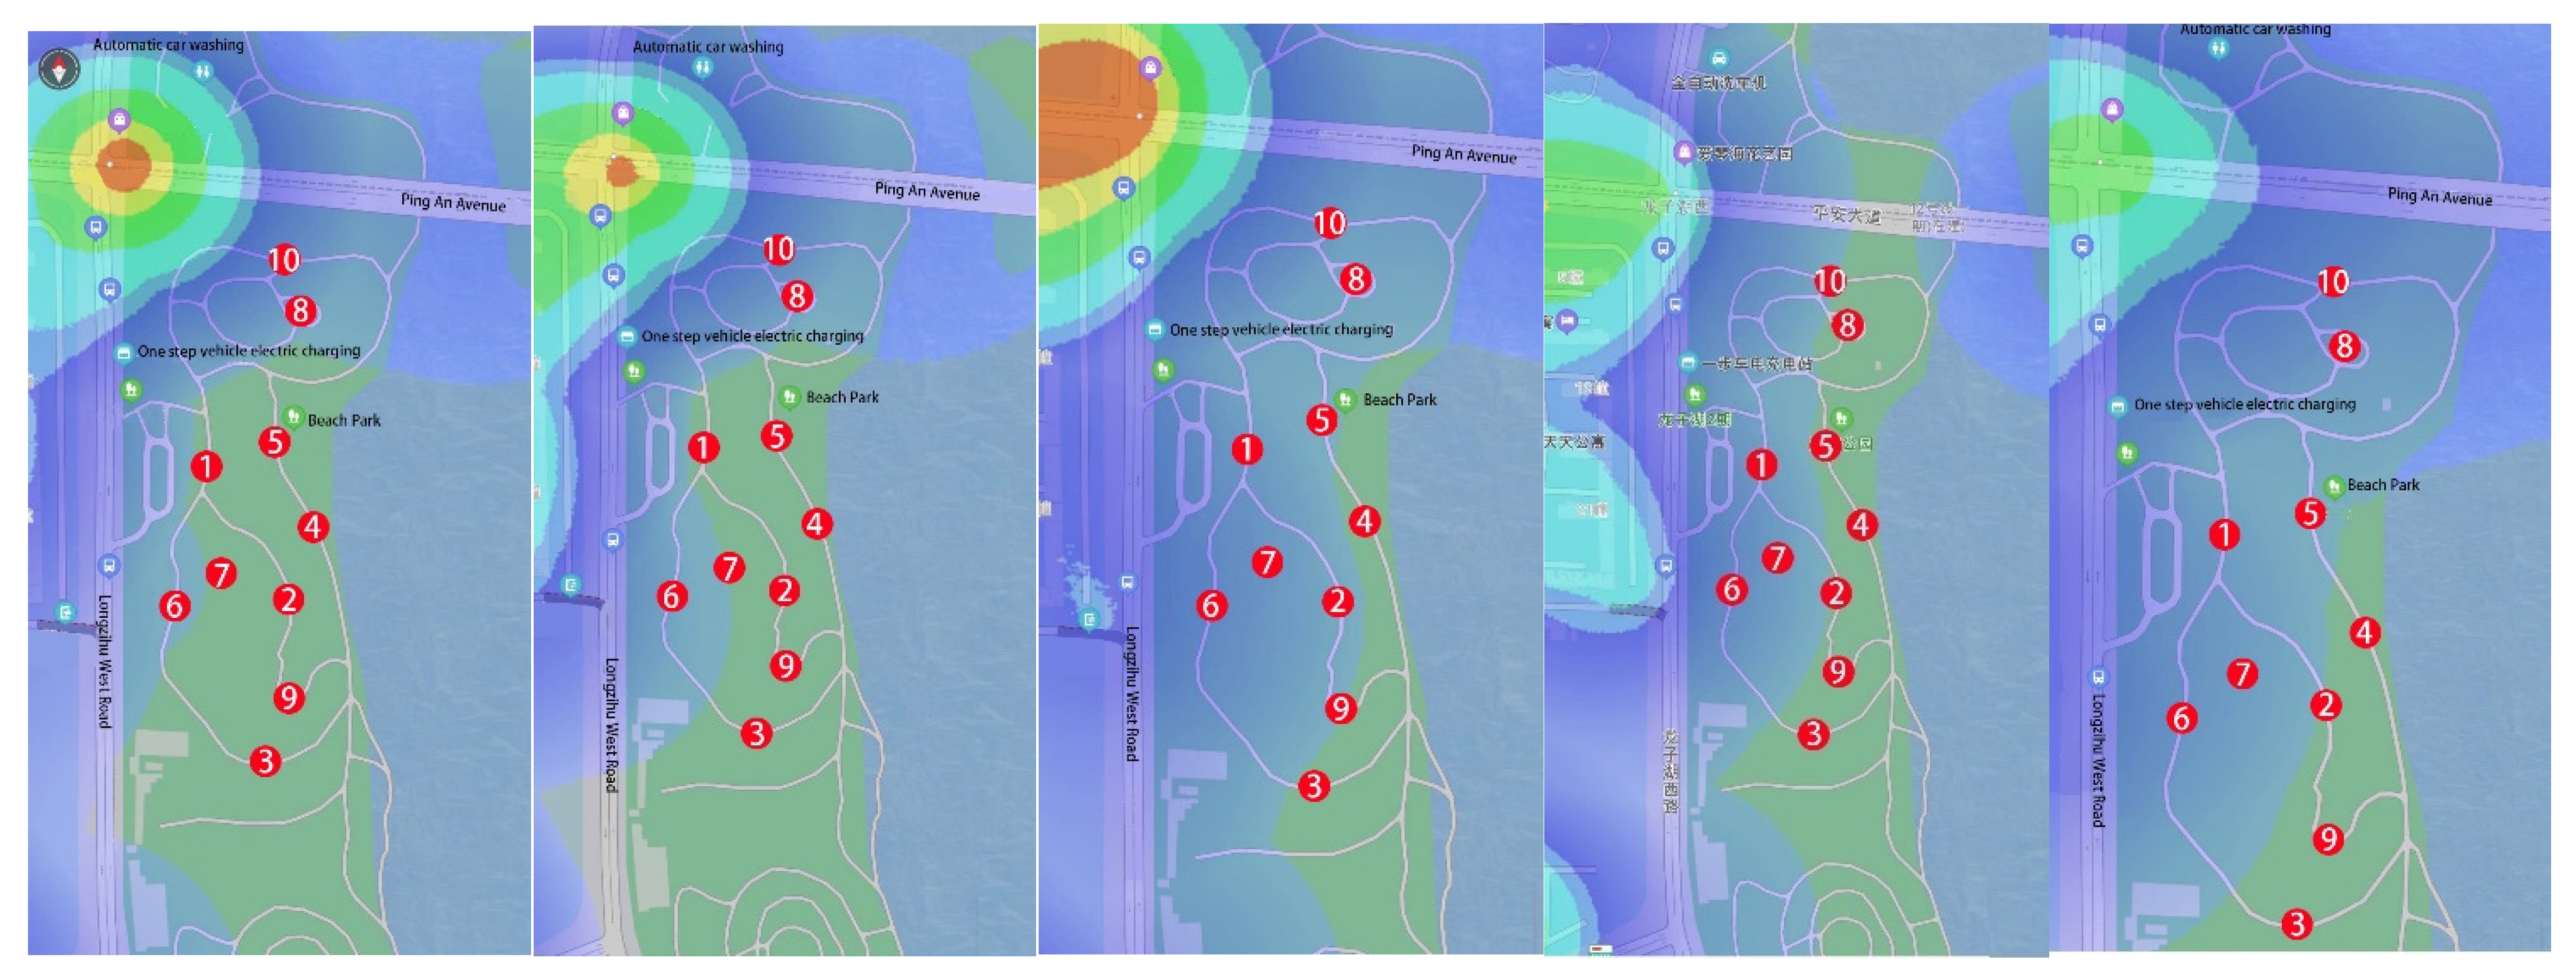
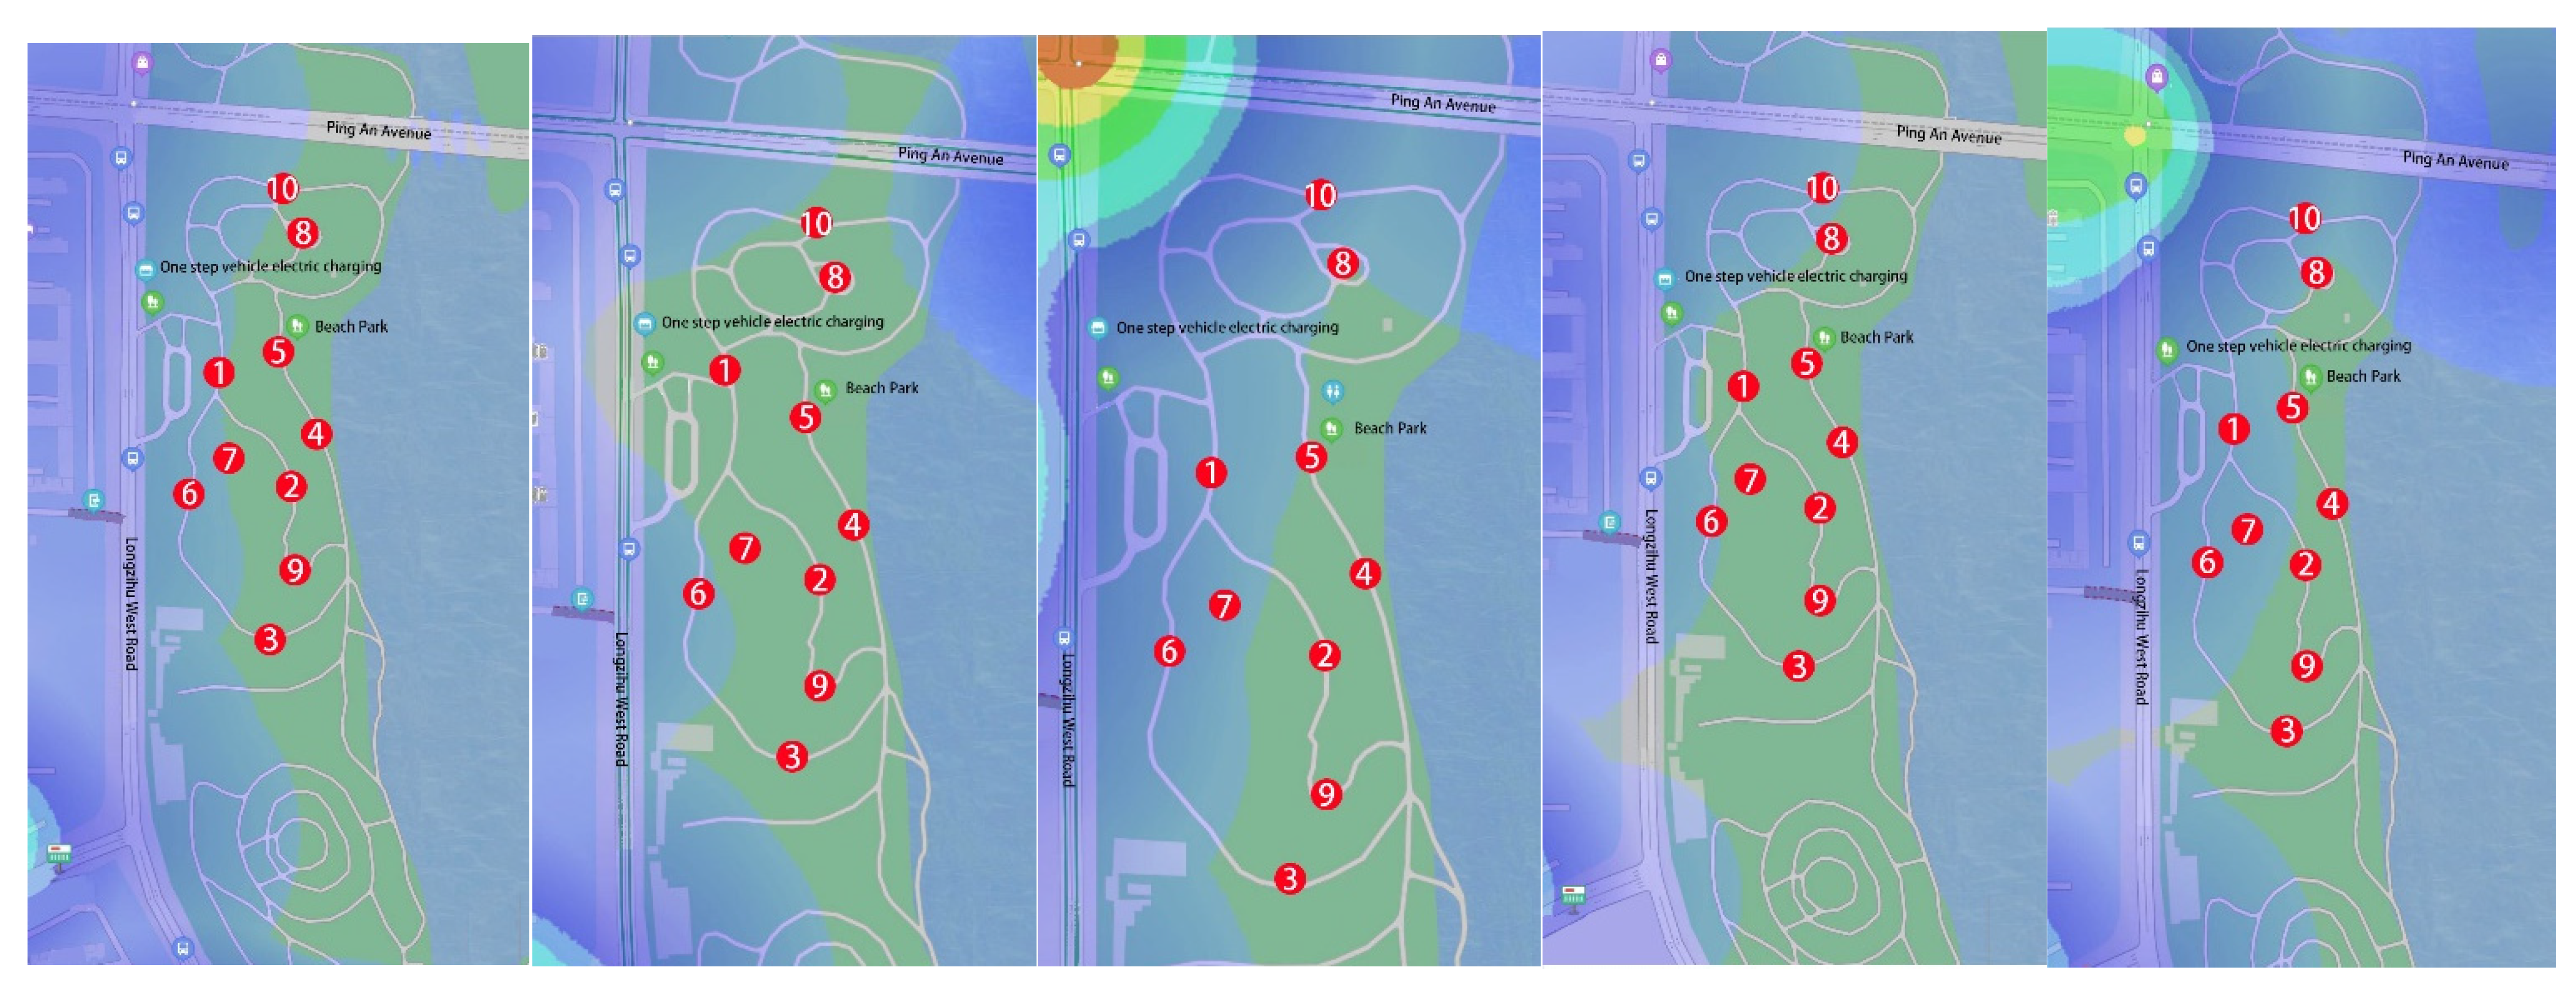
3.1. Crowd Aggregation Analysis
3.2. Park TSV and PET Analyses
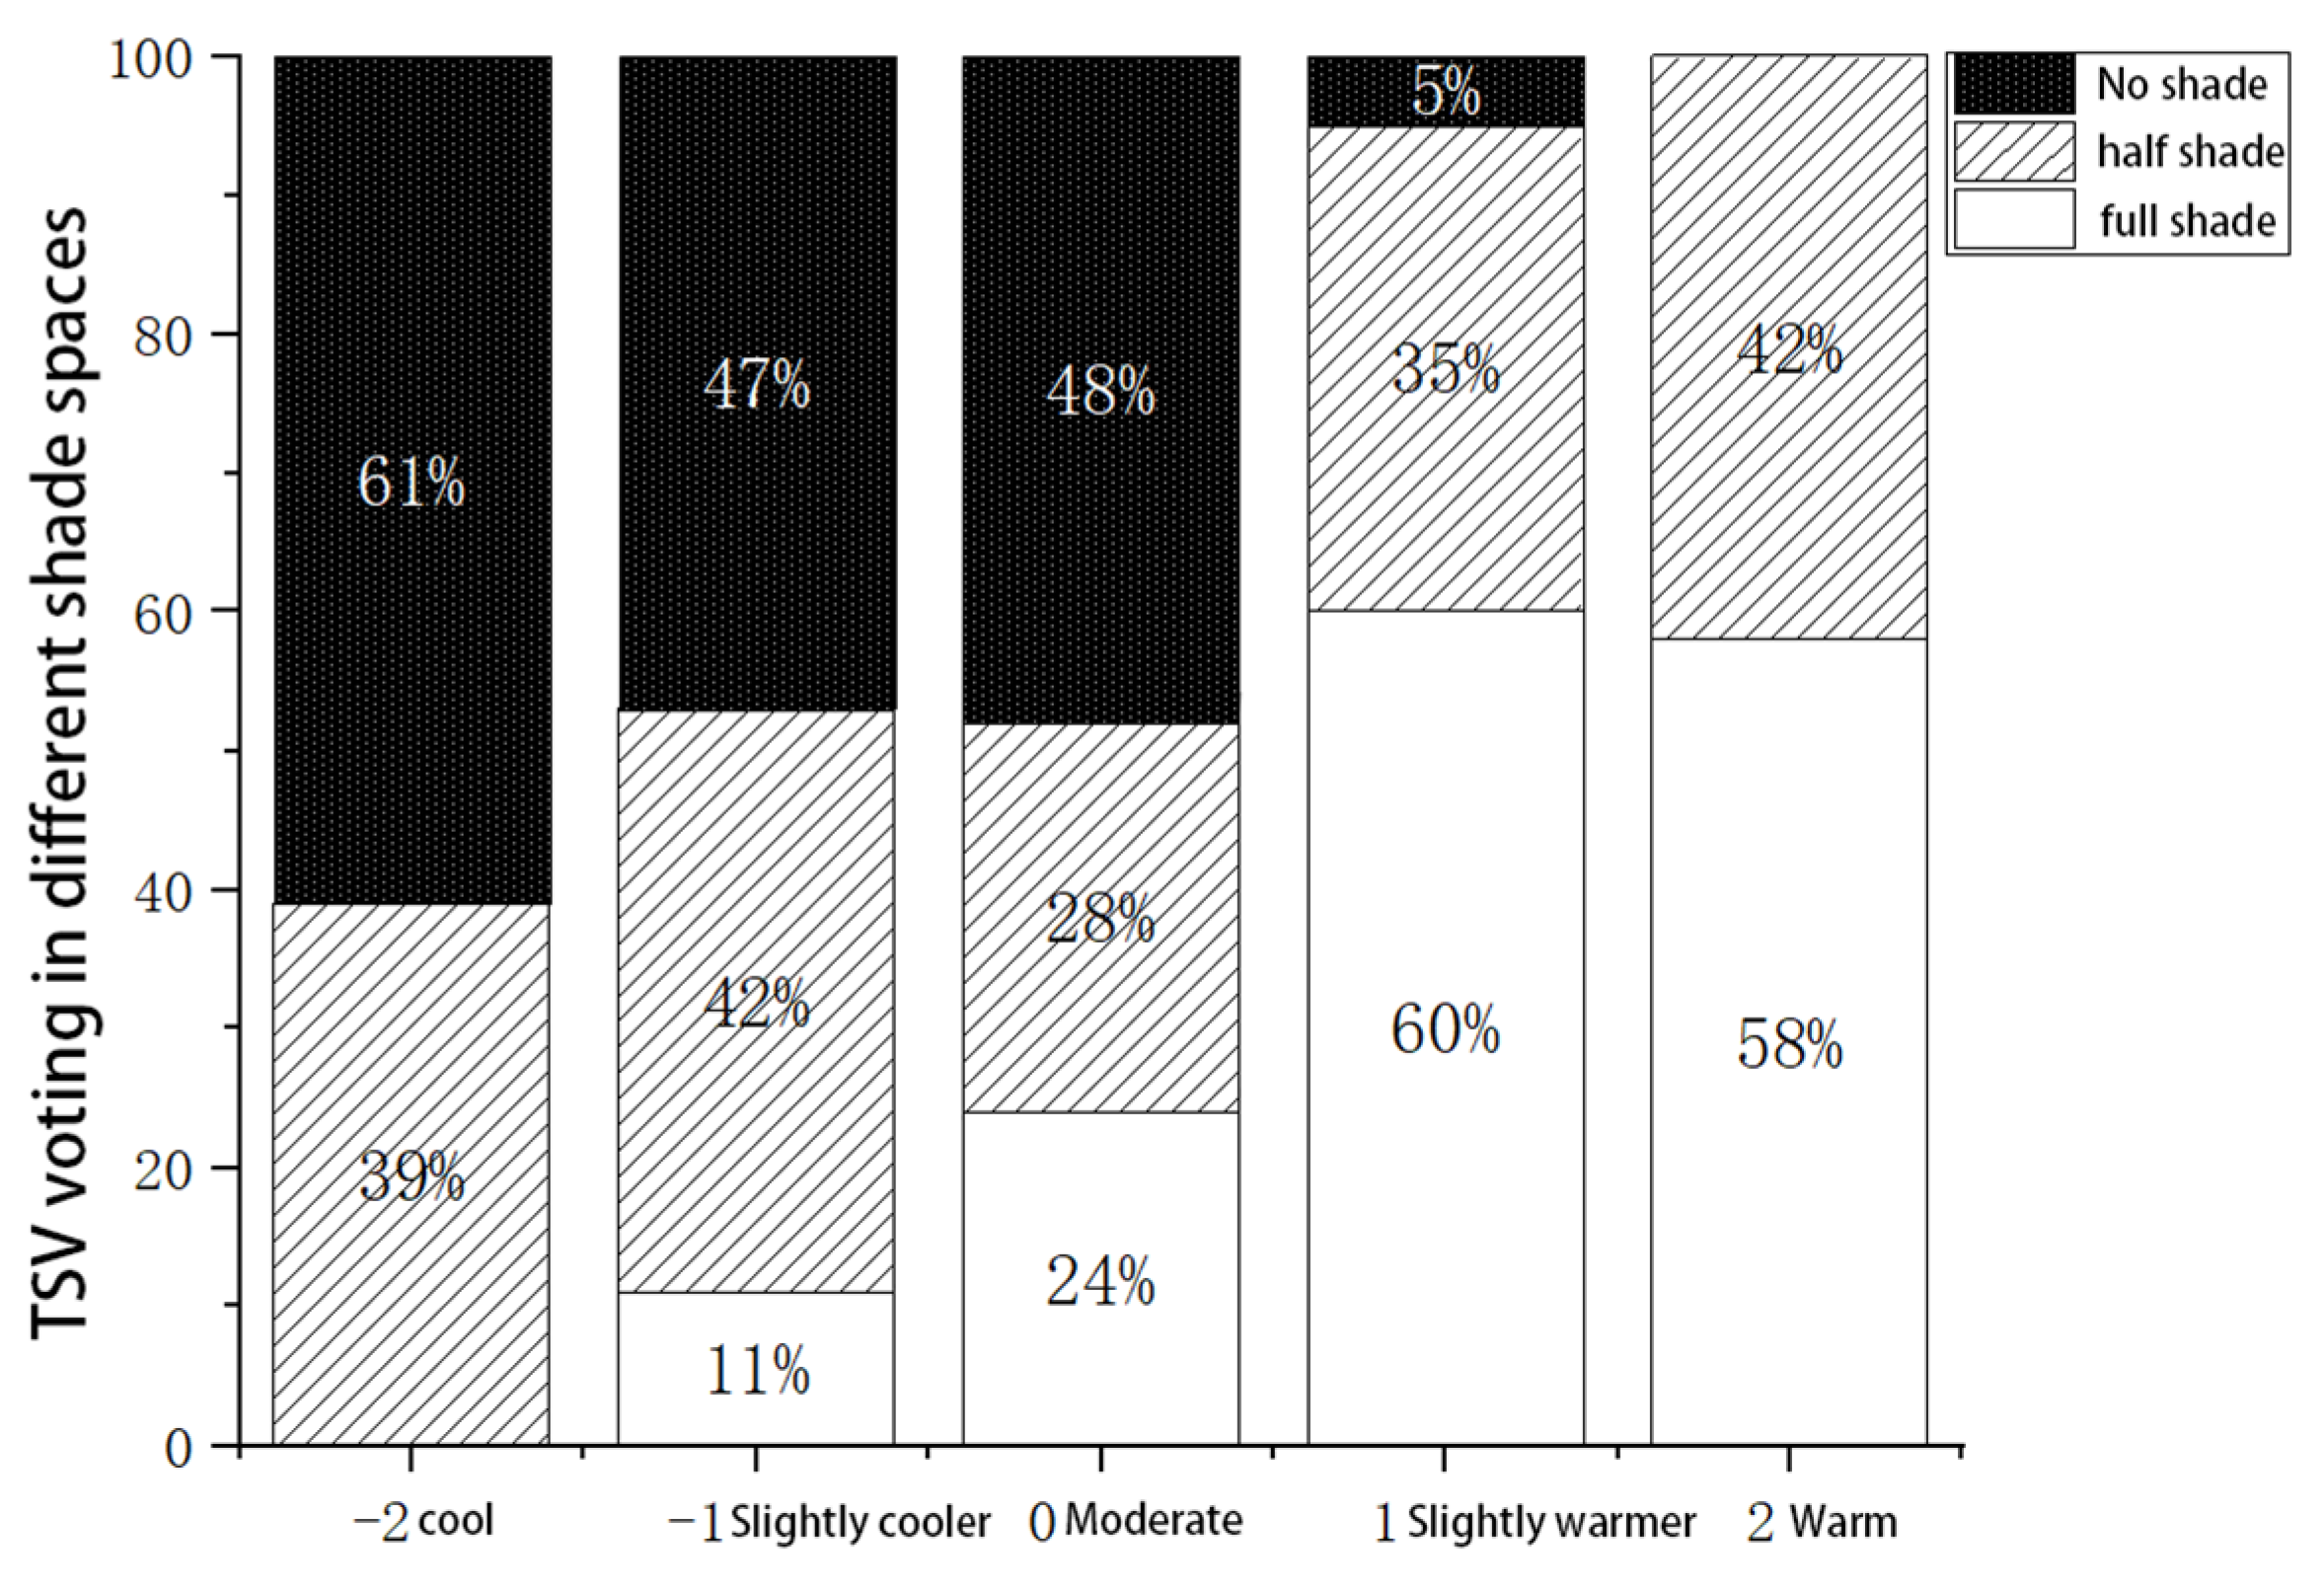
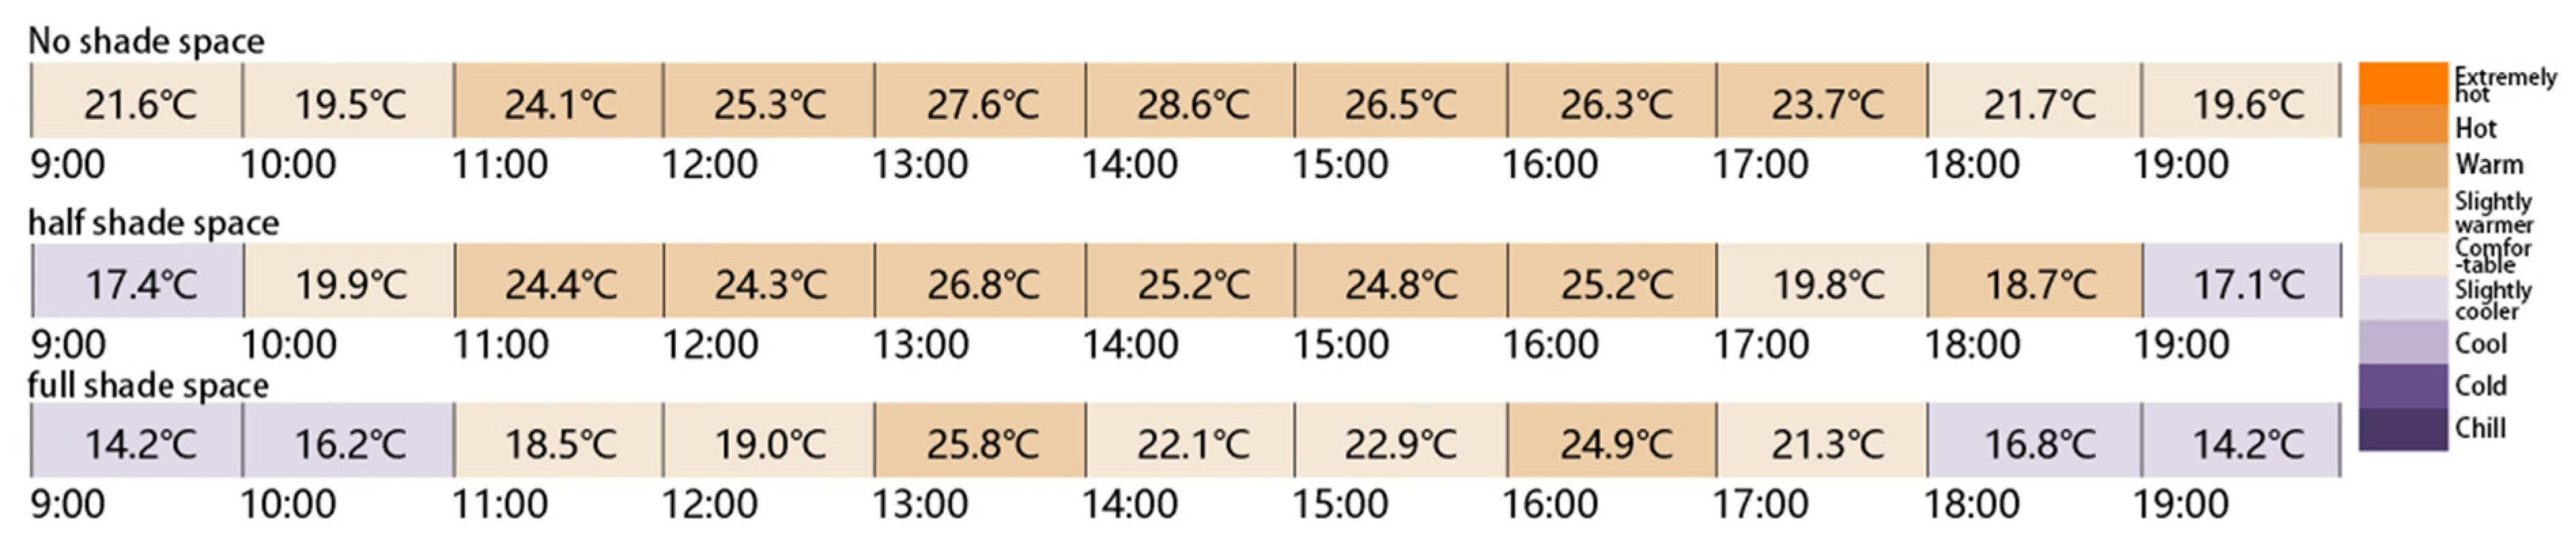
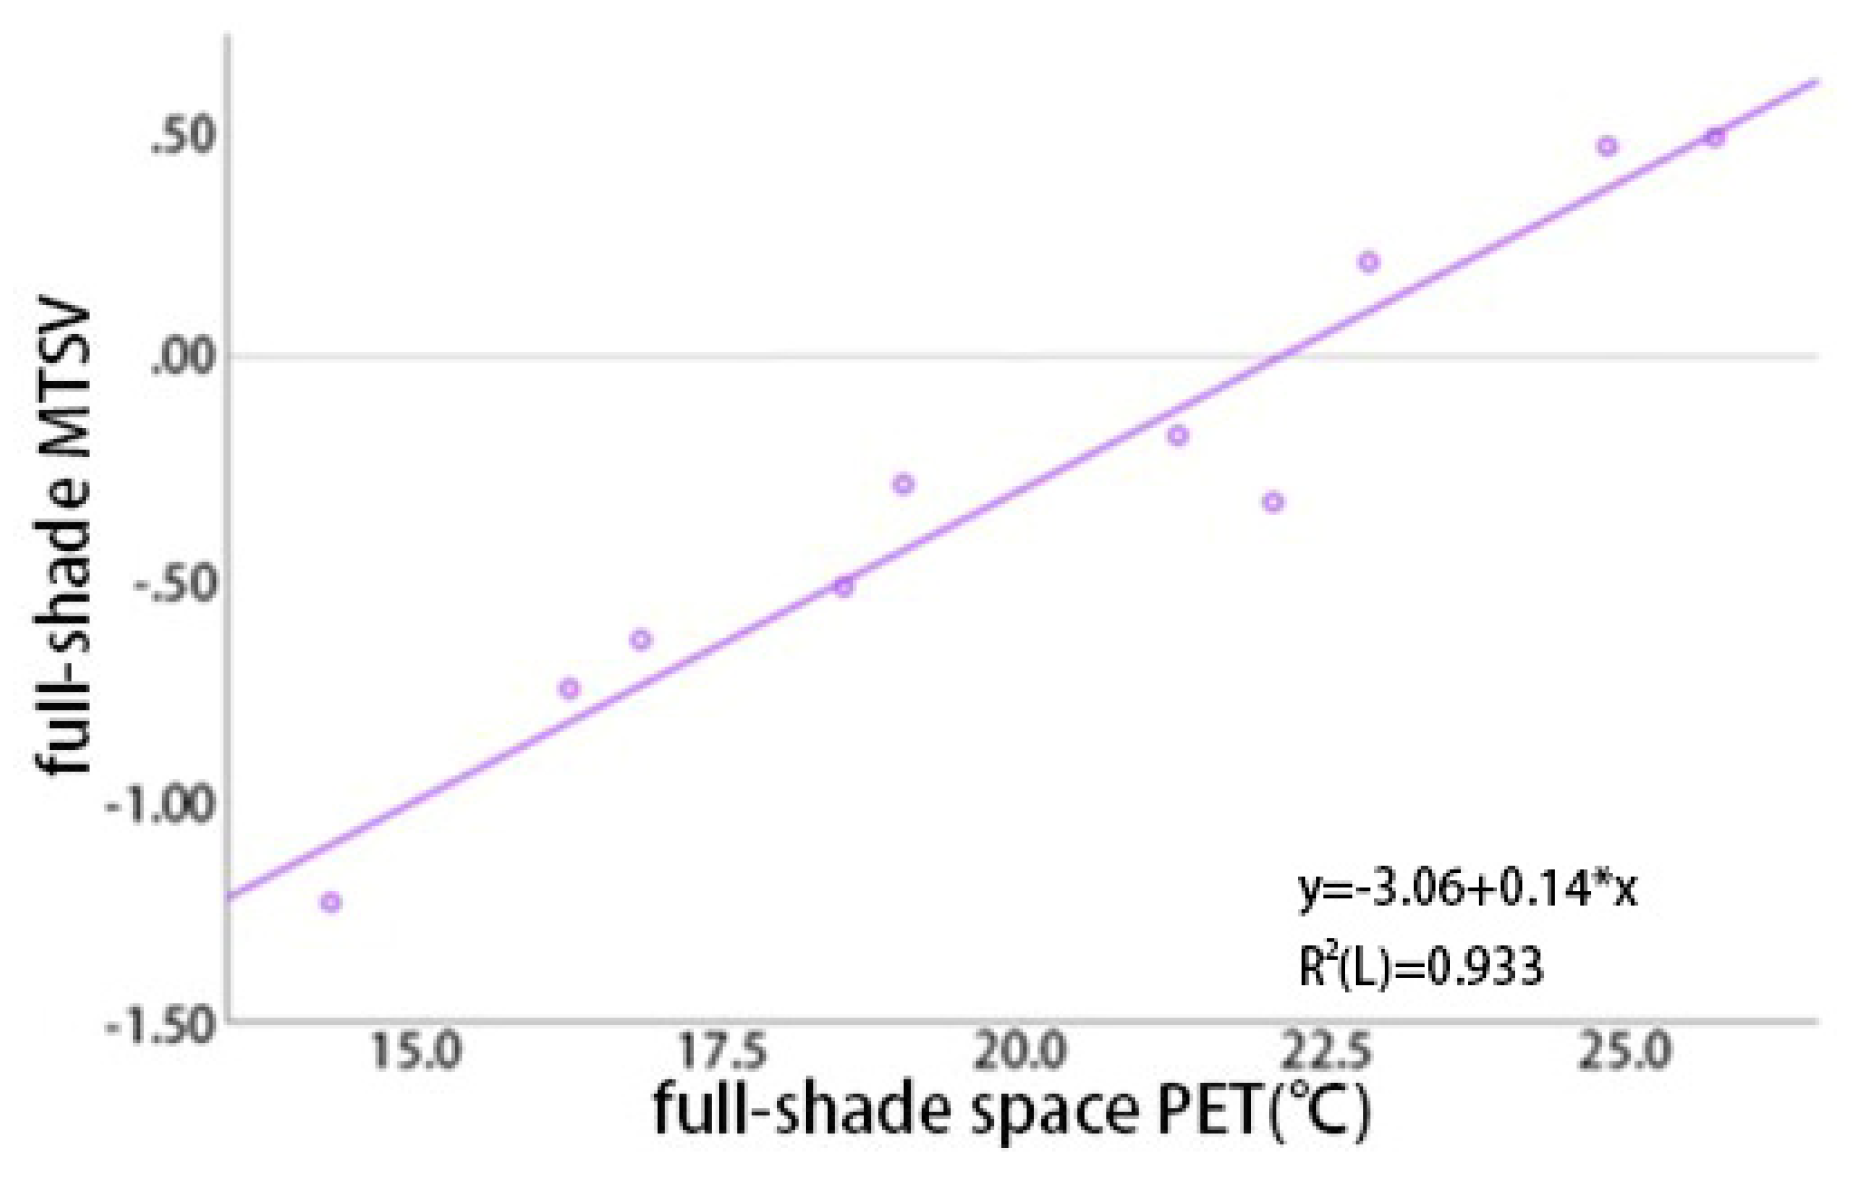
3.3. TSV and PET Analyses in Different Shading Spaces of the Park
3.4. Thermal Neutral Temperature Analysis of Different Shaded Spaces in the Park
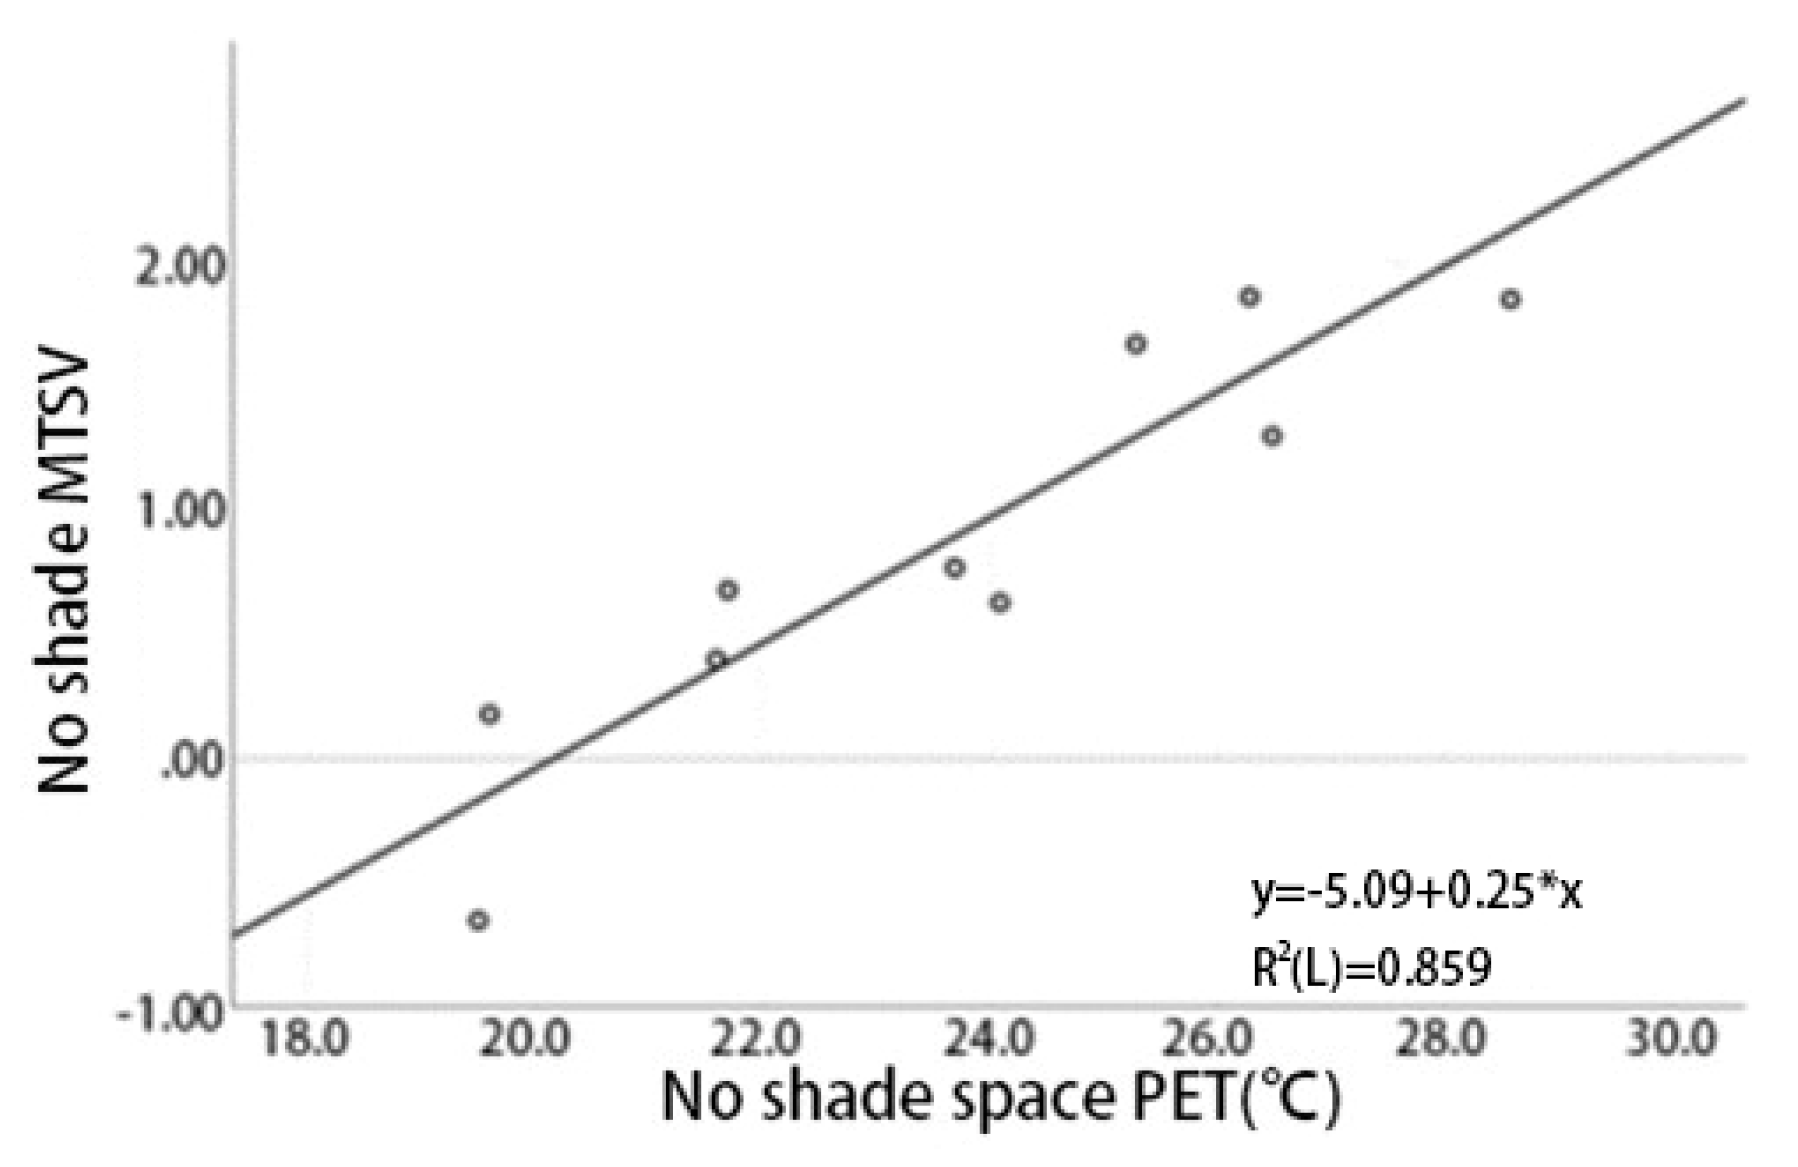
3.5. Analysis of PET, MTSV and Crowd Aggregation Densit
4. Discussion
5. Conclusions
Author Contributions
Funding
Conflicts of Interest
References
- Hong, X.Z.; Gui, X.T.; Xin, Y.Y.; Jing, S. Influences of greening and structures on urban thermal environments: A case study in Xuzhou City, China. Urban For. Urban Green. 2021, 66, 127386. (In Chinese) [Google Scholar] [CrossRef]
- Lo, A.Y.; Byrne, J.A.; Jim, C.Y. How climate change perception is reshaping attitudes towards the functional benefits of urban trees and green space: Lessons from Hong Kong. Urban For. Urban Green. 2017, 23, 74–83. [Google Scholar] [CrossRef] [Green Version]
- Farshid, A.; Ebrahim, S.; Sepideh, B.; Ester, H.G.; Amir, M.; Shahab, S.B. How parks provide thermal comfort perception in the metropolitan cores; a case study in Madrid Mediterranean climatic zone. Clim. Risk Manag. 2020, 30, 100245. [Google Scholar] [CrossRef]
- Jiang, Y.; Zhao, L.H.; Meng, Q.L. Study on thermal comfort of urban pedestrian space in hot and humid areas in summer. J. Civ. Environ. Eng. 2020, 42, 174–182. (In Chinese) [Google Scholar]
- Xi, T.Y.; Wang, Q.C.; Ding, J.H.; Qin, H. A comparative study on the differentiation of thermal comfort of tourists in cold urban scenic spots. Archit. Sci. 2019, 35, 124–129. (In Chinese) [Google Scholar]
- Aram, F.; Solgi, E.; Holden, G. The role of green spaces in increasing social interactions in neighborhoods with periodic markets. Habitat Int. 2019, 84, 24–32. [Google Scholar] [CrossRef]
- Xi, T.Y.; Qin, H.; Wang, H.S.; Jin, H. Study on dynamic thermal comfort of strollers in Stalin Riverside Park in summer. Archit. Sci. 2021, 37, 93–103. (In Chinese) [Google Scholar]
- Liang, C.; Ng, E. Outdoor thermal comfort and outdoor activities: A review of research in the past decade. Cities 2012, 29, 118–125. [Google Scholar]
- Rapoport, A. An approach to designing Third World environments. Third World Plan. Rev. 1979, 1, 23–40. [Google Scholar] [CrossRef]
- Andrade, H.; Alcoforado, M.J.; Oliveira, S. Perception of temperature and wind by users of public outdoor spaces: Relationships with weather parameters and personal characteristics. Int. J. Biometeorol. 2011, 55, 655–680. [Google Scholar] [CrossRef] [PubMed]
- Li, K.; Zhang, Y.F.; Zhao, L.H.; Li, X.H. Applicability of thermal comfort index in urban outdoor space in hot and humid areas. Archit. Sci. 2017, 33, 15–19, 166. (In Chinese) [Google Scholar]
- Fang, Z.; Feng, X.; Xu, X.; Zhou, X.; Lin, Z.; Ji, Y. Investigation into outdoor thermal comfort conditions by different seasonal field surveys in China, Guangzhou. Int. J. Biometeorol. 2019, 63, 1357–1368. (In Chinese) [Google Scholar] [CrossRef]
- Li, C.; Yang, X. A study on the vigor improvement of traditional villages in Winter based on the Simulation of ENVI-met Software—A case study of Xiaxia Village in Beijing. City Build. 2020, 17, 99–102. (In Chinese) [Google Scholar]
- Sun, J.M. The development stage of urbanization and the relationship between urban and rural areas. Urban Rural Plan. 2018, 44–50. (In Chinese) [Google Scholar]
- Yan, J.C.; Liang, J. Study on outdoor pedestrian thermal comfort of cold block commercial complex. Archit. Cult. 2020, 58–60. (In Chinese) [Google Scholar]
- Zhang, J.; Li, K.; Zhao, L.H. Study on the characteristics of subjective thermal comfort evaluation of different outdoor spaces in hot and humid areas in summer. Archit. Sci. 2019, 35, 18–24. (In Chinese) [Google Scholar]
- Feng, X.W.; He, C.X.; Fang, Z.S.; Ji, Z.L. Research status of outdoor thermal comfort. Archit. Sci. 2017, 33, 152–158. (In Chinese) [Google Scholar]
- Zhao, S.F.; Xi, W.F.; Zhang, L. Investigation of PMV Model for Evaluation of the Outdoor Thermal Comfort. Procedia Eng. 2017, 205, 2457–2462. (In Chinese) [Google Scholar]
- Thorsson, S.; Lindqvist, M.; Lindqvist, S. Thermal bioclimatic conditions and patterns of behaviour in an urban park in Göteborg, Sweden. Int. J. Biometeorol. 2004, 48, 149–156. [Google Scholar] [CrossRef]
- Fanger, P.O. Thermal Comfort. Analysis and Applications in Environmental Engineering; Danish Technical Press: Copenhagen, Denmark, 1970; p. 244. [Google Scholar]
- Gagge, A.P. A Standard Predictive Index of Human Response to the Thermal Environment. ASHRAE Trans. 1986, 92, 709–731. [Google Scholar]
- Hoppe, P. The physiological equivalent temperature—A universal index for the biometeorological assessment of the thermal environment. Int. J. Biometeorol. 1999, 43, 71–75. [Google Scholar] [CrossRef]
- Matzarakis, A.; Rutz, F.; Mayer, H. Modelling radiation fluxes in simple and complex environments: Basics of the RayMan model. Int. J. Biometeorol. 2010, 54, 131–139. [Google Scholar] [CrossRef] [PubMed] [Green Version]
- Feng, G.H.; Liang, R.B.; Ning, J.Y.; Gao, Y.; Guo, Z. Analysis of the effect of solar radiation on human thermal comfort. J. Shenyang Constr. Univ. 2007, 790–793. (In Chinese) [Google Scholar]
- Liu, Y.H.; Xu, Y.M.; Zhang, F.M.; Shu, W.J. Study on the influence of urban spatial morphology on the distribution of heat island in Beijing. J. Geogr. 2021, 76, 1662–1679. (In Chinese) [Google Scholar]
- Duan, Y.X.; Jin, H.X.; Shi, X. Study on the effect of landscape architecture spatial canopy shading on summer microclimate and human thermal comfort—A case study of Hangzhou Sanatorium of Nanjing military region. Chin. Gard. 2018, 34, 64–70. (In Chinese) [Google Scholar]
- Min, X.; Bo, H.; Run, S.J.; Le, A.; Ting, Z. Outdoor thermal comfort of shaded spaces in an urban park in the cold region of China. Build. Environ. 2019, 155, 408–420. (In Chinese) [Google Scholar]
- Zong, S. Study on Summer Microclimate Landscape Optimization Strategy of Outdoor Public Space in Xi’an Urban Residential Area; Xi’an University of Architectural Science and Technology: Xi’an, China, 2020. (In Chinese) [Google Scholar]
- Liu, C.; Tang, L.N. Study on the Application of Landscape Ecology in Urban ecosystem Services—Taking the land-scape design of urban parks as an example. J. Ecol. 2020, 40, 814–8146. (In Chinese) [Google Scholar]
- Xi, T.Y.; Lei, Y.S. Study on the difference of thermal comfort between winter and summer in urban parks in severe cold areas. Archit. Sci. 2021, 37, 52–60. (In Chinese) [Google Scholar]
- Yin, Y.Q.; Chen, K.; Wang, Y.Z. Research on the vitality of historical blocks based on the comprehensive measurement of spatial syntax and Baidu thermal map. Chin. Foreign Arch. 2021, 101–106. (In Chinese) [Google Scholar]
- Liu, A.Q. Research on Visiting Characteristics and Influencing Factors of Urban Parks Based on Baidu Thermal Map; Nanjing Forestry University: Nanjing, China, 2021; (In Chinese). [Google Scholar] [CrossRef]
- Liu, W.W.; Huang, Y.Q.; Kang, Z.H.; Fan, Y.; Wu, Q.S. Study on the use of Landscape Architecture Recreation Space based on Thermal Map Big data method—A case study of Hainan Xinglong Botanical Garden. J. Hainan Univ. 2019, 37, 268–275. (In Chinese) [Google Scholar]
- Hu, W.H.; Shen, S.S.; Yang, F.; Bao, Z.Y. Research on vitality evaluation and influencing factors of historical and cultural blocks based on multi-source big data. Chin. Foreign Arch. 2021, 96–101. (In Chinese) [Google Scholar]
- Zhou, Y.F.; Yang, J.; Zhou, J.; Zhou, P.; Liu, H. Study on vigor Measurement of Rail Transit Station Service area based on Thermal Map data—A case study of Shenzhen Metro. J. Peking Univ. 2020, 56, 875–883. (In Chinese) [Google Scholar]
- Wang, C.L. Temporal and spatial characteristics of urban population aggregation in the main urban area of Wuhan Based on Baidu thermal map. J. West. Hum. Settl. 2018, 33, 52–56. (In Chinese) [Google Scholar] [CrossRef]
- An, Y.J. Study on crowd aggregation in urban scenic spots based on big data of thermal map—Taking the main urban area of Nanchang as an example. Inf. Comput. 2020, 32, 143–145. [Google Scholar]
- Tan, M.L. Study on the Effects of Relative Humidity and Wind Speed on Human Thermal Sensation in Summer; Chongqing University: Chongqing, China, 2012. (In Chinese) [Google Scholar]
- Jiang, Y.; Xu, F.; Xiong, Y.; Liu, Z.X.; Zhao, L.H. Study on thermal comfort characteristics of slow lanes in hot and humid areas based on shading rate. Chin. Gard. 2021, 37, 71–76. [Google Scholar] [CrossRef]
- Zhang, S.Y. Study on Thermal Comfort of Shading Environment of Green Open Space in Wuhan; Huazhong Agricultural University: Wuhan, China, 2018. (In Chinese) [Google Scholar]
- Li, K.K.; Zhang, X.X.; Jiang, W.W. Experimental study on the relationship between microclimate and human comfort in summer park—Taking Qianwangling Park as an example. Green Technol. 2020, 16–19. [Google Scholar] [CrossRef]
- Li, Y.M. Study on Optimization Strategy of Thermal Comfort in Transition Season of Small-Scale Public Space in Cold Cities; Harbin Institute of Technology: Harbin, China, 2019; (In Chinese). [Google Scholar] [CrossRef]
- Fang, X.S.; Hu, J. Study on outdoor thermal comfort threshold of the elderly in hot and humid areas in summer. South. Arch. 2019, 5–12. (In Chinese) [Google Scholar]
- Xie, M.Z.; Li, J. Comparative study on thermal comfort of several outdoor squares in hot and humid areas. City Build. 2020, 17, 52–55, 67. (In Chinese) [Google Scholar] [CrossRef]


| No-Shade | Half-Shade | Full-Shade | |
|---|---|---|---|
| SVF |
| Index | Chill | Cold | Cool | Slightly Cooler | Comfortable | Slightly Warmer | Warm | Hot | Extremely Hot |
|---|---|---|---|---|---|---|---|---|---|
| PET (°C) | <4 | 4~8 | 8~13 | 13~18 | 18~23 | 23~29 | 29~35 | 35~41 | >41 |
| Index | Cool | Slightly Cooler | Moderate | Slightly Warmer | Warm |
|---|---|---|---|---|---|
| TSV | −2 | −1 | 0 | 1 | 2 |
| Thermal Sense Scale | Standard Range/°C | No-Shade Space | Half-Shade Space | Full-Shade Space | ||||
|---|---|---|---|---|---|---|---|---|
| Correspond Temperature | Range | Correspond Temperature | Range | Correspond Temperature | Range | |||
| −2 | Cool | 8~13 | 12.3 | 10.3~14.2 | 10 | 7.6~12.3 | 7.7 | 4~11.3 |
| −1 | Slightly cooler | 13~18 | 16.2 | 14.2~18.2 | 14.7 | 12.3~17 | 14.9 | 11.3~18.5 |
| 0 | Moderate | 18~23 | 20.2 | 18.2~22.2 | 19.3 | 17~21.7 | 22.2 | 18.5~25.8 |
| 1 | Slightly warmer | 23~29 | 24.2 | 22.2~26.1 | 24 | 21.7~26.4 | 29.4 | 25.8~33 |
| 2 | Warm | 29~35 | 28.1 | 26.1~30.1 | 28.7 | 26.4~31.6 | 36.7 | 33~40.2 |
| PET | MTSV | |||||
|---|---|---|---|---|---|---|
| No-Shade Space | Half-Shade Space | Full-Shade Space | No-Shade Space | Half-Shade Space | Full-Shade Space | |
| Density | ||||||
| p value | ||||||
Publisher’s Note: MDPI stays neutral with regard to jurisdictional claims in published maps and institutional affiliations. |
© 2022 by the authors. Licensee MDPI, Basel, Switzerland. This article is an open access article distributed under the terms and conditions of the Creative Commons Attribution (CC BY) license (https://creativecommons.org/licenses/by/4.0/).
Share and Cite
Fan, Q.; Li, X.; Li, H. Crowd Gathering and Thermal Comfort Research in Different Park Shading Spaces. Sustainability 2022, 14, 2687. https://doi.org/10.3390/su14052687
Fan Q, Li X, Li H. Crowd Gathering and Thermal Comfort Research in Different Park Shading Spaces. Sustainability. 2022; 14(5):2687. https://doi.org/10.3390/su14052687
Chicago/Turabian StyleFan, Qindong, Xiaofeng Li, and Hu Li. 2022. "Crowd Gathering and Thermal Comfort Research in Different Park Shading Spaces" Sustainability 14, no. 5: 2687. https://doi.org/10.3390/su14052687
APA StyleFan, Q., Li, X., & Li, H. (2022). Crowd Gathering and Thermal Comfort Research in Different Park Shading Spaces. Sustainability, 14(5), 2687. https://doi.org/10.3390/su14052687