Article

Contributions of Natural Carbon Sink Capacity and Carbon Neutrality in the Context of Net-Zero Carbon Cities: A Case Study of Hangzhou

1
College of Civil Engineering and Architecture, Zhejiang University, Hangzhou 310058, China
2
Center for Balance Architecture, Zhejiang University, Hangzhou 310058, China
*
Author to whom correspondence should be addressed.
Sustainability 2022, 14(5), 2680; https://doi.org/10.3390/su14052680
Submission received: 14 January 2022 / Revised: 16 February 2022 / Accepted: 23 February 2022 / Published: 25 February 2022

Abstract

:
Facing the global climate change crisis, many cities have proposed the goal to achieve net-zero carbon cities. The natural carbon sink in urban space is indispensable for net-zero carbon cities, but the existing measurement system has shortcomings in the measurement elements and precision. This leads to unclear control objectives and elements of spatial planning, and the relevant planning strategies lack the support of quantitative results. We included the often-ignored natural carbon sink space and soil in the measurement scope. Taking Hangzhou as an example, we built a natural carbon sink capacity measurement system with respect to the carbon sequestration and storage capacity, measured the natural carbon sink, and evaluated its carbon neutrality’s contribution in urban space. The results showed that the carbon sink capacity of soil and small green spaces in built-up areas could affect the quantity and spatial pattern of the measurement results. Both should be included in the measurement system to improve corresponding spatial planning strategies’ reliability and feasibility. Additionally, Hangzhou’s annual natural carbon sequestration offset approximately 9.87% of the carbon emissions in the same year. With respect to the contribution to carbon neutrality, the role of natural carbon sinks in urban space was necessary, but the effect was limited. Therefore, strategies to reduce carbon emissions are integral for the net-zero carbon goal. Some spatial planning strategies to improve the urban natural carbon sink capacity are discussed. A more precise and comprehensive understanding of the urban natural carbon sink capacity can support the construction of a net-zero carbon city better.

1. Introduction

Climate change is a severe global challenge that is receiving increasing attention from governments. An Intergovernmental Panel on Climate Change (IPCC) report showed that human activities caused a global temperature increase of approximately 1 °C above the pre-industrial levels by 2017 [1]. Climate change has led to a series of highly harmful consequences, such as heatwaves, floods, and droughts, which have already posed a real threat to human society.
As a major responsible country, China has announced that it will enhance its nationally determined contribution to climate change and strive to achieve carbon neutrality before 2060. According to the definition of IPCC, carbon neutrality refers to a state in which anthropogenic emissions and removals of CO2 reach a global balance within a specific period [1].
Depending upon whether zero CO2 emissions can be achieved, the technological routes to achieve carbon neutrality can be divided into two types: zero emissions and net-zero emissions [2]. Due to the high uncertainty of achieving the zero emissions route, many countries and regions have chosen the more probable net-zero emissions path [3]. In the net-zero emissions context, carbon sinks become non-negligible [4]. One of the most important sources of carbon sinks is the natural carbon sinks provided largely by vegetation, water, and soil. From 2000 to 2015, China’s terrestrial ecosystems achieved an increase in natural carbon storage of 3202.23 Tg [5]. Some scholars have predicted that forest vegetation in China will absorb 22.14% of fossil fuel CO2 emissions from 2020 to 2050 [6]. As the largest carbon pool in terrestrial ecosystems [7], soil accounts for up to 56% of the total urban carbon pool [8]. Therefore, exploring natural carbon sink spaces’ contribution is of great importance in realizing the vision of carbon neutrality.
The management of urban areas, which are the main regions of global carbon emissions, is crucial to mitigate and address climate change [9]. With increasing attention to climate change and its effects in recent years, global cities have enhanced their comprehensive strategies to address climate change, from low- to net-zero carbon strategies. Compared with the incremental change approaches [10], net-zero cities need a clearer, more accurate, and comprehensive carbon quantification system to support their deep systemic transformation [11]. The system used to measure the urban natural carbon sink capacity is an indispensable part of the quantitative system on carbon. Generally speaking, the urban natural carbon sink capacity can be divided into carbon sequestration and storage capacity. The capacity to sequester carbon refers primarily to vegetation’s ability to convert atmospheric carbon into organic matter and fix it through photosynthesis, while carbon storage capacity refers to the ability of vegetation, soil, water, etc. to store carbon in the carbon pool in the form of organic or inorganic matter [12,13]. The natural carbon sink capacity measurement system is composed of different carbon sink measurement methods organically. Currently, there are a variety of methods for measuring different participants and processes of carbon sinks. However, the measurement systems of the urban natural carbon sink capacity still have many deficiencies, such as incomplete measurement elements and insufficient measurement accuracy. In the field of spatial planning, due to the lack of reliable quantitative results of natural carbon sinks, it is difficult for policymakers to clarify the contribution of natural carbon sinks to net-zero carbon cities and their spatial patterns. Therefore, the corresponding spatial strategies may not be able to play their due role and become effective tools to cope with the severe challenges of climate change [14].
In order to make spatial planning better contribute to the goal of net-zero carbon cities, there are three key questions that should be addressed with respect to the urban natural carbon sink capacity: (1) How do we build a more comprehensive, accurate, and concise measurement system for urban natural carbon sink capacity? (2) How much does the natural carbon sink contribute to the goal of net-zero carbon cities? (3) How do the measurement results of the natural carbon sink capacity support the corresponding spatial planning strategies? To address these questions, we incorporated soil carbon sinks into the system to measure the urban natural carbon sink capacity at the municipal scale and measured the amount and spatial patterns of the urban natural carbon sink capacity based upon high spatial resolution remote sensing images. Compared with the existing studies, we added consideration to soil and small green spaces in built-up areas. Moreover, we evaluated the natural carbon sequestration’s contribution to urban carbon neutrality in combination with carbon emissions measurement. Finally, we proposed such spatial planning strategies as consolidating the natural carbon pool and increasing the annual average natural carbon sequestration to provide reference methods and countermeasures to support the achievement of a net-zero carbon city (Figure 1).

2. Literature Review

2.1. Effects of Spatial Planning on the Natural Carbon Sink Capacity

Spatial planning can affect green spaces’ area, type, vegetation structure, and management intensity, which, in turn, affects cities’ natural carbon sink capacity. The size of a green space is closely related to the carbon sink capacity of vegetation. It has been reported that controlling the expansion of construction land and maintaining or enhancing the area of existing green spaces can preserve or enhance vegetation’s carbon sink capacity effectively [15,16]. Moreover, land use can have long-term effects on soil organic carbon storage (SOCS) [17]. For example, the soil organic carbon density (SOCD) of the topsoil under impervious surfaces is much lower than that under vegetation-covered surfaces [18]. With respect to type, the proportions of the vegetation types also affect the natural carbon sink capacity of an urban space because of differences in their carbon sequestration capacity and storage capacity of vegetation on different types of lands, such as cropland and forest land [19]. The vegetation structure of green spaces in built-up urban areas can also lead to differences in the carbon sink capacity [20] and thus affect the efficiency of natural carbon sinks [21]. At the implementation and management stage, a reasonable and reliable planning supervision and regulation mechanism can guarantee vegetation and soil carbon pools’ stability, avoid unnecessary disturbances and losses, and maintain the urban natural carbon sink capacity [22,23].

2.2. System to Measure the Natural Carbon Sink Capacity of Urban Spaces

Many studies have provided a variety of measurement methods for different carbon sink participants and processes. Common methods to measure the vegetation carbon sink capacity include micrometeorological methods, remote sensing estimation methods, vegetation carbon sink estimation system methods, and so on [24,25]. Methods to measure SOCS include horizontal space estimation methods and soil profile methods, as well as several new methods [26]. The InVEST model is representative of comprehensive methods [27]. Through the organic combination of these methods, existing studies have made useful explorations of the system to measure the urban natural carbon sink capacity. However, with the net-zero carbon city as the planning goal, existing measurement systems have deficiencies in measurement elements, accuracy, and data sources. First, the carbon sink capacity measurement systems in existing studies have placed primary emphasis on vegetation and focused on measuring its annual carbon sequestration [28,29], carbon storage [30,31], and other vegetation-related carbon sink indicators. The soil’s carbon sink capacity has been ignored. Since soil is an essential component of the natural carbon sink, assessments involving only vegetation cannot fully demonstrate the urban space’s natural carbon sink capacity [32]. Secondly, due to the limited accuracy of basic data, researchers have excluded urban built-up areas from the study area or used remote sensing images with large spatial resolutions as the original data when assessing cities’ natural carbon capacity, which leads to the neglect of a large amount of vegetation information in built-up areas [33]. Current studies commonly use Landsat satellite images as raw data to estimate cities’ natural carbon sink capacity [34,35]. However, their spatial resolution cannot support the interpretation of small green spaces in built-up areas well, so these green spaces are not included in the measurement scope. The omission or neglect of small green spaces in urban built-up areas may affect policymakers’ understanding of the urban natural carbon sink capacity [36] and thus influence decision outcomes. In addition, there have been some studies of the natural carbon sink capacity of urban spaces that used high-quality but expensive closed source data [16,37,38], which increases the difficulty of translating academic approaches into planning practice methods and is not suitable for promotion to other cities (Table 1).

2.3. Spatial Planning Approaches to Enhance the Natural Carbon Sink Capacity

Territorial spatial planning, which takes all elements in the entire administrative area and all spatial activities as planning objects, is an effective tool to enhance the natural carbon sink capacity in a systematic and integrated manner [14,39]. The spatial planning methods that scholars have proposed have largely promoted the realization of net-zero carbon cities by controlling the three spatial regulators: districts, land types, and land parcels [40]. At the district scale, the spatial planning control focuses on green spaces’ scale and boundaries. Zheng et al. [41] pointed out that the area of blue–green space should not be less than 30% of the district’s total area in the spatial planning scheme. Pan et al. [42] proposed a planning tool based upon a socio-ecological model, the simulation results of which showed that over 50% of carbon sequestration loss could be avoided by prohibiting urban sprawl in areas in the district with a high carbon sink capacity. With respect to land types, spatial planning could improve urban space’s natural carbon sink capacity by controlling the structure and layout of land use. From a three-dimensional perspective, Wu et al. [29] developed a parametric model to evaluate urban–rural green carbon sinks, which can be used to compare planning schemes with different land structures. Fu et al. [43] established a spatial layout model of “three sources of green space” based upon the carbon sequestration theory and recommended the location and distribution patterns of green space with different areas and types. At the parcel level, spatial planning could ensure the green space carbon sink capacity’s efficiency by controlling the proportion of trees and shrubs, vegetation coverage, and other green space indicators [41]. In general, there are various spatial planning methods to enhance the natural carbon sink capacity. However, the control factors are still relatively limited, and some natural carbon sink system components have not been fully considered. Most methods focus on vegetation and ignore the carbon sink capacity of soil and water. In addition, some planning strategies lack the support of quantitative analysis and fail to demonstrate spatial planning’s effect on the natural carbon sink capacity with a concise and comprehensive approach, which cannot serve the goal of net-zero carbon cities well.

3. Materials and Data

3.1. Study Area

Hangzhou, located in Eastern China, is the capital of Zhejiang Province. It comprises 12 districts and counties and covers an area of 16,850 km2 (Figure 2). In the seventh population census in 2020, there were 11.936 million long-term residents of Hangzhou [44].
In recent years, the adverse effects of global climate change on Hangzhou have shown an increasing trend. In 2020, Hangzhou experienced a super-long Meiyu flood period with abnormally high rainfall. However, Hangzhou has made extensive efforts to reduce carbon emissions in response to climate change. The marginal utility of various carbon emission reduction measures continues to decrease, making it increasingly difficult to reduce carbon emissions. This is a typical problem in the realization of a net-zero carbon city, which many cities are facing or are about to face, including Hangzhou. Urban natural carbon sinks may be one of the keys to solving the problem.
Hangzhou is the first national ecocity among the provincial capitals, and it is also a low-carbon demonstration city [45]. From the perspective of ecological environment conditions, Hangzhou has a good natural carbon sink foundation. Additionally, the Hangzhou government is willing to contribute to the realization of a net-zero carbon city by improving the urban carbon sink capacity and to provide experiences that other cities can learn from.
Therefore, Hangzhou serves as a typical case for exploring the contribution of the natural carbon sink capacity to carbon neutrality and related spatial planning measures. The urban natural carbon sink capacity measurement framework in this study can be applied to other cities, and the findings of this study can provide a reference for other cities.

3.2. Data

The acquisition and processing of remote sensing images in this study were carried out on Google Earth Engine (GEE) (https://earthengine.google.com/, accessed on 2 August 2021), a planetary online geospatial analysis cloud platform based upon Google’s large-scale computing power [46]. The remote sensing image data were Sentinel-2 satellite images with a spatial resolution of 10 m, which the GEE platform provided. Through the APIs of the GEE platform, we retrieved and filtered Sentinel-2 Level-2A data covering the study area with less than 1.5% cloudiness in 2020 (from 1 January to 31 December). Then, we synthesized a cloud-free image of Hangzhou City in 2020 by performing a series of preprocessing operations, such as cloud masking and median synthesis, on the image collection. The Advanced Land Observing Satellite Digital Elevation Model with a spatial resolution of 30 m used in remote sensing interpretation was also obtained from the GEE platform. SOCD data with a spatial resolution of 1 km was derived from the global soil organic carbon map (GSOCmap) the Food and Agriculture Organization of the United Nations produced [47] (http://54.229.242.119/GSOCmap/, accessed on 25 August 2021). The Hangzhou Municipal Bureau of Planning and Natural Resources provided the vector administrative boundary data. Data on the yields of major farm crops and cultivated areas of townships commonly used in 2020 were taken from the Hangzhou Statistical Yearbook 2021.
Energy consumption data from the energy balance tables of Zhejiang Province from 2005 to 2019 were obtained from the China Energy Statistical Yearbook (2006–2020). Socioeconomic development data, such as gross domestic product (GDP) and the value-added industry of Zhejiang and Hangzhou, came from the Zhejiang Statistical Yearbook (2006–2020) and Hangzhou Statistical Yearbook (2006–2020), respectively.

3.3. Land Use Classification Using Remote Sensing Images
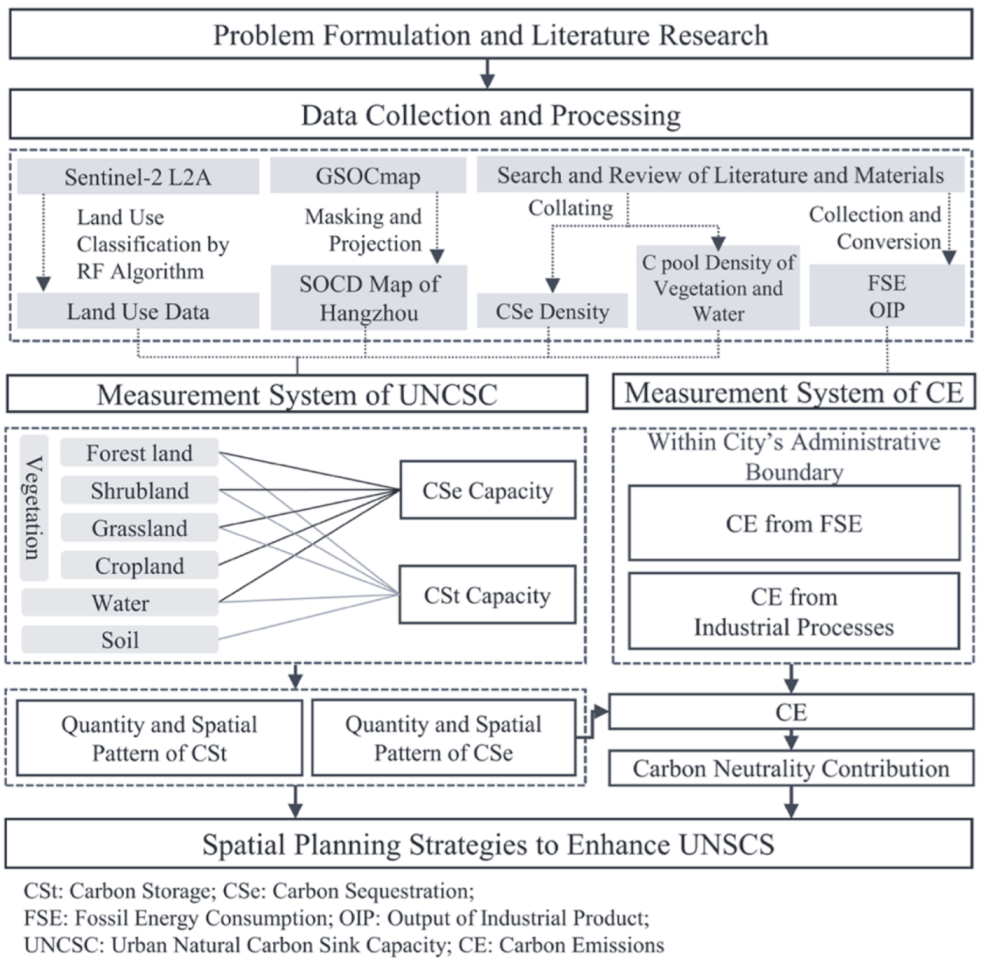
Referring to relevant research practices [33,48], and based upon the study area’s situation, we divided the land in Hangzhou into seven types: forest land, shrubland, grassland, cropland, water, construction land (excluding water surface and vegetation therein), and bare land (Table 2). Based upon the land classification, we constructed a sample dataset consisting of 6376 samples within the study area by combining field visits and an online high-resolution satellite map, street views that Baidu Map provided (https://map.baidu.com/, accessed on 8 August 2021), and published land use data [46,49]. We chose the Random Forest (RF) model as the land use classifier, with the number of trees taken as 200. This classification method is one of the methods used most widely to classify land use and has higher classification accuracy and processing efficiency than similar models [50]. For the classification feature collection, we selected 26 characteristic variables in 3 categories: spectral, texture, and terrain features.
There were many misinterpretations of grassland and cropland in the urban built-up area in the process of pre-interpretation. Based upon the cultivated areas of townships commonly used in 2020 and the completeness of the geographical area, this study divided Hangzhou into two regions for separate interpretations. Before interpreting each region, 30% of the data were selected randomly from the sample set as validation data. The accuracy validation results showed that both regions’ kappa coefficients exceeded 0.90, which met the accuracy requirements [51]. Thus, the interpretation results (Figure 3) could be used in this study.

3.4. Methods

3.4.1. Capacity to Sequester Carbon

In this study, the carbon sequestration capacity referred to vegetation and water’s ability to remove CO2 from the atmosphere in various ways, which can be characterized by each land use type’s annual carbon sequestration density and annual gross natural carbon sequestration. There were five types of land with carbon sequestration capacity in the study area: forest land, shrubland, grassland, cropland, and water. Except for cropland, we could calculate the other land types’ annual carbon sequestrations according to their respective annual carbon sequestration densities and areas using Equation (1):
A i = S i × d i
in which A i is land use type i ’s annual carbon sequestration, S i is land use type   i ’s area, and d i is land use type i ’s annual carbon sequestration density. The annual carbon sequestration densities of forest land, shrubland, grassland, and water were the arithmetic mean of the values that authoritative journals or masters and doctoral dissertations in related fields provided.
Due to the apparent regional differences in the spatial distribution of agricultural activities [52], it would be inappropriate to adopt a cropland’s annual carbon sequestration density in other regions directly. Referring to the existing literature [53], a cropland’s annual carbon sequestration was estimated by Equation (2):
A c = j n C c j = j n c j × ( 1 P j ) × B j = j n c j × ( 1 P j ) × Y j H j
in which A c is cropland’s gross annual carbon sequestration, C c j is crop j ’s annual carbon sequestration, n is the number of crop types, c j is crop j ’s carbon fixation rate, B j is crop j ’s biological yield, P j is crop j ’s moisture content, Y j is crop j ’s economic yield, and H j is crop j ’s economic coefficient, i.e., the ratio of the crop’s economic yield to its biological yield. Each crop’s economic coefficients and carbon fixation rates were taken from relevant studies by Tian [53], Zhao [54], and Xie et al. [55] (Table 3). The gross annual carbon sequestration of Hangzhou’s cropland in 2020 was calculated as 0.97 Mt C, and cropland’s annual carbon sequestration density was 5.374 t C/ha. Compared with the results in existing studies, these results are in the normal range and can be used in this study [56,57].
On the basis of Equations (1) and (2), the annual gross natural carbon sequestration of an urban space can be calculated using Equation (3):
C s e = i m A i
in which C s e is the gross annual natural carbon sequestration of an urban space, and m is the number of land types, including forestland, shrubland, grassland, cropland, and water.

3.4.2. Capacity to Store Carbon

Urban spaces’ natural carbon storage capacity refers to vegetation, soil, and water’s ability to store carbon stably in carbon pools, which may be represented by the carbon pool density and the gross natural carbon pool storage. We divided the natural carbon pool into three sub-pools: soil, vegetation, and water and calculated them separately. For soil, this study measured the organic carbon pool in the 0–30-cm soil layer for the following reasons. First, although soil contains both organic and inorganic carbon, inorganic carbon is relatively stable, and studies and management practices on soil carbon sequestration have focused primarily on organic carbon [58]. Therefore, this study did not take soil inorganic carbon into account. Second, compared with shallow soil, deeper soil layers are affected less by external disturbances and have relatively high soil carbon stability [59]. Moreover, with respect to the storage capacity, approximately 65% of SOCS in Zhejiang Province is stored in shallow soil (0–30 cm) [60]. In summary, it may be considered that the organic carbon pool of the 0–30-cm soil layer can characterize the soil carbon storage capacity effectively. In addition, because urban building activities remove the shallow soil from construction land, its soil carbon pool was ignored in this study based upon the methods of previous studies [61]. We used ArcGIS 10.5 to mask, project, and resample the GSOCmap to match the land use data.
Vegetation and water’s carbon pool densities were obtained from the literature review, and the selection criteria and aggregation methods were the same as the annual carbon sequestration density. Since the GSOCmap did not contain soil carbon pool data for water areas, the carbon pool densities of aboveground water bodies and sediment were all derived from the literature. Further, given that crops are harvested regularly, it is difficult to store the crops’ fixed carbon stably in cropland vegetation for a long while [62]. Therefore, cropland vegetation’s carbon storage capacity was not considered.
The carbon stocks of vegetation and water were calculated with Equation (4):
B i = S i × D i
in which B i is the carbon pool storage of the vegetation or water corresponding to land use class i ; S i is the land use type i ’s area; and D i is the carbon pool density of the vegetation or water corresponding to the land use type i , which includes forest land, shrubland, grassland, and water.
The gross natural carbon pool storage was calculated using Equation (5):
C s t = B w + B f + B s h + B g + B s o
in which C s t is the gross natural carbon pool storage; B w is water’s carbon storage; B f , B s h , and B g are forest land, shrubland, and grassland vegetation’s carbon storage, respectively, and B s o is the soil’s carbon storage. We used ArcGIS 10.5 to obtain the soil carbon pool storage with the statistics of the preprocessed GSOCmap.
The carbon sink coefficients mentioned above are shown in Table 4.

3.4.3. Carbon Emissions Measurement

This study referred to Shan et al.’s [74,75] method to account for urban carbon emissions. The accounting scope included the carbon emissions from the consumption of fossil fuels and certain industrial processes within the city’s administrative boundary. The city-level carbon emissions were calculated with Equation (6):
C e = C e n + C p
in which C e is the gross carbon emissions within the city’s administrative boundary, C e n is the carbon emissions from the consumption of fossil fuels, and C p refers to the carbon emissions generated from industrial processes.
The carbon emissions from fossil fuel consumption were calculated with Equation (7):
C e n = i m E i × E F i = i m E i × N C V i × C C i × O i
in which E i is fossil fuel type i ’s consumption, m is the total number of fossil fuel types, E F i is fossil fuel type i ’s CO2 emission factors, N C V i is fossil fuel type i ’s net calorific value, C C i is fossil fuel type i ’s default carbon content, and O i is fossil fuel type i ’s carbon oxidation rate. The Statistical Yearbooks of Hangzhou did not provide data related to fossil fuel consumption. Therefore, referring to existing study methods [75], we estimated Hangzhou’s fossil fuel consumption data from the energy balance table of Zhejiang Province based upon the ratio of the corresponding socioeconomic indicators of Zhejiang Province and Hangzhou City. The carbon emission factors were obtained from “Guidelines for Provincial Greenhouse Gas Inventory of Zhejiang (2018 Revised Edition)” [76] and related studies by Shan et al. [74,75] (Table 5).
The carbon emissions generated from industrial processes were calculated with Equation (8):
C p = j q M j × E F j
in which M j is industrial process j ’s product output, q is the number of industrial process types, and E F j is industrial process j ’s carbon emission factor. The industrial processes considered in this study included ammonia production, soda ash production, steel production, and cement manufacturing. The corresponding carbon emission factors were determined with respect to Shan et al.’s [74,75] and Feng et al.’s [77] studies (Table 6).

4. Results

4.1. Hangzhou’s Urban Natural Carbon Sink Capacity

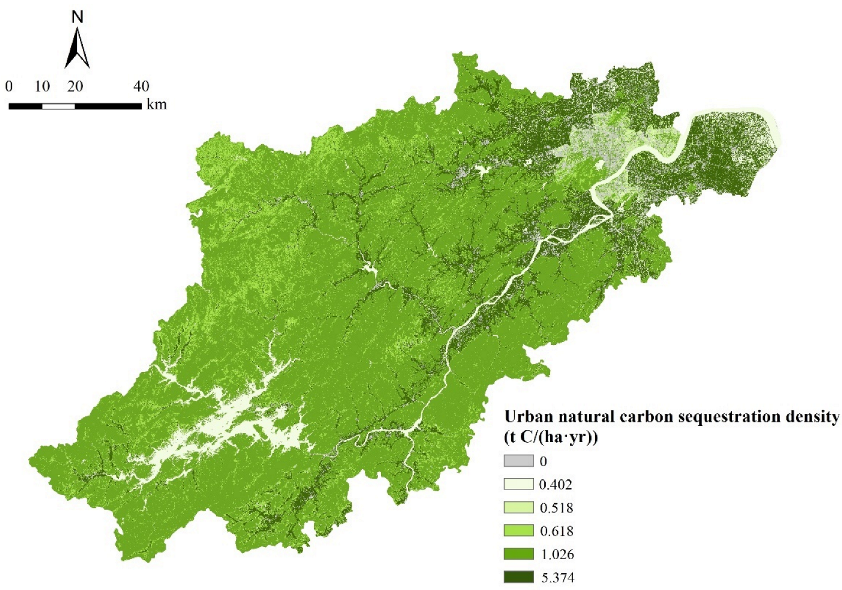
4.1.1. Capacity to Sequester Carbon

Our results showed that Hangzhou’s natural gross carbon sequestration in 2020 was 2.16 Mt C. The annual mean natural carbon sequestration density was 1.45 t C/(ha·yr), which is similar to existing research results (1.66 t C/(ha·yr)) [78]. Compared with other cities in the Yangtze River Delta, Hangzhou’s carbon sequestration capacity is relatively low, with Hefei at 1.19 t C/(ha·yr), Shanghai at 1.45 t C/(ha·yr), Ningbo at 1.96 t C/(ha·yr), and Nanjing at 2.87 t C/(ha·yr) [79]. With respect to the spatial structure (Figure 4), different regions of Hangzhou had different main participants in carbon sequestration. Carbon sequestration in Northeastern Hangzhou derived primarily from cropland, while the process of carbon sequestration in the southwest of the city occurred mainly in forest land. The high-value region of natural carbon sequestration density in Hangzhou was the ring area surrounding the urban core, where a large area of cropland was distributed, and the forest land in the southwest.

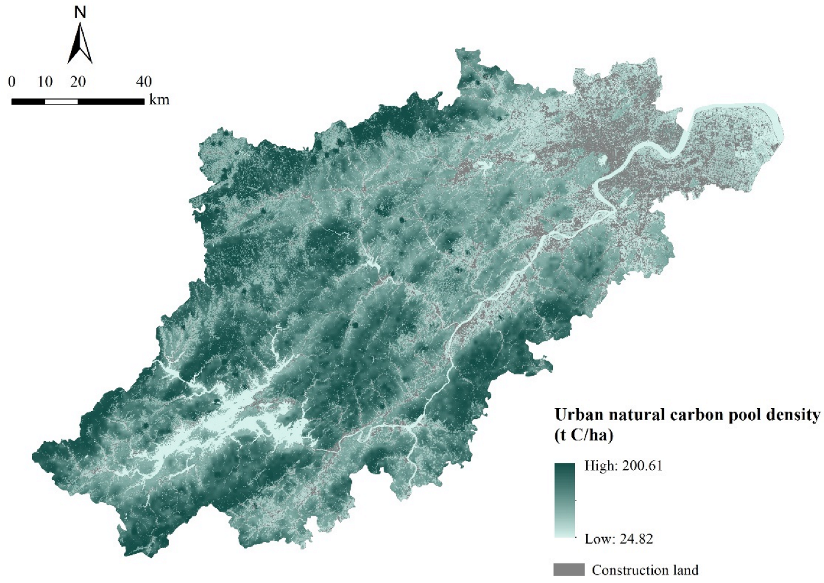
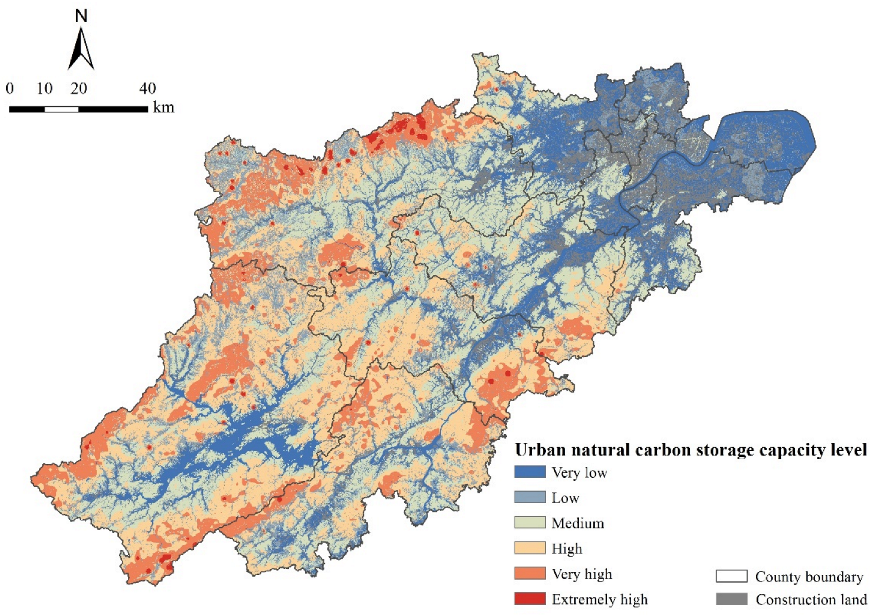
4.1.2. Capacity to Store Carbon

Hangzhou’s gross natural carbon storage was 107.42 Mt C. Among them, the soil carbon storage was 69.51 Mt C and accounted for 64.71% of the total storage. Thus, the soil is the most essential component of urban natural carbon storage. The carbon storage of vegetation (including forest land, shrubland, and grassland) was 37.87 Mt C, which accounted for 35.25% of the total storage. Vegetation’s mean carbon pool density was 31.38 t C/ha, which was similar to the result of Hangzhou in a previous study (30.25 t C/ha) [78]. In comparison to other major cities in China, Hangzhou’s vegetation carbon pool density is higher than the average (21.43 t C/ha) and only lower than several cities such as Changchun (38.80 t C/ha) and Nanjing (38.69 t C/ha) [79]. This indicated that Hangzhou’s vegetation has excellent carbon storage capacity. The water carbon storage was 0.03 Mt C or 0.03% of the total storage.
With respect to spatial distribution, the natural carbon pool density presented a spatial pattern in which it was low in the northeast and high in the southwest (Figure 5). Low-carbon storage capacity regions were located in the main urban areas, such as Gongshu, Shangcheng, and Qiantang. High-carbon storage capacity patches were distributed largely in areas with high forest coverage in the southwest of Hangzhou, such as the Western Lin’an and Northern Jiande. Fuyang and the eastern part of Lin’an were a transition region from high- to low-carbon storage capacity.

4.2. Carbon Emissions and the Urban Natural Sequestration Offset

From 2005 to 2019, Hangzhou’s carbon emissions showed an increasing and then decreasing trend (Figure 6), in which the peak occurred in 2012 at 27.26 Mt C. After a relatively rapid decline from 2012 to 2016, the decreasing trend in the carbon emissions of Hangzhou has begun to slow down in recent years. The carbon emissions in 2019 were 21.93 Mt C, while its carbon emissions’ intensity maintained a downward trend from 2005 to 2019, falling to 0.52 t CO2/10,000 yuan in 2019.
Assuming that Hangzhou’s urban spaces’ capacity to sequester natural carbon in 2019 was largely the same as that in 2020, this capacity could offset 9.87% of the emissions in the same year. Similar studies at home and abroad have shown that the proportion of carbon that urban natural carbon sequestration offsets ranged from 2% [80] to 16.9% [81]. However, the measurement processes have a great influence on this ratio, making cross-sectional comparisons challenging.

5. Discussion

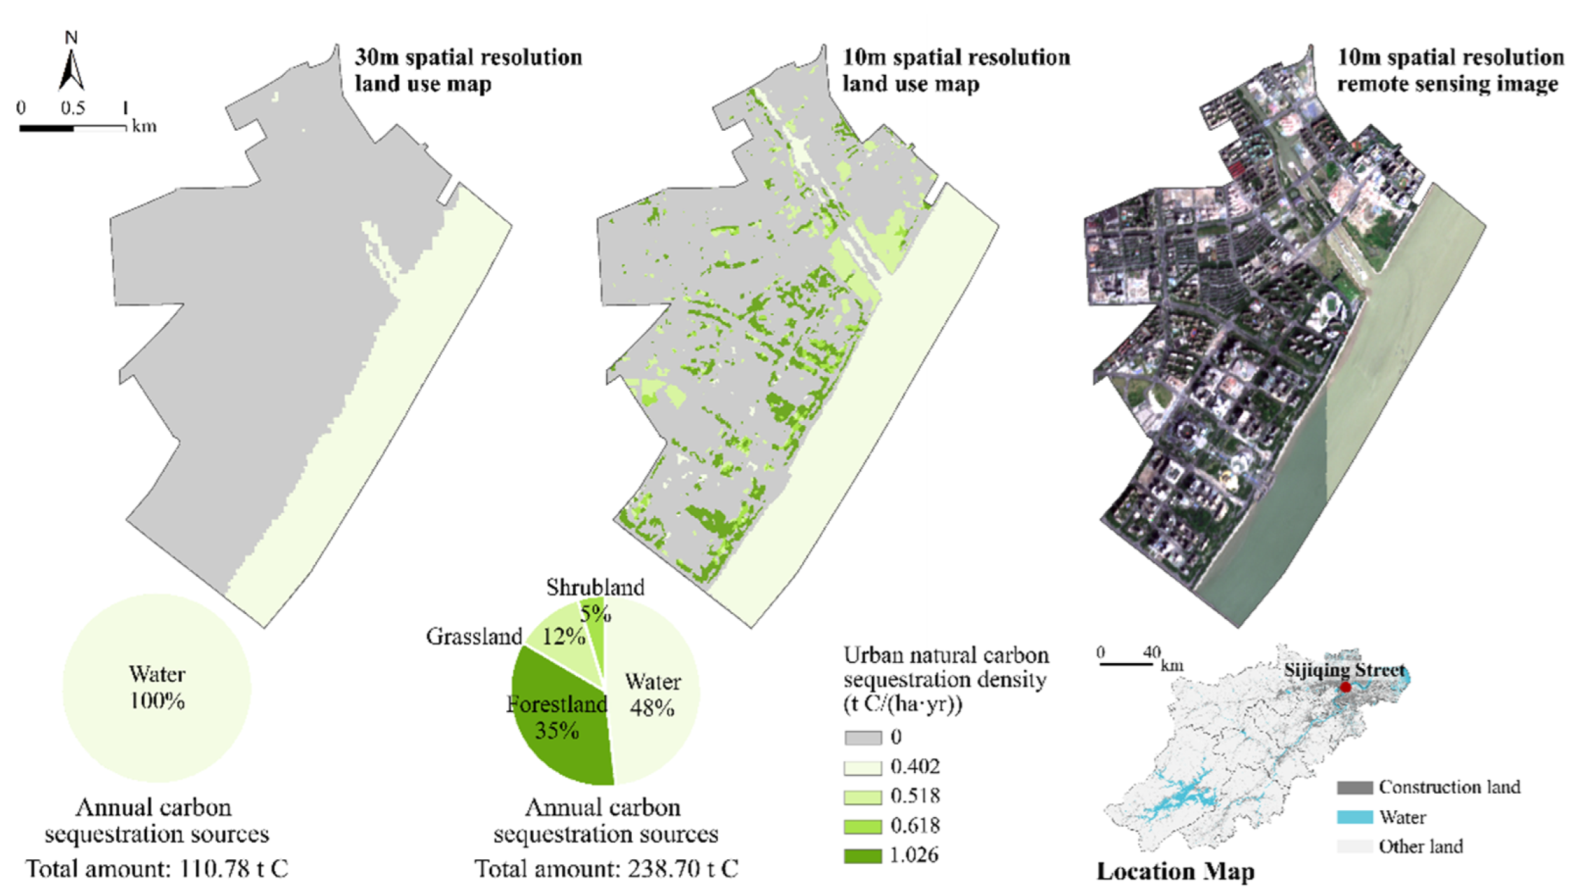
5.1. Optimizing Urban Natural Carbon Sink Measurement System

This study focused on building a more concise, comprehensive, and high-precision system to measure the urban natural carbon sink capacity. It was conducive to describing cities’ amount and spatial pattern of their natural carbon sink capacity more effectively and, thus, supported net-zero carbon city planning. Firstly, based upon high-resolution land use data, this measurement system showed more details of small green spaces’ natural carbon sink capacity, particularly in built-up areas. Globeland30 [82], a 30-m spatial resolution land cover product The National Geomatics Center of China developed, was used as the comparative land use data. For example, we chose Sijiqing Street, where the Hangzhou Municipal People’s Government is located. Globeland30 2020 only identified two types of land use at the street and showed that its annual carbon sequestration was 110.78 t C, which was completely contributed by water. In contrast, the results of this study indicated that, in addition to water, there were still many green spaces with the capacity to sequester carbon at Sijiqing Street, and the total annual carbon sequestered was 238.70 t C (Figure 7). Thus, for urban core areas, small green spaces’ carbon sink capacity can affect urban planners’ perceptions on the intensity and spatial pattern of the carbon sink capacity in this area significantly. A more accurate carbon sink capacity assessment framework can reduce spatial planning strategies’ ambiguity and uncertainty.
Secondly, this study incorporated soil into the measurement of urban natural carbon pools, which improved not only the measurement system’s comprehensiveness but also enhanced the measurement results’ applicability in relevant spatial planning. Similar to the results of previous studies [8,38], this study’s results also showed that soil carbon storage accounted for the highest proportion of the total urban natural carbon storage. In addition, this study’s findings revealed that the soil carbon storage capacity had an impact on the spatial pattern of the urban natural carbon storage capacity, because the soil carbon storage was large and not distributed evenly in the urban space [61].

5.2. Carbon Neutral Contribution of Urban Natural Carbon Sink

The offset ratio of natural carbon sequestration to carbon emissions showed that, although urban natural carbon sequestration was essential to construct a net-zero carbon city, its role was limited. Relying only on increasing the natural carbon sequestration to achieve the net-zero carbon goal is an enormous challenge, so we need to explore many alternative and comprehensive methods, including energy system reform. Among the different land use types, forest land had the highest annual carbon sequestration and accounted for 47.45% of the total, while cropland, the land type with the highest natural carbon sequestration density, had the next-highest annual carbon sequestration, which accounted for 44.85% of the total. These two types of land uses were the most significant contributors to carbon neutrality. Notably, some scholars have believed that the amount of carbon cropland sequesters was neutral, in that they ignored it because the carbon crops fix would return to the atmosphere in a short time [83]. However, one of the characteristics of plant carbon flows in cropland ecosystems is the coexistence of carbon sequestration and carbon emission [84]. In the measurement of carbon emissions, this study calculated the direct or indirect carbon fluxes in cropland ecosystems based upon the final consumption of energy. If crops’ carbon sequestration is ignored, it will result in a short circuit of carbon flux. Therefore, this perspective is unsuitable for studies that focus on the greenhouse gas balance. Further, many empirical studies have demonstrated that cropland’s annual carbon sequestration density is not zero [57,85] and even much higher than that of forest land during the same period [86]. Although cropland had a strong capacity to sequester carbon, forest land was still the most prominent component of the carbon sink system, with comprehensive utility, considering the carbon storage capacity, the natural carbon pool’s stability, the ecosystem’s resilience, the abundance of ecosystem services, and other factors. Hence, it is inappropriate to attempt to increase the annual carbon sequestration by converting forest land to cropland.

5.3. Spatial Planning Strategies to Enhance the Urban Natural Carbon Sink Capacity

This study’s objective was to provide a scientific reference and decision-making basis for the spatial planning strategies of a net-zero carbon city and thus served the development of net-zero carbon cities better. Based upon the research results, the following two strategies are proposed.

5.3.1. Stabilizing and Consolidating the Existing Natural Carbon Sink Capacity of Urban Spaces

Rather than expanding green spaces blindly, a more sustainable spatial planning strategy is to stabilize and consolidate urban spaces’ existing natural carbon sink capacity by controlling the boundary and scale. With respect to the carbon storage capacity, planners need to delineate areas in Hangzhou with a high natural carbon storage capacity and develop corresponding protection measures to prevent carbon emissions attributable to land use change [87]. We used Jenk’s natural breaks method in ArcGIS 10.5 to divide the whole city into six regions according to the natural carbon storage capacity, from very low to extremely high (Figure 8). The evaluation results could be helpful to roughly identify patches with high-carbon storage capacity within the city. Therefore, planners should prioritize the necessary land use transformation activities in areas with relatively low-carbon storage capacity to ensure the relative stability of the urban natural carbon pool [22]. With respect to the capacity to sequester carbon, planners can determine the minimum scale and reasonable structure of green spaces based upon scenario projections of future carbon emissions and the estimation of natural carbon sequestration. With the vision of a net-zero carbon city, spatial planning must control urban sprawl and ensure sufficient green space to provide enough annual carbon sequestration.

5.3.2. Increasing the Increment in Urban Ecosystem’s Annual Carbon Sequestration

The natural carbon sink capacity is not immutable. Spatial planning strategies such as index control can improve an urban space’s natural carbon sequestration efficiency effectively. For urban core areas such as Shangcheng, where the types of green space are primarily urban parks and residential green spaces, it is necessary to control such indices as the green space ratio and tree coverage in the planning area. A green space’s carbon sink efficiency can be improved by extending green spaces, allocating natural communities, and other methods [28]. For areas with a relatively high proportion of cropland, such as Linping, the quantity of agricultural inputs and the use of agricultural machinery should be controlled through such indicators as carbon emissions per mu [88], and more sustainable low-carbon farming methods should be promoted. For forestland-dominated areas such as Lin’an and Chun’an, the forestland’s carbon sequestration efficiency can be improved by controlling the structure of forest age and type, carbon emissions from conservation activities, and other indicators [89,90].

6. Conclusions and Implications

6.1. Conclusions

The problems thatclimate change causes have prompted people to pay more attention to the realization of carbon neutrality, and the natural carbon sink capacity of urban space is an indispensable element in achieving the goal of a net-zero carbon city. From the perspectives of carbon sequestration and storage capacity, this study constructed a more concise, comprehensive, and high-precision system to measure the urban natural carbon sink capacity by including the often-ignored natural carbon sink space in the built-up area and soil into the measurement scope. The measurement results showed that the decision of whether to consider the carbon sink capacity of soil and small green spaces in built-up areas can affect policymakers’ perceptions of the amount and spatial pattern of the urban natural carbon sink capacity. Furthermore, the contribution of the natural carbon sequestration capacity to urban carbon neutrality was integral but limited. The results of this study highlighted that, in order to achieve the goal of a net-zero carbon city, policymakers and the public should attach more importance not only to urban green spaces, particularly small green spaces, but should also enhance soil protection to reduce its degradation. In addition, spatial planning strategies related to carbon sinks need to be coordinated with high-intensity strategies to reduce carbon emissions [91,92,93]. Finally, based upon our measurement results, this study proposed spatial planning strategies to enhance the urban natural carbon sink capacity by scale, structure, and index control. Spatial planning strategies based upon a more comprehensive understanding of the urban natural carbon sink capacity will help cities better cope with the serious challenges of climate change.

6.2. Limitations

There were some limitations in this study. First, we classified urban land use in Hangzhou into seven categories, but in reality, many other factors, such as trees’ age, density, and condition, influence the urban natural carbon sink capacity as well [94]. Future research could establish a better classification system based upon richer data to measure the natural carbon sink capacity in a more accurate way [48]. Secondly, the coefficients used to measure the natural carbon sink capacity were derived largely from the literature. Hence, they were secondary data rather than the results of field measurements. Thus, these coefficients cannot reflect the current situation of a specific city accurately. Future studies can further optimize the measurement results of this study based upon field measurements. Thirdly, the GSOCmap resolution was different from that of the land use data. When spatial data of different resolutions are merged, introducing inaccuracies is inevitable to some extent [95].

Author Contributions

Conceptualization, F.W.; methodology, F.W. and Y.F.; software, Y.F.; formal analysis, Y.F.; writing—original draft preparation, Y.F.; writing—review and editing, F.W.; visualization, Y.F.; project administration, F.W.; and funding acquisition, F.W. and Y.F. All authors have read and agreed to the published version of the manuscript.

Funding

This research was supported by the Zhejiang Provincial Natural Science Foundation of China under grant no. LY19E080025 and the Scientific Research Fund of Zhejiang Provincial Education Department under grant no. Y202148348.

Institutional Review Board Statement

Not applicable.

Informed Consent Statement

Not applicable.

Data Availability Statement

The data presented in this study are available on request from the corresponding author.

Conflicts of Interest

The authors declare no conflict of interest. The funders had no role in the design of the study; in the collection, analyses, or interpretation of the data; in the writing of the manuscript; or in the decision to publish the results.

References

  1. Intergovernmental Panel on Climate Change (IPCC). Global Warming of 1.5 °C. An IPCC Special Report on the Impacts of Global Warming of 1.5 °C above Pre-Industrial Levels and Related Global Greenhouse Gas Emission Pathways, in the Context of Strengthening the Global Response to the Threat of Climate Change, Sustainable Development, and Efforts to Eradicate Poverty. 2018. Available online: https://www.ipcc.ch/sr15/download/ (accessed on 1 January 2022).
  2. Wang, C.; Zhang, Y. Implementation pathway and policy system of carbon neutrality vision. Chin. J. Environ. Manag. 2020, 12, 58–64. (In Chinese) [Google Scholar] [CrossRef] [PubMed]
  3. Deng, X.; Xie, J.; Teng, F. What is carbon neutrality? Clim. Chang. Res. 2021, 17, 107–113. (In Chinese) [Google Scholar] [CrossRef]
  4. Matthews, K.B.; Wardell-Johnson, D.; Miller, D.; Fitton, N.; Jones, E.; Bathgate, S.; Randle, T.; Matthews, R.; Smith, P.; Perks, M. Not seeing the carbon for the trees? Why area-based targets for establishing new woodlands can limit or underplay their climate change mitigation benefits. Land Use Policy 2020, 97, 104690. [Google Scholar] [CrossRef]
  5. Li, J.; Guo, X.; Chuai, X.; Xie, F.; Yang, F.; Gao, R.; Ji, X. Reexamine China’s terrestrial ecosystem carbon balance under land use-type and climate change. Land Use Policy 2021, 102, 105275. [Google Scholar] [CrossRef]
  6. Qiu, Z.; Feng, Z.; Song, Y.; Li, M.; Zhang, P. Carbon sequestration potential of forest vegetation in China from 2003 to 2050: Predicting forest vegetation growth based on climate and the environment. J. Clean. Prod. 2020, 252, 119715. [Google Scholar] [CrossRef]
  7. Yu, J.; Fang, L.; Bian, Z.; Wang, Q.; Yu, Y. A review of the composition of soil carbon pool. Acta Ecol. Sin. 2014, 34, 4829–4838. (In Chinese) [Google Scholar] [CrossRef]
  8. Zhao, S.; Zhu, C.; Zhou, D.; Huang, D.; Werner, J. Organic carbon storage in China’s urban areas. PLoS ONE 2013, 8, e71975. [Google Scholar] [CrossRef] [Green Version]
  9. Seto, K.C.; Dhakal, S.; Bigio, A.; Blanco, H.; Delgado, G.C.; Dewar, D.; Huang, L.; Inaba, A.; Kansal, A.; Lwasa, S. Human settlements, infrastructure and spatial planning. Climate change 2014: Mitigation of climate change. Contribution of Working Group III to the Fifth Assessment Report of the Intergovernmental Panel on Climate Change. In Contribution of Working Group III to the Fifth Assessment Report of the Intergovernmental Panel on Climate Change; Cambridge University Press: Cambridge, UK; New York, NY, USA, 2014. [Google Scholar]
  10. Heikkinen, M.; Ylä-Anttila, T.; Juhola, S. Incremental, reformistic or transformational: What kind of change do C40 cities advocate to deal with climate change? J. Environ. Policy Plan. 2019, 21, 90–103. [Google Scholar] [CrossRef]
  11. Seto, K.C.; Churkina, G.; Hsu, A.; Keller, M.; Newman, P.W.G.; Ramaswami, A. From Low- to Net-Zero Carbon Cities: The Next Global Agenda. Annu. Rev. Env. Resour. 2021, 46, 377–415. [Google Scholar] [CrossRef]
  12. Ma, L.; Bicking, S.; Müller, F. Mapping and comparing ecosystem service indicators of global climate regulation in Schleswig-Holstein, Northern Germany. Sci. Total Environ. 2019, 648, 1582–1597. [Google Scholar] [CrossRef]
  13. Xie, G.; Li, S.; Xiao, Y.; Qi, Y. Value of carbon sink: Concept and evaluation. J. Nat. Resour. 2011, 26, 1–10. (In Chinese) [Google Scholar] [CrossRef]
  14. Xiong, J.; Lu, K.; Jiang, Z.; Zhang, C.; Fu, Q.; Jin, Y. Study and thoughts on territorial spatial planning under the goal of “carbon emissions peak and carbon neutrality”. Urban Plan. Forum 2021, 65, 74–80. (In Chinese) [Google Scholar] [CrossRef]
  15. Page, J.; Kåresdotter, E.; Destouni, G.; Pan, H.; Kalantari, Z. A more complete accounting of greenhouse gas emissions and sequestration in urban landscapes. Anthropocene 2021, 34, 100296. [Google Scholar] [CrossRef]
  16. Trlica, A.; Hutyra, L.R.; Morreale, L.L.; Smith, I.A.; Reinmann, A.B. Current and future biomass carbon uptake in Boston’s urban forest. Sci. Total Environ. 2020, 709, 136196. [Google Scholar] [CrossRef] [PubMed]
  17. Bae, J.; Ryu, Y. High soil organic carbon stocks under impervious surfaces contributed by urban deep cultural layers. Landscape Urban Plan. 2020, 204, 103953. [Google Scholar] [CrossRef]
  18. Cambou, A.; Shaw, R.K.; Huot, H.; Vidal-Beaudet, L.; Hunault, G.; Cannavo, P.; Nold, F.; Schwartz, C. Estimation of soil organic carbon stocks of two cities, New York City and Paris. Sci. Total Environ. 2018, 644, 452–464. [Google Scholar] [CrossRef] [PubMed] [Green Version]
  19. De la Sota, C.; Ruffato-Ferreira, V.J.; Ruiz-García, L.; Alvarez, S. Urban green infrastructure as a strategy of climate change mitigation. A case study in northern Spain. Urban for. Urban Green. 2019, 40, 145–151. [Google Scholar] [CrossRef]
  20. Wen, J. Effects of Urbanization on Carbon Storage and Sequestration in Built-Up Area. Master’s Thesis, Zhejiang University, Hangzhou, China, 2010. (In Chinese). [Google Scholar]
  21. Zong, R. Research on Spatial Layout Pattern of Green Space System in Administrative Region of Xi’an Based on Carbon Sink Performance. Master’s Thesis, Xi’an University of Architecture and Technology, Xi’an, China, 2018. (In Chinese). [Google Scholar]
  22. Lorenz, K.; Lal, R. Managing soil carbon stocks to enhance the resilience of urban ecosystems. Carbon Manag. 2015, 6, 35–50. [Google Scholar] [CrossRef] [Green Version]
  23. Velasco, E.; Roth, M.; Norford, L.; Molina, L.T. Does urban vegetation enhance carbon sequestration? Landscape Urban Plan. 2016, 148, 99–107. [Google Scholar] [CrossRef]
  24. Shi, X.; Zhang, Y.; Han, Z. Review of forest carbon sink measurement methods: Based on choice of Beijing. For. Econ. 2014, 36, 44–49. (In Chinese) [Google Scholar] [CrossRef]
  25. Yu, Y.; Wang, X. Estimation of urban green space carbon sink for ecosystem service function. J. Xi’an Univ. Arch. Technol. (Nat. Sci. Ed.) 2021, 53, 95–102. [Google Scholar] [CrossRef]
  26. Liu, M.; Liu, G. Impact factors and uncertainties of the estimation on soil organic carbon storage. Ecol. Environ. 2014, 23, 1222–1232. (In Chinese) [Google Scholar] [CrossRef]
  27. Ren, X.; Pei, T.; Chen, Y.; Xie, B.; Cheng, D. Impact of land use change on carbon storage in Gansu Province based on carbon density correction. Ecol. Sci. 2021, 40, 66–74. (In Chinese) [Google Scholar] [CrossRef]
  28. Wang, M.; Shi, Q. Evaluation index system and empirical study on green carbon sequestration efficiency in urban high density area: A case study of shanghai huangpu district. Chin. Landsc. Arch. 2016, 32, 18–24. (In Chinese) [Google Scholar]
  29. Wu, N.; Li, W.; Feng, Z.; Wen, T.; Chen, Q. A parametric evaluation model of urban-rural green carbon sinks based on a three-dimensional perspective. City Plan. Rev. 2016, 40, 91–98. (In Chinese) [Google Scholar]
  30. Chen, K.; Liu, R.; Zhang, B.; He, Y.; Xie, H. Forest carbon storage and its dynamic changes of the city-encircling forest belt of Wuhan city. Res. Soil Water Conserv. 2021, 28, 54–59. [Google Scholar] [CrossRef]
  31. Li, C.; Zhu, J.; Zhang, F.; Li, Q.; Tian, Y.; Xiao, W.; Chen, W. Carbon sequestration capacity of Beijing arbor forest based on NbS. J. Beijing For. Univ. 2021, 43, 13–22. (In Chinese) [Google Scholar] [CrossRef]
  32. Dorendorf, J.; Eschenbach, A.; Schmidt, K.; Jensen, K. Both tree and soil carbon need to be quantified for carbon assessments of cities. Urban For. Urban Green. 2015, 14, 447–455. [Google Scholar] [CrossRef]
  33. Davies, Z.G.; Dallimer, M.; Edmondson, J.L.; Leake, J.R.; Gaston, K.J. Identifying potential sources of variability between vegetation carbon storage estimates for urban areas. Environ. Pollut. 2013, 183, 133–142. [Google Scholar] [CrossRef]
  34. Jiang, F.; Chen, C.; Li, C.; Kutia, M.; Sun, H. A Novel Spatial Simulation Method for Mapping the Urban Forest Carbon Density in Southern China by the Google Earth Engine. Remote Sens. 2021, 13, 2792. [Google Scholar] [CrossRef]
  35. Tao, Y.; Li, F.; Liu, X.; Zhao, D.; Sun, X.; Xu, L. Variation in ecosystem services across an urbanization gradient: A study of terrestrial carbon stocks from Changzhou, China. Ecol. Model. 2015, 318, 210–216. [Google Scholar] [CrossRef]
  36. Sallustio, L.; Perone, A.; Vizzarri, M.; Corona, P.; Fares, S.; Cocozza, C.; Tognetti, R.; Lasserre, B.; Marchetti, M. The green side of the grey: Assessing greenspaces in built-up areas of Italy. Urban For. Urban Green. 2019, 37, 147–153. [Google Scholar] [CrossRef]
  37. Speak, A.; Escobedo, F.J.; Russo, A.; Zerbe, S. Total urban tree carbon storage and waste management emissions estimated using a combination of LiDAR, field measurements and an end-of-life wood approach. J. Clean. Prod. 2020, 256, 120420. [Google Scholar] [CrossRef]
  38. Tao, J.; Xie, B.; Ji, B.; Zhang, G.; Luo, Y.; Zhang, C. Carbon sink function and structural characteristics of five major carbon pools in Zhejiang forest ecosystem. J. Hangzhou Norm. Univ. (Nat. Sci. Ed.) 2021, 20, 398–405. (In Chinese) [Google Scholar] [CrossRef]
  39. Sun, S. On the transformation from urban and rural planning to territory development planning. Urban Plan. Forum 2020, 11–17. (In Chinese) [Google Scholar] [CrossRef]
  40. Yan, F.; Yang, Y. Mechanisms and Governance Framework for Carbon Emission Constraints in Spatial Planning. J. Human Settl. West China 2021, 36, 37–45. (In Chinese) [Google Scholar] [CrossRef]
  41. Zheng, D.; Wu, H.; Lin, C.; Weng, T. The formulation of urban carbon reduction unit and integrated planning methodology based on carbon accounting. Urban Plan. Forum 2021, 65, 43–50. (In Chinese) [Google Scholar] [CrossRef]
  42. Pan, H.; Page, J.; Zhang, L.; Chen, S.; Cong, C.; Destouni, G.; Kalantari, Z.; Deal, B. Using comparative socio-ecological modeling to support Climate Action Planning (CAP). J. Clean. Prod. 2019, 232, 30–42. [Google Scholar] [CrossRef]
  43. Fu, S.; Gong, Q.; Xu, T. Construction method of “three-sources green space” of Shenyang City based on carbon sequestration theory. J. Liaoning For. Sci. Technol. 2016, 5–8. (In Chinese) [Google Scholar]
  44. Hangzhou Statistical Bureau. Hangzhou Statistical Yearbook 2021; China Statistical Press: Beijing, China, 2021. (In Chinese) [Google Scholar]
  45. Guo, F.; Wang, C.; Zhang, S. Cluster analysis of carbon emissions peaking trends in Chinese cities. Chin. J. Environ. Manag. 2021, 13, 40–48. (In Chinese) [Google Scholar] [CrossRef]
  46. Gorelick, N.; Hancher, M.; Dixon, M.; Ilyushchenko, S.; Thau, D.; Moore, R. Google Earth Engine: Planetary-scale geospatial analysis for everyone. Remote Sens. Environ. 2017, 202, 18–27. [Google Scholar] [CrossRef]
  47. Food and Agriculture Organization (FAO); The Intergovernmental Technical Panel on Soils (ITPS). Global Soil Organic Carbon Map (GSOCmap) Technical Report; FAO: Rome, Italy, 2018; p. 167. [Google Scholar]
  48. Bartesaghi-Koc, C.; Osmond, P.; Peters, A. Mapping and classifying green infrastructure typologies for climate-related studies based on remote sensing data. Urban For. Urban Green. 2019, 37, 154–167. [Google Scholar] [CrossRef]
  49. Karra, K.; Kontgis, C.; Statman-Weil, Z.; Mazzariello, J.C.; Mathis, M.; Brumby, S.P. Global land use/land cover with Sentinel 2 and deep learning. In Proceedings of the 2021 IEEE International Geoscience and Remote Sensing Symposium IGARSS, Brussels, Belgium, 11–16 July 2021; pp. 4704–4707. [Google Scholar]
  50. Banzhaf, E.; Wu, W.; Luo, X.; Knopp, J. Integrated Mapping of Spatial Urban Dynamics—A European-Chinese Exploration. Part 1—Methodology for Automatic Land Cover Classification Tailored towards Spatial Allocation of Ecosystem Services Features. Remote Sens. 2021, 13, 1744. [Google Scholar] [CrossRef]
  51. Deliry, S.I.; Avdan, Z.Y.; Avdan, U. Extracting urban impervious surfaces from Sentinel-2 and Landsat-8 satellite data for urban planning and environmental management. Environ. Sci. Pollut. Res. 2021, 28, 6572–6586. [Google Scholar] [CrossRef] [PubMed]
  52. Chen, L.; Xue, L.; Xue, Y. Spatial-temporal characteristics of China’s agricultural net carbon sink (in Chinese). J. Nat. Resour. 2016, 31, 596–607. [Google Scholar] [CrossRef]
  53. Tian, Y. The Development of China’s Low-Carbon Agriculture: Production Efficiency, Spatial Difference and Influencing Factors. Ph.D. Dissertation, Huazhong Agriculture University, Wuhan, China, 2015. (In Chinese). [Google Scholar]
  54. Zhao, R. Carbon Cycle of Urban Eco-Economic System and Its Regulation through Land Use Control: A Case Study of Nanjing City. Ph.D. Dissertation, Nanjing University, Nanjing, China, 2011. (In Chinese). [Google Scholar]
  55. Xie, T.; Zhang, H.; Miao, J.; Song, M.; Zeng, Y. Greenhouse gas emission characteristics and source/sink analysis of farmland ecosystem in Hubei Province. J. Agric. Resour. Environ. 2021, 38, 839–848. (In Chinese) [Google Scholar] [CrossRef]
  56. Han, Z.; Meng, Y.; Xu, J.; Wu, Y.; Zhou, Z. Temporal and spatial difference in carbon footprint of regional farmland ecosystem: Taking Jiangsu province as a case. J. Agro-Environ. Sci. 2012, 31, 1034–1041. (In Chinese) [Google Scholar]
  57. Tang, X.; Zhao, X.; Bai, Y.; Tang, Z.; Wang, W.; Zhao, Y.; Wan, H.; Xie, Z.; Shi, X.; Wu, B.; et al. Carbon pools in China’s terrestrial ecosystems: New estimates based on an intensive field survey. Proc. Natl. Acad. Sci. USA 2018, 115, 4021–4026. [Google Scholar] [CrossRef] [PubMed] [Green Version]
  58. Zhou, P.; Hou, H.; Zhang, H.; Liu, X.; Tan, W. The development prospects and implementation suggestions of increasing soil carbon storage in the context of carbon neutrality. Environ. Prot. 2021, 49, 63–67. (In Chinese) [Google Scholar] [CrossRef]
  59. Zhou, Y.; Lyu, M.; Xie, J.; Yang, Z.; Jiang, J.; Yang, Y. Sources, characteristics and stability of organic carbon in deep soil. J. Subtrop. Resour. Environ. 2013, 8, 48–55. (In Chinese) [Google Scholar] [CrossRef]
  60. Dong, J.; Zhou, K.; Jiang, P.; Wu, J.; Fu, W. Revealing horizontal and vertical variation of soil organic carbon, soil total nitrogen and C:N ratio in subtropical forests of southeastern China. J. Environ. Manag. 2021, 289, 112483. [Google Scholar] [CrossRef] [PubMed]
  61. Adhikari, K.; Owens, P.R.; Libohova, Z.; Miller, D.M.; Wills, S.A.; Nemecek, J. Assessing soil organic carbon stock of Wisconsin, USA and its fate under future land use and climate change. Sci. Total Environ. 2019, 667, 833–845. [Google Scholar] [CrossRef] [PubMed]
  62. Sun, W.; Huang, Y.; Zhang, W.; Yu, Y. Key issues on soil carbon sequestration potential in agricultural soils. Adv. Earth Sci. 2008, 23, 996–1004. (In Chinese) [Google Scholar] [CrossRef]
  63. Lai, L. Carbon Emission Effect of Land Use in China. Ph.D. Dissertation, Nanjing University, Nanjing, China, 2010. (In Chinese). [Google Scholar]
  64. Xu, L.; Shi, Y.; Fang, H.; Zhou, G.; Xu, X.; Zhou, Y.; Tao, J.; Ji, B.; Xu, J.; Li, C.; et al. Vegetation carbon stocks driven by canopy density and forest age in subtropical forest ecosystems. Sci. Total Environ. 2018, 631–632, 619–626. [Google Scholar] [CrossRef] [PubMed]
  65. Dai, W.; Zhao, K.; Gao, Z.; Liu, K.; Zhang, F.; Fu, W. Spatial variation characteristics of carbon density and storage in forest ecosystems in a typical subtropical region. Acta Ecol. Sin. 2017, 37, 7528–7538. (In Chinese) [Google Scholar] [CrossRef] [Green Version]
  66. Ji, B.; Yin, J.; Shi, Y.; Xu, L.; Tao, J.; Zhou, Y. Predicting Vegetation Carbon Density Distribution in different Terrains in Subtropical Forests in China. J. Sustain. For. 2021, 40, 473–490. [Google Scholar] [CrossRef]
  67. Xu, L.; He, N.; Yu, G. A dataset of carbon density in Chinese terrestrial ecosystems (2010s). China Sci. Data 2019, 4, 90–96. [Google Scholar]
  68. Xu, L.; Yu, G.; He, N.; Wang, Q.; Gao, Y.; Wen, D.; Li, S.; Niu, S.; Ge, J. Carbon storage in China’s terrestrial ecosystems: A synthesis. Sci. Rep. 2018, 8. [Google Scholar] [CrossRef]
  69. Lu, F.; Zhang, Y.; Qin, Y.; Chen, Z.; Wang, G. Spatial patterns of provincial carbon source and sink in China. Prog. Geogr. 2013, 32, 1751–1759. (In Chinese) [Google Scholar]
  70. Xia, C. Multi-Scale Studies on Urban Carbon Metabolism from the Perspective of Land Use and Scenario Analysis of Emission Reduction. Ph.D. Dissertation, Zhejiang University, Hangzhou, China, 2019. (In Chinese). [Google Scholar]
  71. Guo, X.; Chuai, X.; Zhang, M.; Liang, H.; Li, J.; Zuo, T. Spatio-temporal analysis of land-use change and the impact on terrestrial ecosystems carbon storage in Yangtze River City Group. Resour. Environ. Yangtze Basin 2019, 28, 269–280. [Google Scholar] [CrossRef]
  72. Zhu, W.; Zhang, J.; Cui, Y.; Zheng, H.; Zhu, L. Assessment of territorial ecosystem carbon storage based on land use change scenario: A case study in Qihe River Basin. Acta Geogr. Sin. 2019, 74, 446–459. (In Chinese) [Google Scholar] [CrossRef]
  73. Wu, J.; Cheng, X.; Jiao, J.; Xiao, H.; Yang, L.; Wang, H.; Zhang, F.; Ellis, E.C. Changes in land use and land cover and soil organic carbon storage in the densely populated village landscapes of China’s Yangtze Plain from the 1940 to 2002. Acta Ecol. Sin. 2010, 30, 1397–1411. (In Chinese) [Google Scholar]
  74. Shan, Y.; Guan, D.; Liu, J.; Mi, Z.; Liu, Z.; Liu, J.; Schroeder, H.; Cai, B.; Chen, Y.; Shao, S.; et al. Methodology and applications of city level CO2 emission accounts in China. J. Clean. Prod. 2017, 161, 1215–1225. [Google Scholar] [CrossRef] [Green Version]
  75. Shan, Y.; Guan, D.; Hubacek, K.; Zheng, B.; Davis, S.J.; Jia, L.; Liu, J.; Liu, Z.; Fromer, N.; Mi, Z.; et al. City-level climate change mitigation in China. Sci. Adv. 2018, 4, q390. [Google Scholar] [CrossRef] [PubMed] [Green Version]
  76. Zhejiang Provincial Development and Reform Commission (ZPDRC). Guidelines for Provincial Greenhouse Gas Inventory of Zhejiang (2018 Revised Edition); ZPDRC: Hangzhou, China, 2018. (In Chinese) [Google Scholar]
  77. Feng, B.; Wang, X.; Liu, B. Provincial variation in energy efficiency across China’s construction industry with carbon emission considered. Resour. Sci. 2014, 36, 1256–1266. (In Chinese) [Google Scholar]
  78. Zhao, M.; Kong, Z.; Escobedo, F.J.; Gao, J. Impacts of urban forests on offsetting carbon emissions from industrial energy use in Hangzhou, China. J. Environ. Manag. 2010, 91, 807–813. [Google Scholar] [CrossRef]
  79. Chen, W.Y. The role of urban green infrastructure in offsetting carbon emissions in 35 major Chinese cities: A nationwide estimate. Cities 2015, 44, 112–120. [Google Scholar] [CrossRef]
  80. Chuai, X.; Yuan, Y.; Zhang, X.; Guo, X.; Zhang, X.; Xie, F.; Zhao, R.; Li, J. Multiangle land use-linked carbon balance examination in Nanjing City, China. Land Use Policy 2019, 84, 305–315. [Google Scholar] [CrossRef]
  81. Vaccari, F.P.; Gioli, B.; Toscano, P.; Perrone, C. Carbon dioxide balance assessment of the city of Florence (Italy), and implications for urban planning. Landsc. Urban Plan. 2013, 120, 138–146. [Google Scholar] [CrossRef]
  82. Jun, C.; Ban, Y.; Li, S. Open access to Earth land-cover map. Nature 2014, 514, 434. [Google Scholar] [CrossRef] [Green Version]
  83. Fang, J.; Guo, Z.; Piao, S.; Chen, A. Terrestrial Vegetation Carbon Sinks in China, 1981–2000. Sci. China Ser. D Earth Sci. 2007, 12, 804–812. [Google Scholar] [CrossRef]
  84. Liu, X.; Xu, W.; Li, Z.; Chu, Q.; Yang, X.; Chen, F. The missteps, improvement and application of carbon footprint methodology in farmland ecosystems with the case study of analyzing the carbon efficiency of China’s intensive farming. Chin. J. Agric. Resour. Reg. Plan. 2013, 34, 1–11. (In Chinese) [Google Scholar] [CrossRef]
  85. Zhao, N.; Zhou, L.; Zhuang, J.; Wang, Y.; Zhou, W.; Chen, J.; Song, J.; Ding, J.; Chi, Y. Integration analysis of the carbon sources and sinks in terrestrial ecosystems. Acta Ecol. Sin. 2021, 1–12. (In Chinese) [Google Scholar] [CrossRef]
  86. Liu, X.; Xu, W.; Li, Z.; Chu, Q.; Yang, X.; Chen, F. The missteps, improvement and application of carbon footprint methodology in farmland ecosystems with the case study of analyzing the carbon efficiency of China’s intensive farming (continued). Chin. J. Agric. Resour. Reg. Plan. 2014, 35, 1–7. (In Chinese) [Google Scholar] [CrossRef]
  87. Ma, X.; Wang, Z. Progress in the study on the impact of land-use change on regional carbon sources and sinks. Acta Ecol. Sin. 2015, 35, 5898–5907. (In Chinese) [Google Scholar] [CrossRef]
  88. Wang, L.; Zhao, J.; Guo, N.; An, J.; Jiang, Y. Spatial-temporal variation and impact factors of carbon source and sink of farmland ecosystem in Linyi. J. Soil Water Conserv. 2015, 29, 183–187. (In Chinese) [Google Scholar] [CrossRef]
  89. Ma, J.; Li, X.; Baoquan, J.; Liu, X.; Li, T.; Zhang, W.; Liu, W. Spatial variation analysis of urban forest vegetation carbon storage and sequestration in built-up areas of Beijing based on i-Tree Eco and Kriging. Urban For. Urban Green. 2021, 66, 127413. [Google Scholar] [CrossRef]
  90. Zhou, J.; Xiao, R.; Zhuang, C.; Deng, Y. Urban forest carbon sink and its estimation methods: A review. Chin. J. Ecol. 2013, 32, 3368–3377. (In Chinese) [Google Scholar] [CrossRef]
  91. Yadav, D.; Kumari, R.; Kumar, N.; Sarkar, B. Reduction of waste and carbon emission through the selection of items with cross-price elasticity of demand to form a sustainable supply chain with preservation technology. J. Clean. Prod. 2021, 297, 126298. [Google Scholar] [CrossRef]
  92. Vandana; Singh, S.R.; Yadav, D.; Sarkar, B.; Sarkar, M. Impact of Energy and Carbon Emission of a Supply Chain Management with Two-Level Trade-Credit Policy. Energies 2021, 14, 1569. [Google Scholar] [CrossRef]
  93. Sepehri, A.; Mishra, U.; Tseng, M.; Sarkar, B. Joint Pricing and Inventory Model for Deteriorating Items with Maximum Lifetime and Controllable Carbon Emissions under Permissible Delay in Payments. Mathematics 2021, 9, 470. [Google Scholar] [CrossRef]
  94. Graça, M.; Alves, P.; Gonçalves, J.; Nowak, D.J.; Hoehn, R.; Farinha-Marques, P.; Cunha, M. Assessing how green space types affect ecosystem services delivery in Porto, Portugal. Landsc. Urban Plan. 2018, 170, 195–208. [Google Scholar] [CrossRef]
  95. Gotway, C.A.; Young, L.J. Combining Incompatible Spatial Data. J. Am. Stat. Assoc. 2002, 97, 632–648. [Google Scholar] [CrossRef] [Green Version]
Figure 1. Research framework.
Sustainability 14 02680 g001
Figure 2. Study area.
Sustainability 14 02680 g002
Figure 3. Land use map of Hangzhou in 2020.
Sustainability 14 02680 g003
Figure 4. Map of Hangzhou’s urban natural carbon sequestration density in 2020.
Sustainability 14 02680 g004
Figure 5. Map of Hangzhou’s urban natural carbon pool density.
Sustainability 14 02680 g005
Figure 6. Changes in Hangzhou’s carbon emissions and carbon emission intensities from 2015 to 2019.
Sustainability 14 02680 g006
Figure 7. Differences in the results of measurements of the capacity to sequester carbon at 10m and 30m spatial resolutions at Sijiqing Street, Hangzhou.
Sustainability 14 02680 g007
Figure 8. Zoning of Hangzhou’s urban natural carbon storage capacity.
Sustainability 14 02680 g008
Table 1. Comparison of natural carbon sink capacity measurement systems in previous studies.
AuthorsInclusion of Soil Carbon Sink CapacityInclusion of Carbon Sink Capacity of Small Green Spaces in Built-Up AreaOpen Source Underlying Landcover Map/Remote Sensing Imagery
Wang et al. [28]
Wu et al. [29]
Chen et al. [30]
Li et al. [31]
Dorendorf et al. [32]
Jiang et al. [34]
Tao et al. [35]
Sallustio et al. [36]
Speak et al. [16]
Trlica et al. [37]
Tao et al. [38]Not stated
Table 2. Definitions of land use types.
CodeLand Use TypesDefinition
1Forest landLand with tree crown cover of more than 20% and vegetation dominated by trees.
2ShrublandLand with vegetation dominated by scrub, shrubs, or stunted trees.
3GrasslandLand with vegetation dominated by grasses.
4CroplandLand that is primarily for the regular cultivation of crops using the surface tillage layer and sown at least once a year.
5WaterNatural, semi-natural and artificial waters, including rivers, lakes, canals, etc.
6Construction landLand with artificially constructed surfaces, including residential areas, commercial land, etc., excluding water and vegetation therein.
7Bare landLand with a soil surface and very little vegetation cover.
Table 3. Economic coefficient, water content, and carbon fixation rate of main crops.
Crop TypeEconomic CoefficientMoisture Content (%)Carbon Fixation Rate
Grain crop0.4013.30.45
Cotton0.108.00.45
Rapeseed0.259.00.45
Sesame0.1515.00.45
Peanut0.439.00.45
Sugar cane0.505.00.45
Vegetable0.609.00.45
Melon as Fruit0.709.00.45
Others0.4012.00.45
Table 4. Coefficients involved in the measurement of the natural carbon sink capacity of urban spaces.
Land Use TypeAnnual Carbon Sequestration Density
(t C/(ha∙yr))
SourcesVegetation/Water Carbon Pool Density
(t C/ha)
Sources
Forest land1.026[20,29,63]35.96[6,64,65,66,67]
Shrubland0.618[20,29,63]9.45[6,57,67,68]
Grassland0.518[29,69]5.03[57,68]
Cropland5.374This study//
Water0.402[70]0.32 (Water body)[71,72]
24.5 (Sediment)[73]
Table 5. Carbon emission factors of fossil fuels.
Fuel TypeNet Calorific Value
(TJ/104 t, 108 m3)
Default Carbon Content
(t C/TJ)
Carbon Oxidation Rate
IndustryOther Socioeconomic Sectors
Raw coal209.0826.370.900.85
Cleaned coal263.4425.410.900.85
Other washed coal104.5425.410.900.85
Briquettes188.3333.560.900.85
Gangue83.63200.900.85
Coke284.3529.420.900.85
Other coking products284.3529.420.900.85
Coke oven gas1798.0913.580.99
Blast Furnace gas376.3470.80.99
Converter gas794.549.60.99
Other gas1425.512.20.99
Gasoline430.718.90.98
Kerosene430.719.60.98
Diesel Oil426.5220.20.98
Fuel Oil418.1621.10.98
Naphtha413.98200.98
Lubricants429.45200.98
Paraffin waxes399.34200.98
Petroleum coke319.47200.98
Liquefied Petroleum gas501.7917.20.98
Refinery gas460.5518.20.99
Other petroleum products418.16200.98
Natural gas3893.115.320.99
Liquefied Natural Gas514.3415.320.99
Table 6. Carbon emission factors of main industrial processes.
Industrial ProcessCarbon Emission Factor (t CO2/t)
Ammonia production1.5000
Soda ash production0.4150
Cement production0.2906
Steel production1.7890
Publisher’s Note: MDPI stays neutral with regard to jurisdictional claims in published maps and institutional affiliations.

