Article

The Difference in Open Innovation between Open Access and Closed Access, According to the Change of Collective Intelligence and Knowledge Amount

1
Daegu Gyeongbuk Institute of Science and Technology, and Open Innovation Academy, Seoul National University, Seoul 42988, Korea
2
Cardiff School of Management, Cardiff Metropolitan University, Cardiff CF5 2YB, UK
3
Korea Institute of Science and Technology Information, Seoul 02456, Korea
4
Local Development Research Institute (LADI), Daegu 42768, Korea
*
Author to whom correspondence should be addressed.
Sustainability 2022, 14(5), 2574; https://doi.org/10.3390/su14052574
Submission received: 23 January 2022 / Revised: 16 February 2022 / Accepted: 21 February 2022 / Published: 23 February 2022

Abstract

:
This study explored the differences in the effects of collective intelligence and references on open innovation between open and closed access journals. This study analyzed the moderating effect of references on the motivation of collective intelligence on open innovation from 2003 to 2006 and 2013 to 2016, considered to be the digital transformation era. The Scopus database on open and closed access journals was used for ordinary regression analysis. During the 2003–2006 period, only papers in closed access journals demonstrated sufficient effect of collective intelligence and reference on open innovation and the effective moderating role of reference. However, between 2013 and 2016, papers in open and closed access journals demonstrated the incentive effects of collective intelligence and references on citation and the moderating role of references on the correlation between collective intelligence and citation. The increase in digital transformation strengthens the collective intelligence and references of open access journals, and citations of open access journals nearly surpass those of closed access journals.

1. Introduction

Since the 2000s, with the arrival of the fourth industrial revolution, online open access journals (OAJs) have emerged, which can be considered the second information technology (IT) revolution or digital transformation in the journal industry [1,2]. With the explosion of cyber space from social network system to online academic communities, the collective intelligence (CI) of scholars in online OAJs became a subject of debate during the COVID-19 pandemic. CI is not strongly correlated with the average or maximum individual intelligence of group members; however, it is correlated with other factors, such as the average social sensitivity of group members, the equality in the distribution of conversational turn-taking, and the proportion of women in the group [3]. Nevertheless, managers can design the powerful systems that they need to motivate creative results by recombining CI genome “genes”, such as crowd over hierarchy, love or glory over money, collaboration over collection, and group decision over individual decisions, based on the work required [4]. Although the accessibility and public interest of science has been recognized and legitimized by the global scientific community and science institutions over the past 300 years, the whole paradigm of open science and its social contract is being challenged by various “enemies”, such as market-based privatized commercial science [5]. In the digital transformation era, it is important to understand the differences in CI between closed and OAJs, as CI is a kind of anthropology in cyber space [6]. Therefore, this study posed the following research questions:
Question 1 (Q1):
Does CI motivate open innovation in OAJs as it does in closed access journals?
Question 2 (Q2):
Is the effect of the amount of knowledge, that is, the number of references, similar in open and closed access journals when the motivation of CI on open innovation is moderated?
Although there are barriers to mobilizing CI in research, differences between open and closed access journals in the CI’s operation, and the moderating effect of knowledge in the knowledge-based economy, are unknown [7]. As the OAJ industry is not a newly emerged industry, but a newly converted industry, it cannot escape the conflict with the closed access journal industry. Therefore, when selecting between closed and OAJs, differences in trigger factors to motivate citation amount, that is, the amount of open innovation of journals, such as research questions, are crucial.

1.1. Literature Review and Hypothesis

1.1.1. Collective Intelligence

CI comes from the mutual engagement of people to create better solutions to problems that would otherwise be impossible through the synergistic effect of collective handling and aggregation of advice and criticism [8,9]. As such, under certain conditions, a group of ordinary people can achieve better results than any individual in the group, as diversity not only adds different perspectives to the group, but also makes it easier for individuals to express their real ideas. Diversity helps preserve independence, which is required for a group of collective wisdom [10,11]. CI can be defined as the ability of a group to solve more problems than its individual members [12]. According to Linux, Threadless, InnoCentive, Google, and Wikipedia, CI at firm levels has already been proven to work, and CI systems can be designed and managed to fit specific needs, as having a group of smart people alone is not enough to form a smart group [4,13]. The spectacular emergence of the Internet and associated information technology has created unprecedented opportunities for new types of interactions—in other words, emergent CI—such as creating intellectual capital via email, instant messaging, news groups, chat rooms, blogs, wikis, and podcasts [14,15]. The connection between people and computers should be considered to ensure collective behavior that is more intelligent than what any individual, group, or computer has done, as doing things “collectively” does not necessarily make them great [16].
Hypothesis 1.
CI motivates creative knowledge, which can be cited more than others.
CI triggers creative knowledge. In addition, citation index is normally good evidence of scientific creativity, although it can provide uncritical references to fraudulent, incomplete, or obsolete data. A citation implies a relationship between part or all of the cited document and part or all of the citing document, as citation is one document’s acknowledgement to another, and vice versa [17]. In fact, citation distribution provides an insight into the relative popularity of scientific publications and a more complete measure of popularity than the average or total number of citations [18].
This study used a linear logic when considering CI in terms of the number of authors at hypothesis 1. A linear thinking style is defined as a preference for attending to external data, facts, and processing, while a nonlinear thinking style is defined in terms of internal feelings, impressions, intuitions, and sensations [19]. Moreover, according the perspective that “linear thinking is related mostly with cognitive intelligence, while nonlinear thinking is related mostly with emotional intelligence”, some parts of CI could be nonlinear. This study only focuses on the cognitive intelligence aspects of collective intelligence [20].

1.1.2. Reference or Citation

The bibliographic analysis of reference–citation relations can examine four categories of structure, namely direct citation, bibliographic coupling, co-citation clustering, and co-citation analysis, in addition to measuring the number of references or citations [21]. A paper is counted as one citation in the bibliographic reference, although it is actually cited many times in the citing article, which means the cited work makes various contributions to the citing paper [22]. Unlike the citation tradition that assumes all citations are of similar value and weight, content-based citation analysis (CCA) addresses the value of citation with the interpretation of its context at the syntactic and semantic levels [23]. The specific contexts represented in the modern citation can be deconstructed from the perspective of the cultural evolution of scientific communication, as reference lists are aggregated in scientometric analysis using one (or sometimes two) of the available contexts to reduce complexity [24]. A citation index is an ordered list of cited articles, each accompanied by a list of citing articles that is identified as a source, with the cited article as a reference [25]. Self-reference or self-citation can be seen as part of a more comprehensive rhetorical strategy to emphasize the author’s personal contribution to a study and strengthen their knowledge claims, research credibility, and wider standing in the discipline [26].
Hypothesis 2.
Sufficient reference motivates creative knowledge, which can be cited more than others.

1.1.3. Amount of Knowledge and Open Innovation

People have sufficient relevant knowledge of human attitudes and can easily predict people’s attitudes in detail based on low or poor amount of relevant knowledge [27]. Based on the cultural environment of organizations or firms, taking into consideration other papers, patents, opinions, or project teams, such as research teams, is more or less likely to improve inter-research projects and inter-organizational knowledge sharing [28]. The abundance of external knowledge in addition to the application of firm resources—that is, the amount of knowledge inside and outside firms—has a direct impact on a firm’s searching strategy in terms of breadth, depth, innovative performance, open strategy, and results [29]. Firms can adopt an inverted U-shaped performance if they search externally widely and deeply, providing sufficient references for firm strategy and enhancing the strength of the firms’ appropriability strategies, even if there is a concave relationship between the breadth of external search and formal collaboration for innovation [30,31]. The depth of an open search is positively correlated with the firms’ incremental innovation performance, whereas the breath of an open search is positively correlated with radical innovation performance [32]. The absorptive capacity indicates that the firm has sufficient internal research and development (R&D) experience or references in copied or tacit knowledge to motivate open innovation [33]. A higher-order model of absorptive capacities for open innovation includes three factors: recognition capacity, including external scanning and strategic assessment; assimilation capacity, including coordinating, integrating, and knowledge management; and exploitation capacity, including resource cognition and recombining [34]. Sufficient knowledge, including reference, can improve the absorptive capacity and increase the effect of mechanisms that trigger open innovation [33,34].
Hypothesis 3.
Sufficient knowledge, including reference, can moderate the motivating effect of CI on open innovation.

1.1.4. Open and Closed Access Journals

The primary reason for publishing OAJs is the principle of free access; however, authors who have not published papers in OAJs attribute this to their unfamiliarity with such journals [35]. The Internet provides free global availability of scientific journal articles through OAJs or via authors posting articles published in subscription journals to open web repositories [36]. This is not publicly agreed upon by the publishers that hold the copyrights of the journal papers [37]. Open access (OA) emerged in the early 1990s in the same sprit as open-source software projects [36,38]. In 2000, increasingly more professional OA publishers appeared, such as BioMedGeneral, Public Library of Science, Hindawi, Bentham Open, and the Multidisciplinary Digital Publishing Institute. According to the detailed records in the Directory of Open Access Journals (DOAJ), the number of OA peer-reviewed journals reached around 5000 in 2009 [36,38]. OAJs, particularly gold OAJs, as well as delayed OA, hybrid OA, and green OA journals provide readers with all articles free of charge at the time of publication on the Internet, covering the costs associated with publication by means other than subscription. Delayed OA is a type of closed access subscription journal, which makes articles OA after a period of time [39]. Another type of closed access subscription journal is hybrid OA, which allows authors to pay a fee to make their articles freely available online.
Green OA refers to the self-archiving of an article version, often not the final published version, on the author’s personal website or in an institutional or subject repository [39]. Gold OA can be considered as disruptive innovation that destroys the existing business model or industry, such as subscription-based closed access journals, as it combines new technology, namely digital distribution of content using the Internet, with a new model of free distribution to readers with fees paid by the authors or through other channels [39,40]. Studies on OA in philosophy, political science, electrical and electronic engineering, and mathematics demonstrated that papers available on the Internet free of charge had a greater impact, as they were measured using citations in the ISI Web of Science database [41]. In contrast, another study indicated that while OA articles received significantly more downloads and reach a broader audience in the first year, citations were infrequent or earlier than that of subscription access articles of over three years [42]. A longitudinal study on scholars’ attitudes and behavior toward OAJ publication revealed that while authors’ publishing in and awareness of OAJs increased, poor reputation and lack of peer review in such journals were a concern [43,44]. Although there were concerns that OAJs may reduce quality standards in order to increase revenue from authors’ fees, this was not the case in practice [45]. Furthermore, the average citation rate of OAJs is approximately 30% higher than subscription journals, after controlling for discipline (medicine and health versus others), journal age (three time periods), and publisher location (largest publishing countries versus other countries) [46]. The differences largely disappeared in most subcategories, except for journals launched before 1996 [43]. Publication fees or article processing charges (APCs), which have become the predominant means for funding professional OA publications, include diverse sources, such as discretionary (institutional) funds (32%), grant or contract (24%), personal funds (15%), fee waived (14%), institutional funding (OA policy), and national funding (OA policy; 5%) [36,47]. The National Institute of Health (NIH) has an OA policy in terms of institutional funding, which requires OA availability of the results of funded research projects [37,46]. However, a negative consequence of the rapid growth of the scholarly OA publishing industry, funded by APCs, is the emergence of publishers and journals with questionable marketing and peer review practices, in addition to the significant increase in the one-year subscription fees of major closed access journal publishers, such as Elsevier in United Kingdom universities and University of California (UC) universities in the United States [46,47,48,49,50].
Hypothesis 1-1-1.
In closed access journals between 2003 and 2006, CI motivated creative knowledge, which could be cited more than others.
Hypothesis 1-1-2.
In closed access journals between 2013 and 2016, CI motivated creative knowledge, which could be cited more than others.
Hypothesis 1-2-1.
In OAJs between 2003 and 2006, CI motivated creative knowledge, which could be cited more than others.
Hypothesis 1-2-2.
In OAJs between 2013 and 2016, CI motivated creative knowledge, which could be cited more than others.
Hypothesis 2-1-1.
In closed access journals between 2003 and 2006, sufficient reference motivated creative knowledge, which was cited more than others.
Hypothesis 2-1-2.
In closed access journals between 2013 and 2016, sufficient reference motivated creative knowledge, which was cited more than others.
Hypothesis 2-2-1.
In OAJs between 2003 and 2006, sufficient reference motivated creative knowledge, which was cited more than others.
Hypothesis 2-2-2.
In OAJs between 2013 and 2016, sufficient reference motivated creative knowledge, which was cited more than others.
Hypothesis 3-1-1.
In closed access journals between 2003 and 2006, sufficient knowledge amount, including reference, moderated the motivating effect of CI on open innovation.
Hypothesis 3-1-2.
In closed access journals between 2013 and 2016, sufficient knowledge amount, including reference, moderated the motivating effect of CI on open innovation.
Hypothesis 3-2-1.
In OAJs between 2003 and 2006, sufficient knowledge amount, including reference, moderated the motivating effect of CI on open innovation.
Hypothesis 3-2-2.
In OAJs between 2013 and 2016, sufficient knowledge amount, including reference, moderated the motivating effect of CI on open innovation.
Before the appearance of smartphone-based mobile Internet around 2003–2006, the growth of OAJs was insufficient, with little attention from the academic community, as Internet access grew worldwide, but remained higher in advanced economies [51]. From 2003 to 2006, there were no effects on OAJs, such as CI, reference amount, or moderating effects, as prior to this, Internet use was not pervasive without smartphones [52]. However, between 2003 and 2006, except for OAJs, all journals had an impact on CI, reference as knowledge amount, and moderating effects based on the literature of open and closed access journals.
Digital transformation is “a process where digital technologies create disruptions triggering strategic responses from organizations that seek to alter their value creation paths while managing the structural changes and organizational barriers that affect the positive and negative outcomes of this process” [53,54]. As such, the quality of the papers in open access journals, including citation, is approaching that of closed access journals [53].

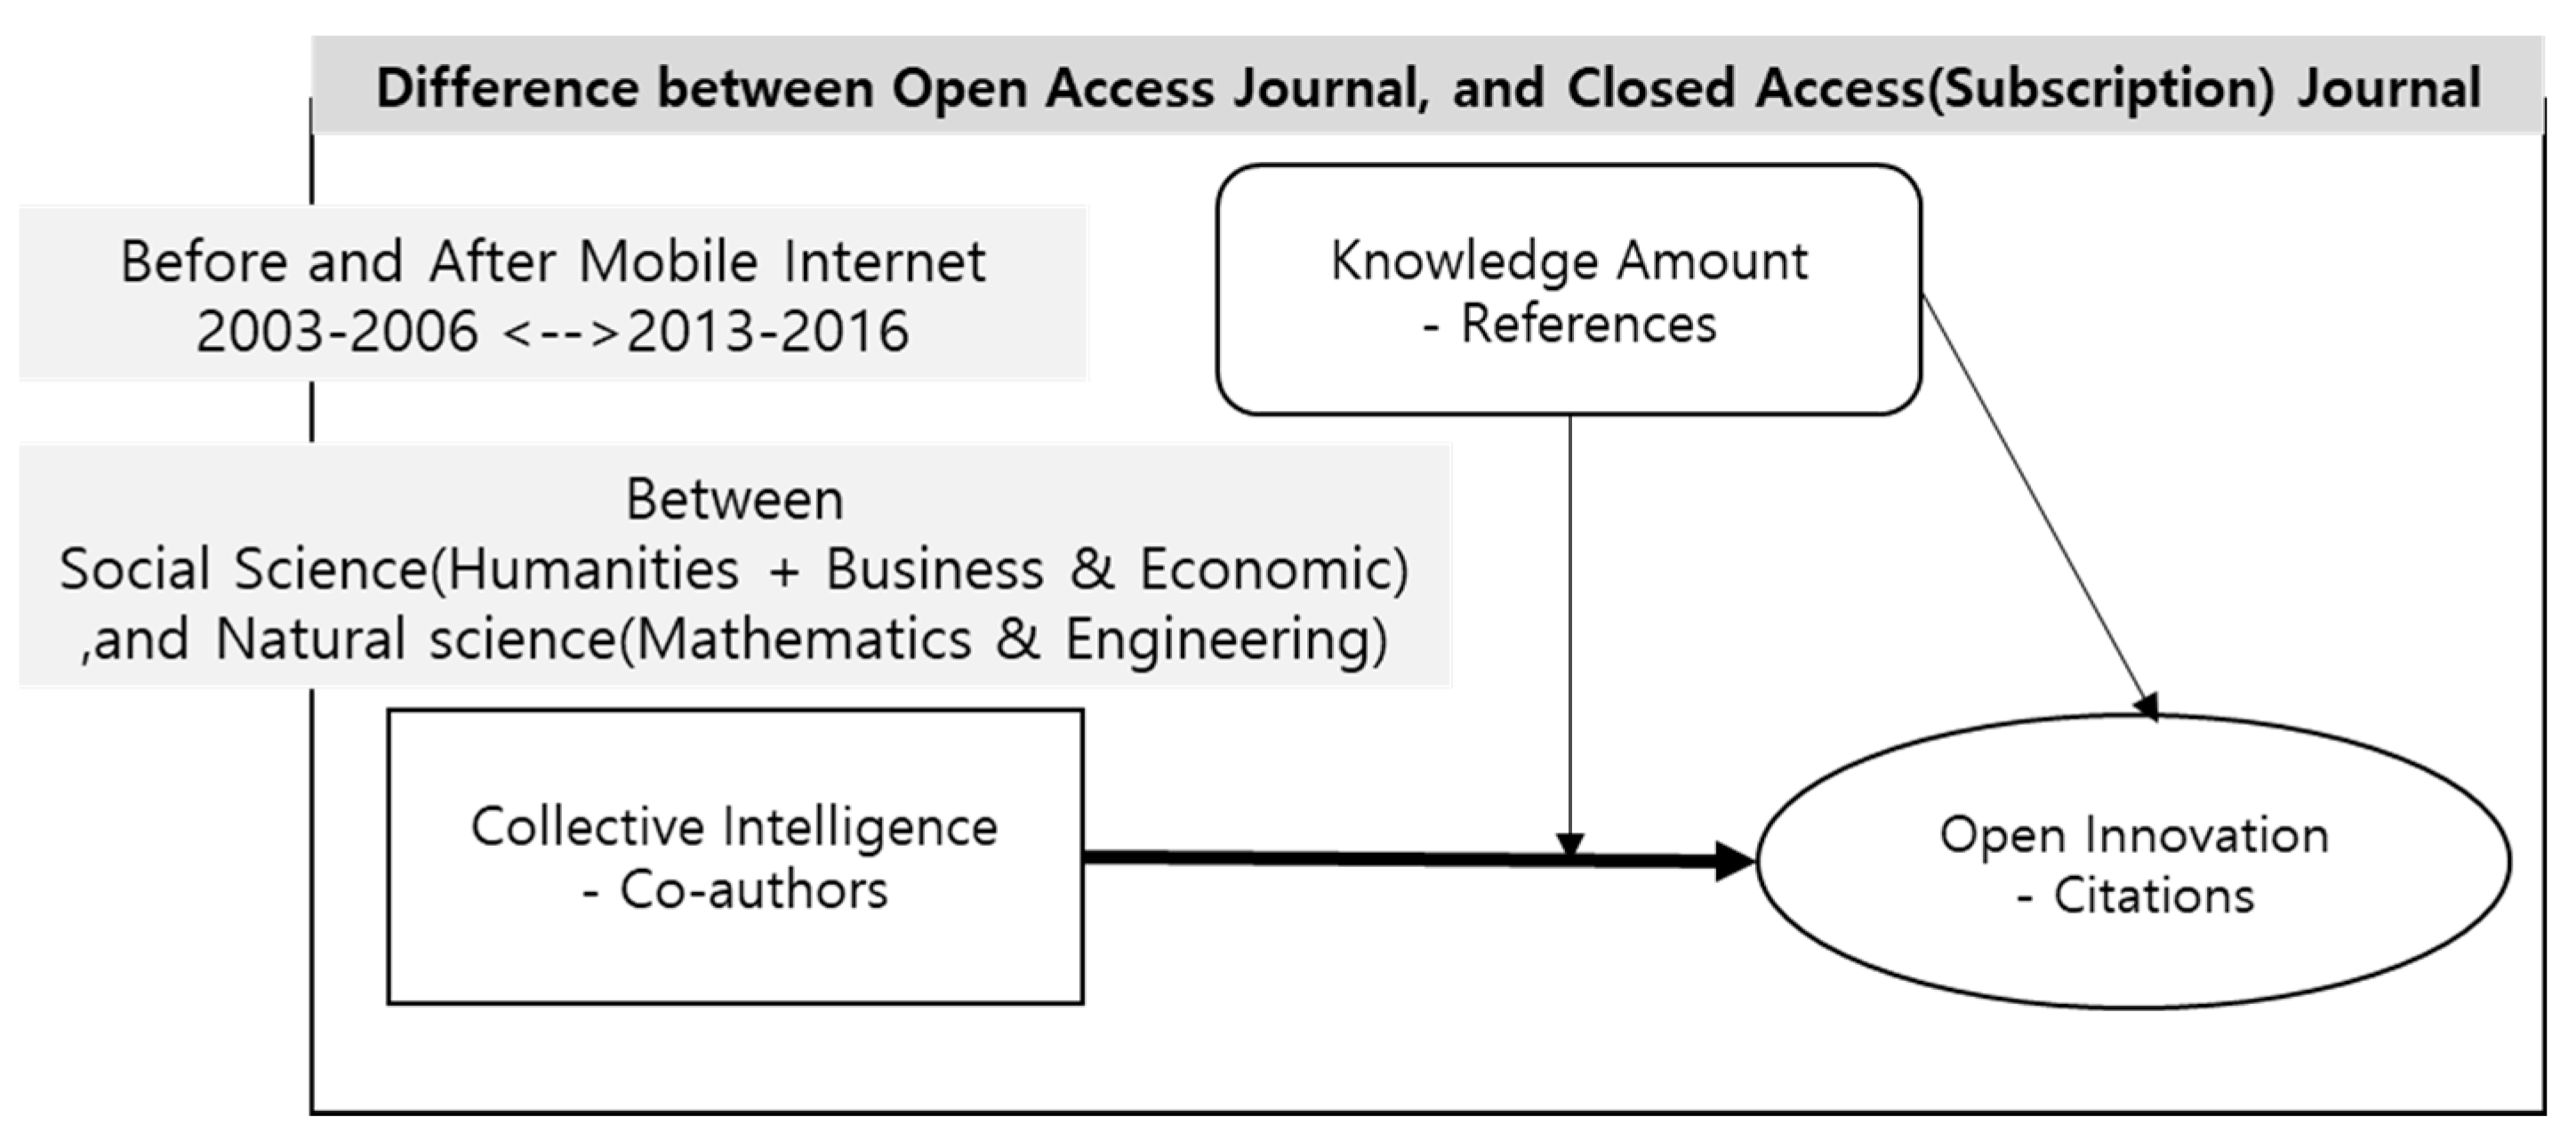
1.2. Research Framework

1.2.1. Independent Variable

In this study, CI was the independent variable (Figure 1).
Some research groups describe crowd actions as collective production under the following conditions: there is no single expert; spending more time on a problem does not provide additional innovation ideas; the perspectives of others are consumable only in knowledge fragments; knowledge fragments can be creative associations [56]. CI is collective production, as it is based on the lack of a single expert in the co-authors’ relationship. However, CI as co-authors is different from collective behavior as mobilization on the basis of a belief that redefines social action, in the sense that it does not mobilize anything directly [57]. Although CI has highly qualitative aspects, since it is correlated with social sensitivity, such as conversational turn-taking or the proportion of women, these factors affect the effectiveness of the agent of interactive cognitive systems [3,58]. As the number of co-authors indicates a sufficient amount of collective, this study used the number of co-authors as the independent variable to measure CI in the regression analysis [3,58].

1.2.2. Dependent Variable

When open innovation research was first published, it largely focused on companies [59]. With the rise of open innovation studies, diverse objective measures have emerged, including quantitative measures of the depth and breadth of open innovation in surveys and patent data in network analysis, such as patent-based brokerage [31,60,61]. The number of citations can be considered the degree of open innovation, as the citation index is a new dimension in documentation based on the association of ideas, as shown in Figure 1 [62]. Only equating “open innovation” with “the number of citations” is based on a proxy logic that could lead to fuzzy discussions concerning the results. However, the difference between open access and closed access in open innovation could be identified by measuring the number of citations; in addition, understanding of the reality of open innovation in journals could be developed through case studies with in-depth interviews.

1.2.3. Moderating Variable

The moderating effect can be explained as the effect of X on variable Y, being moderated by M if its size, sign, or strength depends on or can be predicted by M. In knowledge gap theory, education (M) may moderate the effect of exposure to information (X) on knowledge (Y), such that knowledge gaps are increased rather than decreased [63]. In addition, other moderating effects, such as the moderating role of openness to experience, gender, and CI, have been noted [64,65]. During the fourth industrial revolution, the complexity of innovation, particularly open innovation, increased with the amount of knowledge available to organizations, such as references in research teams [66]. If knowledge management is designed to present strategy, process, and technology to increase organizational learning, the organization’s innovation capacity increases [67]. According to the dynamic theory of organizational knowledge creation, organizational knowledge is created through a continuous dialogue between tacit and explicit knowledge [68]. Sufficient references have a similar effect on increasing the dialogue between tacit and explicit knowledge. Furthermore, as the increase of organizational knowledge is correlated with the increase of open innovation, experts can no longer be smarter than the CI of regular individuals. The number of references is defined as the moderating variable in this study (Figure 1).

1.2.4. Difference between Open and Closed Access Journals

This study focused on the differences between open and closed access journals in several conditions, such as before and after the introduction of the mobile Internet (in the 2003–2006 and 2013–2016 periods, respectively), and in the fields of engineering and mathematics, arts and humanities, and management and economics (Figure 1). Closed access journals influence CI and have a moderating effect of the number of references on open innovation in these conditions, as closed access journals have existed for a long time. OAJ likely did not affect CI or have a moderating effect of the number of references on open innovation between 2003 and 2006. However, OAJ likely affected CI and had a moderating effect of the number of references on open innovation between 2013 and 2016 due to the availability of the mobile Internet, which promoted the development of open innovation journals over closed access journals.

2. Materials and Methods

This study utilized multiple ordinary least squares (OLS) regression analysis using article information from the Scopus database between 2003 and 2006 and between 2013 and 2016. Data were collected on 21 September 2020 from various categories of All Science Journal Classification (ASJC), such as arts and humanities (1200 articles), business, management, and accounting (1400 articles), economics, econometrics, and finance (2000 articles), engineering (2200 articles), and mathematics (2600 articles), as shown in Table 1. In addition, this study used detailed descriptive analyses to compare open and closed access journals in terms of the number of authors, references, and citations. Furthermore, comparative analyses were conducted between the 2003–2006 and 2013–2016 periods and between humanities, management, and economics (HME) and engineering and mathematics (EM) to clarify the OLS analysis results.
The ratios of OA to closed access papers in 2003–2006 compared to OA papers were 0% in arts and humanities, 21/6865 in business, management, and accounting, 37/3178 in economics, econometrics, and finance, 1168/35,635 in engineering, and 1066/35,353 in mathematics. The ratios were as low as 0–3.01%. The ratios of OA to closed access papers in 2013–2016 dramatically increased: 7326/6882 in arts and humanities, 1649/26,027 in business, management, and accounting, 3049/7323 in economics, econometrics, and finance, 9273/63,382 in engineering, and 9826/66,513 in mathematics. The ratios increased from 14.6% in engineering to 106.5% in arts and humanities.
The average number of authors (NA) per paper in closed access journals did not increase significantly between 2003–2006 and 2013–2016: from 1.07 to 1.88 in arts and humanities, from 1.77 to 1.82 in business, management, and accounting, from 1.70 to 1.98 in economics, econometrics, and finance, from 3.45 to 3.54 in engineering, and from 1.76 to 2.06 in mathematics. However, the average NA per paper in OAJs increased significantly compared to closed access journals between 2003–2006 and 2013–2016: from 0 to 2.22 in arts and humanities, from 2.14 to 2.86 in business, management, and accounting, from 1.76 to 2.39 in economics, econometrics, and finance, from 2.92 to 3.39 in engineering, and from 1.68 to 2.97 in mathematics. In addition, OAJs had more co-authors during these two periods across all areas, indicating that CI in OAJs was higher than closed access journals in general.
The average number of references (NR) per paper in closed access journals increased between 2003–2006 and 2013–2016: from 20.33 to 28.30 in arts and humanities; from 25.28 to 28.93 in business, management, and accounting; from 22.36 to 33.29 in economics, econometrics, and finance; from 12.88 to 19.58 in engineering; and from 17.25 to 21.47 in mathematics. The average NR per paper in OAJs increased significantly compared to closed access journals, except for business, management, and accounting, between 2003–2006 and 2013–2016: from 0 to 31.09 in arts and humanities, from 26.27 to 33.52 in economics, econometrics, and finance, from 11.61 to 22.24 in engineering, and from 15.31 to 25.57 in mathematics.
The average number of citations (NC) per paper in closed access journals was higher in 2003–2006 than 2013–2016, except for arts and humanities: 1.57 and 1.52 in arts and humanities, 28.28 and 5.88 in business, management, and accounting, 11.72 and 5.54 in economics, econometrics, and finance, 7.36 and 3.84 in engineering, and 11.25 and 4.5 in mathematics, respectively. The gap in the average NC per paper during 2003–2006 in closed access journals was more than double the average NC during 2013–2016, except for arts and humanities. The average NC per paper in OAJs was slightly higher in 2003–2006 than 2013–2016: 0 and 1.85 in arts and humanities, 4.71 and 3.10 in business, management, and accounting, 7.54 and 3.13 in economics, econometrics, and finance, 4.72 and 5.31 in engineering, and 7.28 and 4.40 in mathematics, respectively. The gap between the two periods in OAJs in economics, econometrics, and finance is slightly bigger than others. In engineering, the average citation per paper in 2013–2016 in OAJs was higher than in 2003–2006. In other words, the increased ratio of citation in OAJs was higher than closed access journals. However, the average citation per paper numbers in closed access journals in the two periods were higher than in OAJs.
Descriptive statistics indicated that individual sectors were too small for regression analysis (Table 2). Therefore, this study grouped (1) arts and humanities, (2) business, management, and accounting, and (3) economics, econometrics, and finance as representative components of the humanities and social science group [69]. Moreover, engineering and mathematics were combined into the natural science and engineering group.

2.1. Arts and Humanities: Business, Management, and Accounting and Economics, Econometrics, and Finances

2.1.1. Closed Access Journal Analysis

  • Descriptive Statistics Analysis with Correlation
Closed access journal (CAJ) papers in arts and humanities, business management and accounting, and economics (HME) in the Scopus database increased from 11,795 in 2003–2006 to 40,232 in 2013–2016 (Table 2). The NR and NA increased from 23.91 to 29.16 and from 1.64 to 1.86, respectively. However, the average NC decreased from 19.85 in 2003–2006 to 5.07 in 2013–2016.
In closed access journal (CAJ) papers in HME, a significant correlation existed among NC, NA, and NR in 2003–2006 and 2013–2016 (Table 3).
  • Moderating effects
NA, NR, and moderating variables in closed access journals during 2003–2006 and 2013–2016 had statistically significant effects on open innovation (Table 4), as Model 1, Model 2, and Model 3 in 2003–2006 and 2013–2016 demonstrated coefficients of p < 0.01 (two-tailed), and R2 values in 2003–2006 increased from 0.034 in Model 1, to 0.117 in Model 2, and 0.127 in Model 3. In other words, Hypotheses 1-1-1, 1-1-2, 2-1-1, 2-1-2, 3-1-2, and 3-1-2 in HME were accepted.

2.1.2. OAJ analysis

  • Descriptive Statistics Analysis with Correlation
Open access journal (OAJ) papers in HME in the Scopus database increased from 58 in 2003–2006 to 12,024 in 2013–2016 (Table 5). The average NR decreased from 34.42 to 32.56 and NA increased from 1.90 to 2.34. However, the average NC decreased from 6.62 in 2003–2006 to 2.35 in 2013–2016. However, this decrease is meaningless due to the small number of papers.
In open access journal (OAJ) papers in HME, there was no correlation among NC, NA, and NR in 2003–2006 due to an insufficient number of papers. However, there were correlations between NC, NA, and NR in 2013–2016 (Table 6).
  • Moderating effects
NA, NR, and moderating variables in OAJs between 2003 and 2006 did not have statistically significant effects on open innovation (Table 7) due to an insufficient number of papers. However, NA, NR, and moderating variables in OAJs between 2013 and 2016 had statistically significant effects on open innovation, as Model 1, Model 2, and Model 3 in 2013–2016 had coefficients of p < 0.01 (two-tailed), and R2 values in 2013–2016 increased from 0.031 in Model 1, to 0.060 in Model 2, and 0.064 in Model 3. In other words, Hypotheses 1-1-1, 2-2-1, and 3-2-1 in HME were rejected. However, Hypotheses 1-2-2, 2-2-2, and 3-2-2- in HME were accepted (Table 7).

2.2. Engineering and Mathematics

2.2.1. Closed Access Journals

  • Descriptive statistics analysis with correlation
Closed access journal papers in engineering and mathematics (EM) in the Scopus database increased from 70,988 in 2003–2006 to 129,895 in 2013–2016 (Table 8). The average NR and NA increased from 15.06 to 20.55 and from 2.60 to 2.78, respectively. However, the average NC decreased from 9.30 in 2003–2006 to 4.00 in 2013–2016.
In closed access journal papers in EM, there were significant correlations among NC, NA, and NR in 2003–2006 and 2013–2016 (Table 9).
  • Moderating effects
NA, NR, and moderating variables in closed access journals during 2003–2006 and 2013–2016 had statistically significant effects on open innovation, as Model 1, Model 2, and Model 3 in 2003–2006 and 2013–2016 had coefficients of p < 0.01 (two-tailed), and R2 values in 2003–2006 increased from 0.000 in Model 1, to 0.036 in Model 2, and 0.043 in Model 3. In other words, Hypotheses 1-1-1, 1-1-2, 2-1-1,2-1-2, 3-1-2, and 3-1-2 in EM were accepted (Table 10).

2.2.2. OAJ

  • Descriptive statistics analysis with correlation
Open access journal (OAJ) papers in EM in the Scopus database increased from 2234 in 2003–2006 to 19,099 in 2013–2016 (Table 11). The average NR and NA increased from 13.38 to 23.95 and from 2.33 to 3.17, respectively. However, the average NC decreased from 5.94 in 2003–2006 to 4.84 in 2013–2016. Although NR in 2003–2006 in EM OAJs was smaller than that in closed access journals, in 2013–2016, it was larger than that in closed access journals.
In OAJ papers in EM, there was no correlation among NC, NA, and NR in 2003–2006, likely due to an insufficient number of papers. However, there were correlations between NC, NA, and NR in 2013–2016 (Table 12).
  • Moderating effects
NA in OAJs during 2003–2006 in EM did not have statistically significant effects on open innovation (Model 1 in Table 13). However, NR and moderating variables in OAJs during 2003–2006 in EM had statistically significant effects on open innovation (Models 2 and 3 in Table 13). Consequently, there were no moderating effects in OAJ during 2003–2006 in EM. However, NA, NR, and moderating variables in OAJs of EM during 2013–2016 had statistically significant effects on open innovation, as Model 1, Model 2, and Model 3 in 2013–2016 had coefficients of p < 0.01 (two-tailed), and R2 values in 2013–2016 increased from 0.001 in Model 1, to 0.056 in Model 2, and 0.057 in Model 3. In other words, Hypotheses 1-2-1, 2-2-1, and 3-2-1 in EM were rejected, while Hypotheses 1-2-2, 2-2-2, and 3-2-2 in EM were accepted (Table 13).

3. Discussion

3.1. Comparative Analysis between Closed and Open Access Journals

In closed access journals, CI, NR, and moderating variables had statistically significant effects on the number of citations in 2003–2006 and 2013–2016 (Table 14). Knowledge amount—in other words, the NR—moderated the effects on CI on open innovation, which is measured by the number of citations in both HME and EM.
In contrast, OAJs during 2003–2006 demonstrated no statistically significant effects on CI, NR, and moderating variables on the NC in HME and EM. According to the Scopus database, as most OAJs started at the end of 1990s or early 2000s, the OAJ industry was not sufficiently mature in 2003–2006 to produce effects on CI and NR.
During 2013–2016, OAJs in HME and EM, CI, NR, and moderating variables had statistically significant effects on open innovation. In addition, although the average NC of OA papers in 2003–2006 was evidently smaller than closed access journals, the NC of OA in 2013–2016 reached or was bigger than closed access journals. The results demonstrated differences between closed access journals in arts and humanities of 1.52 to 1.85; in business, management, and accounting, between 5.88 and 3.10; in economics, econometrics, and finance, between 5.54 and 3.13; in engineering, between 3.84 and 5.31, and in mathematics, between 4.15 and 4.40 (Table 1).

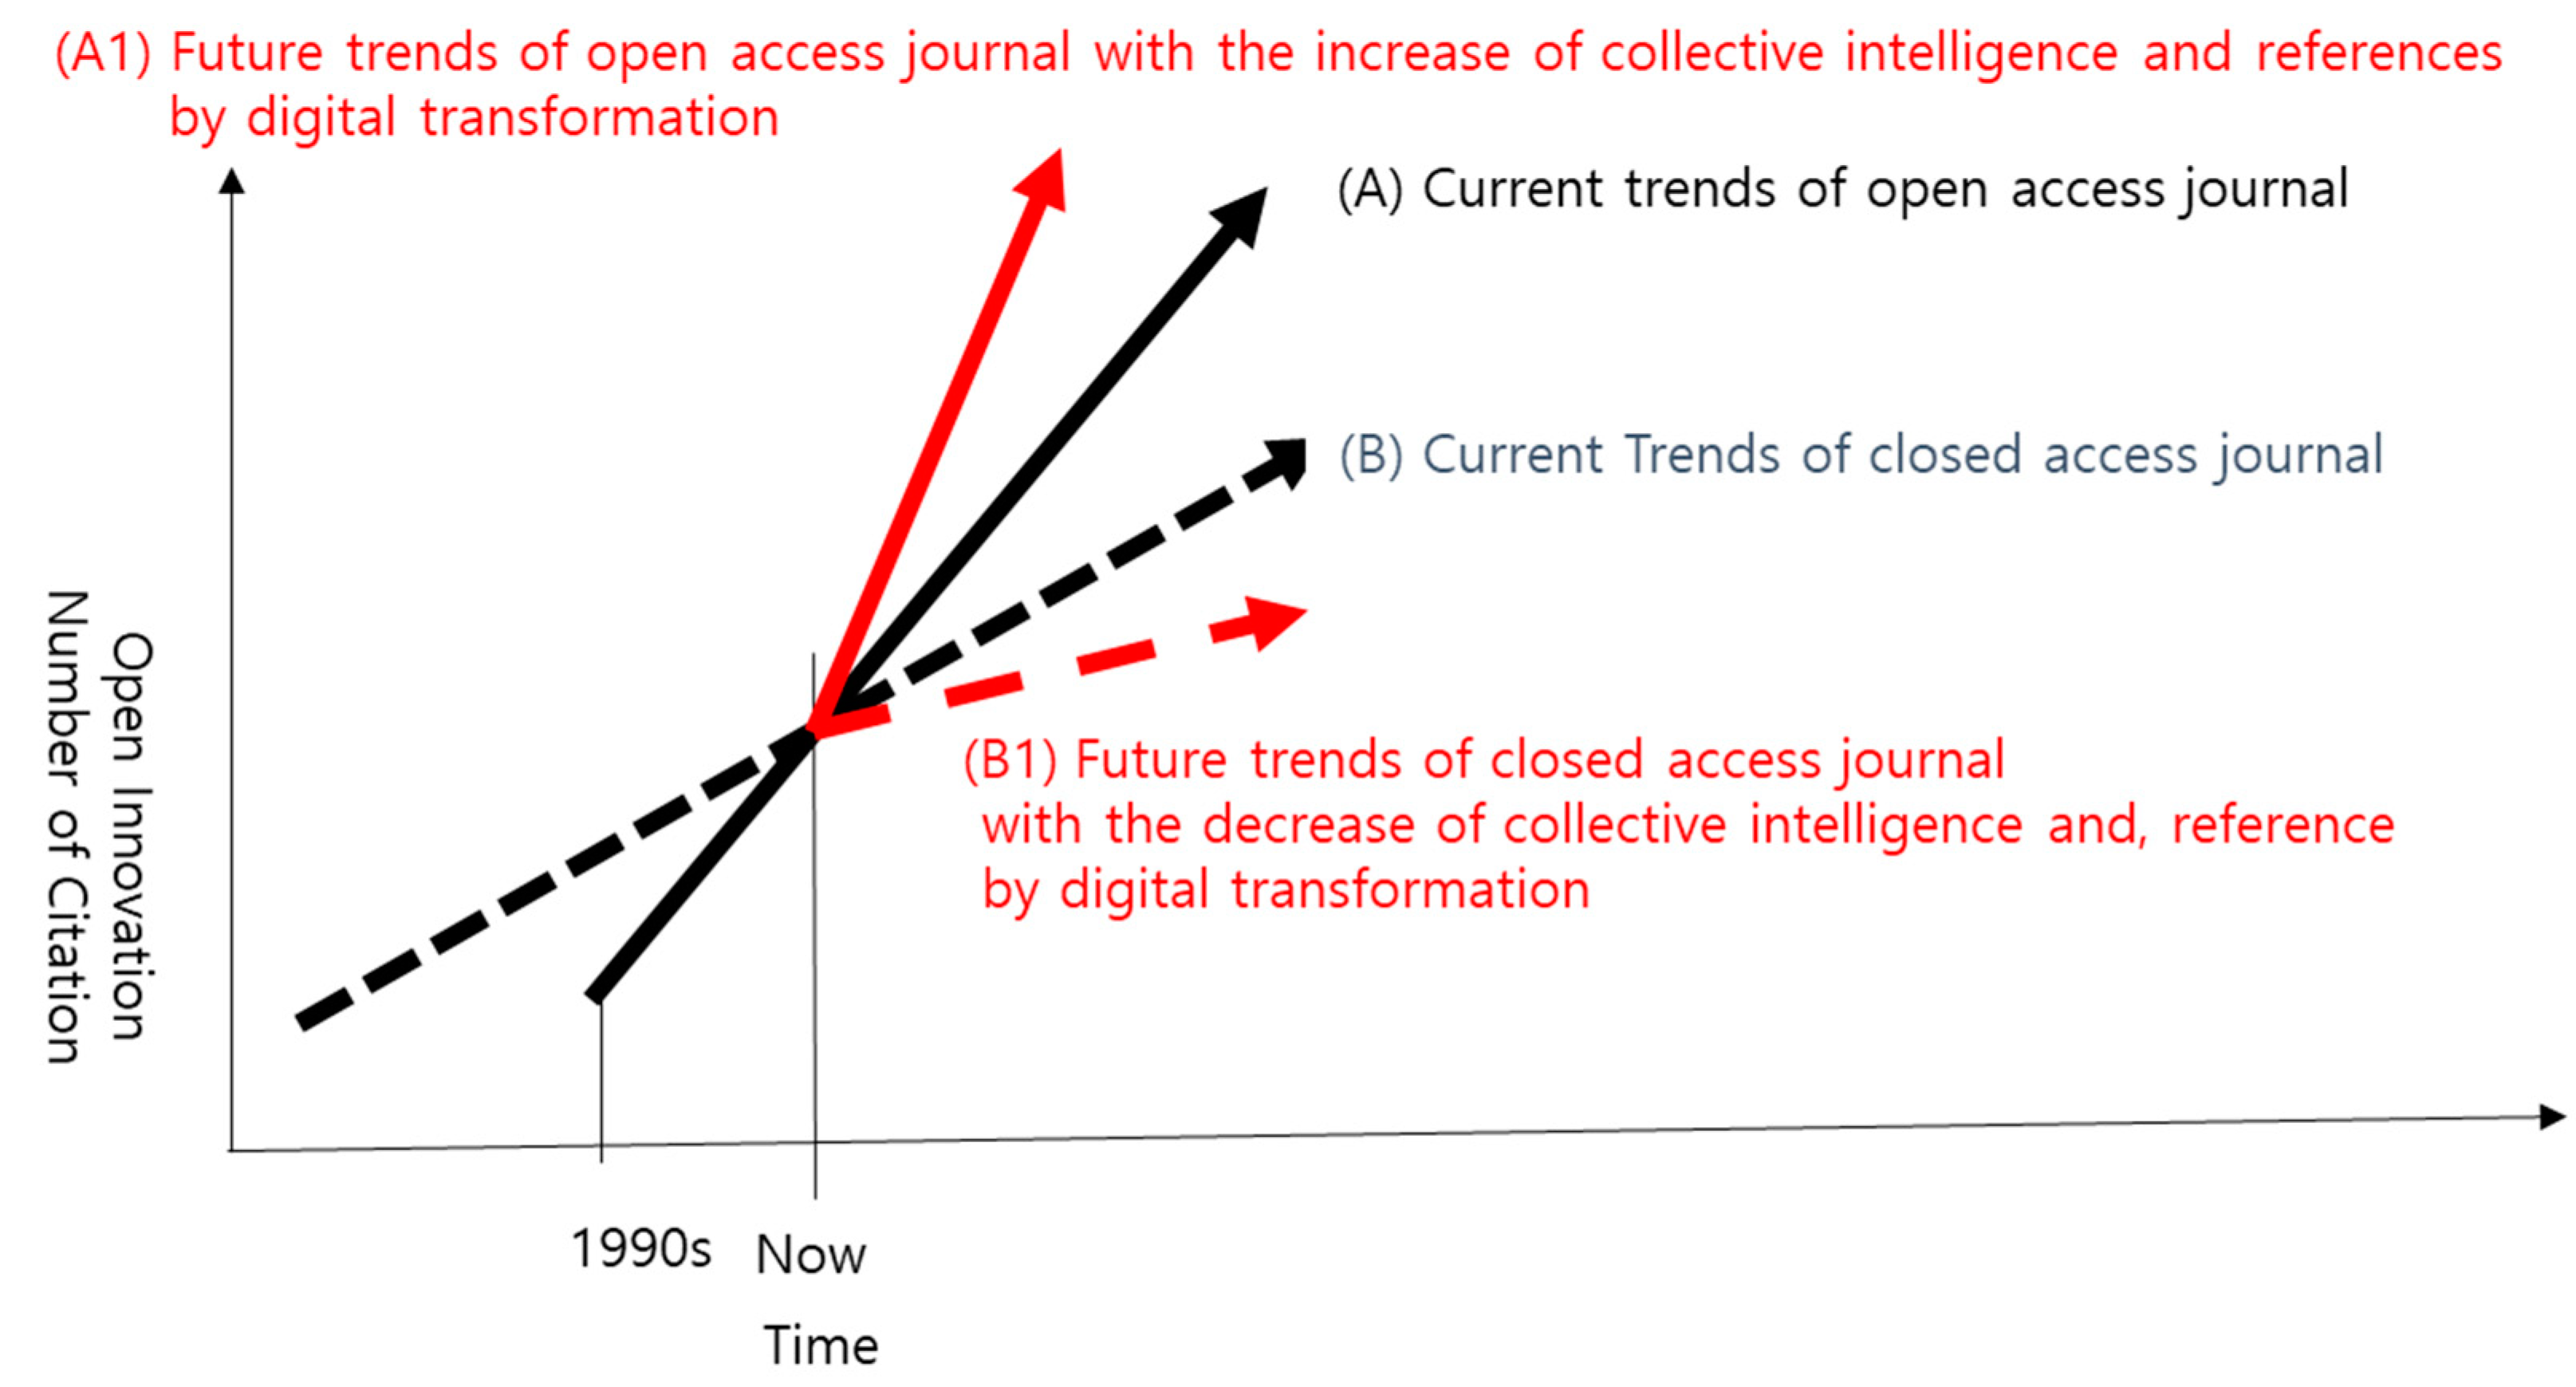
3.1.1. The Potential of Open Access Journals in Digital Transformation during the Fourth Industrial Revolution

The fourth industrial revolution is defined as the second IT revolution or digital transformation. In recent years, most industries have taken a series of initiatives to explore new digital technologies and exploit their benefits [2,53]. The potential and success of business and industry transformation lies in understanding how and when to apply digital transformation technologies [70].
In addition to the original and strong advantages of OAJs, such as worldwide free and direct accessibility (such as the higher slope of (A) than (B) in Figure 2), digital transformation is motivating the CI of OAJ authors. Table 1 shows that references from larger co-author groups were used more widely than closed access journals. In other words, in addition to the traditional advantages, OAJs motivate CI in the digital transformation by inviting more co-authors and giving them more chances to connect through digital platforms. The increase of CI shifts the pattern from (A) to (A1), as shown in Figure 2. The increase of OAJ popularity during the digital transformation accelerates a more diverse usage and larger numbers of references.
The reinforcing loop among digital transformation, OA, CI, references, and citations continues, which motivates the growth of the OAJ industry in two different ways: (1) the establishment of new OAJs, and (2) the transformation from closed access journals to OAJs [55].

3.1.2. Predatory Publisher in Closed Access Paradigm vs. Predatory Journal in Open Access Paradigm

Despite their contribution to the evolution of science and human knowledge in the long history of closed access journal publishing, major journal publishers, such as Elsevier, Springer Nature, and SAGE, have been criticized as predatory publishers due to the high growth of the journal subscription fee. In this case, with the start of the Harvard University memo in 2012, open access publishing was achieved in several university consortiums with traditional closed access journal publishers. The journal subscription costs of Elsevier and other publishers became so high that, if the situation continued, “it would seriously erode collection efforts in many other areas, already compromised” [71]. The memo asked faculty members to encourage their professional institutions to control scholarly publishing and consider submitting their work to OAJs and resigning from the editorial boards of non-OAJs [72]. The German consortium, composed of hundreds of universities, technical schools, research institutions, and public libraries, negotiated with Elsevier in the hope of reaching a new agreement to make all papers by German authors OA, and disclosing prices and other details publicly [73]. However, Elsevier vehemently opposed this move [71]. According to Science (2017), as more than 60 institutions lost online subscriptions after the stagnation of OA negotiations, German researchers began dropping Elsevier journals from considerations in 2017. In the years after a high-profile withdrawal, the UC system and Elsevier agreed on the largest deal for open access publishing in scholarly journals in North America in March 2021. This enabled UC authors to publish articles in OA, and for anyone to read them for free. In some cases, it provided a 15% discount on open access fees, and UC subsidized the first USD 1000 of their authors’ OA publishing fee. This agreement marks a significant step in the long journey to becoming fully OA [50,74].
Meanwhile, in the area of scientific literature, there is an emerging problem of companies publishing predatory journals, which are mainly OA, as they seek to gain profits by requiring a substantial publication payment from authors, known as the APC, without providing any customer service to authors or readers [73]. The first problem of the predatory journals is that they receive articles of unknown scientific quality, particularly on the OAJ platform. In addition, though APCs for hybrid OAJ publishers, such as Elsevier, Springer Nature, and SAGE, are more expensive than pure OAJ publishers, such as PLOS and MDPI, pure OAJ publishers are evaluated as requiring higher APCs than hybrid OA or open access publishers, which originated from closed access journals. This misunderstanding disrupts the shift toward OA in the journal publishing industry. Furthermore, though some OAJ publishers receive APCs, they do not grant the copyright of the journal to authors so that they could earn additional subscription fees by authorizing papers with copyrights belonging to the publishers, even if the authors pay APCs.
There are several approaches to overcoming predatory publishers in the closed access paradigm and predatory journals in open access paradigms and motivating open innovation with CI. First, all scholars are recommended to move to complete OAJs when selecting publishing journals to stimulate CI. Second, universities and research institutions should change the payment method from subscription fees to APCs for their scholars to encourage OA. Third, all closed access publishers should completely turn to OAJs to maintain APCs at a rational level and to maintain the quality of the papers. Fourth, all pure OAJs should improve journal quality control to high standards, such as classic top-level closed access journals, in terms of reject rate, review process, and review time.

4. Conclusions

4.1. Implications: The Value of CI and Knowledge Amount in Journal Open Innovation

Most importantly, the OAJ industry in the digital transformation era demonstrated that CI and knowledge amount promote open innovation, namely, the increase in citations and references moderates the effects of CI on open innovation. OAJs are a good business model of CI in the digital transformation. The original function of OAJs makes their CI greater than closed access journals. The CI of OAJs created more open innovation than closed access journals in terms of: (1) the increased CI due to the digital transformation, (2) the increased moderating effects of references on the correlation between CI and open innovation and the increased references from digital transformation with the growth of OA, which created greater open innovation.

4.2. Limitations and Future Research Targets

4.2.1. Limitations

We should announce the limitations of this study. First, the motivation of many researchers to submit their papers to OAJs could be the pressure of time until the publication of their paper. While closed access journals can have publication waiting times of 1–2 years, OAJs often reduce the time to 2–3 months. Though the gap between OAJs’ and closed access journals ‘publishing times is decreasing, it could be another triggering factor in the increase of OAJ publishing. This could be next on the research agenda.
Second, the side effect of high APCs for many OAJs could motivate the increase of the number of authors, not because of the willingness to have a high CA, but to share the APC. The fees for some closed access journals for hybrid open access publishing are skyrocketing, and the APC of OAJs is a financial burden for some researchers. The diverse aspects of OAJs, including high APC, and comparing these with hybrid open access journals could also be next on the research agenda.

4.2.2. Future Research Targets

This study has identified several future research targets. First, more qualitative research on collective intelligence should be conducted based on in-depth interviews, participatory observation, natural experiments, and other grounded theory methods, as collective intelligence has diverse qualitative aspects that are merely approximated by the number of co-authors. Differences in the number of citations in open access or closed access journals could not explain the full reality of open innovation in the journal industry or the academy industry, even though it could show dramatic changes between the two journal categories. In fact, the positivist paradigm, which is the basis of this research, focuses on the inquiry of limited value-free areas despite the fact that the human political economy is full of value-bounded areas, which is the research objective of the naturalist paradigm [75]. In fact, the generation of theory mostly uses qualitative data in a non-systematic and non-rigorous way [49]. HME and EM researchers should conduct further discussions at conferences, as there are several differences in communication and reaching agreement. In addition, the impact of digital transformation on research can be explained by accumulating grounded theory based individual facts and information.
Second, the research focused on limited periods of Scopus database indexed journals and analyzed limited study areas. To find out more about journal open innovation and CI, future research should expand the target areas and time periods of the included journals.
Third, the research focused on the nonlinear aspects of CI; thus, the next target of research could explore the situation in which many real-world problems can be seen as constrained nonlinear optimization problems [76]. Through this additional research on the nonlinear aspects of collective intelligence, knowledge strategy planning could be developed, using an integrated approach to manage uncertainty, turbulence, and dynamics [77].
Finally, this study analyzed open innovation, CI, and knowledge amount in the journal industry. The research results should be understood in the context of OAJs and closed access journals. To generalize the findings, the research model should be applied to other industries, which include differently conceptualized references, CI, and citations.

Author Contributions

Conceptualization, methodology, formal analysis, writing—original draft, writing—review and editing: J.J.Y.; supervision, writing—review and editing: Z.L.; validation, resources: E.J.; validation, resources: S.K.; software, data curation: K.K. All authors have read and agreed to the published version of the manuscript.

Funding

This work was supported by the DGIST R&D Program of the Ministry of Science and ICT (21-IT-10-02).

Institutional Review Board Statement

Not applicable.

Informed Consent Statement

Not applicable.

Data Availability Statement

The data presented in this study are available on request from the corresponding author.

Conflicts of Interest

The authors declare no conflict of interest.

References

  1. Hess, T.; Matt, C.; Benlian, A.; Wiesbock, F. Options for formulating a digital transformation strategy. MIS Q. Exec. 2016, 15, 6. [Google Scholar]
  2. Lee, M.; Yun, J.; Pyka, A.; Won, D.; Kodama, F.; Schiuma, G.; HangSik, P.; Jeon, J.; Park, K.; Jung, K.; et al. How to respond to the fourth Industrial Revolution, or the second information technology revolution? Dynamic new combinations between technology, market, and society through open innovation. J. Open Innov. Technol. Mark. Complex 2018, 4, 21. [Google Scholar] [CrossRef] [Green Version]
  3. Woolley, A.W.; Chabris, C.F.; Pentland, A.; Hashmi, N.; Malone, T.W. Evidence for a collective intelligence factor in the performance of human groups. N. Y. Sci. J. 2010, 330, 686–688. [Google Scholar] [CrossRef] [PubMed] [Green Version]
  4. Malone, T.W.; Laubacher, R.; Dellarocas, C. The collective intelligence genome. MIT Sloan Manag. Rev. 2010, 51, 21. [Google Scholar] [CrossRef]
  5. Krishna, V.V. Open science and its enemies: Challenges for a sustainable science–society social contract. J. Open Innov. Technol. Mark. Complex 2020, 6, 61. [Google Scholar] [CrossRef]
  6. Lévy, P. L’intelligence Collective; Pour une Anthropologie de Cyberspace; Les Éditions La Découverte: Paris, France, 1994. [Google Scholar]
  7. Nguyen, V.T.; Young, B.; Ravaud, P.; Naidoo, N.; Benchoufi, M.; Boutron, I. Overcoming barriers to mobilizing collective intelligence in research: Qualitative study of researchers with experience of collective intelligence. Med. Internet Res. 2019, 21, e13792. [Google Scholar] [CrossRef] [Green Version]
  8. Bonabeau, E. Decisions 2.0: The power of collective intelligence. MIT Sloan Manag. Rev. 2019, 50, 45. [Google Scholar]
  9. Lee, J.Y.; Jin, C.H. How collective intelligence fosters incremental innovation. J. Open Innov. Technol. Mark. 2019, 5, 53. [Google Scholar] [CrossRef] [Green Version]
  10. Leimeister, J.M. Collective Intelligence. Bus. Inf. Syst. Eng. 2010, 2, 245–248. [Google Scholar] [CrossRef] [Green Version]
  11. Surowiecki, J. The Wisdom of Crowds; Anchor: New York, NY, USA, 2005. [Google Scholar]
  12. Heylighen, F. Collective intelligence and its implementation on the web: Algorithms to develop a collective mental map. Comput. Math. Organ. Theory 1999, 5, 253–280. [Google Scholar] [CrossRef]
  13. Woolley, A.W.; Aggarwal, I.; Malone, T.W. Collective intelligence and group performance. Curr. Dir. Psychol. 2015, 24, 420–424. [Google Scholar] [CrossRef]
  14. Malone, T.W.; Klein, M. Harnessing collective intelligence to address global climate change. Innov. Technol. Gov. Glob. 2007, 2, 15–26. [Google Scholar] [CrossRef]
  15. Secundo, G.; Dumay, J.; Schiuma, G.; Passiante, G. Managing intellectual capital through a collective intelligence approach: An integrated framework for universities. J. Intellect. Cap. 2016, 17, 298–319. [Google Scholar] [CrossRef]
  16. Benkler, Y.; Masum, H.; Atlee, T.; Homer-Dixon, T.; Levy, P.; Malone, T.; Martin, R.; Steele, R. Collective Intelligence: Creating a Prosperous World at Peace; Earth Intelligence Network: Oakton, VA, USA, 2018. [Google Scholar]
  17. Smith, L.C. Citation analysis. Libr. Trends 1981, 30, 83–106. [Google Scholar]
  18. Bratianu, C.; Vasilache, S. A factorial analysis of the managerial linear thinking model. Int. J. Innov. Learn. 2010, 8, 393–407. [Google Scholar] [CrossRef]
  19. Bratianu, C.; Vasilache, S. Evaluating Linear-Nonlinear Thinking Style for Knowledge Management Education. Manag. Mark. 2009, 4, 3–18. [Google Scholar]
  20. Redner, S. How popular is your paper? An empirical study of the citation distribution. Eur. Phys. J. B 1998, 4, 131–134. [Google Scholar] [CrossRef]
  21. Boyack, K.W.; Klavans, R. Co-citation analysis, bibliographic coupling, and direct citation: Which citation approach represents the research front most accurately? J. Assoc. Inf. Sci. Technol. 2010, 61, 2389–2404. [Google Scholar] [CrossRef]
  22. Ding, Y.; Liu, X.; Guo, C.; Cronin, B. The distribution of references across texts: Some implications for citation analysis. J. Informetr. 2013, 7, 583–592. [Google Scholar] [CrossRef]
  23. Ding, Y.; Zhang, G.; Chambers, T.; Song, M.; Wang, X.; Zhai, C. Content-based citation analysis: The next generation of citation analysis. J. Am. Soc. Inf. Sci. Technol. 2014, 65, 1820–1833. [Google Scholar] [CrossRef]
  24. Leydesdorff, L. Theories of citation? Scientometrics 1998, 43, 5–25. [Google Scholar] [CrossRef]
  25. Garfield, E. Citation indexing for studying science. Nature 1970, 227, 669–671. [Google Scholar] [CrossRef] [PubMed]
  26. Hyland, K. Self-citation and self-reference: Credibility and promotion in academic publication. J. Am. Soc. Inf. Sci. Technol. 2003, 54, 251–259. [Google Scholar] [CrossRef]
  27. Fabrigar, L.R.; Petty, R.E.; Smith, S.M.; Crites, S.L., Jr. Understanding knowledge effects on attitude-behavior consistency: The role of relevance, complexity, and amount of knowledge. J. Pers. Soc. Psychol. 2006, 90, 556–577. [Google Scholar] [CrossRef]
  28. Wiewiora, A.; Trigunarsyah, B.; Murphy, G.; Coffey, V. Organizational culture and willingness to share knowledge: A competing values perspective in Australian context. Int. J. Proj. Manag. 2013, 31, 1163–1174. [Google Scholar] [CrossRef] [Green Version]
  29. Garriga, H.; Von Krogh, G.; Spaeth, S. How constraints and knowledge impact open innovation. Strateg. Manag. 2013, 34, 1134–1144. [Google Scholar] [CrossRef]
  30. Laursen, K.; Salter, A. Open for innovation: The role of openness in explaining innovation performance among UK manufacturing firms. Strateg. Manag. 2006, 27, 131–150. [Google Scholar] [CrossRef]
  31. Laursen, K.; Salter, A. The paradox of openness: Appropriability, external search and collaboration. Res. Policy 2014, 43, 867–878. [Google Scholar] [CrossRef] [Green Version]
  32. Chiang, Y.H.; Hung, K.P. Exploring open search strategies and perceived innovation performance from the perspective of inter-organizational knowledge flows. R D Manag. 2010, 40, 292–299. [Google Scholar] [CrossRef]
  33. Spithoven, A.; Clarysse, B.; Knockaert, M. Building absorptive capacity to organise inbound open innovation in traditional industries. Technovation 2010, 30, 130–141. [Google Scholar] [CrossRef]
  34. Zobel, A.K. Benefiting from open innovation: A multidimensional model of absorptive capacity. J. Prod. Innov. Manag. 2017, 34, 269–288. [Google Scholar] [CrossRef]
  35. Swan, A.; Brown, S. Authors and open access publishing. Learn. Publ. 2004, 17, 219–224. [Google Scholar] [CrossRef] [Green Version]
  36. Björk, B.C.; Welling, P.; Laakso, M.; Majlender, P.; Hedlund, T.; Gudnason, G. Open access to the scientific journal literature: Situation 2009. PLoS ONE 2010, 5, e11273. [Google Scholar] [CrossRef] [PubMed]
  37. Björk, B.C.; Öörni, A. A method for comparing scholarly journals as service providers to authors. Ser. Rev. 2009, 35, 62–69. [Google Scholar] [CrossRef]
  38. Walker, T. Free Internet access to traditional journals. Am. Sci. 1998, 86, 463. [Google Scholar] [CrossRef]
  39. Lewis, D.W. The inevitability of open access. Coll. Res. Libr. 2012, 73, 493–506. [Google Scholar] [CrossRef] [Green Version]
  40. Christensen, C.M. The Innovator’s Dilemma: When New Technologies Cause Great Firms to Fail; Harvard Business Review Press: Boston, MA, USA, 2013. [Google Scholar]
  41. Antelman, K. Do open-access articles have a greater research impact? Coll. Res. Libr. 2004, 65, 372–382. [Google Scholar] [CrossRef]
  42. Davis, P.M. Open access, readership, citations: A randomized controlled trial of scientific journal publishing. FASEB J. 2011, 25, 2129–2134. [Google Scholar] [CrossRef] [Green Version]
  43. Björk, B.C.; Solomon, D. Open access versus subscription journals: A comparison of scientific impact. BMC Med. 2012, 10, 73. [Google Scholar] [CrossRef] [Green Version]
  44. McCabe, M.J.; Snyder, C.M. Open access and academic journal quality. Am. Econ. Rev. 2005, 95, 453–458. [Google Scholar] [CrossRef]
  45. Xia, J. A longitudinal study of scholars attitudes and behaviors toward open-access journal publishing. J. Am. Soc. Inf. Sci. Technol. 2010, 61. [Google Scholar] [CrossRef]
  46. Solomon, D.J.; Björk, B.C. Publication fees in open access publishing: Sources of funding and factors influencing choice of journal. J. Am. Soc. Inf. Sci. Technol. 2012, 63, 98–107. [Google Scholar] [CrossRef]
  47. Shen, C.; Björk, B.C. ‘Predatory’ open access: A longitudinal study of article volumes and market characteristics. BMC Med. 2015, 13, 230. [Google Scholar] [CrossRef] [PubMed] [Green Version]
  48. (A).J.P. Universities pressure Elsevier for Cheaper Journal Fees. Financial Times. Available online: https://www.ft.com/content/9525bbfc-87b7-44d8-bb58-fdc4eef19b11 (accessed on 15 November 2021).
  49. Lin, Z. University of California Signs Open Access Publishing Deal with Elsevier. The Guradian. 2011. Available online: https://ucsdguardian.org/2021/04/11/university-of-california-signs-open-access-publishing-deal-with-elsevier/ (accessed on 15 November 2021).
  50. Brainard, J. California Universities and Elsevier Make Up, Ink Big Open-Access Deal. Science. 2021. Available online: https://www.biosciencela.org/newsarchive/2021319/california-universities-and-elsevier-make-up-ink-big-open-access-deal (accessed on 15 November 2021).
  51. Poushter, J. Smartphone Ownership and Internet Usage Continues to Climb in Emerging Economies; Pew Research Center: Washington, DC, USA, 2016; pp. 1–44. [Google Scholar]
  52. Oulasvirta, A.; Rattenbury, T.; Ma, L.; Raita, E. Habits make smartphone use more pervasive. Pers. Ubiquitous Comput. 2012, 16, 105–114. [Google Scholar] [CrossRef]
  53. Matt, C.; Hess, T.; Benlian, A. Digital transformation strategies. Bus. Inf. Syst. Eng. 2015, 57, 339–343. [Google Scholar] [CrossRef]
  54. Vial, G. Understanding digital transformation: A review and a research agenda. J. Strateg. Inf. Syst 2019, 28, 118–144. [Google Scholar] [CrossRef]
  55. Yun, J.J.; Jeong, E.; Kim, S.; Ahn, H.; Kim, K.; Hahm, S.D.; Park, K. Collective intelligence: The creative way from knowledge to open innovation. Sci. Technol. Soc. 2021, 26, 201–222. [Google Scholar] [CrossRef]
  56. Majchrzak, A.; Malhotra, A. Unleashing the Crowd; Springer: Berlin/Heidelberg, Germany, 2020. [Google Scholar]
  57. Smelser, N.J. Theory of Collective Behavior; Quid Pro Books: New York, NY, USA, 2011. [Google Scholar]
  58. Chmait, N.; Dowe, D.L.; Li, Y.F.; Green, D.G.; Insa-Cabrera, J. Factors of collective intelligence: How smart are agent collectives? In Proceedings of the Twenty-second European Conference on Artificial Intelligence (ECAI’16), The Hague, The Netherlands, 29 August 2016–2 September 2016; pp. 542–550. [Google Scholar] [CrossRef]
  59. Chesbrough, H.W.; Appleyard, M.M. Open innovation and strategy. Calif. Manag. Rev. 2007, 50, 57–76. [Google Scholar] [CrossRef] [Green Version]
  60. Michelino, F.; Lamberti, E.; Cammarano, A.; Caputo, M. Measuring open innovation in the Bio-Pharmaceutical industry. Creat. Innov. Manag. 2014, 24, 4–28. [Google Scholar] [CrossRef]
  61. Suh, Y.; Jeon, J. Monitoring patterns of open innovation using the patent-based brokerage analysis. Technol. Forecast. Soc. Change 2019, 146, 595–605. [Google Scholar] [CrossRef]
  62. Garfield, E. Citation indexes for science. A new dimension in documentation through association of ideas. Int. J. Epidemiol. 2006, 35, 1123–1127. [Google Scholar] [CrossRef] [PubMed] [Green Version]
  63. Hayes, A.F. Introduction to Mediation, Moderation, and Conditional Process Analysis: A Regression-Based Approach; Guilford Publications: New York, NY, USA, 2017. [Google Scholar]
  64. Zaib, M.J. Impact of Ethical Leadership on Innovative Work Behavior With Mediating Role of Thriving at Work and Moderating Role of Openness to Experience; Capital University: Bexley, OH, USA, 2018. [Google Scholar]
  65. Yun, J.J.; Won, D.; Park, K.; Jeong, E.; Zhao, X. The role of a business model in market growth: The difference between the converted industry and the emerging industry. Technol. Forecast. Soc. Change 2019, 146, 534–562. [Google Scholar] [CrossRef]
  66. Du Plessis, M.D. The role of knowledge management in innovation. J. Knowl. Manag. 2007, 11, 20–29. [Google Scholar] [CrossRef] [Green Version]
  67. Mehrabani, S.E.; Shajari, M. Knowledge Management and Innovation Capacity. J. Manag. Res. 2012, 4, 164. [Google Scholar] [CrossRef] [Green Version]
  68. Nonaka, I. A dynamic theory of organizational knowledge creation. Organ. Sci. 1994, 5, 14–37. [Google Scholar] [CrossRef] [Green Version]
  69. Snow, C.P. The Two Cultures; Cambridge University Press: Cambridge, UK, 1964. [Google Scholar]
  70. Andal-Ancion, A.; Cartwright, P.A.; Yip, G.S. The digital transformation of traditional business. MIT Sloan Manag. Rev. 2003, 44, 34. [Google Scholar]
  71. Vogel, G. German researchers start 2017 without Elsevier journals. N. Y. Sci. J. 2017, 355, 17. [Google Scholar] [CrossRef]
  72. Sample, I. Harvard University Says It Can’t Afford Journal Publishers’ Prices. The Guardian. 2012. Available online: https://www.theguardian.com/science/2012/apr/24/harvard-university-journal-publishers-prices (accessed on 15 November 2021).
  73. Richtig, G.; Berger, M.; Lange-Asschenfeldt, B.; Aberer, W.; Richtig, E. Problems and challenges of predatory journals. J. Eur. Acad. Dermatol. Venereol. 2018, 32, 1441–1449. [Google Scholar] [CrossRef]
  74. Lincoln, Y.S.; Guba, E.G. Naturalistic Inquiry; Sage: Thousand Oaks, CA, USA, 1985. [Google Scholar]
  75. Glaser, B.G.; Strauss, A.L. Discovery of Grounded Theory: Strategies for Qualitative Research; Routledge: Oxfordshire, UK, 2017. [Google Scholar]
  76. De-Los-Cobos-Silva, S.G.; Mora-Gutiérrez, R.A.; Gutiérrez-Andrade, M.A.; Rincón-García, E.A.; Ponsich, A.; Lara-Velázquez, P. Development of seven hybrid methods based on collective intelligence for solving nonlinear constrained optimization problems. Artif. Intell. Rev. 2018, 49, 245–279. [Google Scholar] [CrossRef]
  77. Bolisani, E.; Bratianu, C. Knowledge strategy planning: An integrated approach to manage uncertainty, turbulence, and dynamics. J. Knowl. Manag. 2017, 21, 233–253. [Google Scholar] [CrossRef]
Figure 1. Research framework. Adapted with permission from Yun et al. (2021) [55].
Sustainability 14 02574 g001
Figure 2. The effects of digital transformation on OA and CA.
Sustainability 14 02574 g002
Table 1. Research scope with summary of descriptive statistics.
VariablesJournal TypeYear1200
(Huma.)
1400
(Busi.)
2000
(Econ.)
2200
(Engi.)
2600
(Math.)
Number of articles
(Total)
Closed
access
3–617526865317835,63535,353
13–16688226,027732363,38266,513
Open
access
3–60213711681066
13–1673261649304992739826
Number of authors
(Average)
Closed
access
3–61.071.771.703.451.76
13–161.881.821.983.542.06
Open
access
3–6.2.141.762.921.68
13–162.222.862.393.392.97
Number of references
(Average)
Closed
access
3–620.3325.2822.3612.8817.25
13–1628.3028.9333.2919.5821.47
Open
access
3–6.48.7626.2711.6115.32
13–1631.0937.3233.5222.2425.57
Number of citations
(Average)
Closed
access
3–61.5728.2811.727.3611.25
13–161.525.885.543.844.15
Open
access
3–6.4.717.544.727.28
13–161.853.103.135.314.40
Note: 1200 (Huma.) = 1200 (Arts and Humanities); 1400 (Busi.) = 1400 (Business, Management, and Accounting; 2000 (Econ.) = 2000 (Economics, Econometrics, and Finance; 2200 (Engi.) = 2200 (Engineering; 2600 (Math.) = 2600 (Mathematics); 3–6 = 2003–2006; 13–16 = 2013–2016.
Table 2. Descriptive statistical analysis of closed access journals HME.
NumberMinimumMaximumMeanSD
Year03–0613–1603–0613–1603–0613–1603–0613–1603–0613–16
NC11,795 40,23200198140919.855.0763.50413.898
NR11,795 40,2320030551223.9329.6125.23530.928
NA11,795 40,2321111181.641.860.9171.161
SMR11,795 40,232−7.8−10.035.030.50.2090.3401.02820.9578
Note: NC = number of citations, dependent variable; NR = number of references, moderating variable; NA = number of authors, independent variable; SMR = standardization moderating value = Z (NR) × Z (NA).
Table 3. Correlation of closed access journals in HME.
NCNANRSMR
Year03–0613–1603–0613–1603–0613–1603–0613–16
NC11
NA0.021 **0.077 **1
NR0.185 **0.329 **−0.090 **0.043 **11
SMV0.0050.070 **−0.0020.086 **−0.405 **−0.026 **11
Note: ** denotes correlation was significant at the 0.01 level (two-tailed).
Table 4. The Moderating Effect of Closed Access Journals in AME.
2003–2006

1200
(Huma.)
+
1400
(Busi.)
+
2000
(Econ.)

(AME)
Dependent VariableNumber of citation (NC) (β)
Model 1Model 2Model 3
Independent Variable
Number of author (NA)
0.184 **0.123 **0.098 **
Moderating Variable
Number of Reference (NR)
0.295 **0.301 **
Interaction Term
Standardization moderation value (SMV)=Z(NA)*Z(NR)
0.104 **
R20.0340.1170.127
F415.463 **782.268 **573.199 **
2013–2016
1200
(Huma.)
+
1400
(Busi.)
+
2000
(Econ.)

(AME)
Dependent VariableNumber of citation (NC) (β)
Model 1Model 2Model 3
Independent Variable
Number of author (NA)
0.230 **0.120 **0.104 **
Moderating Variable
Number of Reference (NR)
0.324 **0.321 **
Interaction Term
Standardization moderation value (SMV)=Z(NA)*Z(NR)
0.096 **
R20.0530.1460.155
F2256.170 **3441.589 *2460.596 **
Note: β = standard coefficient, 2,3: natural log; ** p < 0.01 (two-tailed), * p < 0.05., AME = 1200(Huma.) + 1400(Busi.) + 2000(Econ.).
Table 5. Descriptive statistical analysis of OAJs in HME.
NumberMinimumMaximumMeanSD
Year03–0613–1603–0613–1603–0613–1603–0613–1603–0613–16
NC5812,02400491176.622.358.8804.961
NR5812,02411010729134.4232.5620.90221.245
NA5812,0241110611.902.341.3341.531
SMR5812,024−2.3−9.11.274.70.039−0.0190.60471.2089
Note: NC = number of citations, dependent variable; NR = number of references, moderating variable; NA = number of authors, independent variable; SMR = standardization moderating value = Z (NR) × Z (NA).
Table 6. Correlation of OAJs in AME.
NCNANRSMR
Year03–0613–1603–0613–1603–0613–1603–0613–16
NC11
NA−0.1270.176 **11
NR−0.1120.167 **−0.040−0.019 *11
SMV0.1670.83 **−0.0530.141 **−0.386 **−0.026 **11
Note: ** denotes correlation was significant at the 0.01 level (two-tailed); * at the 0.05 level (two-tailed).
Table 7. The moderating effect of OAJs in HME.
2003–2006
1200
(Huma.)
+
1400
(Busi.)
+
2000
(Econ.)

(AME)
Dependent VariableNumber of Citations (β)
Model 1Model 2Model 3
Independent Variable
Number of Authors
−0.127−0.132−0.123
Moderating Variable
Number of References
−0.117−0.064
Interaction Term
Standardization Moderation Value (SMV) = Z(NA) × Z(NR)
0.135
R20.0160.0300.045
F0.9220.8460.856
2013–2016
1200
(Huma.)
+
1400
(Busi.)
+
2000
(Econ.)
(AME)
Dependent VariableNumber of Citations (β)
Model 1Model 2Model 3
Independent Variable
Number of Authors
0.176 **0.179 **0.170 **
Moderating Variable
Number of References
0.171 **0.172 **
Interaction Term
Standardization Moderation Value (SMV) = Z(NA) × Z(NR)
0.064 **
R20.0310.0600.064
F382.222 **383.128 **273.489 **
Note: β = standard coefficient, 2,3: natural log; ** p < 0.01 (two-tailed). AME = 1200(Huma.) + 1400(Busi.) + 2000(Econ.).
Table 8. Descriptive statistical analysis of closed access journals in EM.
NumberMinimumMaximumMeanSD
Year03–0613–1603–0613–1603–0613–1603–0613–1603–0613–16
NC70,988129,8950045084689.304.0032.6709.879
NR70,988129,8950068446715.0620.5514.60114.624
NA70,988129,8951131832.602.781.6551.638
SMR70,988129,895−41.1−32.041.569.1−0.0900.0430.96811.0746
Note: NC = number of citations, dependent variable; NR = number of references, moderating variable; NA = number of authors, independent variable; SMR = standardization moderating value = Z (NR) × Z (NA).
Table 9. Correlation of closed access journals in EM.
NCNANRSMR
Year03–0613–1603–0613–1603–0613–1603–0613–16
NC11
NA0.021 **0.077 **11
NR0.185 **0.329 **−0.090 **0.043 **11
SMV0.0050.070 **−0.0020.086 **−0.405 **−0.026 **11
Note: ** denotes correlation was significant at the 0.01 level (two-tailed).
Table 10. The moderating effect of closed access journals in EM.
2003–2006

Engineering (2200)
+
Mathematics
(2600)

(EM)
Dependent VariableNumber of Citations (β)
Model 1Model 2Model 3
Independent Variable
Number of Authors
0.021 **0.038 **0.041 **
Moderating Variable
Number of References
0.188 **0.228 **
Interaction Term
Standardization Moderation Value (SMV) = Z(NA) × Z(NR)
0.097 **
R20.0000.0360.043
F30.225 *1308.579 **1073.581 **
2013–2016

Engineering (2200)
+
Mathematics
(2600)

(EM)
Dependent VariableNumber of Citations (β)
Model 1Model 2Model 3
Independent Variable
Number of Authors
0.077 **0.063 **0.057 **
Moderating Variable
Number of References
0.326 **0.328 **
Interaction Term
Standardization Moderation Value (SMV) = Z(NA) × Z(NR)
0.073 **
R20.0060.1120.117
F775.297 **8183.188 **5749.285 **
Note: β = standard coefficient, 2, 3: natural log; ** p < 0.01 (two-tailed), * p < 0.05.
Table 11. Descriptive statistical analysis of OAJs in EM.
NumberMinimumMaximumMeanSD
Year03–0613–1603–0613–1603–0613–1603–0613–1603–0613–16
NC223419,099003168135.944.8418.66211.100
NR223419,0990025738013.3823.9511.54813.846
NA223419,0991124882.333.171.5791.738
SMR223419,099−17.8−32.121.452.1−0.0830.0280.98440.9766
Note: NC = number of citations, dependent variable; NR = number of references, moderating variable; NA = number of authors, independent variable; SMR = standardization moderating value = Z (NR) × Z (NA).
Table 12. Correlation of the OAJs in EM.
NCNANRSMR
Year03–0613–1603–0613–1603–0613–1603–0613–16
NC11
NA0.0347646830.034 **11
NR0.299 **0.235 **−0.083 **0.028 **11
SMV0.017−0.0070.060 **0.039 **−0.218 **−0.135 **11
Note: ** denotes correlation was significant at the 0.01 level (two-tailed).
Table 13. The moderating effect of OAJ in EM.
2003–2006

2200
(Engi.)
+
2600
(Math.)

(EM)
Dependent VariableNumber of Citations (β)
Model 1Model 2Model 3
Independent Variable
Number of Authors
0.0350.060 *0.056 *
Moderating Variable
Number of References
0.304 **0.322 **
Interaction Term
Standardization Moderation Value (SMV) = Z(NA) × Z(NR)
0.083 **
R20.0010.0930.100
F2.701114.602 **82.367 **
2013–2016

2200
(Engi.)
+
2600
(Math.)

(EM)
Dependent VariableNumber of Citations (β)
Model 1Model 2Model 3
Independent Variable
Number of Authors
0.034 **0.027 **0.026 **
Moderating Variable
Number of References
0.235 **0.238 **
Interaction Term
Standardization Moderation Value (SMV) = Z(NA) × Z(NR)
0.024 *
R20.0010.0560.057
F21.485 **568.336 **383.040 **
Note: β = standard coefficient, 2,3: natural log; ** p < 0.01 (two-tailed), * p < 0.05., EM = 2200(Engi.) + 2600(Math.).
Table 14. Summary of hypotheses.
Independent
Variables
Closed/Open PeriodHypothesisHMEEM
Collective
Intelligence
Closed
Access
2003–20061-1-1AcceptedAccepted
2013–20161-1-2AcceptedAccepted
Open
Access
2003-20061-2-1RejectedRejected
2013–20161-2-2AcceptedAccepted
ReferenceClosed
Access
2003–20062-1-1AcceptedAccepted
2013–20162-1-1AcceptedAccepted
Open
Access
2003–20062-2-1RejectedRejected
2013–20162-2-2AcceptedAccepted
Moderating
Effects
Closed
Access
2003–20063-1-1AcceptedAccepted
2013–20163-1-2AcceptedAccepted
Open
Access
2003–20063-2-1RejectedRejected
2013–20163-2-2AcceptedAccepted
Publisher’s Note: MDPI stays neutral with regard to jurisdictional claims in published maps and institutional affiliations.

