Article

Systematic Modeling and Analysis of On-Board Vehicle Integrated Novel Hybrid Renewable Energy System with Storage for Electric Vehicles

1
School of Information Technology, Engineering, Mathematics and Physics (STEMP), The University of the South Pacific, Suva, Fiji
2
School of Science, Technology and Engineering, University of the Sunshine Coast, Sippy Downs, QLD 4556, Australia
3
School of Engineering and Information Technology, The University of New South Wales, Sydney, NSW 2052, Australia
*
Authors to whom correspondence should be addressed.
Sustainability 2022, 14(5), 2538; https://doi.org/10.3390/su14052538
Submission received: 30 November 2021 / Revised: 9 February 2022 / Accepted: 18 February 2022 / Published: 22 February 2022
(This article belongs to the Special Issue Smart and Sustainable EV Charging Infrastructure)

Abstract

:
The automobile industry and technology are putting a great significance in improving vehicles to become more fuel economical, but with incremental costs relative to conventional vehicle technologies; these new vehicles are electric vehicles (EV), plug-in hybrid electric vehicles (PHEV), and hybrid electric vehicles (HEV). However, their significant capabilities to reduce petroleum consumption and achieve efficiency over their life cycles offer economic benefits for customers, industry, carmakers, and policymakers. In this paper, an HEV concept based on renewable energy resources (RERs) is proposed. The proposed HEV design utilizes solar PV energy, wind energy, fuel cell, and a supercapacitor (PV + WE + FC + SC) which generates electrical energy via a proton exchange membrane (PEM) and an SC to cater for strong torque requirements. The vehicle incorporates a battery pack in conjunction with an SC for the power demands and an FC as the backup energy supply. An alternator connected to turbine blades runs by wind energy while the car is moving forward, which produces electricity through the alternator to charge the battery. The design aims to ensure zero carbon emission and improved energy efficiency, is lightweight, and incorporates in-wheel motors to eliminate the mechanical transmissions. Modeling and simulation were carried out for each subsystem using MATLAB® and Simulink® packages. ANSYS Fluent simulation was used to analyze wind energy. The standard analysis, e.g., pressure, velocity, and vector contour, were also considered while designing the final model. To regulate the power supply and demand, the selection of energy sources was controlled by a rule-based supervisory controller following a logical sequence that prioritizes energy sources with the SC as a source in-vehicle stop-and-go situations while the battery acts as the primary source, FC as a backup supply, and wind and solar power to recharge the battery. Solar charging is switched on automatically once the vehicle is parked, and the controller controls the energy flow from the alternator during that period.

1. Introduction

The automobile industry is in the midst of a crucial transformation. Current steps to improve productivity and mitigate energy demand need to be deepened and expanded to meet the Sustainable Development Scenario (SDS) requirements. Globally, transport emissions have been increased by 0.6% in 2018 when compared with the past decade, at 1.6% [1]. The transportation sector heavily contributes to CO2 emissions from fuel combustion (i.e., 24% of CO2 emissions are from transportation). Automobiles such as vehicles, buses, trucks, and heavy vehicles contribute nearly three-quarters of transport CO2 emissions [2,3]. Similarly, CO2 emissions from shipping and aviation are continuously increasing, resulting in these hard-to-abate sub-sectors needing more global action [4]. For the clean and sustainable energy future, the most critical issues that need to be addressed are minimizing fuel for transportation, using renewable energy resources (RERs), and finding innovative ways of energy consumption [5,6]. Energy researchers have identified that burning fossil fuels (FFs) for our traditional means of transportation is one of the main reasons behind global warming and climate change [7,8]. To reduce carbon footprints, traditional transportation systems require attention [9,10]; electric vehicles (EVs) have entered the energy market as potential alternatives, but these vehicles are dependent on the power grid for their battery to be charged [11]. In 2018, a global increase in electric cars resulted in the fleet exceeding 5.1 million, up from 2 million from the previous years. This means the use of electric cars and new electric car registrations have more than doubled. Regarding the current status of growing technological advancement in energy storage technology (i.e., battery chemistry and SC), stakeholders and governments continue to support and these areas and are accelerating the economic breakeven point of EVs and building demand for our key commodities [12]. In Figure 1, the predicted growth in EV sales and technology, which provides a clear picture of the economic gap between them and conventional vehicles from 2017 to 2030, is shown.
The electric power grid uses FF sources to generate electricity [13]. Consequently, the so-called green car or EV also contributes to environmental pollution and greenhouse gas emission [14,15]. Incorporating EVs may lower gasoline and diesel usage, reducing air pollution; however, charging EVs with renewable-based power generation increases air pollution. In terms of energy-saving and lowering reliance on traditional FFs, EVs exceed internal combustion engine vehicles (ICEVs). In this framework, EV and plug-in hybrid electric vehicles (PHEV) have had recent breakthroughs in the transportation industry, shifting from FF energy to renewable [14]. Typically, researchers and manufactures globally are going for “Clean-Car” [16] or “Green-Car” [17] technologies, and some of the RER options that have been explored through various studies and developments are wind and solar energy [18,19]. As EVs and PHEVs rely on electric power, their fuel economies are typically measured in kWh per 160km instead of miles per gallon of gasoline equivalents (mpge). Today, light-duty EVs can surpass 100 mpge and consume only 25–40 kWh driving 160 km [20,21,22,23]. New technologies must address the carbon emissions issue along with fuel economy and efficiency. The design of the zero-fuel zero-emission (ZFZE) car is a combination of (PV+WE+FC+SC). An SC is used for regenerative braking, and an FC to drive in-wheel motors, which are technologically new in terms of designing a sustainable energy utilization system. The most promising integration is RERs and automobile technologies, the combination of RERs such as solar PV system, FC, SC, and battery storage systems, has led to improving the efficiency of EVs.
Interestingly, solar-powered EVs use solar cells to convert energy from the sun to electrical energy in an HEV. One solar cell typically generates 0.5–0.8 V, and several cells are used to make up solar cell arrays of varying sizes depending on the load of the vehicle [24]. The advantages of a solar-powered vehicle include sourcing energy from a free and clean energy source, low maintenance and efficiency, and secreting no harmful emissions. However, a solar-powered vehicle may not have the speed and power of a conventional engine car and can run only during the sun hours.
The FC is an electrochemical engineered device that exploits hydrogen as its fuel and produces electrons, protons, heat, and water as by-products. The FC can produce electrical energy with a continuous and constant supply of hydrogen gas to the cell [25,26]. Advantages of FC vehicles (FCVs) are no direct CO2 emissions [19]. However, hydrogen in FCVs needs to be renewably sourced.
SC has high power densities and rapid charge/discharge rates, and these characteristics tend to be helpful in stop-and-go situations in an HEV [27]. The SC may capture the kinetic energy of an HEV as it brakes, and this captured energy can be reused in acceleration [28].
A traditional vehicle alternator uses energy from the rotating engine, but no such rotating engine is available in the case of the proposed HEV. Thus, wind power is used to drive the alternator to charge the battery while the vehicle moves. The reason for using wind power in a small-scale alternator is that the drag of a large wind turbine could reduce the vehicle speed.
This paper presents systematic modeling of PV+WE+FC+SC power analysis for ZFZE. The control analysis is modeled using MATLAB® and Simulink® software. Furthermore, a detailed process of an EV is shown, such as the charge status of the energy storage system (ESS). The design proposed is implemented and modeled using data from a site location, considering the average wind speed, the alignment and placements of the turbine, and the average energy usage of the application. One of the main advantages of the proposed design of this HEV is that it has less overall weight, which makes the system more efficient, designed to support energy usage, and multiple RERs promote sustainability. All these are in line with sustainable development goals (SDG 7, 11 and 13). The goals are as follows.
  • SDG7: affordable, reliable, sustainable, and modern energy;
  • SDG8: decent work and economic growth;
  • SDG11: make cities inclusive, safe, resilient and sustainable;
  • SDG13: take urgent action to combat climate change and its impacts.
For all the above goals, the contributions of this research work promote sustainability. The overall designed system is efficient and reliable, and the mathematical model is based on all the real parameters discussed in this paper. Finally, the result presented in this paper demonstrates the effectiveness of the proposed system and is more applicable and suitable to attain sustainability.
The remains of this paper are organized as follows. Section 2 details out a brief literature review, considering the current research methodology. Section 3 provides the conceptual designs of ZFZE and also presents the overall system design (i.e., ESS sizing, load analysis, EV power, converter design, FC, PV, and wind energy design). Section 4 provides a rule-based control. Section 5 and 6 provide the simulation of MATLAB® & Simulink®, and ANSYS Fluent software. Section 7 gives the interlinkage of EVs with SDGs and future trends of EVs with SDGs are presented in Section 8. Section 9 outlines the summary of the overall paper.

2. Literature Review

Recently, some notable works have been carried out in the literature showing the integration of RERs in the automobile industry. Some exciting technologies such as zero-emission HEVs, PHEV, and EVs promise to combat climate change and support the SDGs.
A hybrid proton exchange membrane FC and Ultra-Capacitor (PEMFC–UC) was introduced by Horrein et al. [29]. They also developed an energy management system (EMS), which was used to optimize energy demand and control systems. The presented study showed a polynomial control technique based on a bidirectional load-sharing power concept. A proportional Integral (PI) controller was applied to control and compare the EMS. The finding which was shown was applicable for PEMFC, i.e., that a constant DC voltage and current was of great importance. The proposed system had a few drawbacks, which were analyzed using graphical fluctuations attributable to the sensors of data acquisition. Reddy et al. [30] disclosed a proton exchange membrane FC (PEMFC)-vehicles (FCVs) (PEMFC–UC) hybrid system for an EV. Different flatness control strategies were used in designing the PEMFC–UC; they showed that the PEMFC fast transition and the interleaving switching technique included two DC–DC boost converts to minimize the output current ripple. Similarly, a hybrid EV system based on PEMFC–UC was presented by Karunarathne and Alloui et al. [31,32].
Yang et al. [33] examined and performed a novel EMS for electric scooters with an electronic gearshift and regenerative braking. They conducted the test on a four-phase axial-flux DC brushless wheel motor. The conducted research showed how to achieve mechanical energy through the conversion of electrical energy; mechanical energy drives the vehicle which later was discussed with multiple energy sources. Detailed regenerative braking was designed which was tested with different scenarios. Some of the literature from the current field of interest is summarized in Table 1.
In one study, a different Fuzzy Logic (FL) control method was used and examined. The research showed a control approach that monitored the designed system parameter behavior. The controller evaluates the total power required by the proposed design, understanding the theory behind the negative braking power through the accelerator positions. The proposed control mainly includes the rules of if-then, but the rules are absent in the report, and the performance test results are unclear [40]. Similarly, an EMS was designed with an FL to operate and manage the average required power. Numerous essential aspects influence the reliability and efficiency of the EMS in EV applications. However, several aspects must be addressed to overcome the issues of HEV EMS dependability and efficiency. Table 2 summarizes the issues associated with the EMSs of HEVs and EVs. The charge status of the UC was considered while designing PEMFC, and the charging status of the UC was considered by Fathabadi, Jia et al. [41,42].
Gherairi [15] presents a systemic review of different kinds of designs and control strategies focusing mainly on a hybrid system comprised of a FC + Battery + Ultra-Capacitor (BT–UC). The research conducted demonstrated the UC’s important function during a peak power transition. Due to its fast dynamic response, it can offer efficient power suitable for the load while the PEMFC remains off during the BT–UC mode due to the lack of hydrogen fuel. In this case, the UC is involved in the load requirements with the battery. The authors reviewed many scientific research studies but failed to use different RERs to make the HEV more efficient and feasible for supporting a zero-emission HEV. The limitation noticed in this research was that the integration of PV and wind is missing which is a promising technology and has great potential for carrying out research.
The current need for and proper use of RERs supports the concept of designing a PV + WE + FC + SC that fills the gap in the current field of study according to the author’s knowledge and understanding of the feasibility studies carried out on HEVs and their simulation, modeling and optimization in the context of supporting sustainability and global reductions in carbon emissions. A summary of recent studies showing how SDGs were achieved in the automobile industry is provided in Table 3. In contrast to the abovementioned works, we design and present effective power balancing that links with different RERs and controls the performance of the overall system.

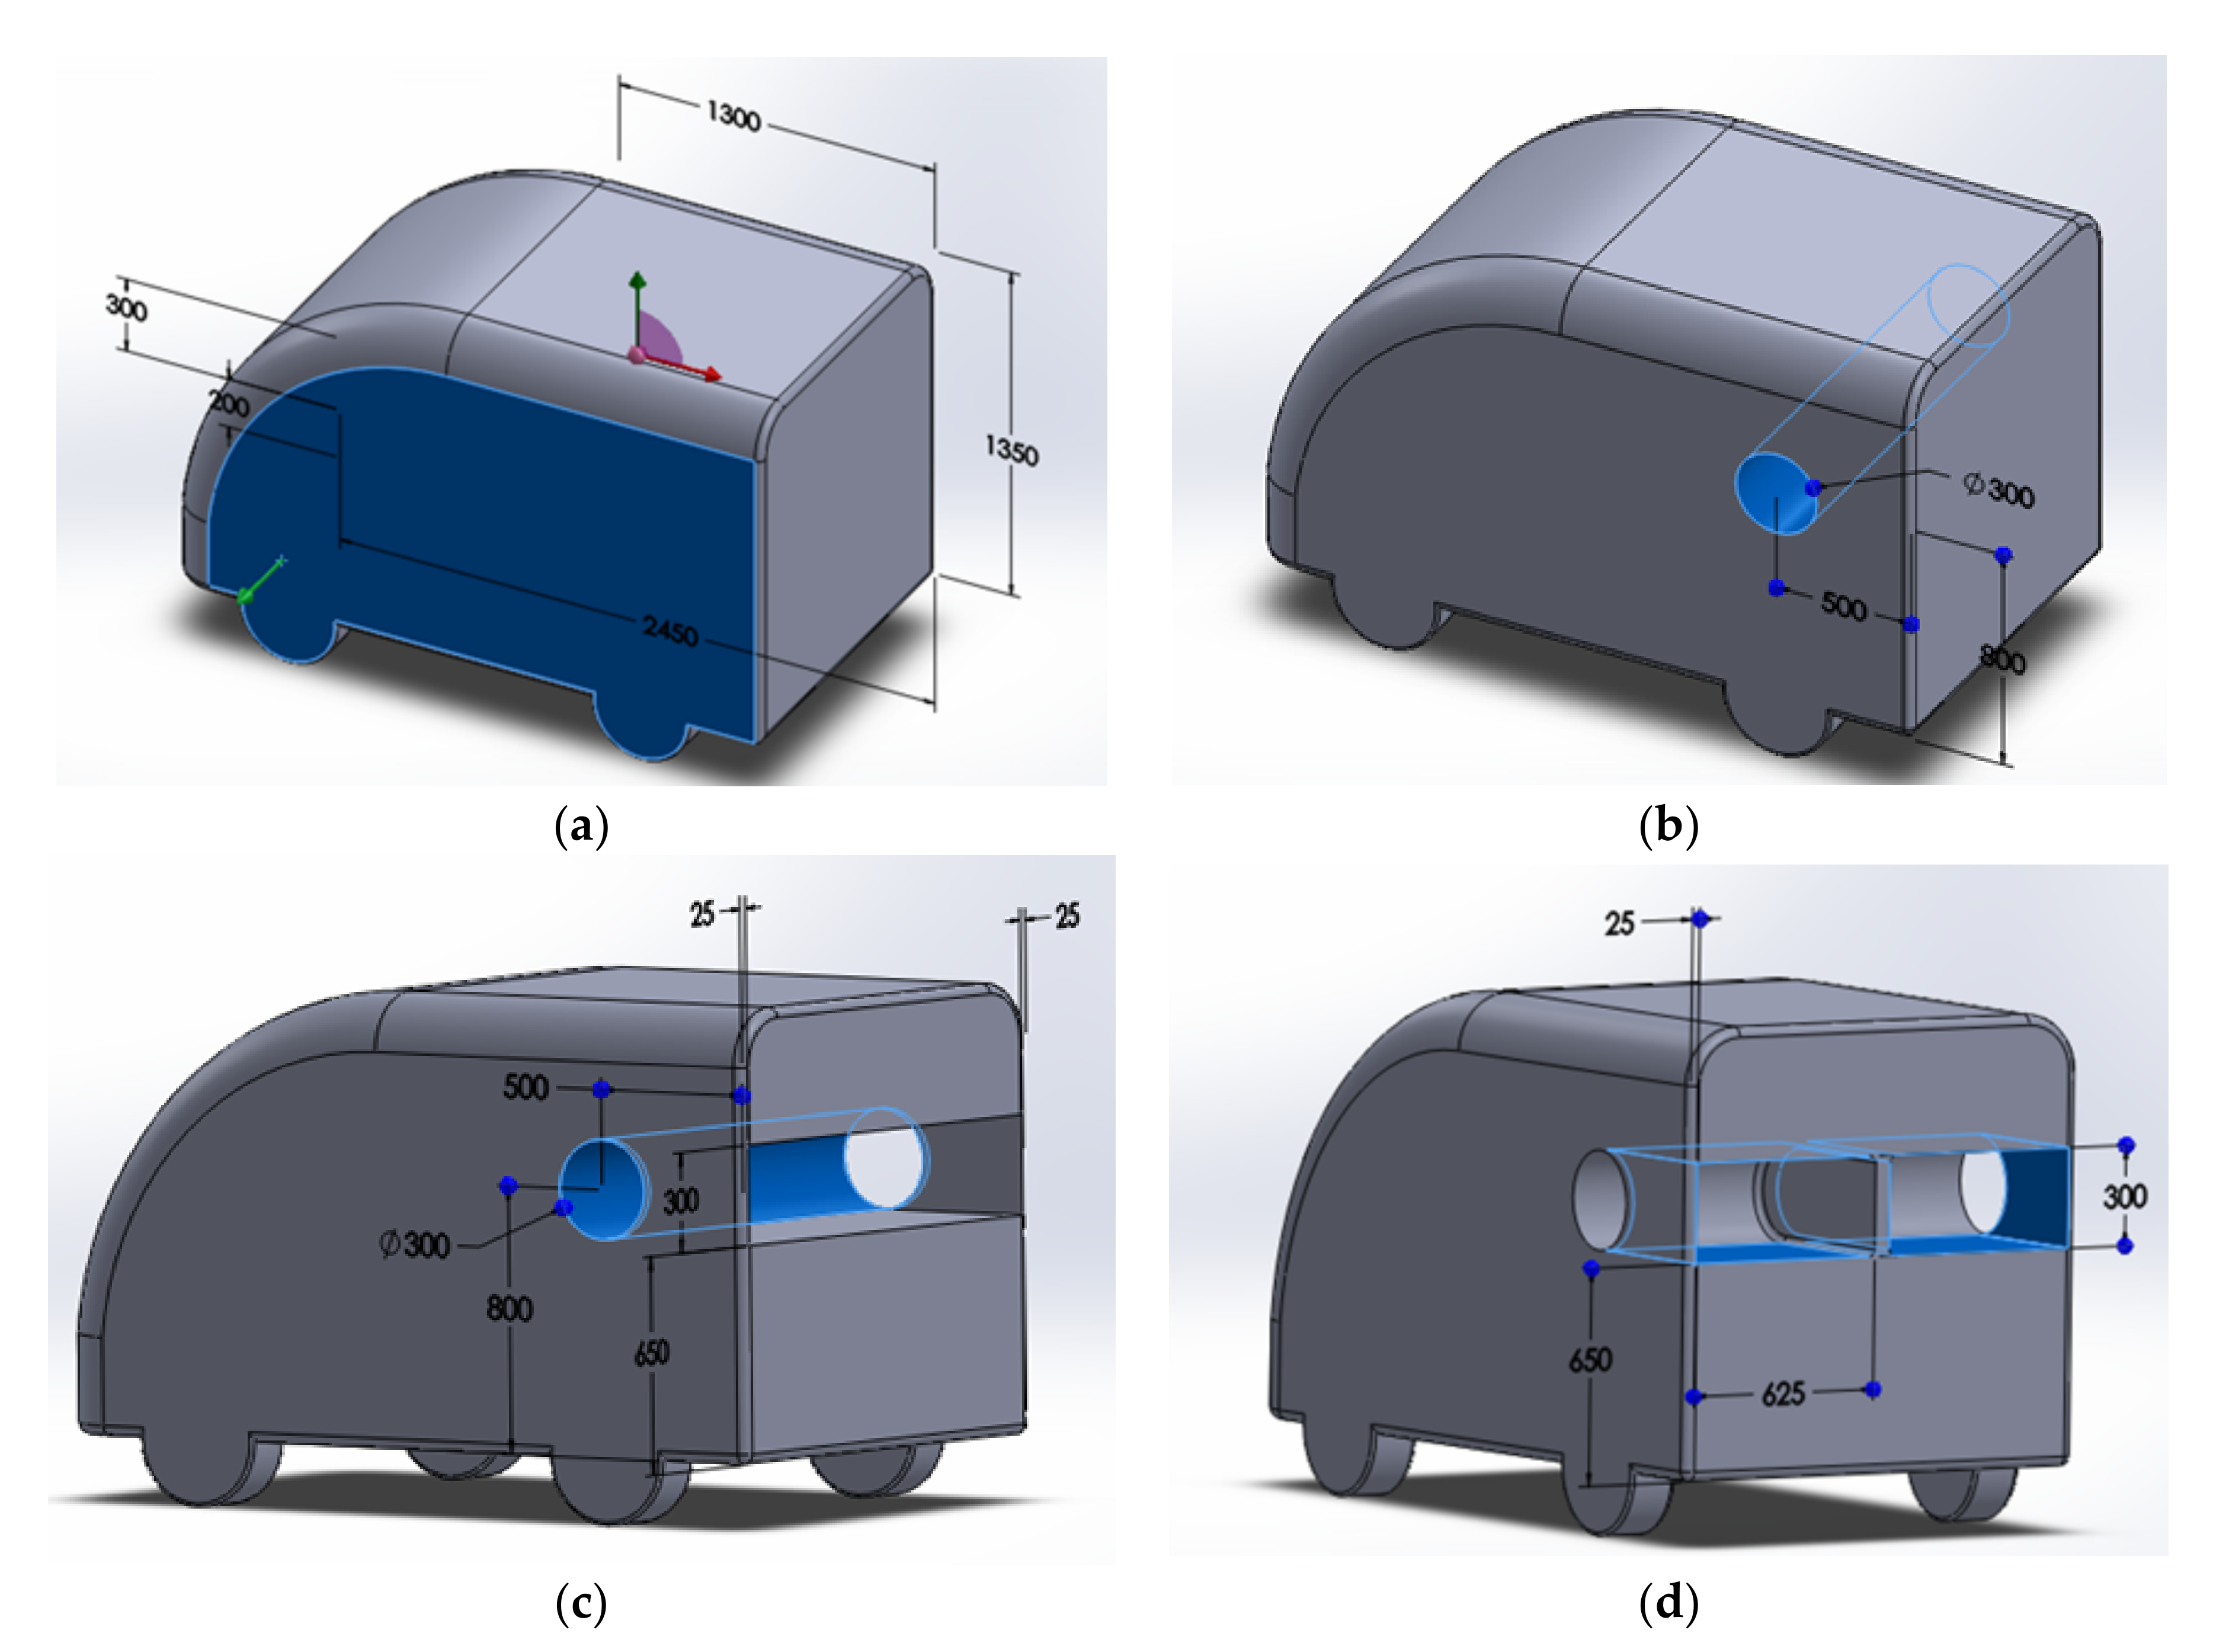
3. Conceptual Design of ZFZE

Adopting ZFZE vehicles will significantly decrease air pollution and noise, particularly in urban areas. The design of ZFZE will ensure the reduction of vehicle weight by eliminating the mechanical transmission part using in-wheel motors, resulting in increased autonomy. Moreover, RERs need a complex control strategy; to design an HEV, a more complex algorithm is required to be a fully renewable-based EV [79]. As all these aspects are considered when designing the ZFZE vehicle which outputs zero emissions at the point of use, it responds to the global exigencies of sustainable development coherently with an energetic strategy for the future by looking at safety, efficiency and respect for the environment. In the recent literature, it was clear that the automobile industry and government organizations (i.e., concern with global warming and reduction in harmful gas emission) are promoting the RERs and their application in vehicles. One of the common explanations is HEV and fully EV, which are evolving significantly. Therefore, soon designing ZFZE vehicles will be a new and interesting field of research, with novel solutions for urban mobility and low environmental impacts developed.
The design of the vehicle structure and a combination of PV + WE + FC + SC sources and ESS is shown in Figure 2. The vehicle will have a battery pack and a lithium-ion battery could be the best choice to minimize the weight and improve the performance; however, in this research the lead-acid battery will be used for cost and safety reasons. To meet strong torque variations, SC will be used in conjunction with batteries and FC. SC has been added with the main drive train to improve reliability and efficiency. The SC is charged during break and excess energy is produced from renewable sources.
The following sections present the overall system design which consist of structural design, system load and converter topology, and vehicle power (i.e., PV, wind, and FC design).

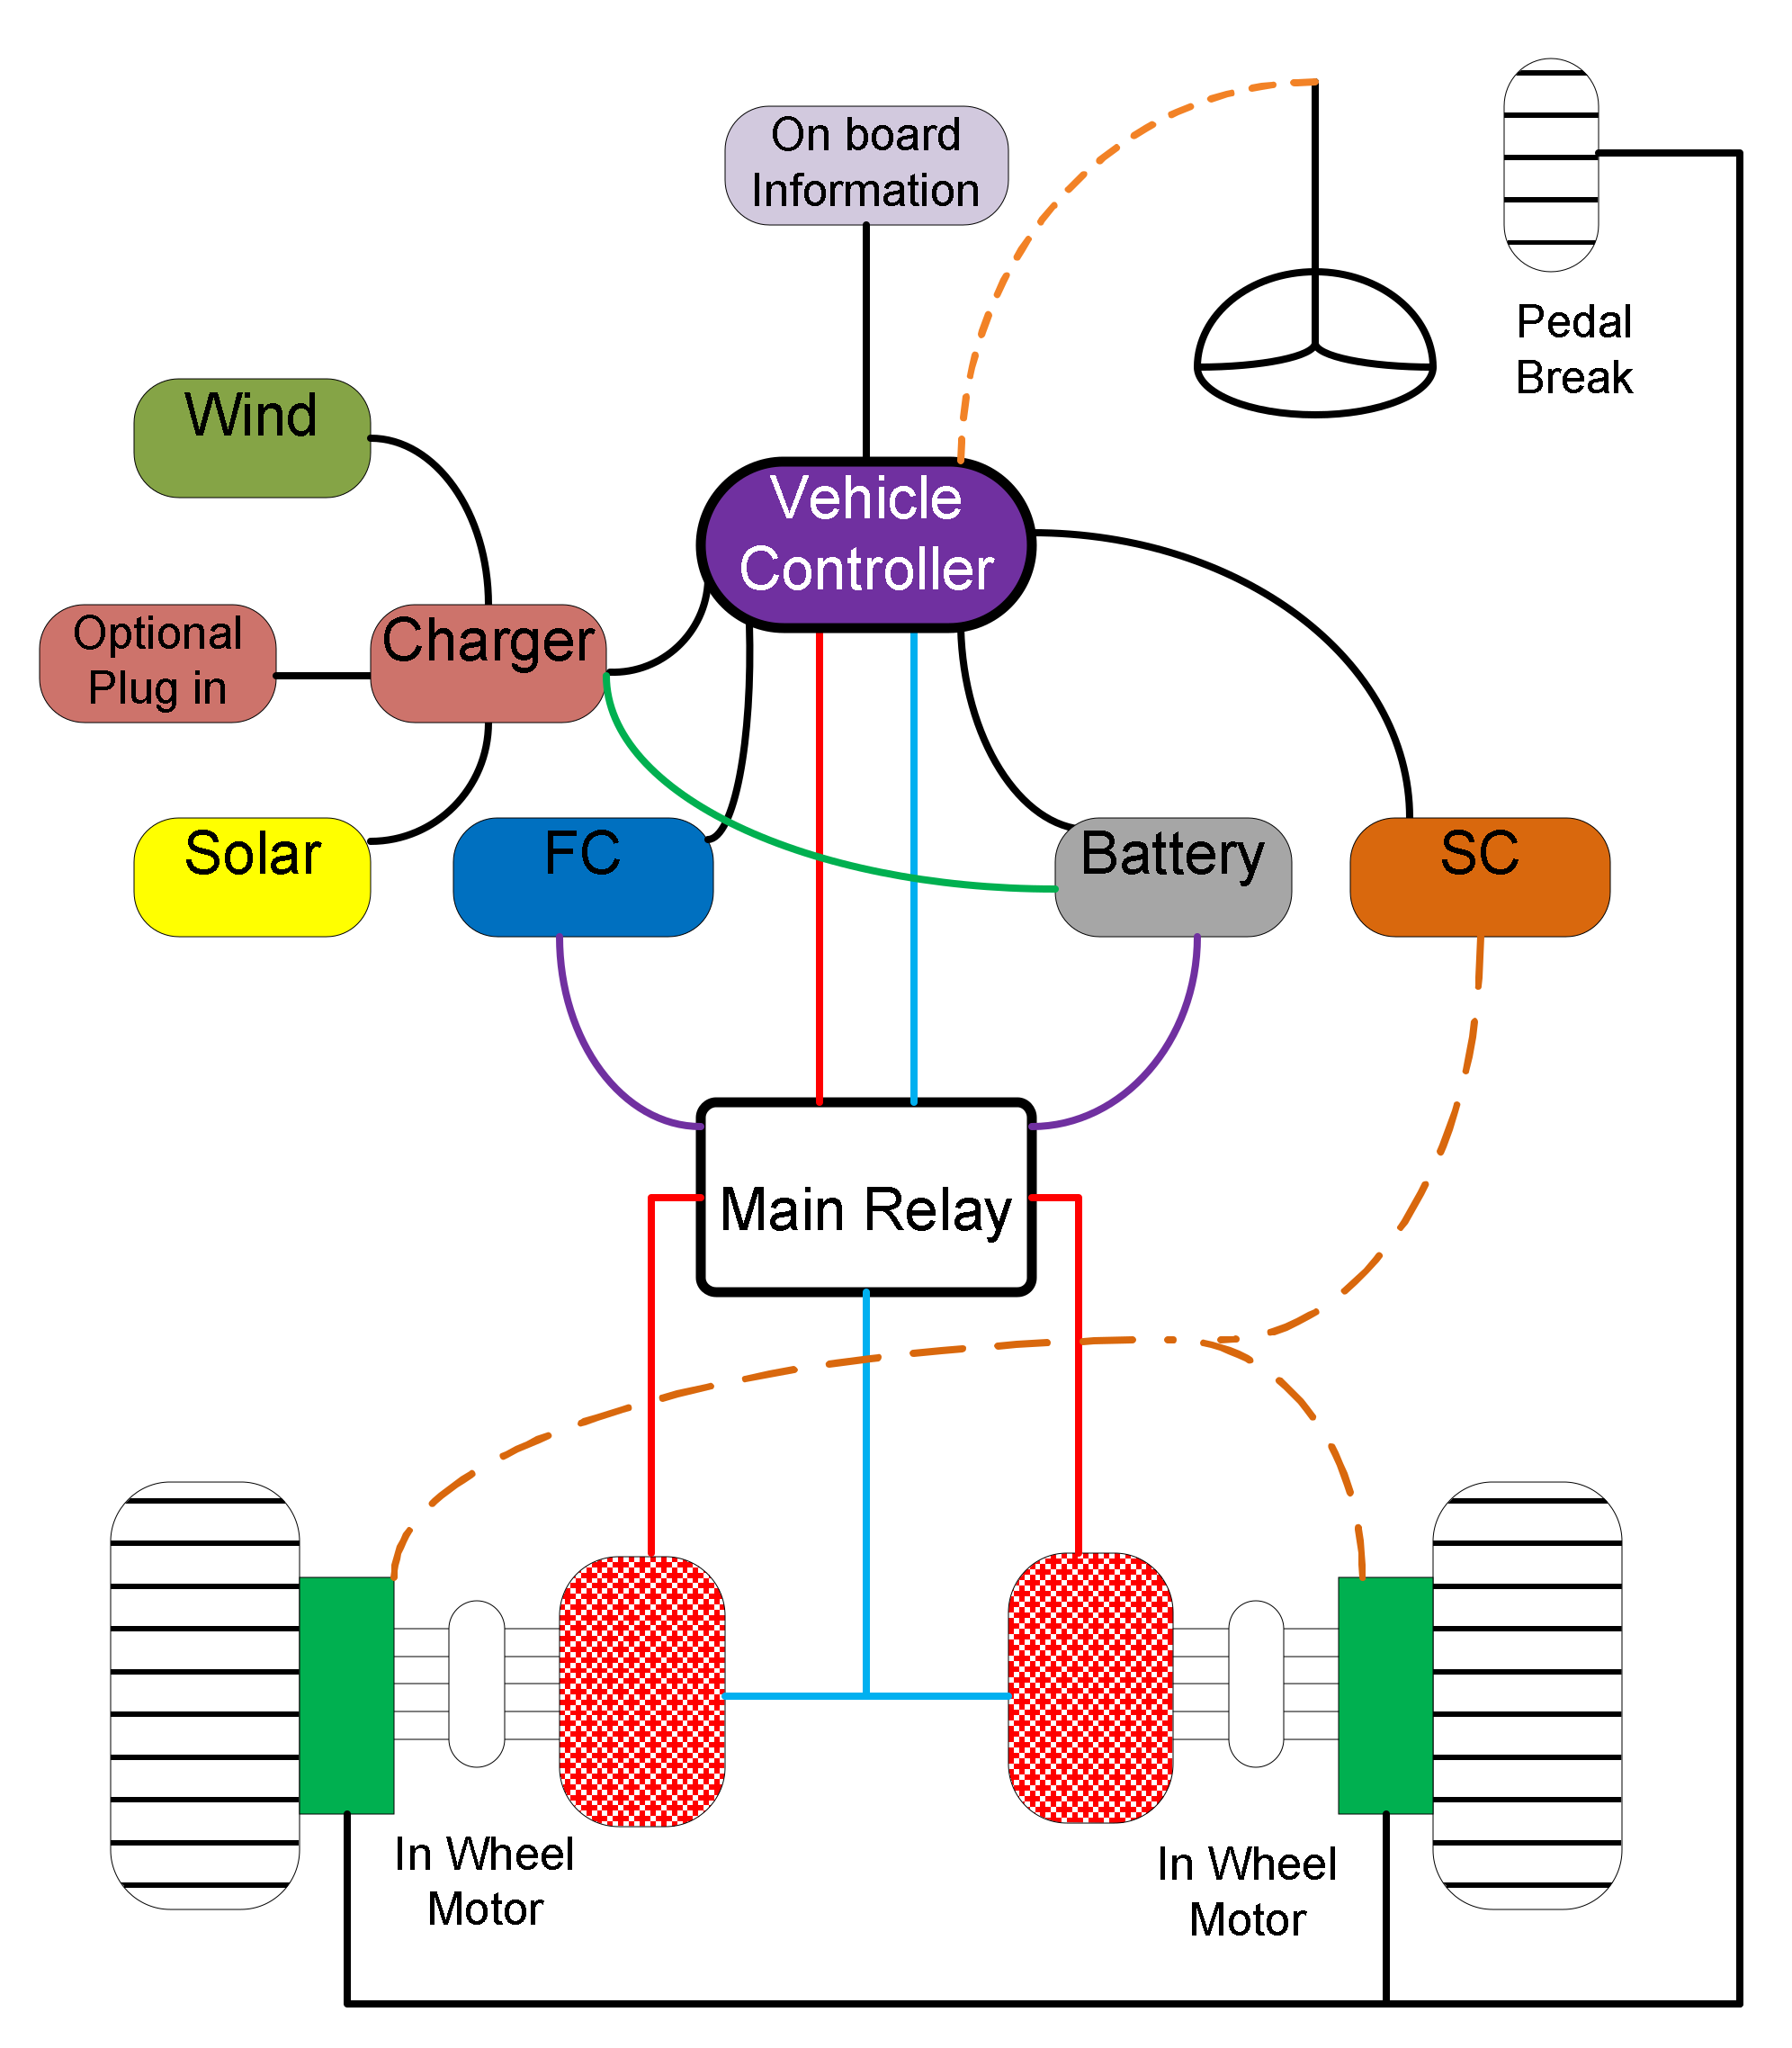
3.1. Overall Strusture

The simulation for the wind was carried out in ANSYS Fluent to see the flow pattern over the vehicle model. Four models were chosen for simulation purposes, as shown in Figure 3. One was the conventional design without duct and exhaust (Figure 3a) and the other three designs were the modifications done on the conventional design which includes the provision for duct and turbine. The first modification had a duct without exhaust; the hole started from one side of the vehicle to the other side of the vehicle. Thus, two turbines can be placed in the same duct but on the opposite sides as shown in Figure 3b. The second modified design was a duct with full exhaust; the design is similar to the first modified design but in this, the duct is connected to exhaust at the back of the vehicle (Figure 3c). The final design was a vehicle with duct and partial exhaust. This was designed by only modifying the third design, and in this case, the exhaust was separated into two compartments by adding a wall at the middle of the exhaust (Figure 3d).
The simulation results are presented in Section 6. The simulation results were used to calculate the pressure difference between the front and back of the vehicle and the force acting in the flow direction and were also used as an input in a model of the onboard control system as shown in Figure 4. Two DC motors provide the required system load and they are powered by both the FC and the battery. Wind energy is used while the vehicle is moving, and solar energy is used when parked to charge the battery. As extra load is required during acceleration, an SC feeds directly to the load, and the SC is charged during deceleration. This management of energy sources is done by a controller activating switches or cutting off supply depending on information from speed sensors and vehicle activities.

3.2. System Load & Battery Bank

The total system load is 6 kW which consists of two 3 kW DC in-wheel motors. Table 4 shows the specifications of the motor and Table 5 shows the specifications of the battery bank.

3.3. Vehicle Power

The system power and speed are calculated in Equation (3) and the wheel torque is dependent on:
  • Rolling Resistance—the opposing force (friction force) the vehicle must overcome due to the rolling motion between the wheels and the surface on which the vehicle moves.
  • Grade Resistance—the force due to gravity that pulls the vehicle back when it climbs an inclination.
  • Acceleration Force—force that acts on the vehicle to accelerate it.
P o w e r = t o r q u e × a n g u l a r   v e l o c i t y
τ = R w h e e l × R f C r r w + w S i n α + w R f α
P o w e r = τ × R P M × π 180
where C r r w is the rolling resistance coefficient, g is the gravitational acceleration, α and τ are the angle of inclination and torque, respectively, R w h e e l is the radius of wheel, w is the weight, and R f is the friction factor.
The following values and variables in Table 6 are calculated using Equation (2). The maximum values of the major vehicle characteristics are given in Table 7, calculated using Equation (3).

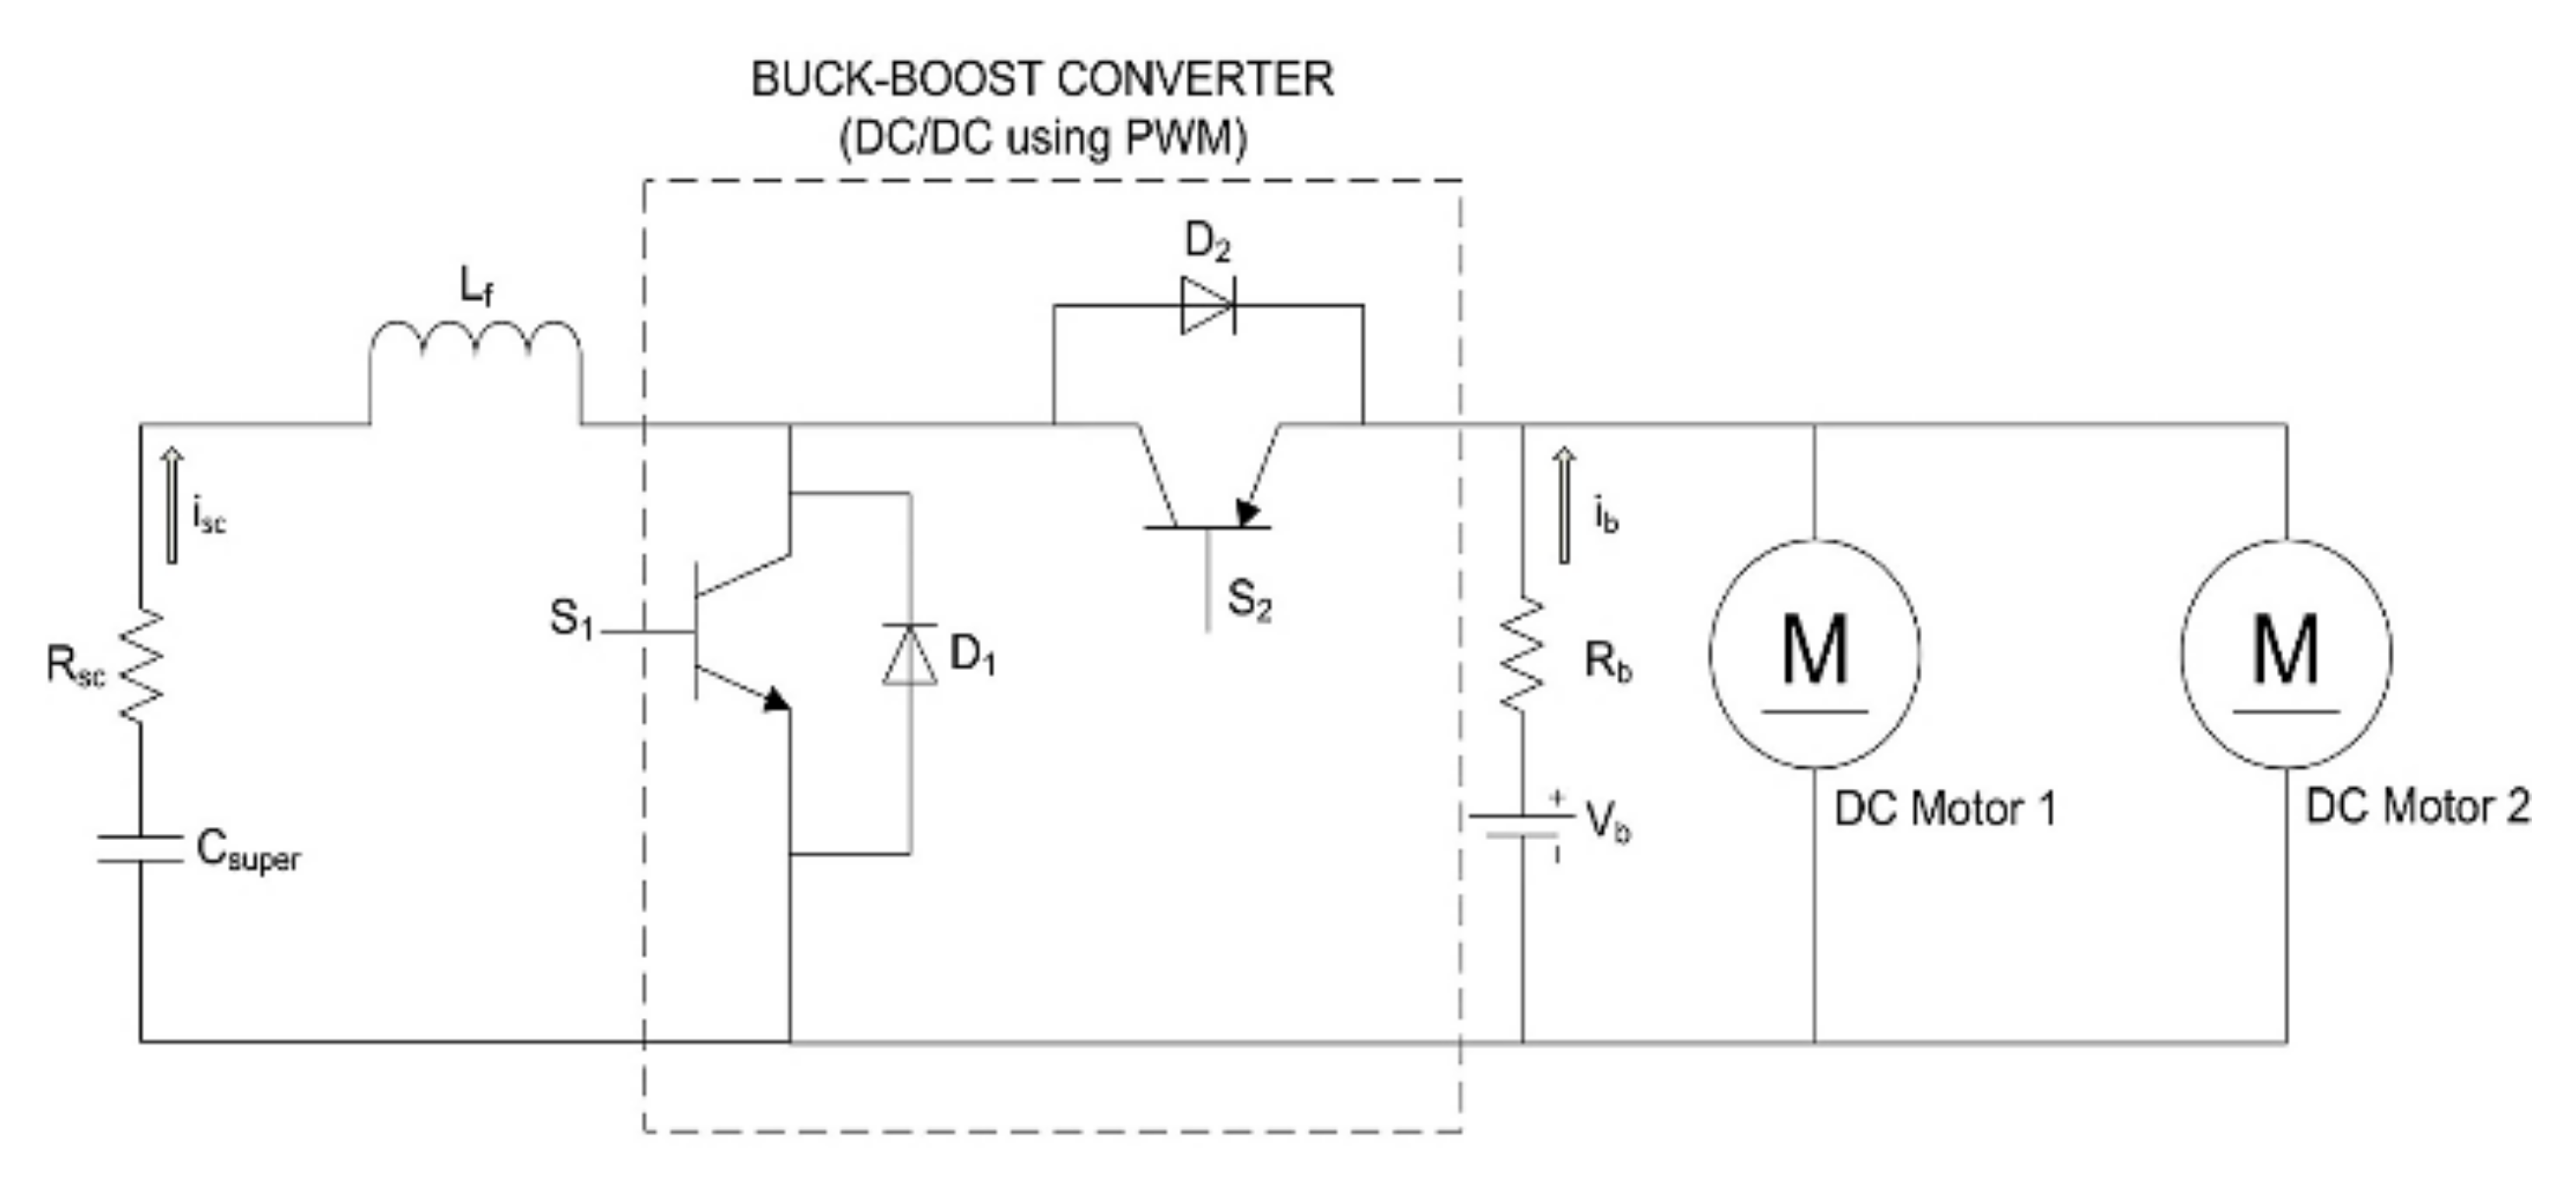
3.4. Design of Bidirectional Buck-Boost Converter

A bidirectional buck-boost converter will control the energy of the SC to charge it quickly without exceeding the maximum current limit from regenerative braking and discharge its energy during the acceleration period. The schematic of a SC bank with a DC–DC converter and two motor loads is shown in Figure 5.
The size of the SC bank depends on the ratings of the in-wheel motors and the overall torque required in accelerating the vehicle. Sizing of the SC bank is carried out considering two situations:
  • Power needed for initial acceleration of vehicle to overcome the initial inertia.
  • Braking power needed to bring vehicle to a stop.
Since greater power for initial acceleration is needed than braking power, sizing is done to meet the power demands during the acceleration period. The calculation for size determination was carried out using Equations (4) and (5), where µ is the coefficient of static friction; Asphalt–Tyre (µ = 0.72) and f r is the fraction of total weight action on the rear wheel of the vehicle and the in wheel motor characteristics are given in Table 8.
τ m a x = µ × w e i g h t × f r × R w h e e l α 2
Total   slack   capacitance = C c e l l × N o .     p a r a l l e l N o .     s e r i e s
Total capacitance is calculated using a SC with the following characteristics.
  • Cell voltage = 2.7 V
  • Rated capacitance = 650 F
  • Cell resistance = 0.8 mΩ
  • Cells required = 75 V/2.7 V = 27 in series
  • Parallel = 1 (single string)

3.5. FC Design

The FC energy source consists of a hydrogen tank and a boost converter that feeds into a DC bus as shown in Figure 6. The FC connection with the motor load equivalent circuit is as shown in Figure 6; the resistor (Rr) represents the ohmic losses of the FC, which expresses the internal resistance of the PEMFC. The parallel connection of the capacitor (Ca) and resistor (Ra), which models the double layer of charge between the electrodes and the membrane of the FC, represent the activation losses (Eo), where the DC source voltage is the theoretical open-circuit voltage of the FC.

3.6. Wind Energy

To utilize the wind energy, an alternator (i.e., DC generator) off the shelf was used in this research, which uses DC from the battery for excitation initially, and after that the alternator is self-excited. The alternator’s performance against the wind flow was tested while a DC motor was used to emulate the wind and we observed its operation with different RPMs. RPM of the rotor shaft, excitation voltage, and output voltage were set as the test parameters. Varying the wind speed and the excitation voltage gives the output voltage in different ranges. This allows setting up a particular excitation voltage at which the alternator will operate normally, and the desired output voltage can be obtained with possible RPMs. The experimental setup is shown in Figure 7. The results obtained from this experiment are shown in Figure 8.
The experimental results show that the output voltage gradually increased with the increase in excitation voltage. This allowed us to choose from a wide range of output voltages. The output voltage is directly proportional to the wind speed.

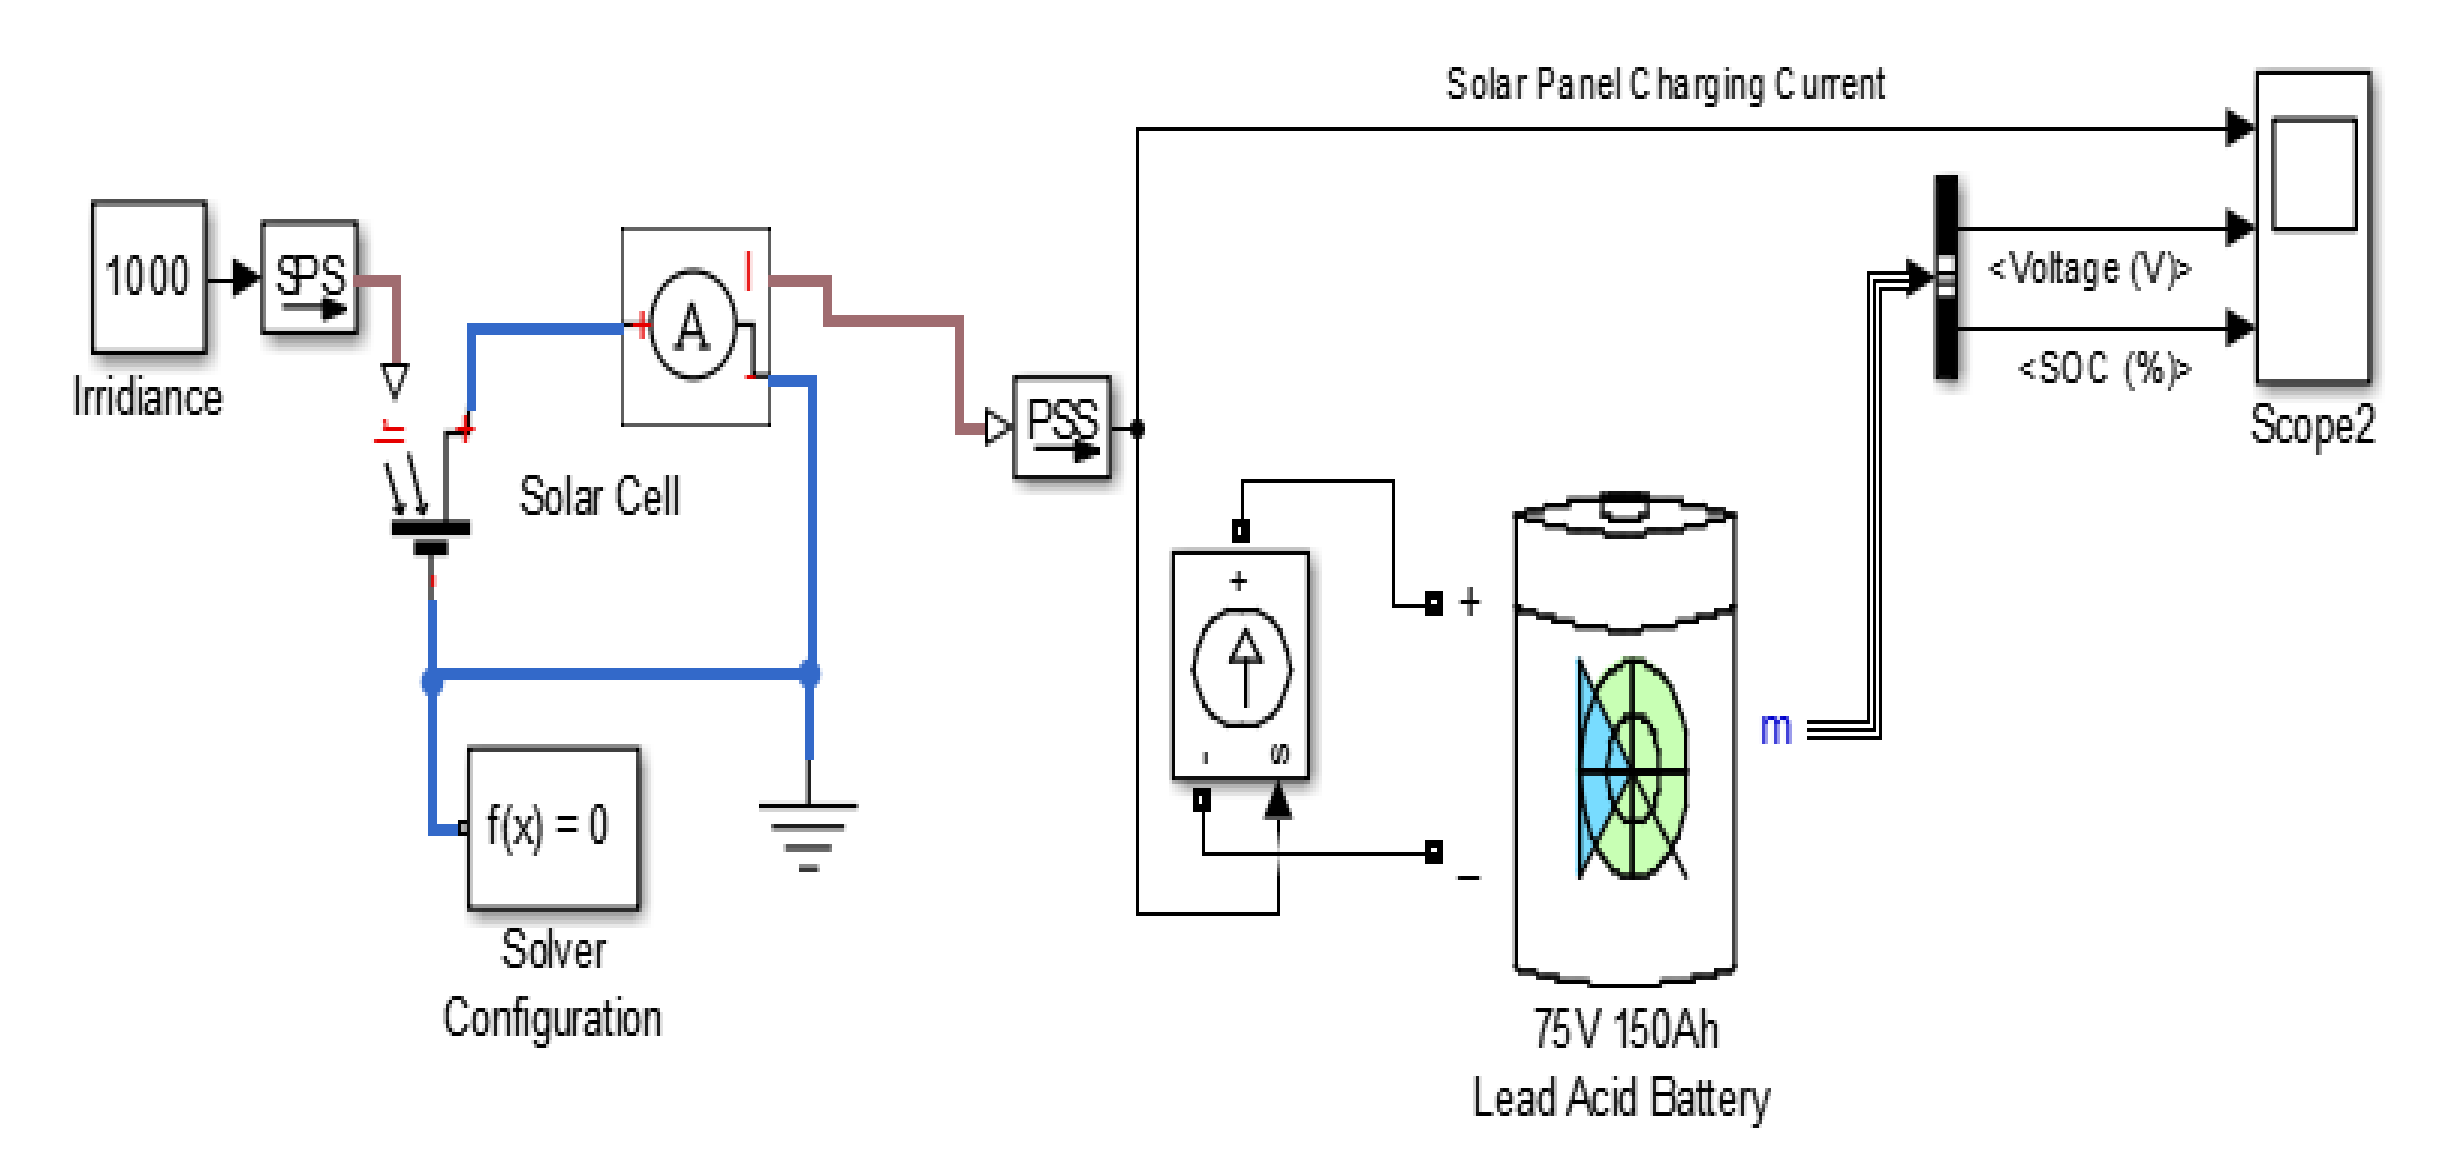
3.7. Solar PV Energy

Solar PV on the top of the car is designed to be used mainly when the car is parked under the sun. It will directly charge the battery. The capacity and the size of the solar which has been used for the HEV is shown in Table 9.

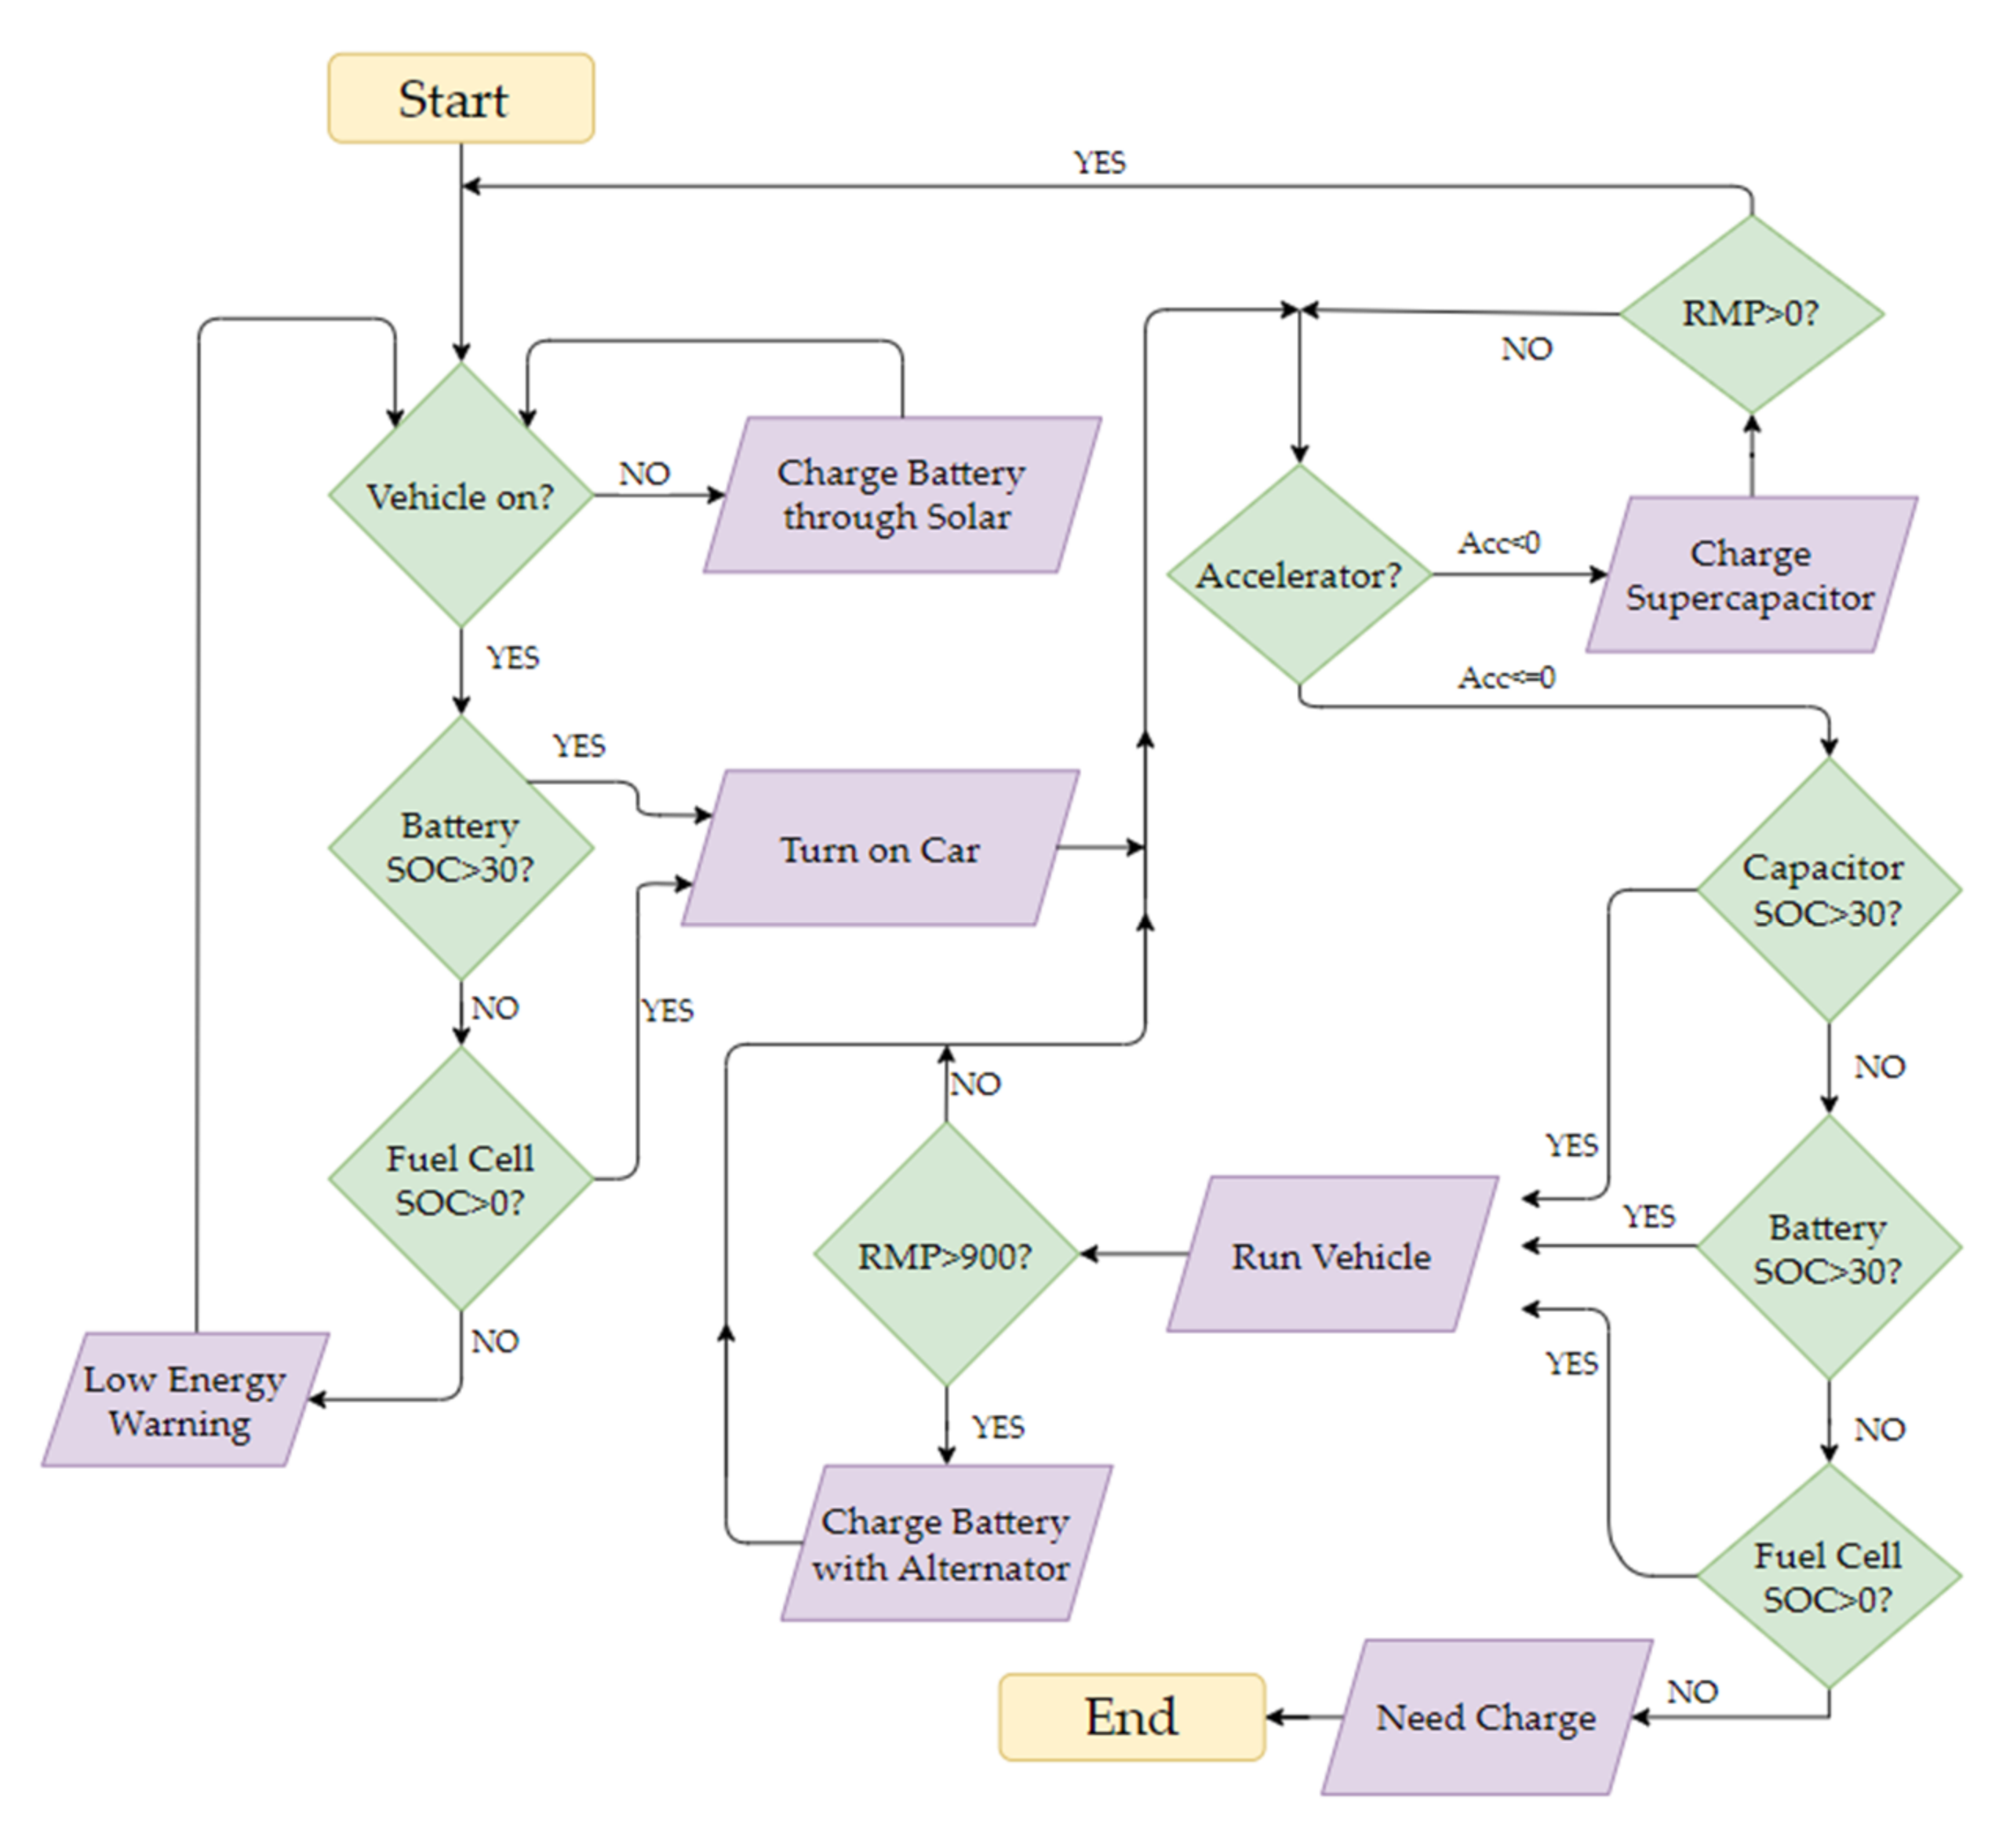
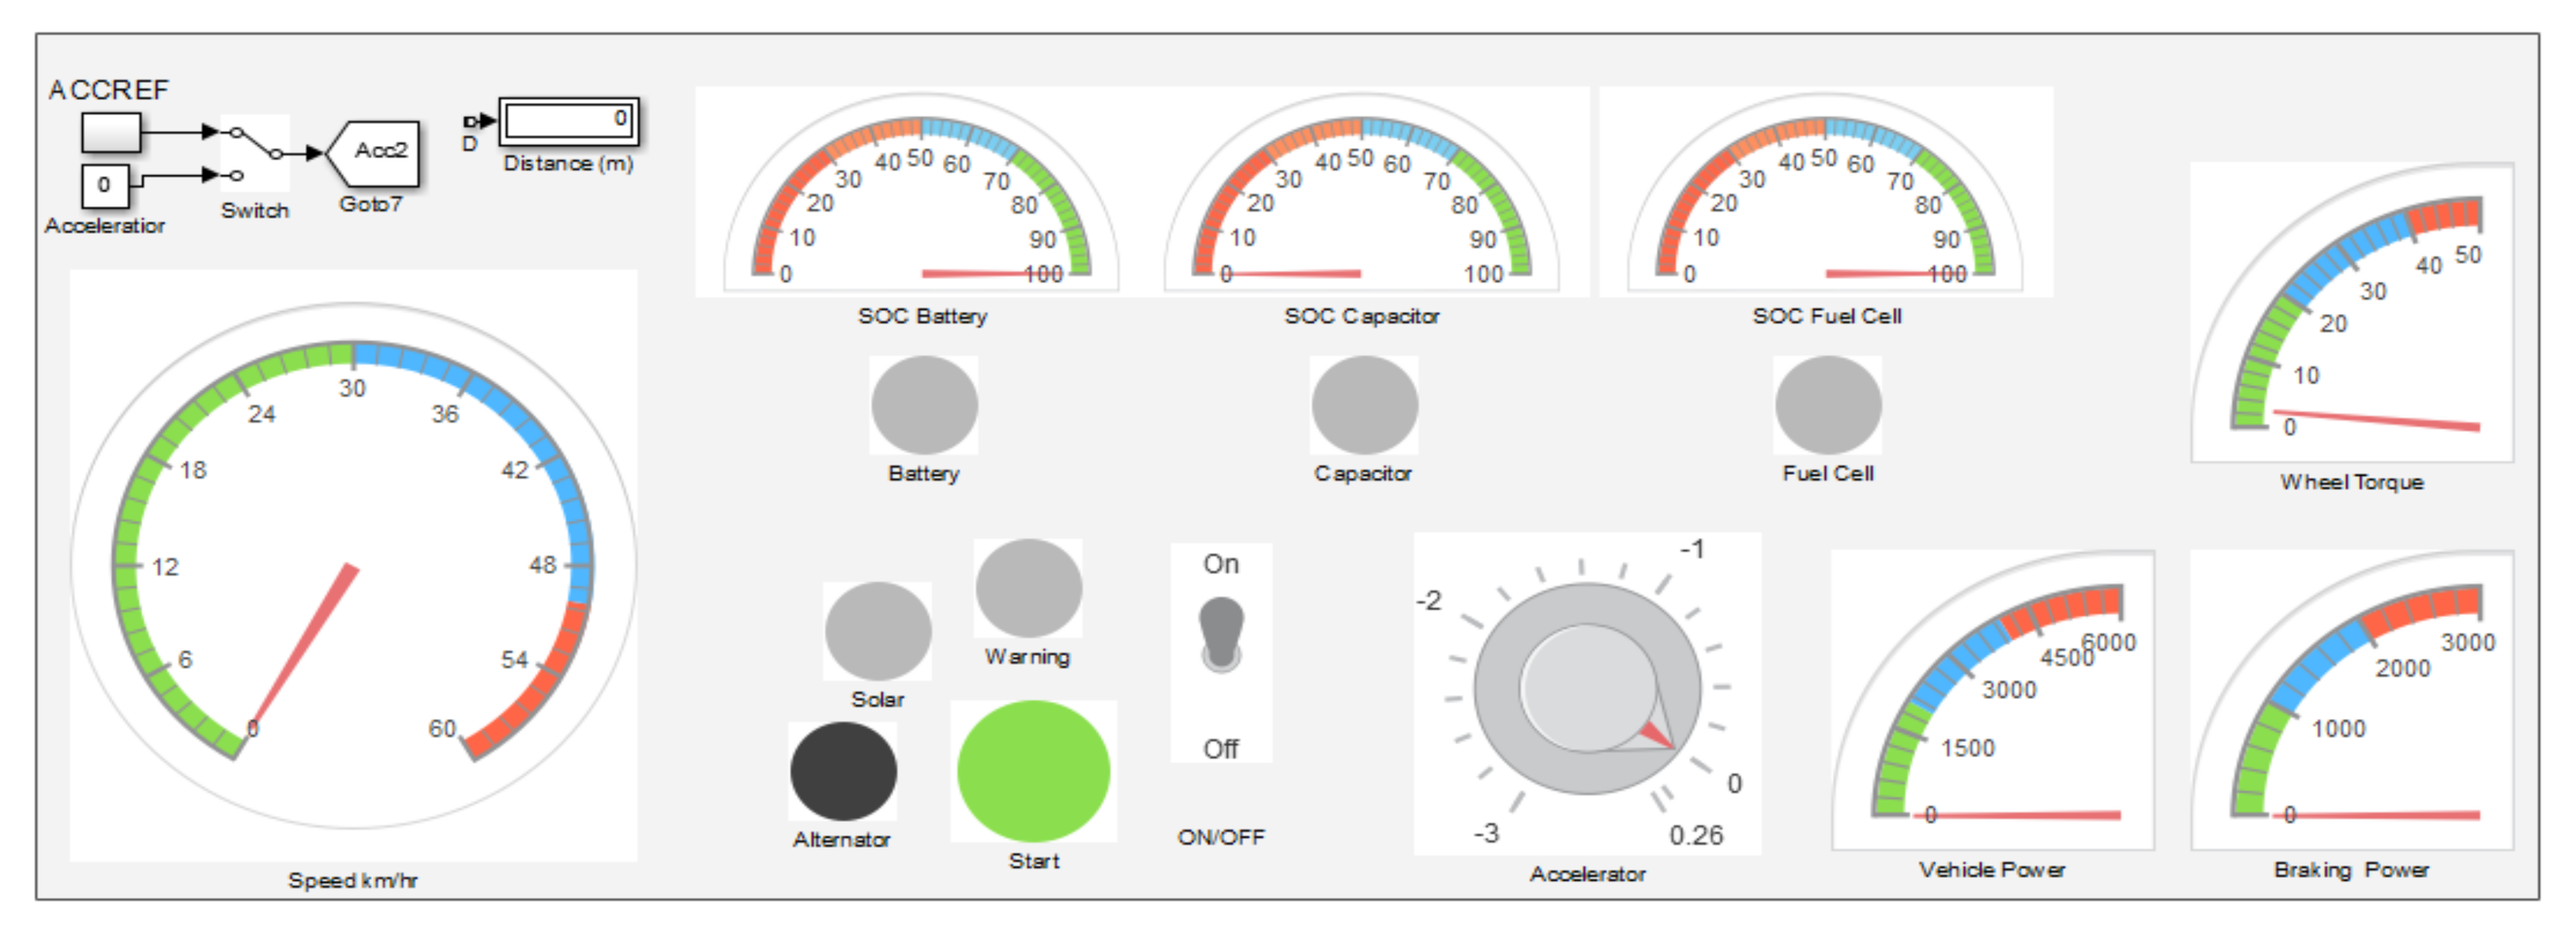
4. Rule-Based Control

The control operation of the vehicle is shown in Figure 9. The energy sources of the vehicle are managed by supervisory control that switches between the different energy sources depending on the action of the car. The solar charging of the battery is activated once the vehicle is parked and the engine is turned off. The controller records the state of charge (SOC) of both the FC and the battery when the car is turned on. The battery is used to start the vehicle except when the battery SOC is below 30%, when FC is used. The vehicle remains turned off and a low energy warning is displayed when both the battery and FC do not have the required energy. If the vehicle is on and the acceleration is a value greater than or equal to 0, the capacitor is given priority to individually power the vehicle’s acceleration. Once the vehicle is running, the controller checks when the RPM reaches 900, whereby the alternator has enough charging current and can charge the battery.

5. Discussion

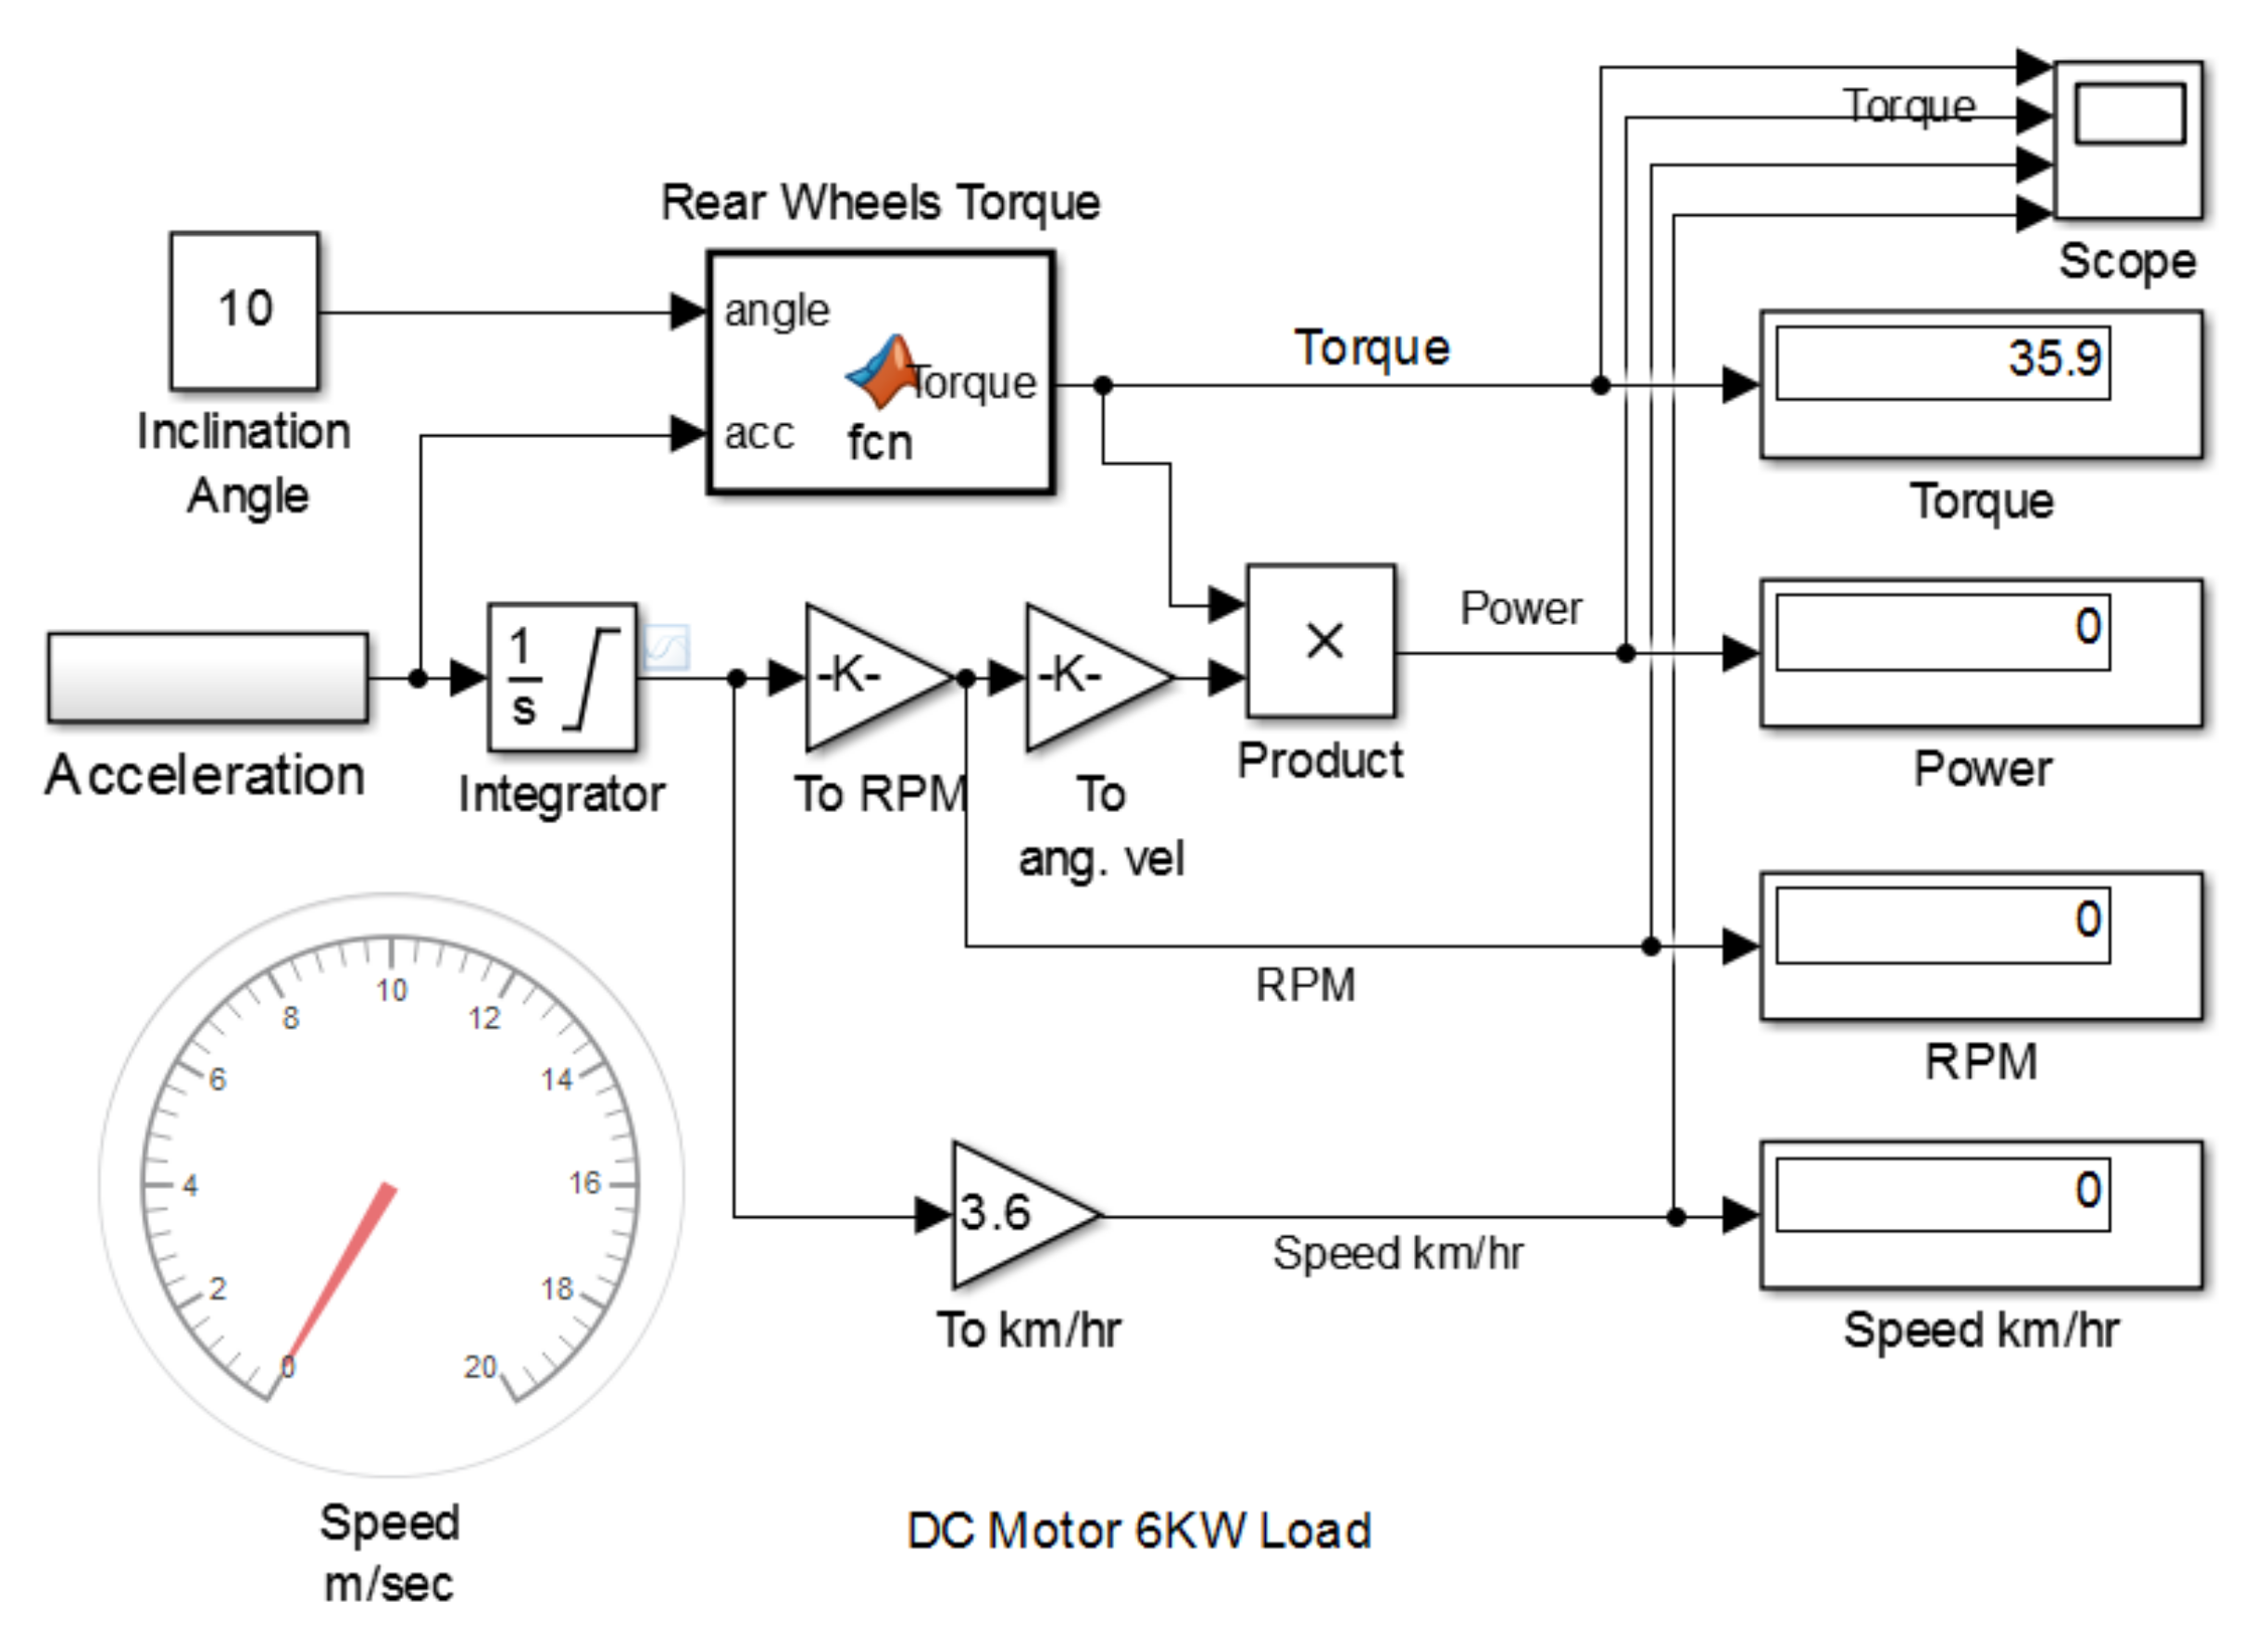
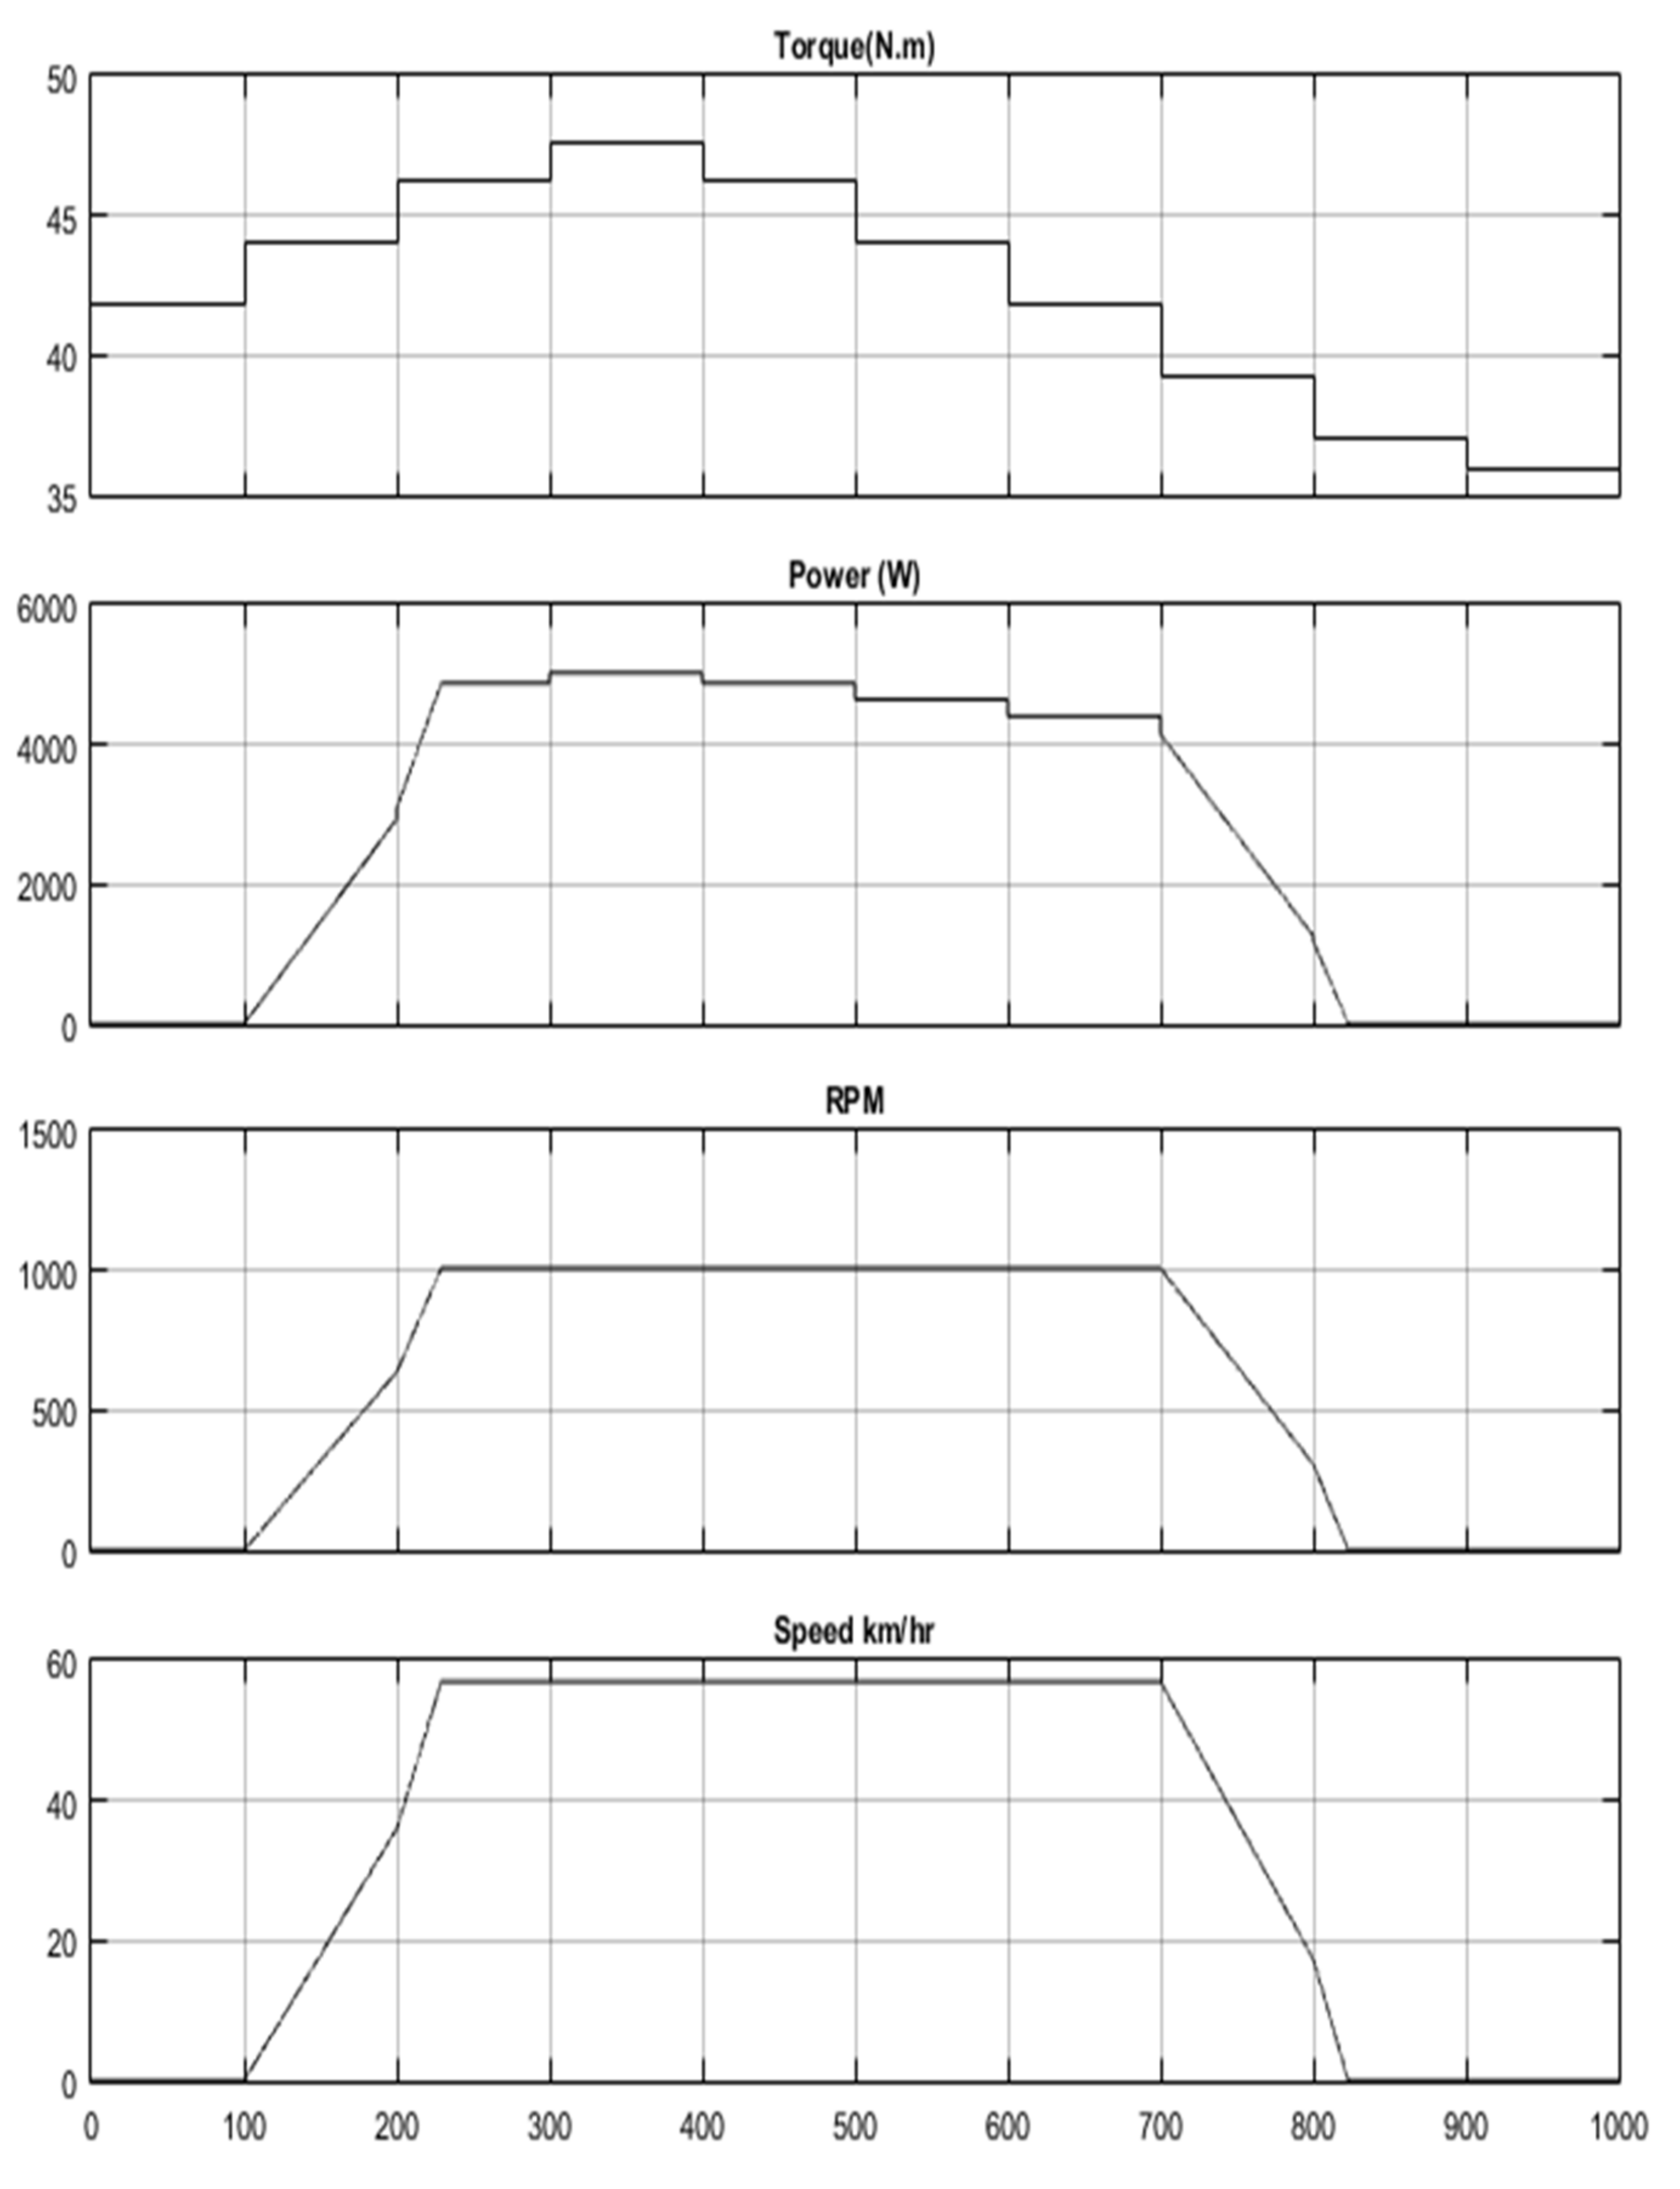
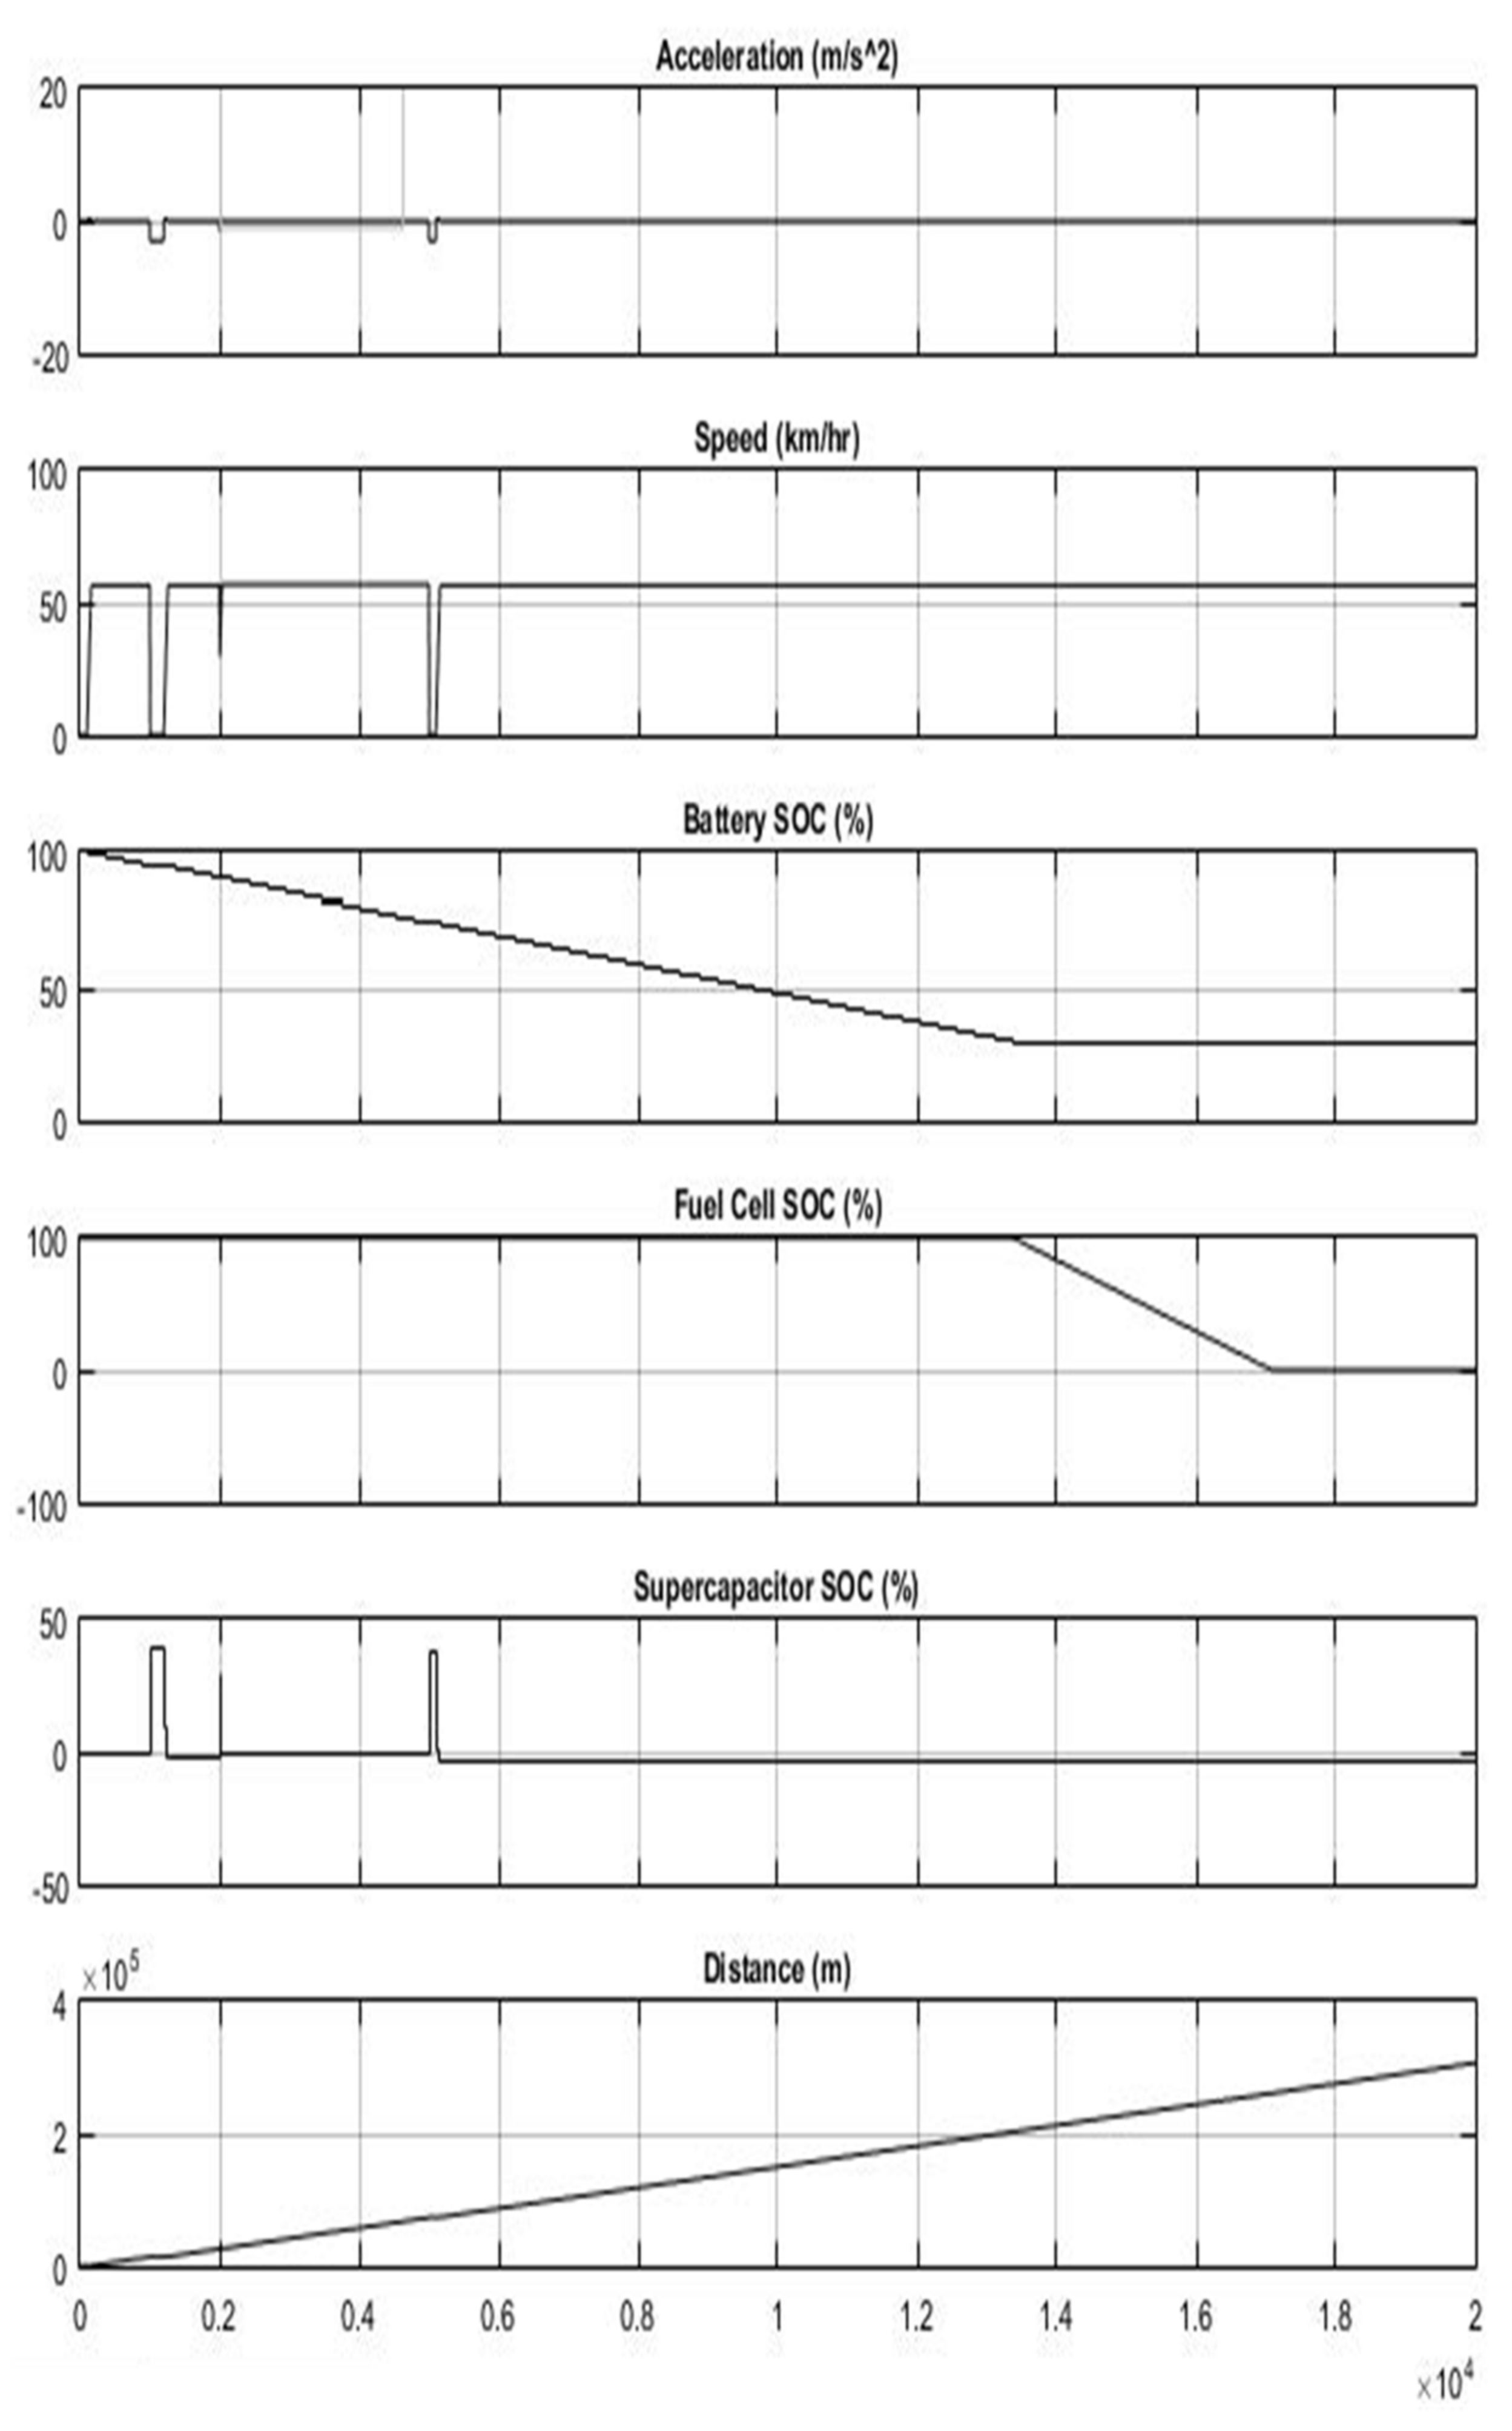
5.1. Vehicle Load Model

The proposed model was simulated using Simulink® as in Figure 10. The power, rear-wheel torque, vehicle speed, and RPM are the most important parameters and thus, those parameters are shown in Figure 11. The inclination angle (α) is set at 10 degrees representing the vehicle going up the hill that is inclined relative to the horizontal.
When the vehicle is at rest (t = 0 s), both the power and the speed are zero. The vehicle accelerates for the initial period until t = 220 s and, as a result, the torque and required power for both wheels are also increased. The acceleration reached 0.1 m/s2 at t = 100 s and eventually speed, power, and torque increases. Maximum acceleration of 0.26 m/s2 is observed at t = 220 s and the speed reaches a maximum of 56.55 km/hr. The speed remains the same until t = 700 s, however, the car starts to decelerate after t = 400 s, and, thus, the torque and power are also reduced during that period. The speed remains the same as the acceleration is still positive (though decreasing). At t = 700, the brake is executed and thus the speed decreases, which ultimately results in a decrease in power and torque. The vehicle stopped at t = 800 s.

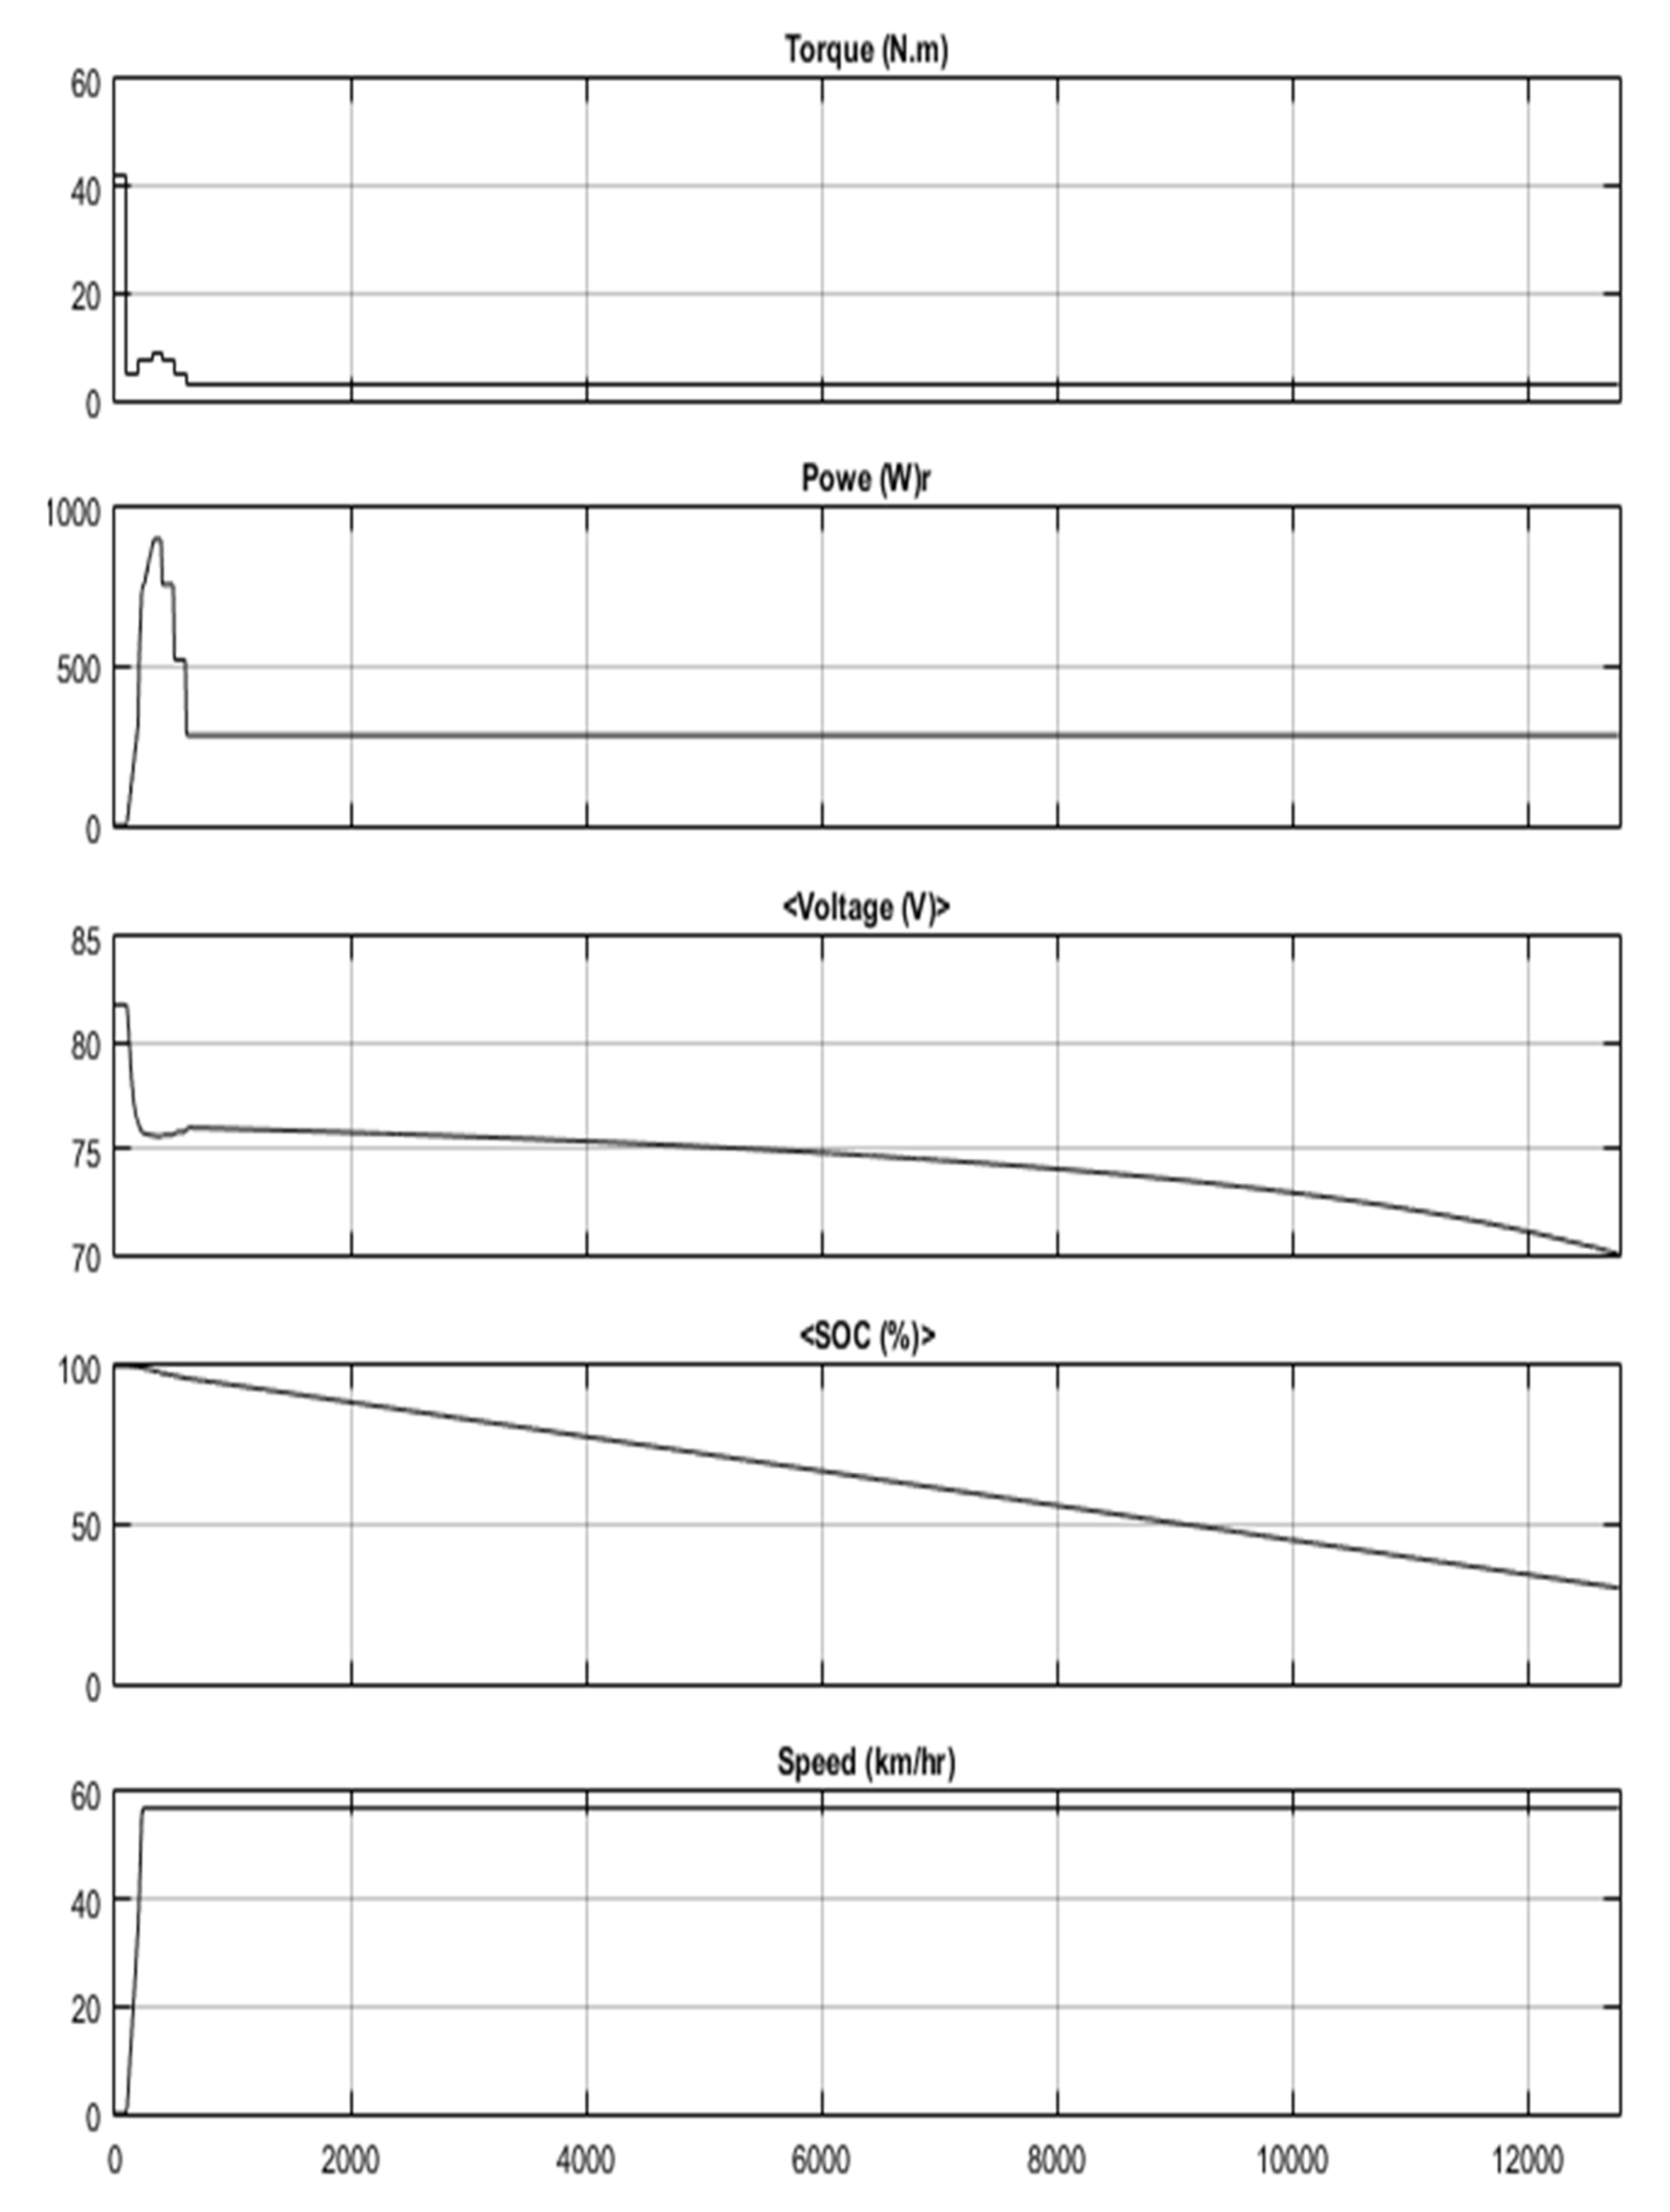
5.2. Battery Powered Load

A battery bank then powers the load described above in simulations and the results are shown in Figure 12. A 150 Ah and 72 V lead-acid battery was used for lower than 30% SOC in this simulation The SOC of the battery is decreased linearly over time. This is because the battery provides power to the wheel during that time. The battery is cut off at t = 12,780 s when the SOC reached below 30%. It is evident from the simulation result that the car can travel 201 km in 3.55 h (12,780 s) only by the battery source.

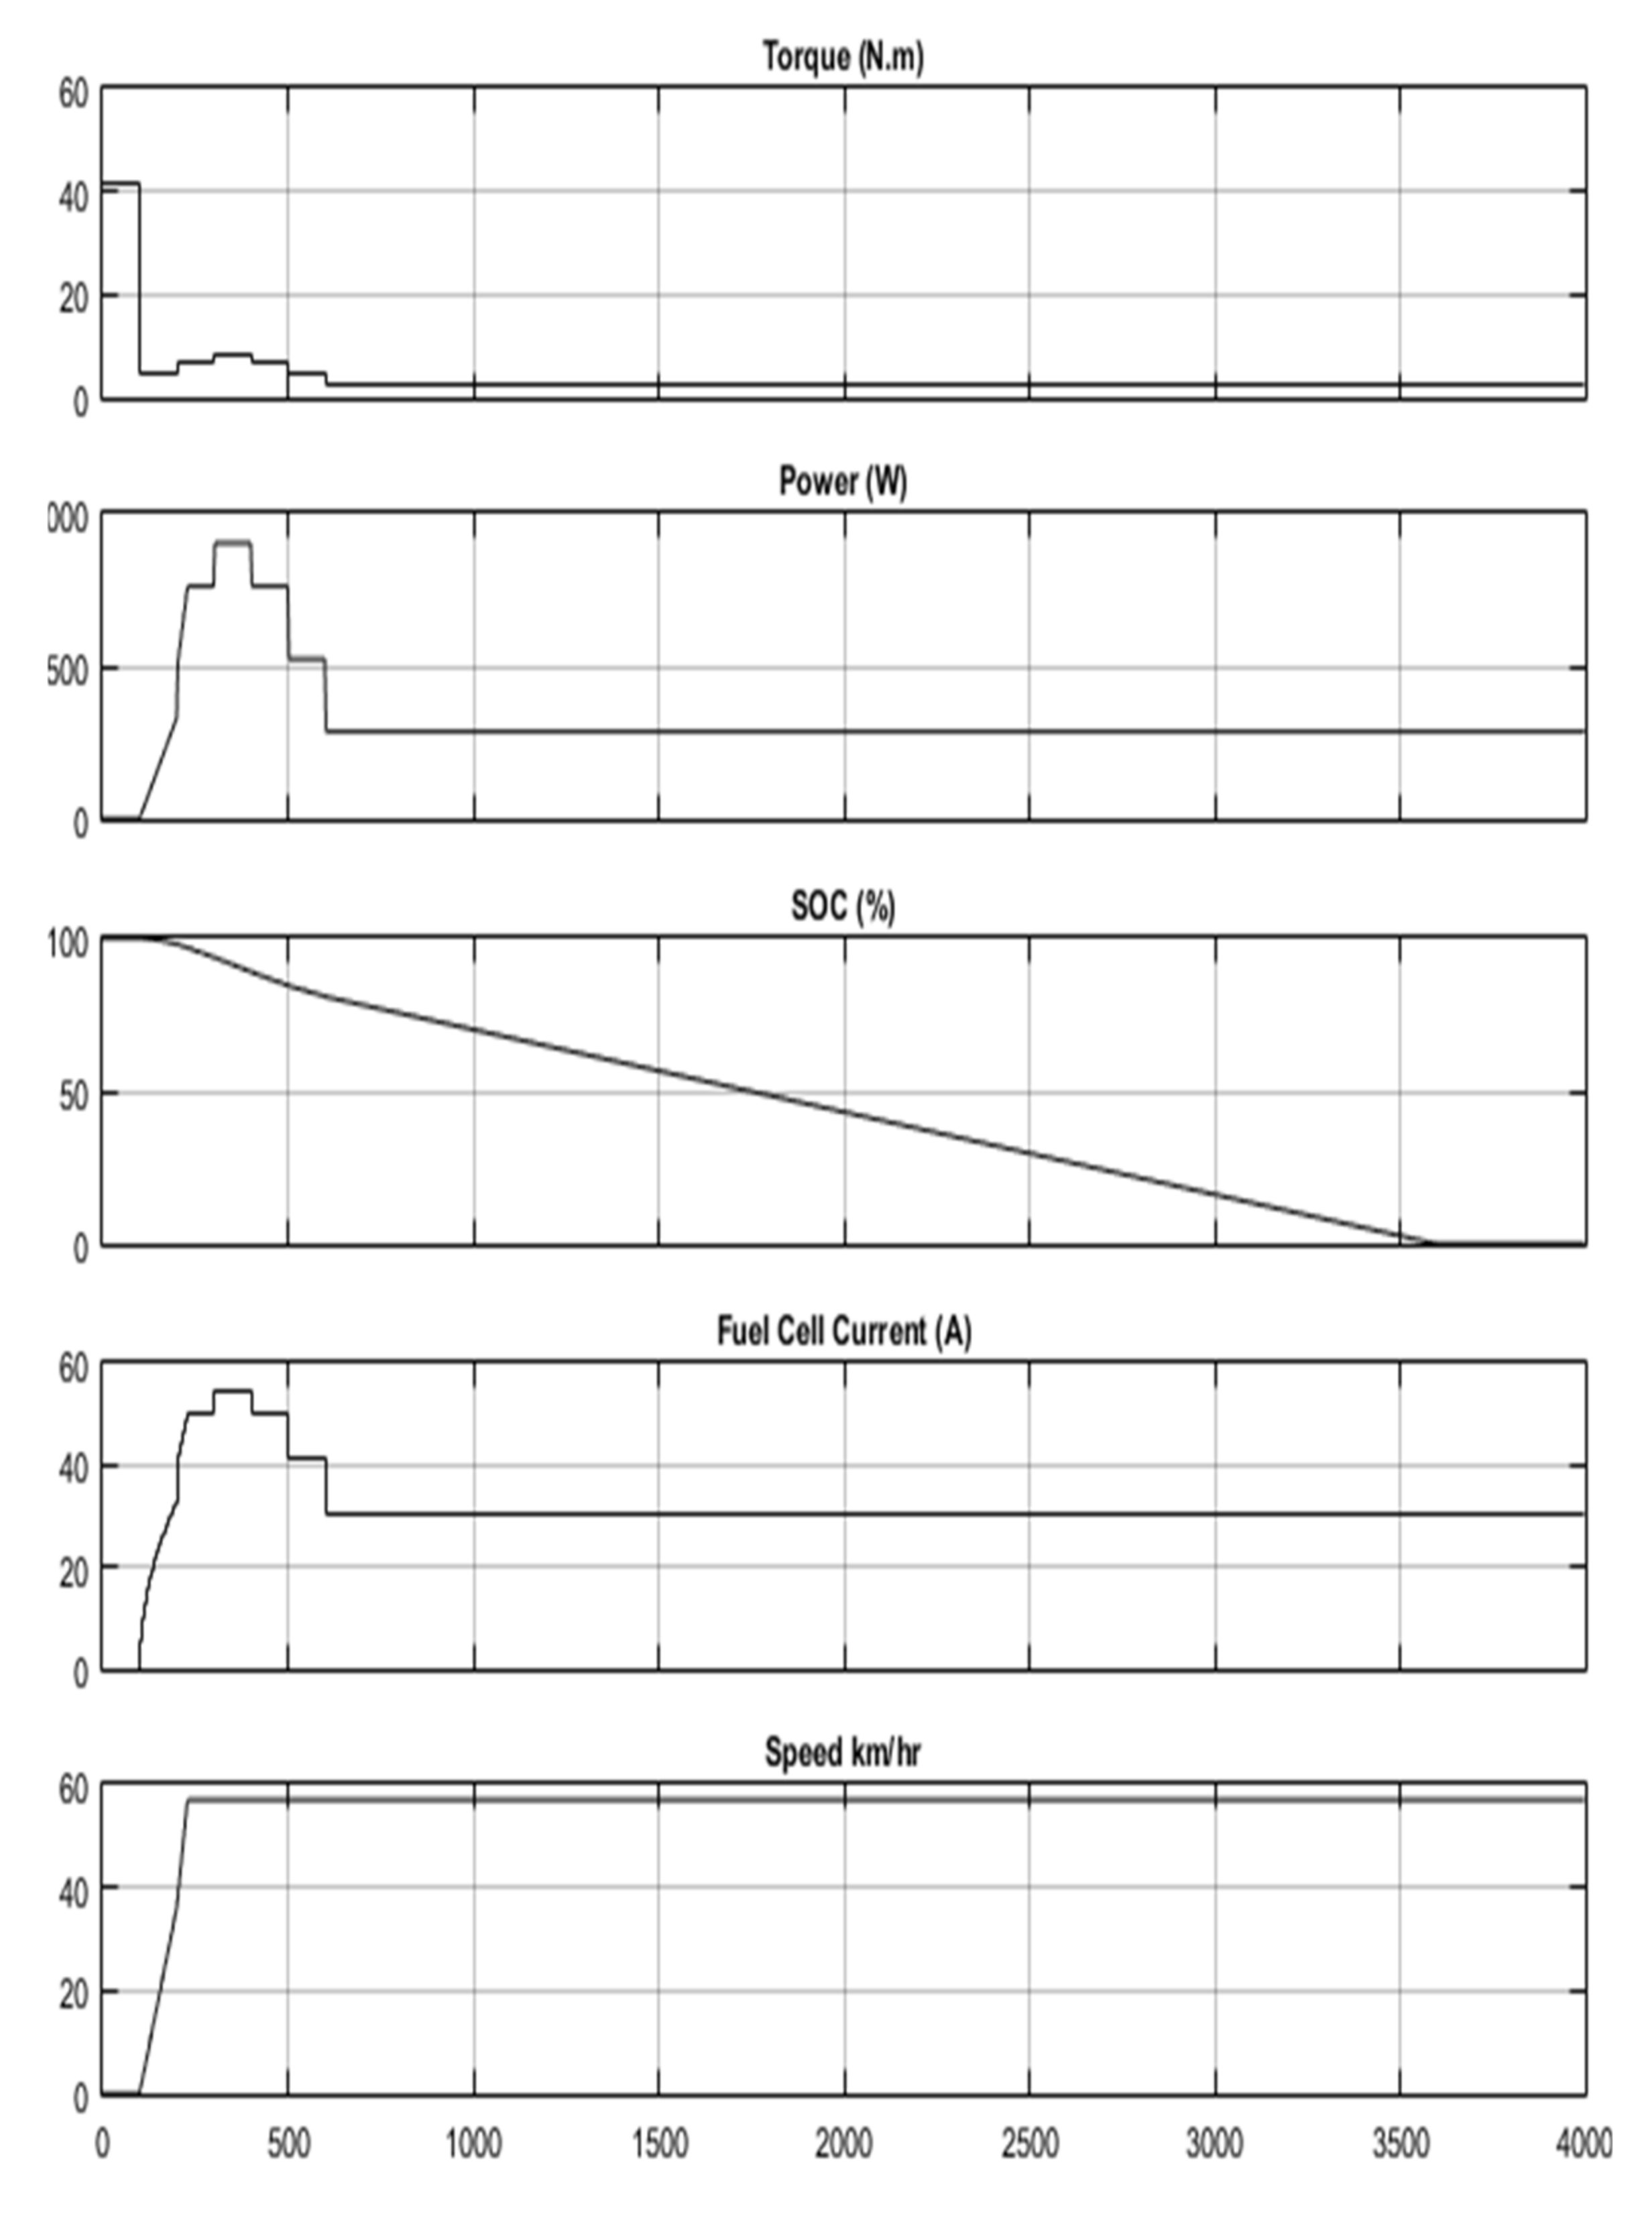
5.3. FC Powered Load

The source here in this simulation is a 72 V, 6 kW FC that requires hydrogen. Figure 13 shows the simulation block containing the motor as a load and the FC with a DC–DC converter as a source, where simulation results are shown in Figure 14. The vehicle is subjected to the same acceleration and inclination values as the battery and load simulation done in earlier sections.
It is clearly visible from the simulation results that the vehicle can be driven for 3500 s at a speed of 56.55 km/hr (55 km) when the power is sourced only from FC.

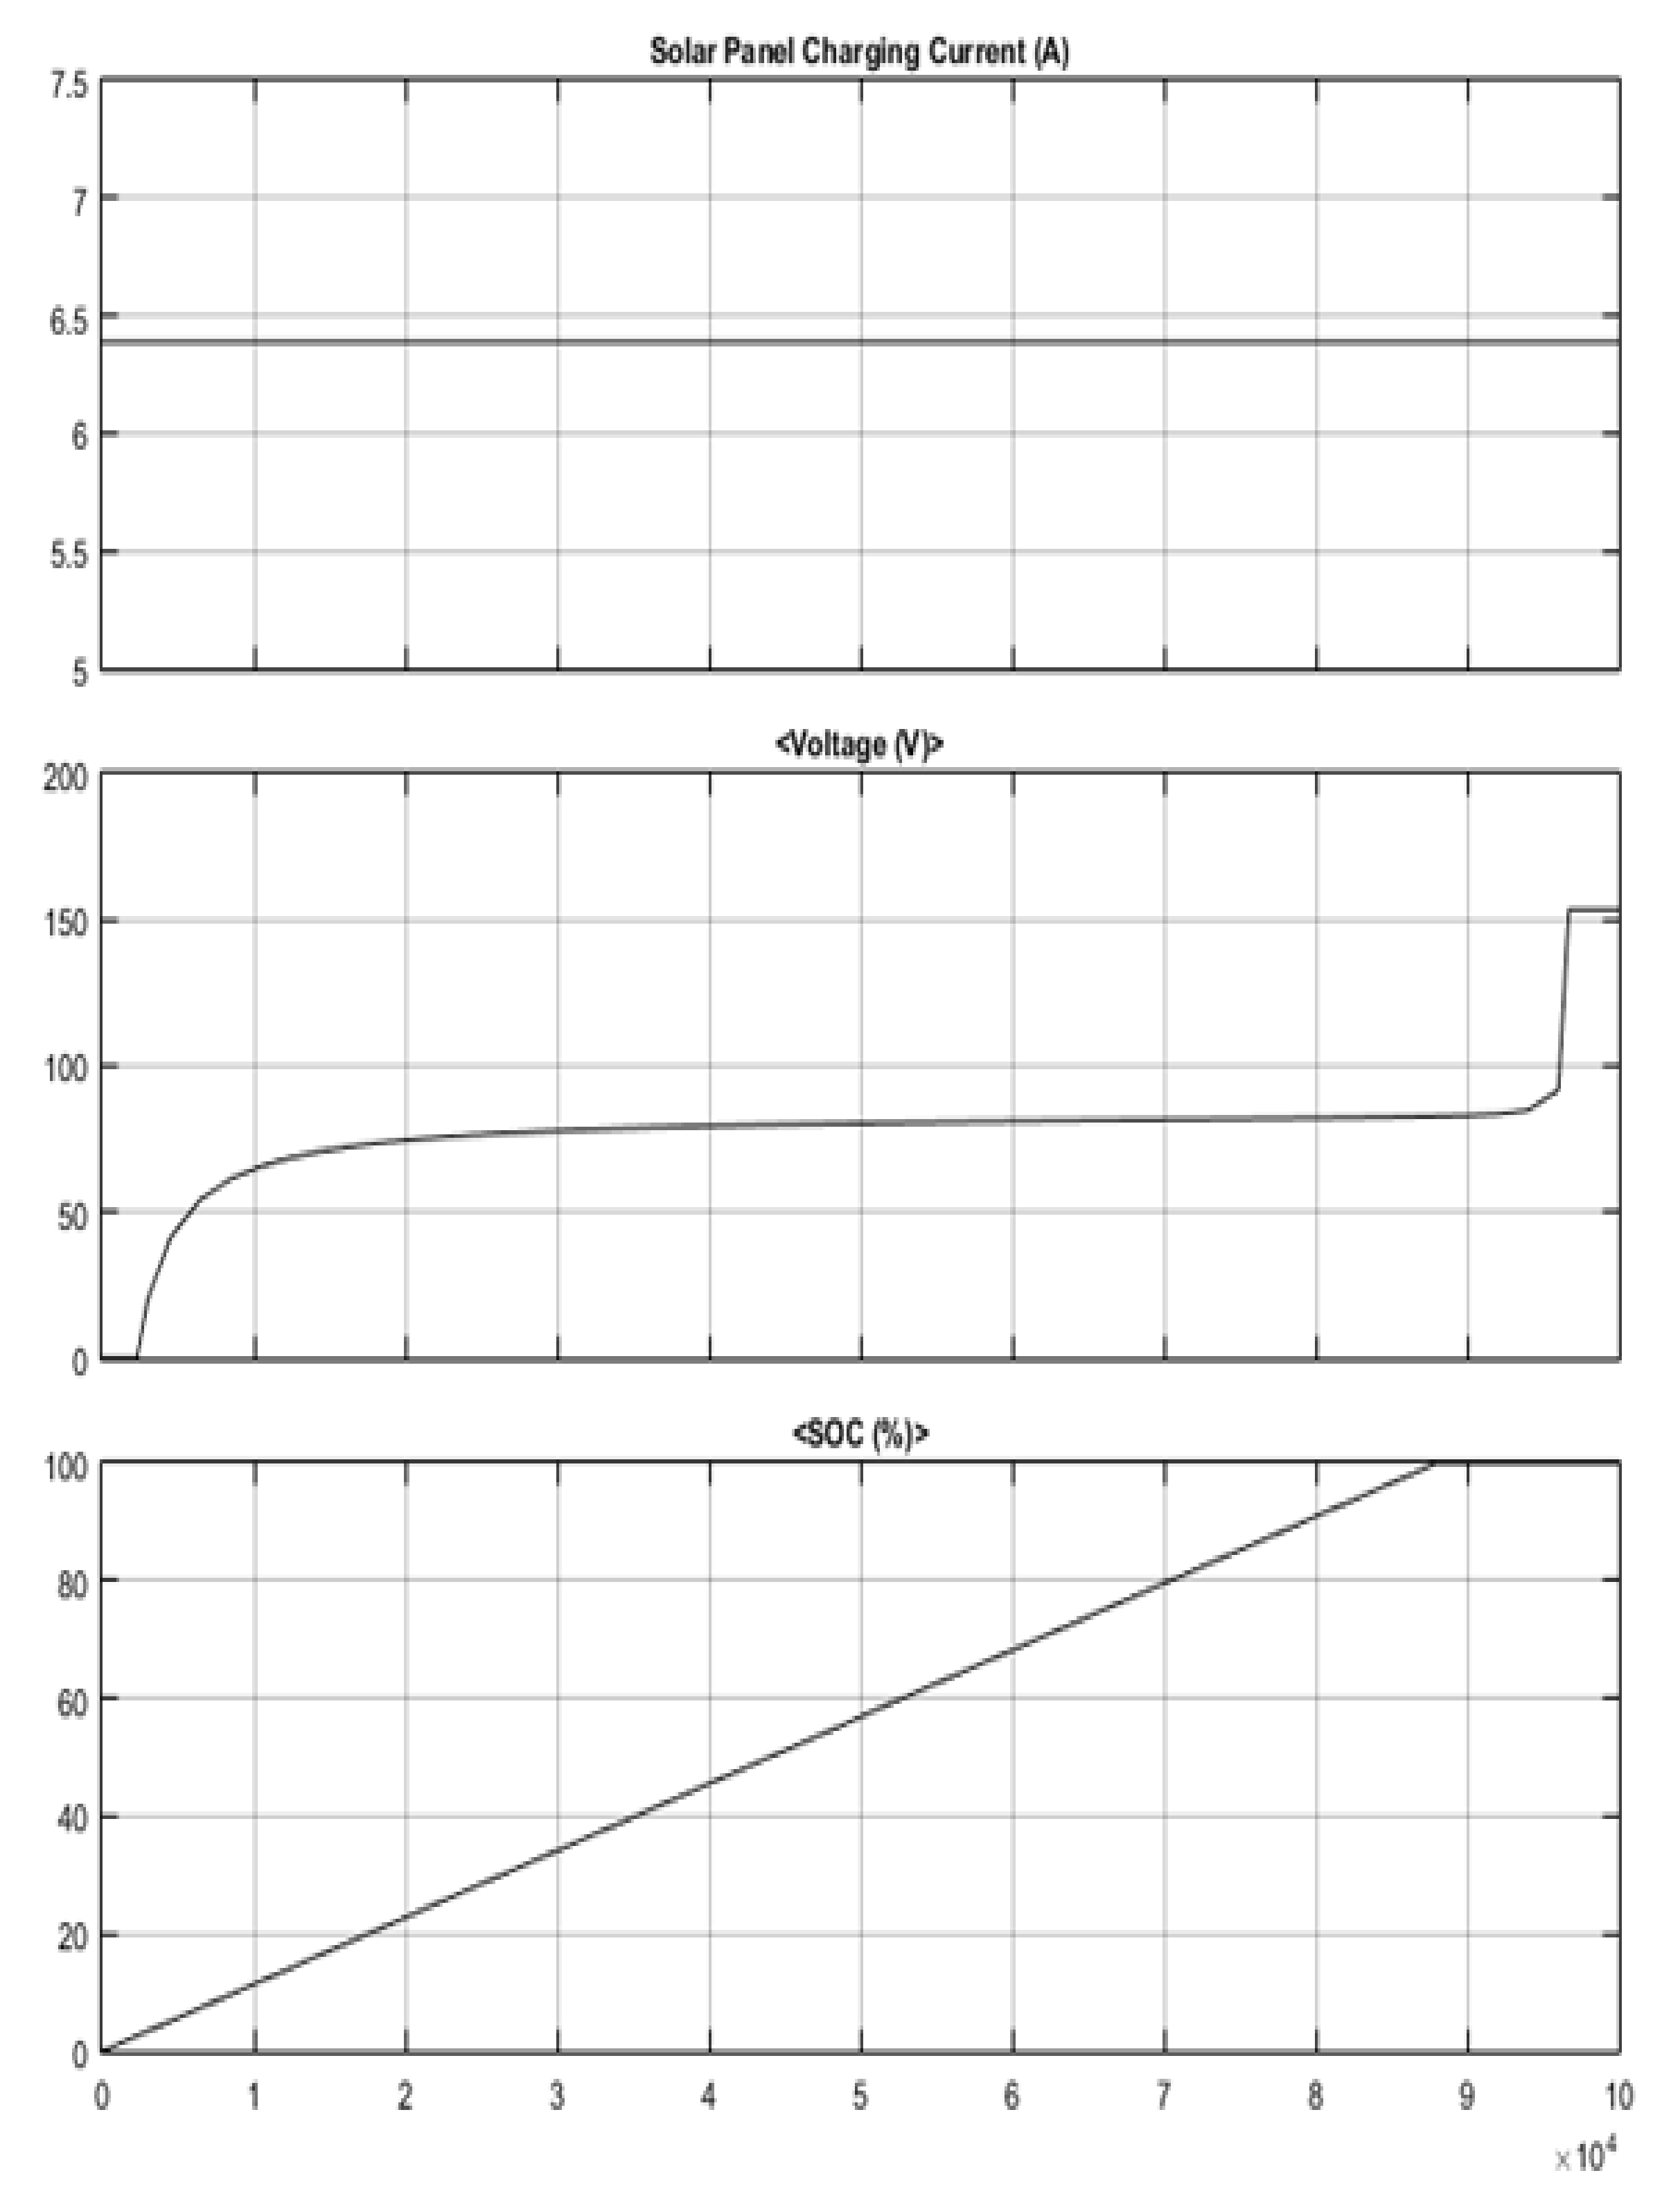
5.4. Solar Panel Charging Battery

A solar panel charges the 150 Ah and 72 V lead-acid battery. One hundred fifteen solar cells are connected in series to make the solar array and the open-circuit voltage was 0.63 V per cell. The simulation block is given below in Figure 15, consisting of the battery bank, a constant irradiance of 1000 W/m2, and the solar cell series configuration described above. The simulation results are shown in Figure 16.
The solar array produced a current of 6.4 A when the irradiation level was kept at a constant level of 1000 W/m2. This current is directly fed into the battery. The battery is initially set to empty i.e., 0% state of charge. With the current specification of the solar panel, it takes theoretically 88,000 s to fully energize the battery to 100% SOC; this equates to the solar panel charging the empty battery to full charge in 24.4 h. Furthermore, the vehicle with a fully charged battery can travel 200.75 km in 3.55 h until the battery is fully discharged. The travel distance also depends on the terrain, as higher energy will be required to climb hills while descends may require less energy.

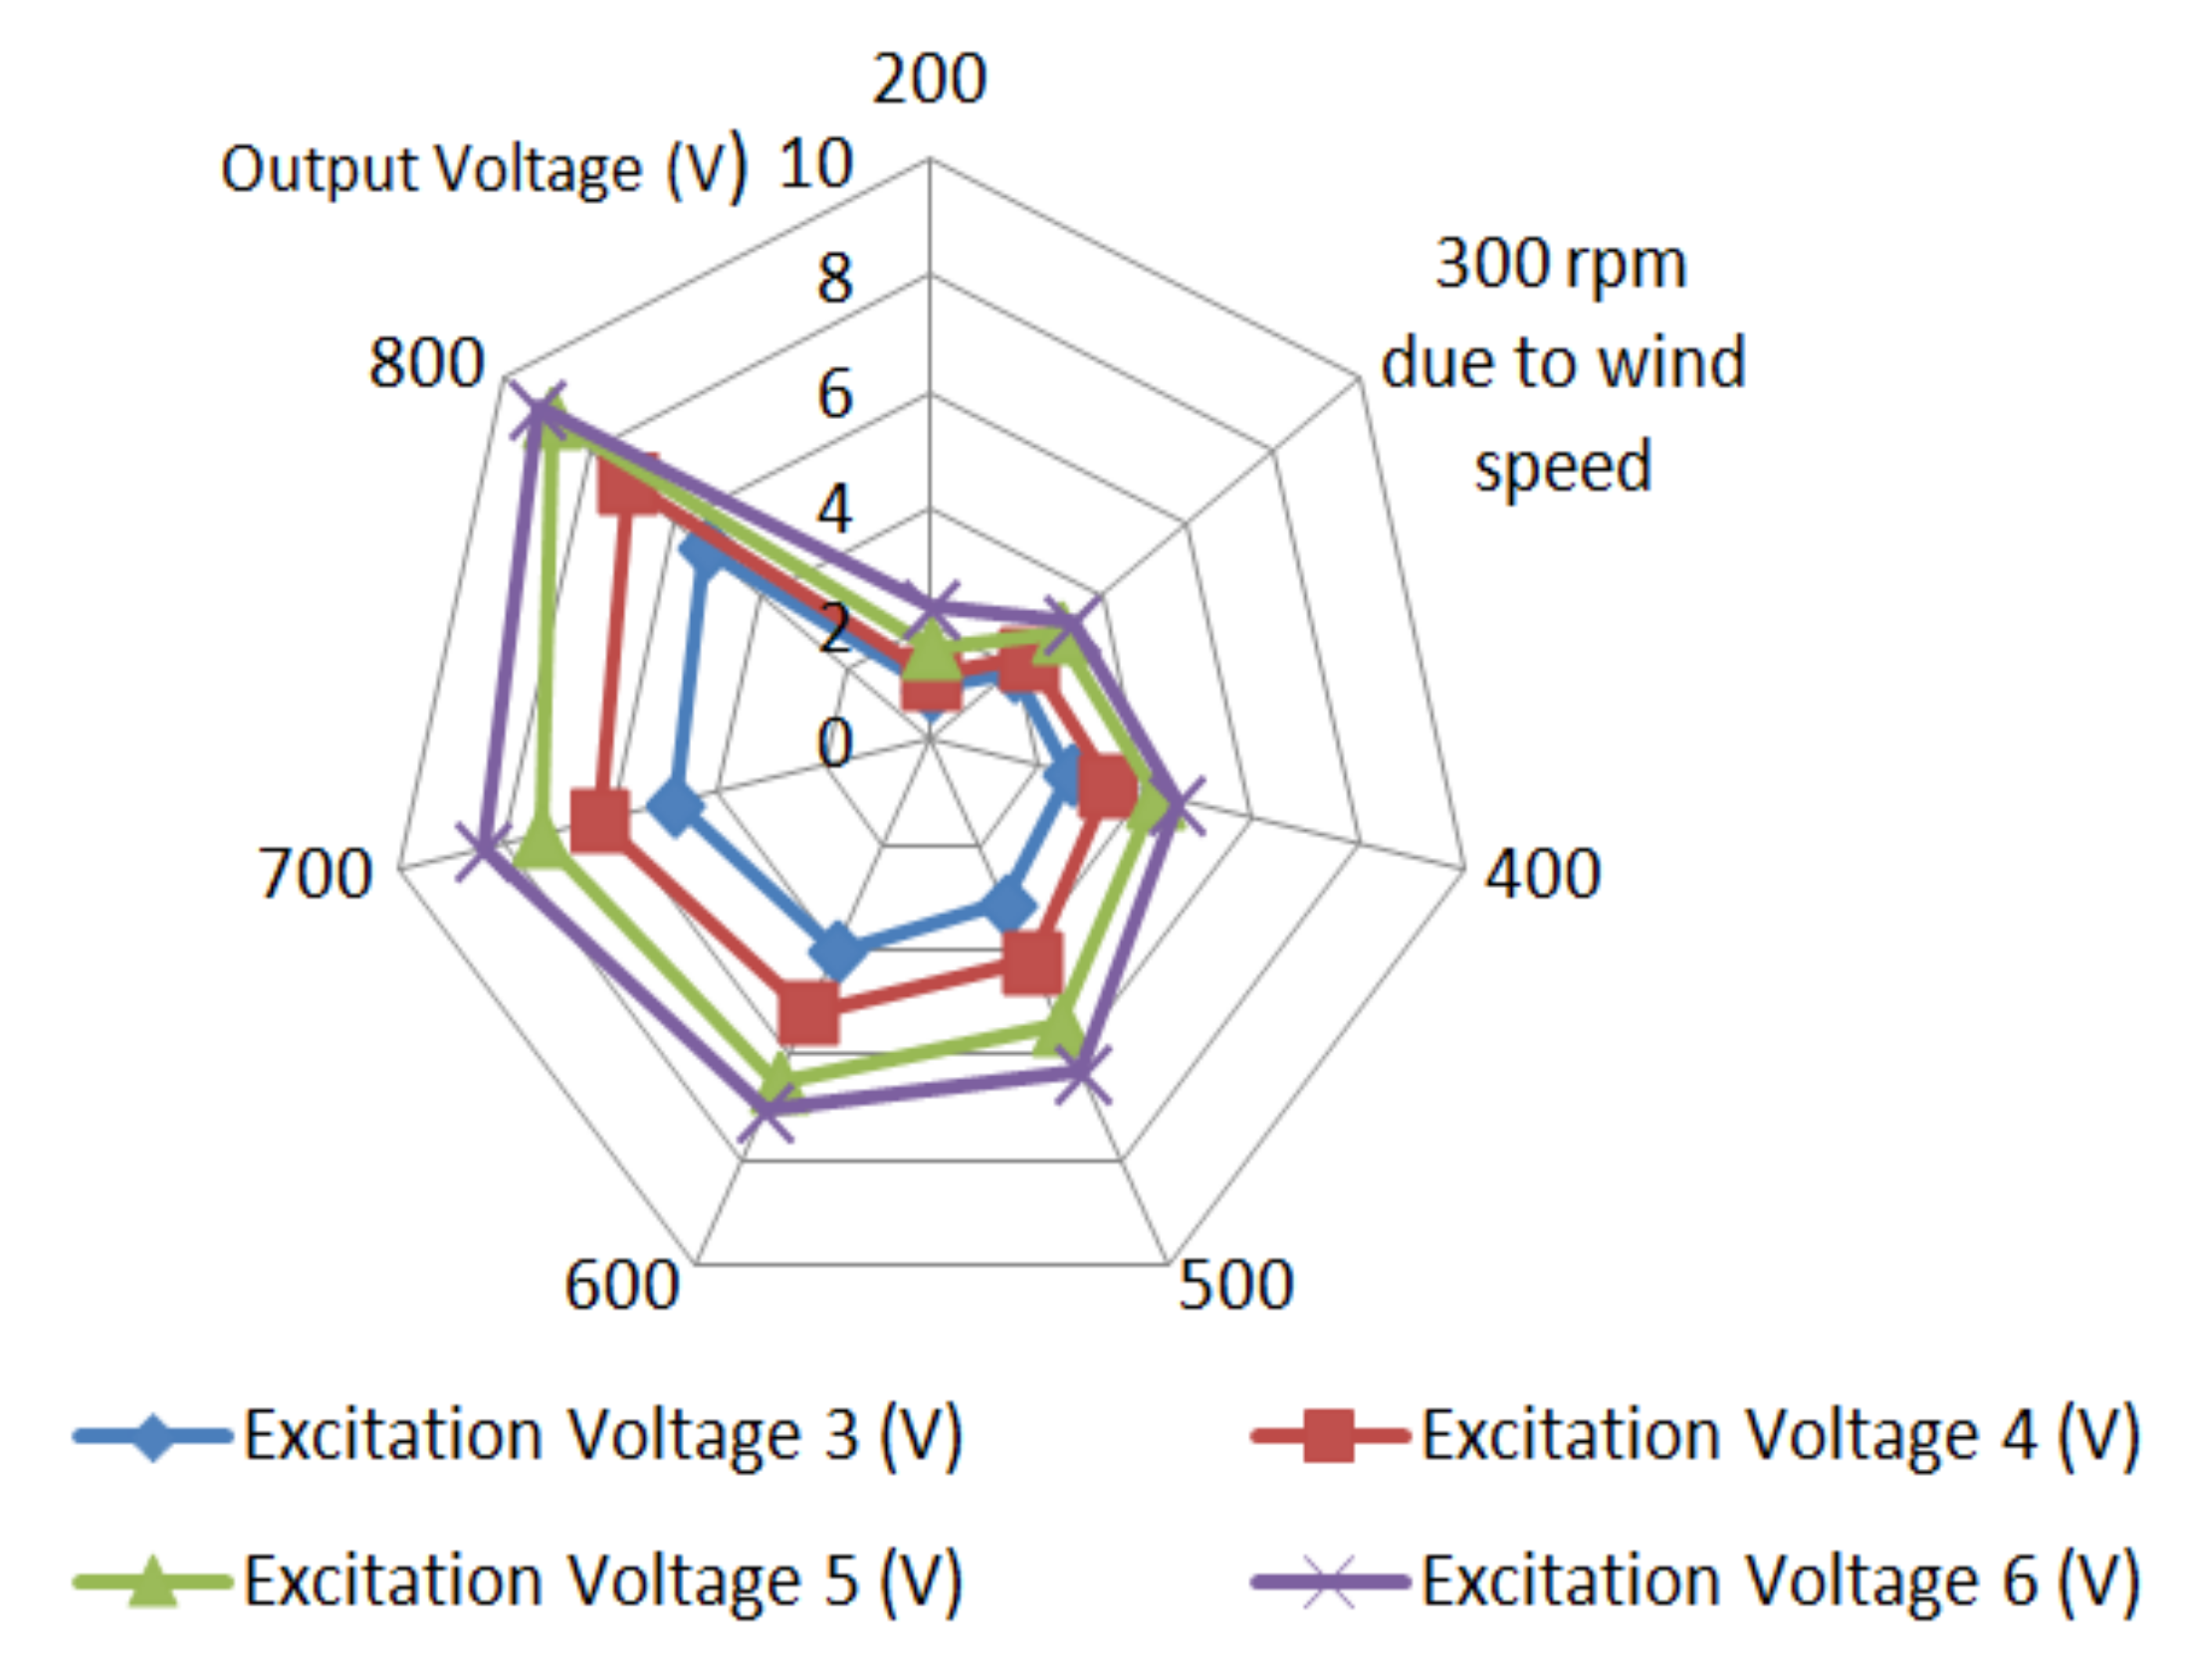
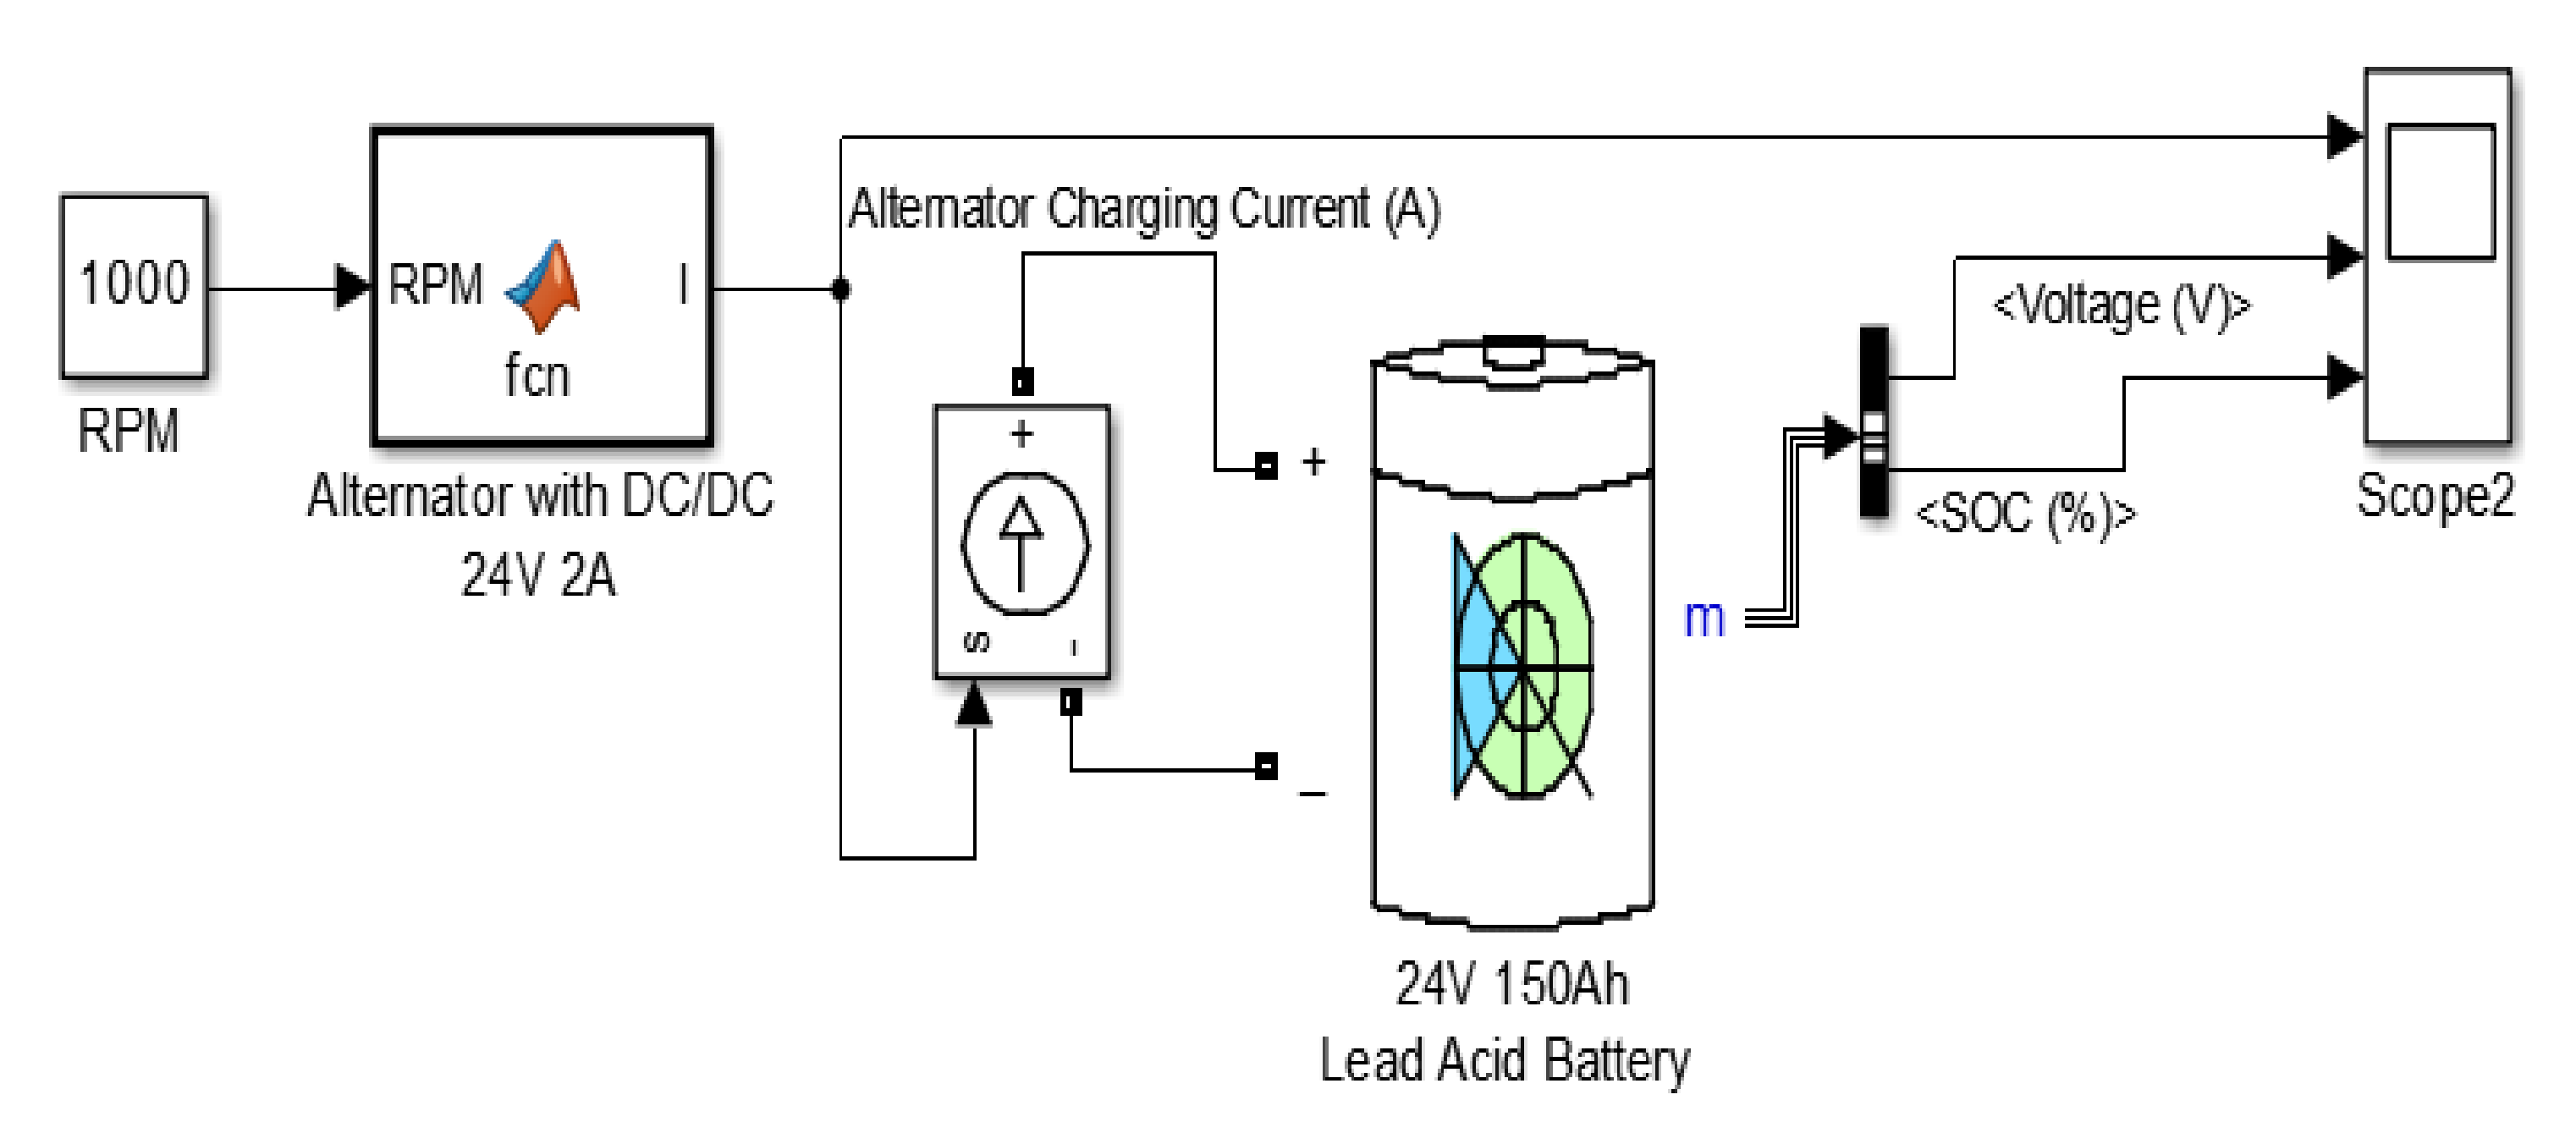
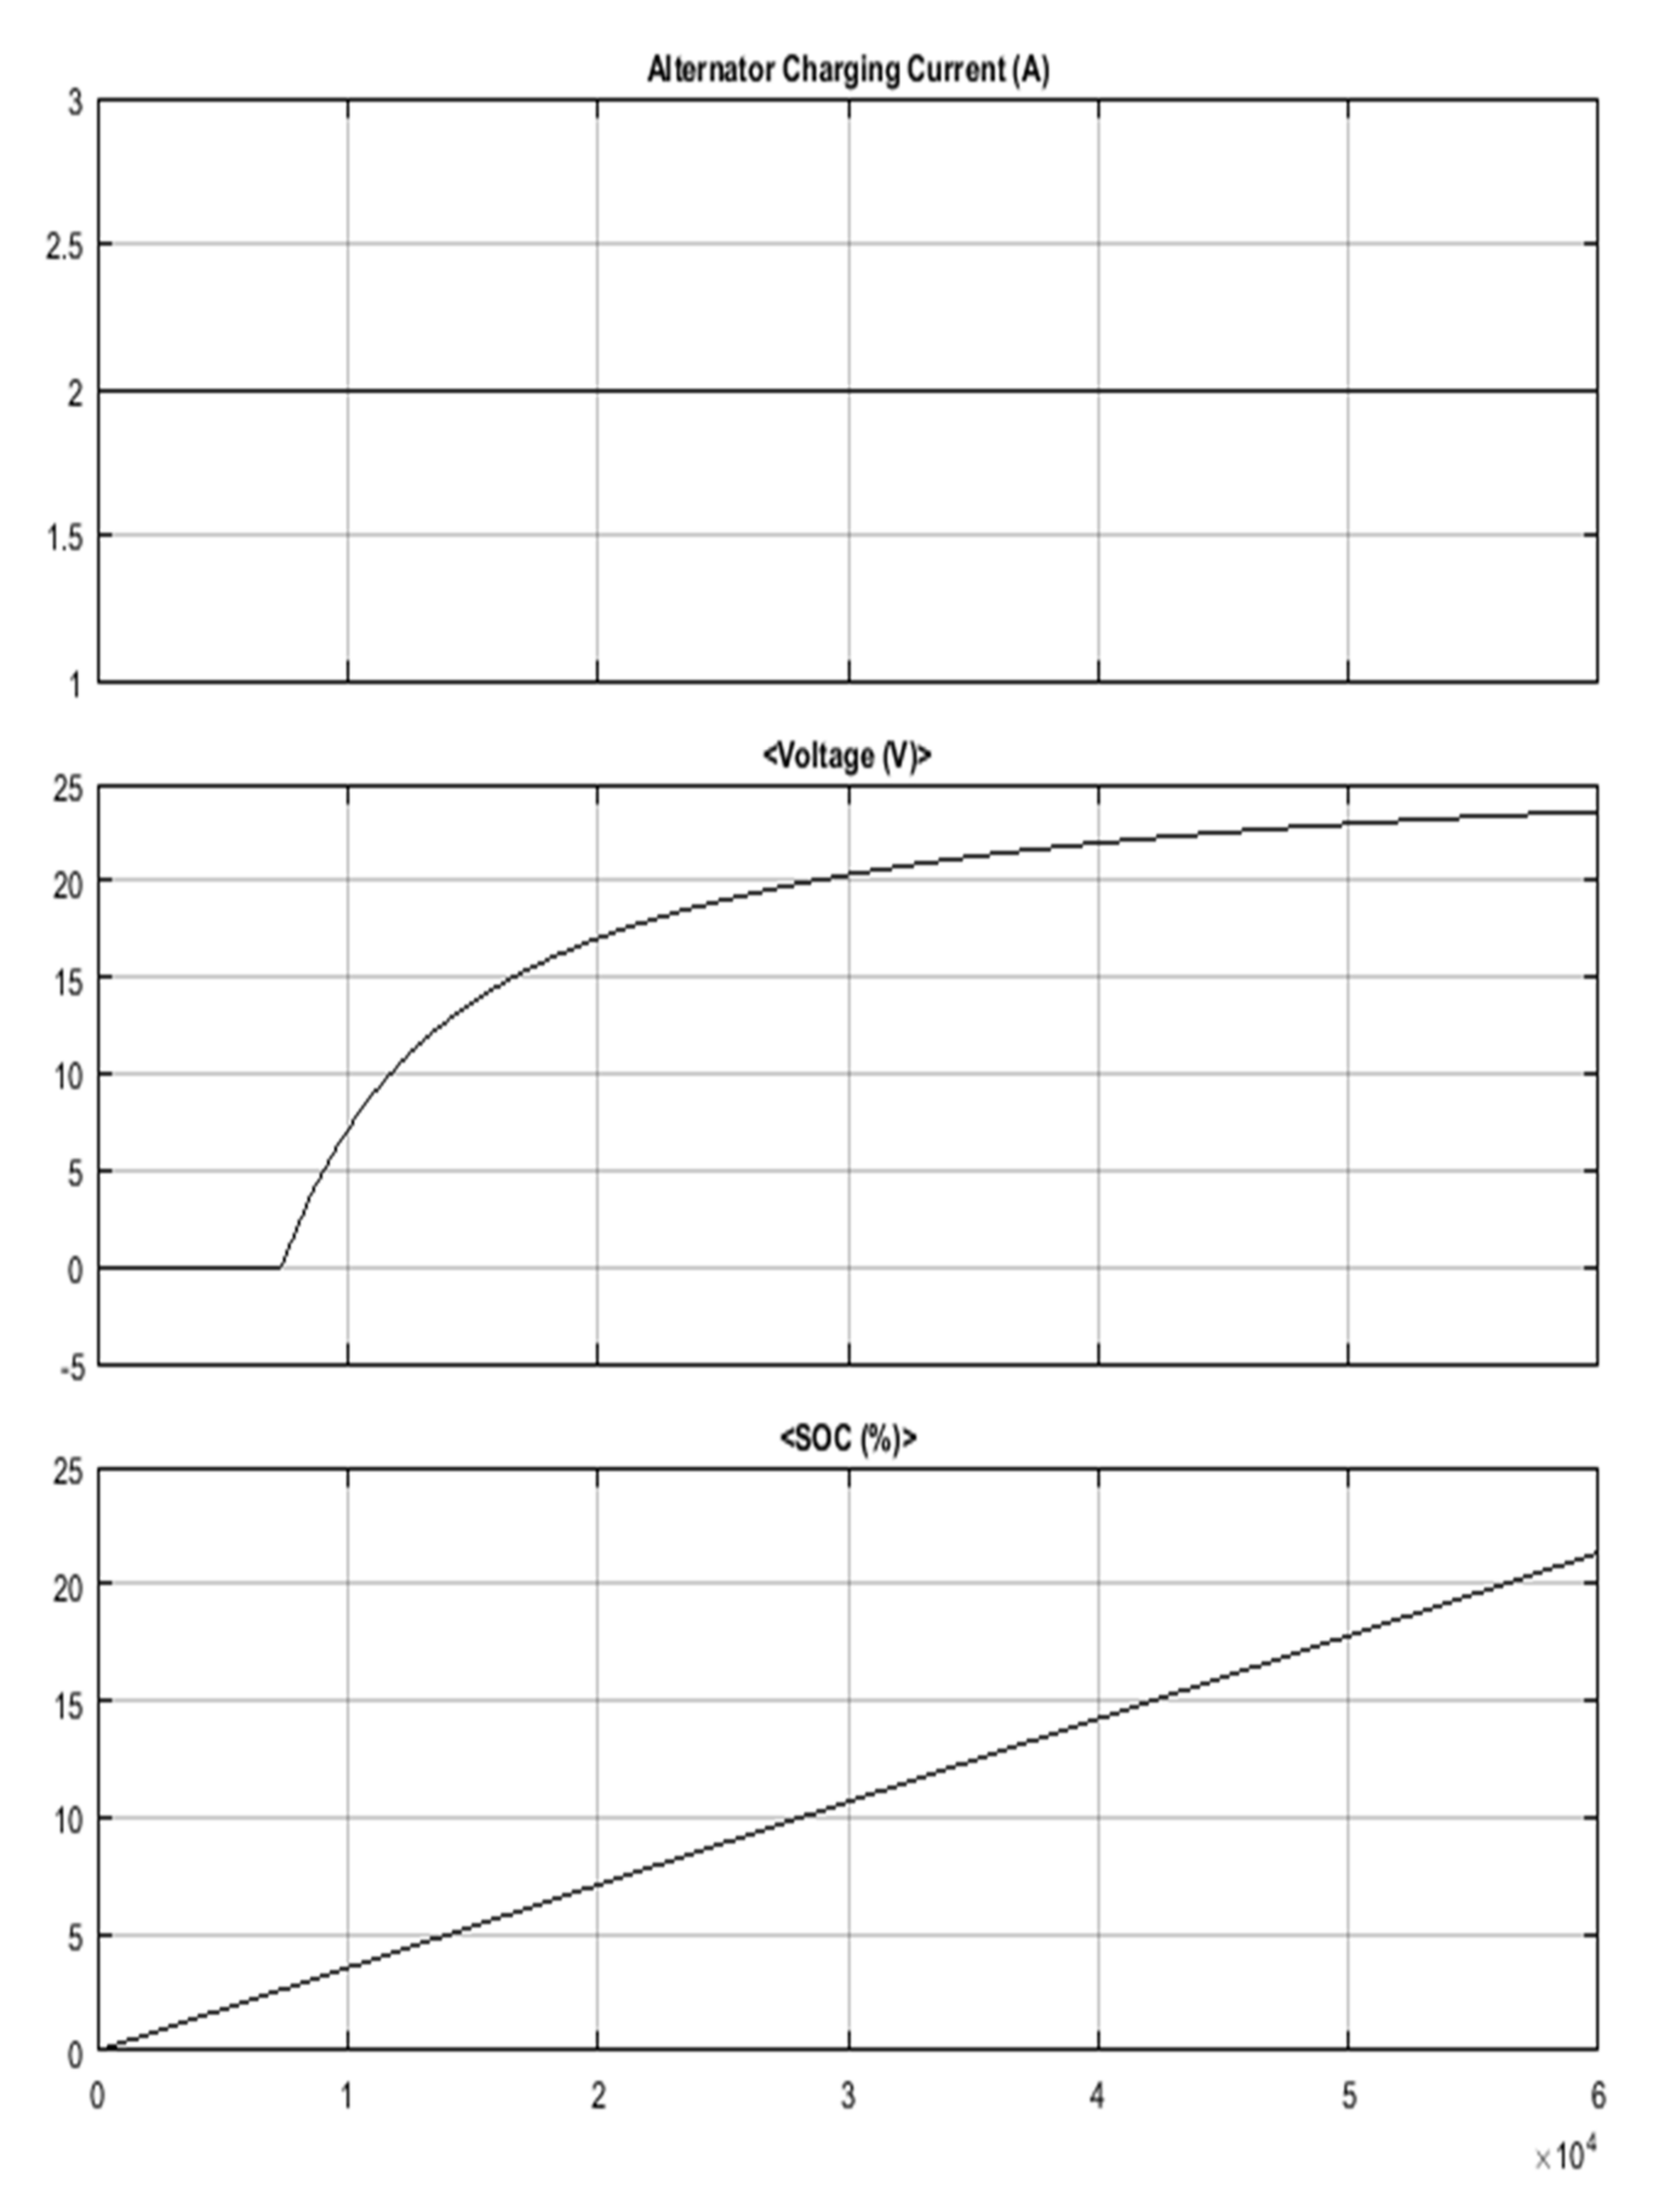
5.5. Wind Generation Used for Charging Battery

The alternator coupled with a wind turbine and a DC–DC boost converter is simulated to verify and test wind-induced energy performance for HEV (charging batteries) that produces 2 A charging current to charge 24-volt batteries. The simulation block diagram is shown in Figure 17. In this research, a small charge alternator was utilized to validate the proof of concept which can be exploited into large-scale tests and validation. Figure 18 shows the simulation results for the alternator charging performance which has been used both for simulation and in hardware.
Initially, (t = 0 s), the SOC of the battery is set to 0%. However, it generates a 2 A output current as the alternator receives more than 900 RPM. The vehicle is kept at a constant speed that allows the alternator blades to rotate at 1000 RPM, causing a constant alternator output of 2 A which is directly fed to the battery (24 V).
The SOC reached 100% at t = 56250 s (15.63 h). As described in Section 2, once the SOC is 100% (using wind power), the distance travelled just by using the battery power equals 298 km. On the other hand, when other sources (i.e., FC, SC, PV) were used for power, the distance travelled just by the battery power was 201 km. An extra 97 km travelled can be achieved by the wind-powered alternator.

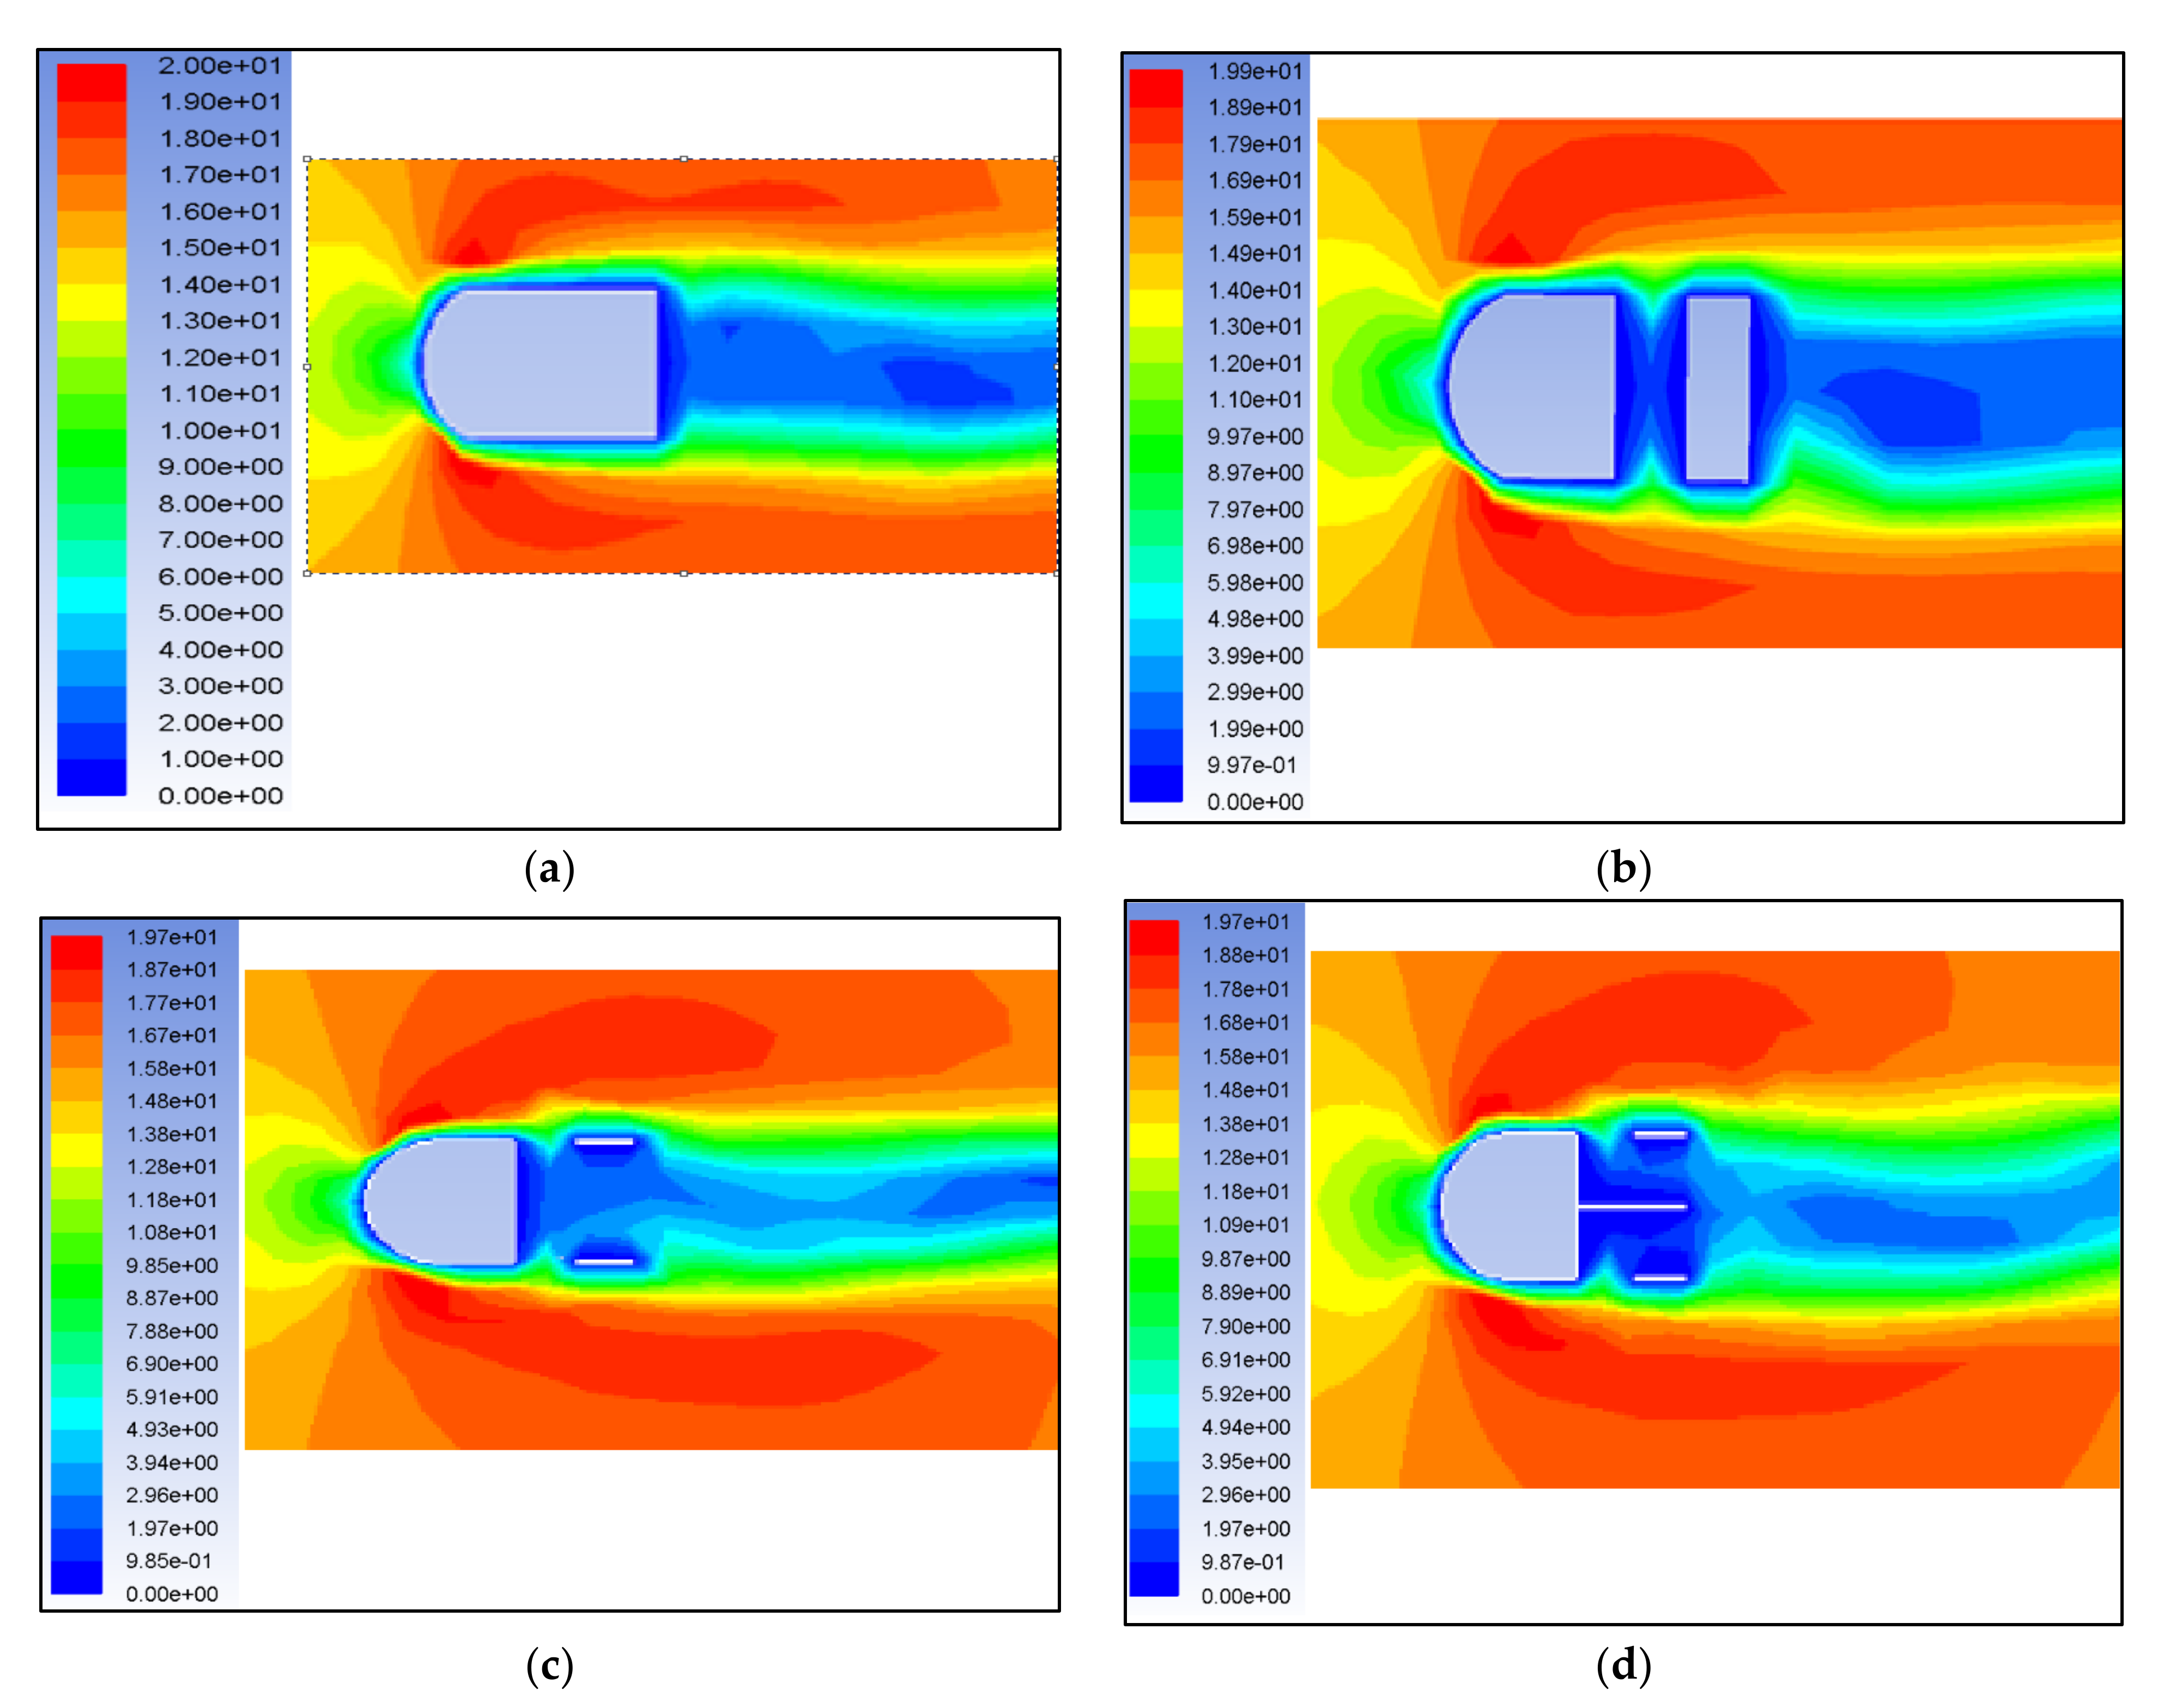
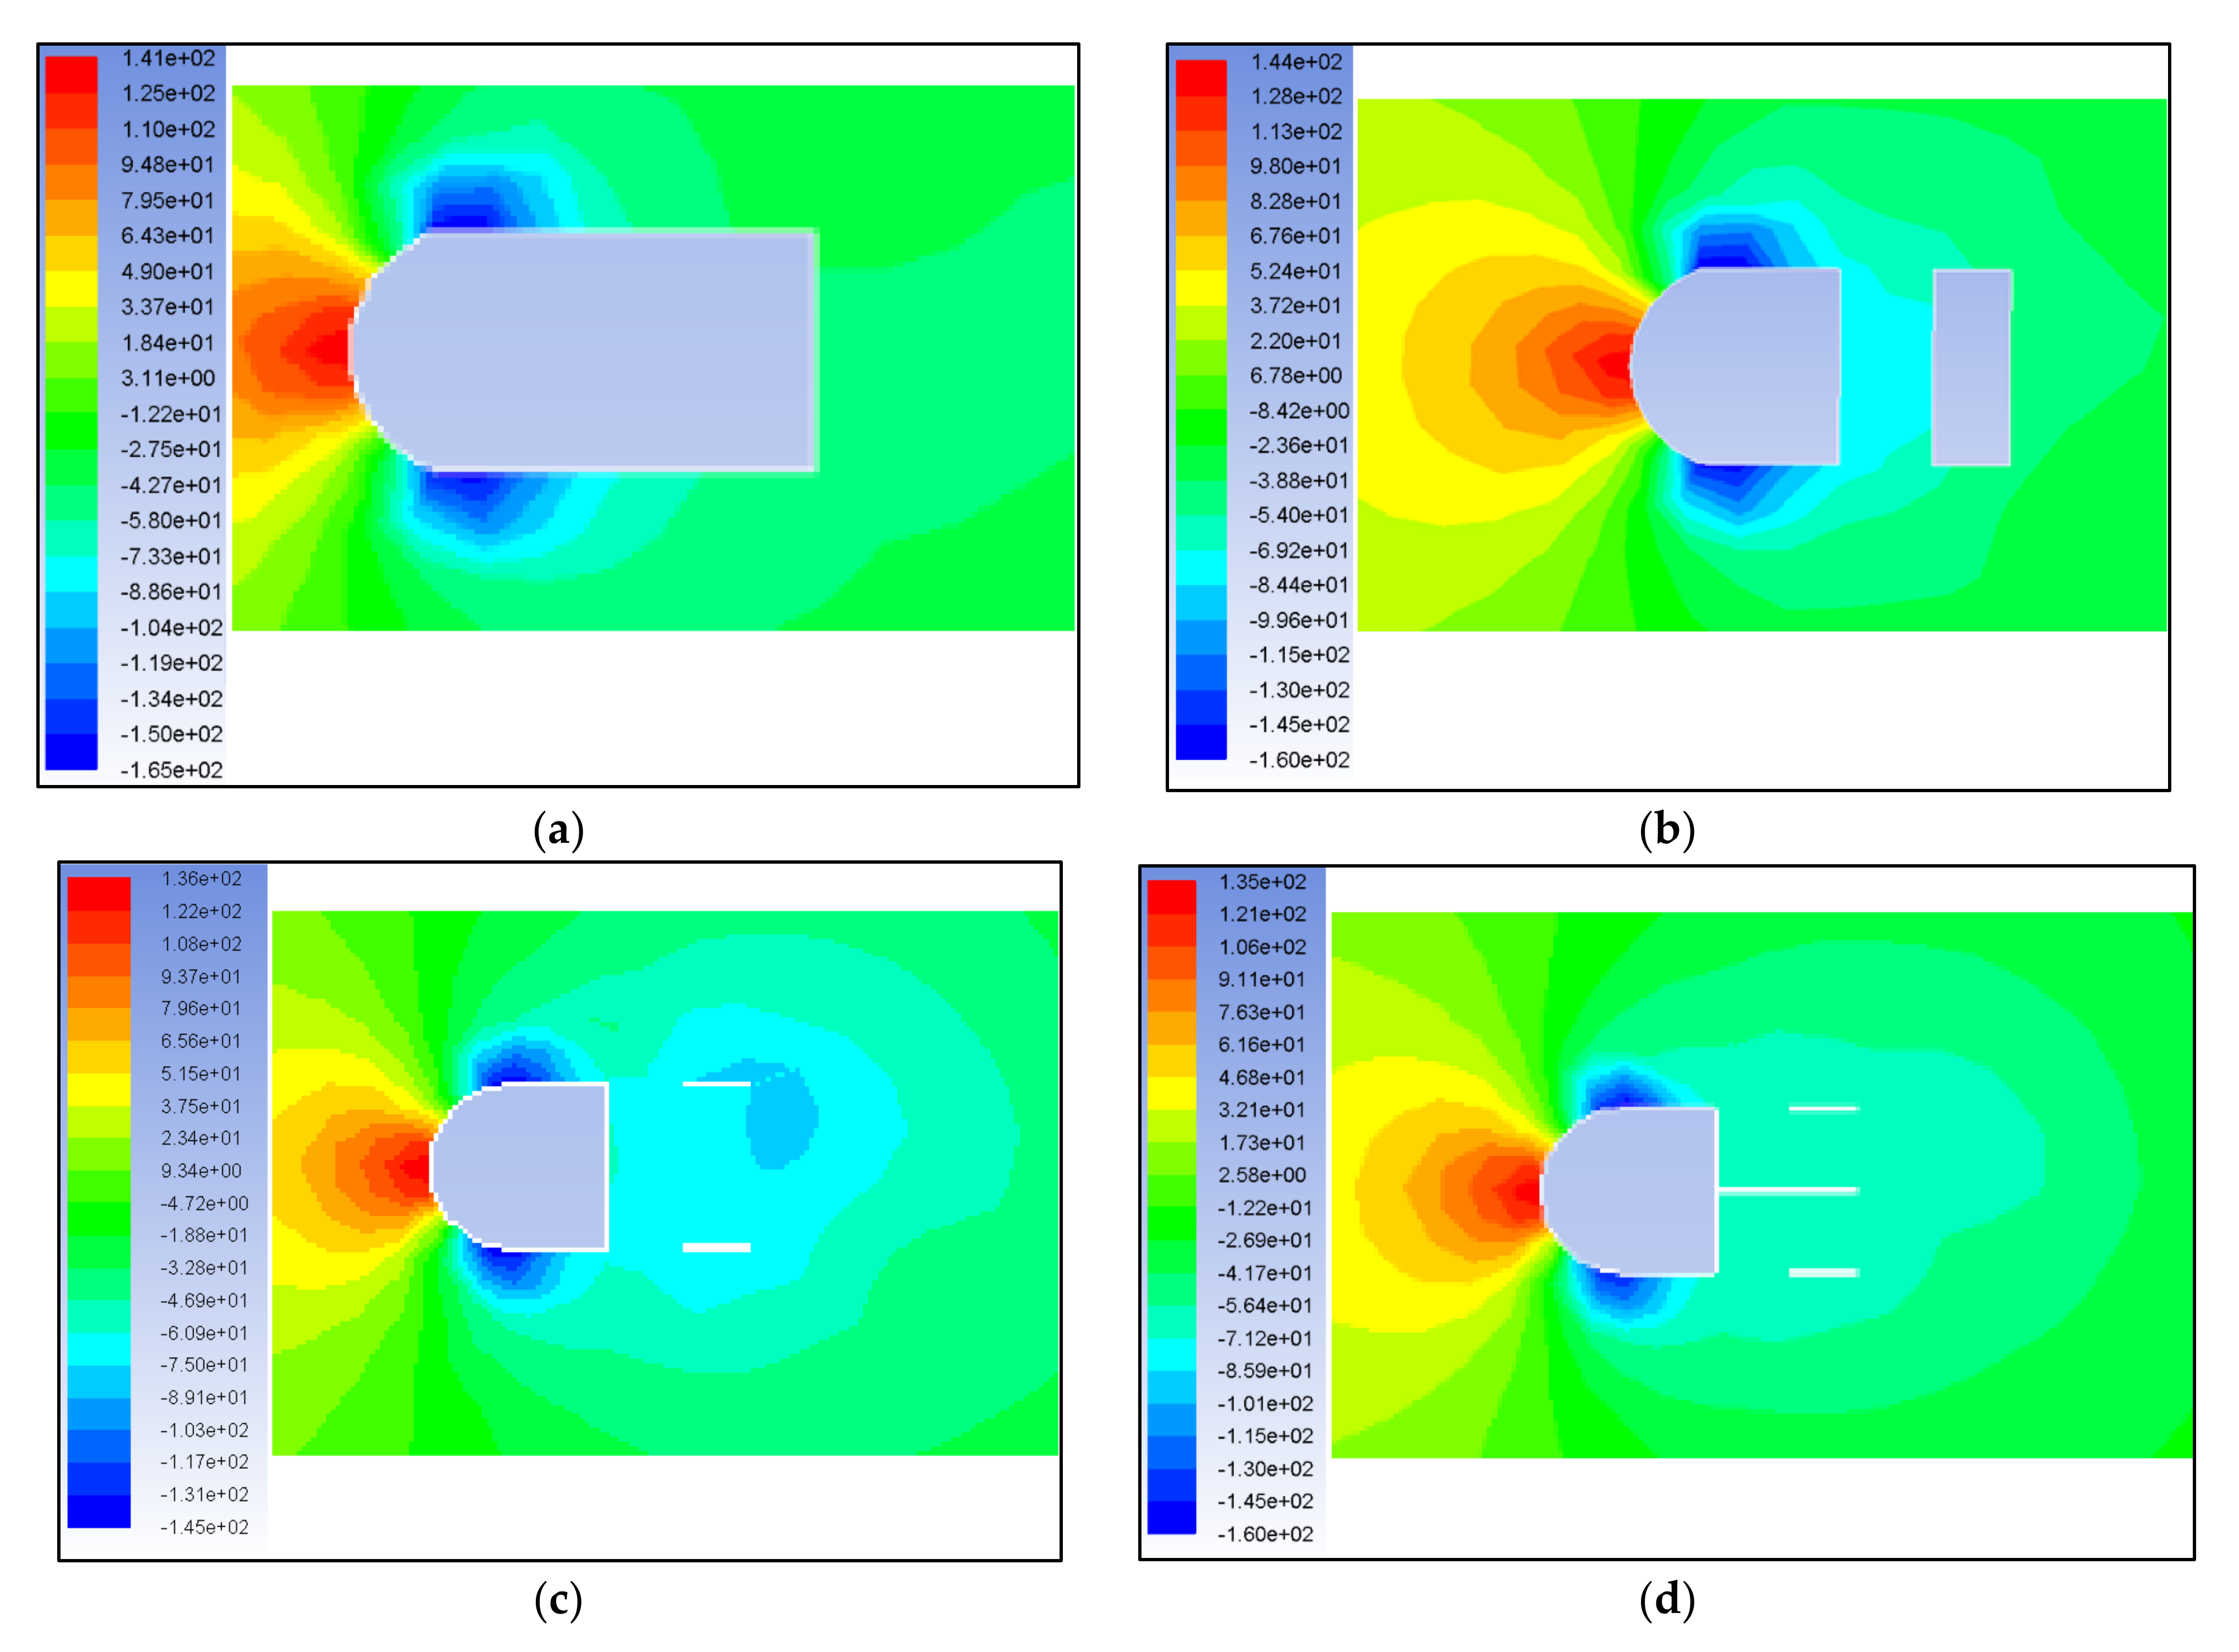
5.5.1. Velocity Flow over Different Models

ANSYS Fluent simulation was used to obtain the pressure difference in the front and back of the vehicle and the force acting in the flow direction. The velocity flow and pressure obtained from the simulations are shown in Figure 19.
The velocity contours over a vehicle without duct and exhaust are shown in Figure 19a. The velocity at the surface of the vehicle is zero as the pressure is very high. When the vehicle moves at a certain velocity, it creates a wake region (dark blue region in Figure 19a) behind the vehicle which intends to increase the drag. When the vehicle experiences a velocity of about 7 m/s to 10 m/s at the front of the vehicle, the velocity at the back ranges from 0 m/s to 5 m/s. It should be noted that the wake region is dependent on the shape of the vehicle. Hence, if the shape is changed the wake region will also change.
The velocity contour over the vehicle with duct but without exhaust is shown in Figure 19b. The wake region is increased with the duct’s addition compared with the basic model shown in Figure 19a. Energy can be harvested by placing wind turbines at the duct entrance. However, since the drag slightly increased due to the increase in the wake region, the energy harvested will be canceled by the drag. The velocity at the front of the vehicle is about 9 m/s while the velocity at the rear side of the vehicle is between 0 m/s to 3.99 m/s.
Figure 19c shows the simulation results when the exhaust is added to the ducts. The wake region is reduced since the wind enters the ducts and leaves through the exhaust. However, the rest of the flow is very much similar to that of Figure 19b. The velocity at the front of the vehicle is about 9 m/s while the velocity in the inside of the duct and the rear side of the vehicle is around 0.1 m/s to 5.91 m/s.
By having a wall in between the exhaust, the wake region is significantly reduced as seen in Figure 19d. The wall in between the duct and exhaust enables the air to flow out of the vehicle smoothly and does not result in turbulence due to the mixing of air from both directions. The velocity at the front of the vehicle is the same for all the models which are around 9 m/s while the velocity inside the duct and the resulting velocity at the back of the vehicle through the exhaust is between 0.1 m/s to 6.91 m/s.

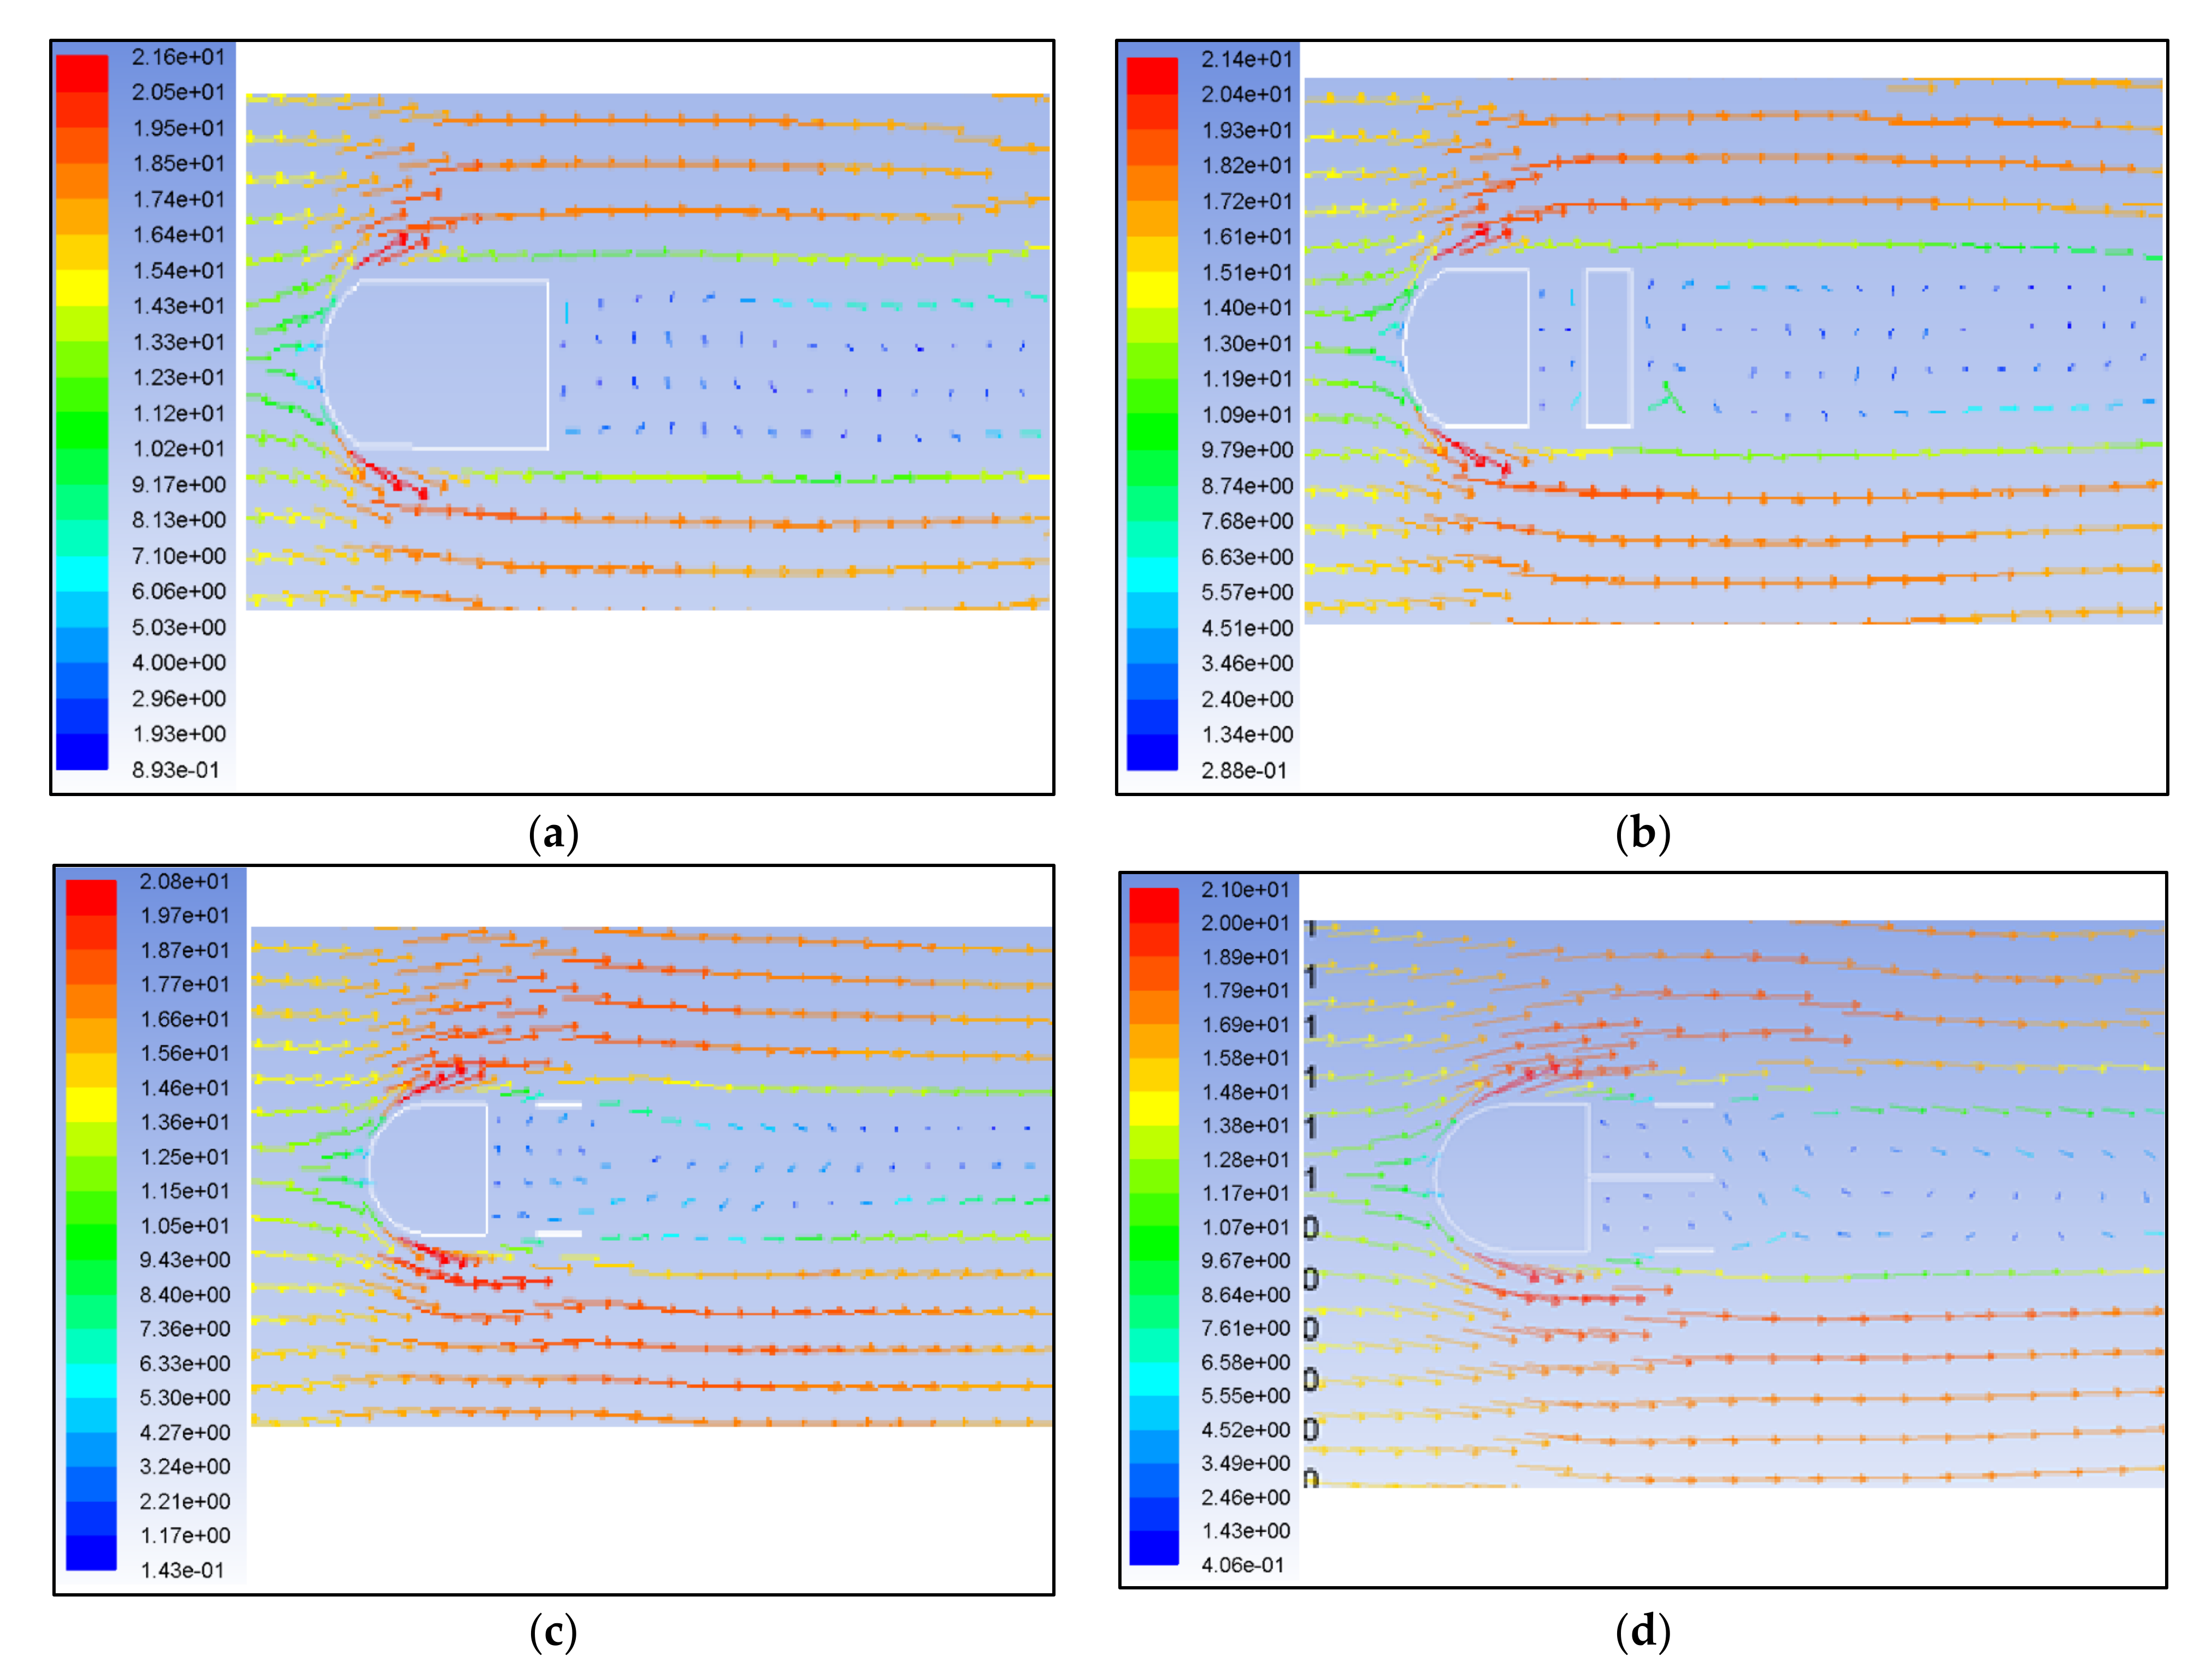
5.5.2. Velocity Vector over Vehicle

The velocity vectors over the vehicles are depicted in Figure 20.
Figure 20a shows the velocity vector over a conventional vehicle design. The velocity vector at the front of the car is between 6.06 m/s to 12.3 m/s while the velocity vector at the back of the vehicle is between 0.893 m/s to 5.03 m/s.
A slight modification to the first model (Figure 20b) shows the velocity vector over the vehicle with duct but without exhaust. A very similar pattern is observed compared to the basic model (Figure 20a). However, wind enters the duct with a velocity of 1 m/s while the vehicle moves at a speed of 15 m/s.
Figure 20c shows the result of adding a full exhaust to the duct. The air flows in the duct with a velocity of 0.143 m/s to 2.21 m/s as indicated by the dark blue vectors. The velocity of the wind inside the duct is low compared to the velocity outside the vehicle.
Figure 20d shows the velocity vector directions over the vehicle with duct and partial exhaust. It also shows the vector directions inside the duct. The velocity magnitudes and vector direction at the front and sides of the vehicle are the same as the magnitudes from the previous velocity vector diagrams; however, the vector direction inside the duct and at the back of the vehicle is slightly different. The flow after the vehicle is shown as vortexes; it is seen that the vortexes are significantly reduced for the vehicle with duct and partial exhaust when it is compared to other models. It is also seen that there is less swirling of velocity vector inside the duct which results in less swirling at the back of the vehicle (reduced vortexes).

5.5.3. Pressure Contours over Vehicle

The pressure contours resulting from the simulations are shown in Figure 21.
It is clear from Figure 21a that the pressure at the front of the vehicle ranges from 125 Pa to 141 Pa while the pressure at the back of the car ranges from −73.3 Pa to −58 Pa for the basic model which consists of no duct and no exhaust.
The pressure contour over the vehicle with duct but without exhaust is shown in Figure 21b. Due to a thorough duct, the pressure in the duct (−84.4 to 54 Pa) is slightly less than the surrounding. The pressure at the front of the vehicle is around 14 Pa while the pressure at the back is around −45 Pa.
Figure 21c shows the pressure contours over the vehicle with duct and full exhaust. The pressure outside the vehicle (front of the vehicle) is similar to that of the previous two designs which are around 14 Pa. However, the pressure to the rear side of the vehicle is much lower than the previous two designs (between −103 Pa and −46.9 Pa) which indicates that the air velocity is slightly higher on those locations according to Bernoulli’s principle. It also indicates that the wake region has been slightly reduced. The pressure inside the duct is around −70 Pa.
From Figure 21d, it is clear that the pressure contour in the duct and the exhaust became uniform when compared to the previous model of full exhaust. The pressure at the front is about 130 Pa while the pressure inside the duct and back of the vehicle is around −85.9 Pa to −71.2 Pa. It is similar to the previous model, but the swirling is less inside the duct which intends to reduce the wake region.
From the comparison, it can be concluded that the best design is one with duct and partial exhaust. Wind velocity entering the duct is low when compared to the velocity at the front of the vehicle. However, the velocity just at the entrance of the duct is around 7–9 m/s and energy can be harvested if a wind turbine is installed at the entrance of the duct.

5.6. SC Load Supply

The SC used in the proposed HEV helps the vehicle to capture the kinetic energy when the vehicle brakes. The SC details are given below.
  • Rated capacitance = 650 F;
  • Rated voltage = 2.7 V;
  • Number of series capacitors = 27;
  • Number of parallel capacitors = 1;
  • Initial voltage = 0 V.
A MATLAB® simulation is performed and the results shown in Figure 22. It is observed that, when the vehicle is parked/not moving, its acceleration is zero and its SOC 0% for the SC at t = 0 s. An acceleration of 2.6 m/s2 achieved at t = 1.38 s results in an increase in the vehicle’s speed which reaches its maximum of 56.55 km/hr at t = 67.3 s.
The acceleration dropped to a negative value (−2.91 m/s2) at t = 71.15 s, which indicates the vehicle was on the brake at that time. The kinetic energy of the vehicle at this time is equivalent to 6796.6 W. The SC can store this braking power and charge the power bank. As a result, the SOC reached 30% at t = 76.44 s. The vehicle stops at t = 96.7 s due to the brake during the period of t = 76.44–96.7 s; only the SC discharges instead of any other energy source in the vehicle.

6. Overall System

The sources described above are combined in Figure 23 (control panel) and Figure 24 (simulation model). A rule-based supervisory controller controls the energy sources by considering each source’s statuses and deciding the best option to provide the necessary power to the vehicle. The controller block is made using a User Defined MATLAB®. The energy sources are given as solar panel, alternator, FC, SC, and the battery with the DC motor load. The braking generator works with the SC to capture the kinetic energy of the vehicle when it brakes. The other necessary input parameters for the MATLAB® model are used according to Table 10. The overall performance output graphs are plotted and shown in Figure 25, which explains the effectiveness of the proposed design energy sources.
The battery is considered as fully charged t = 0 s. At t = 1000, when the brake is initiated, the empty SC is charged by the brake power. To overcome the inertia, the consecutive acceleration is charged by only the SC. The alternator starts to charge the battery when the car speed exceeds 20 km/hr. The FC takes over from the SC at t = 13,500 s once the 30% SOC limit of the battery is achieved. The FC reached 0% at time t = 17,102 s and at this time the car exhausts all its energy sources. The total distance at the control panel is obtained approximately 260 km according to the description provided in Section 2.

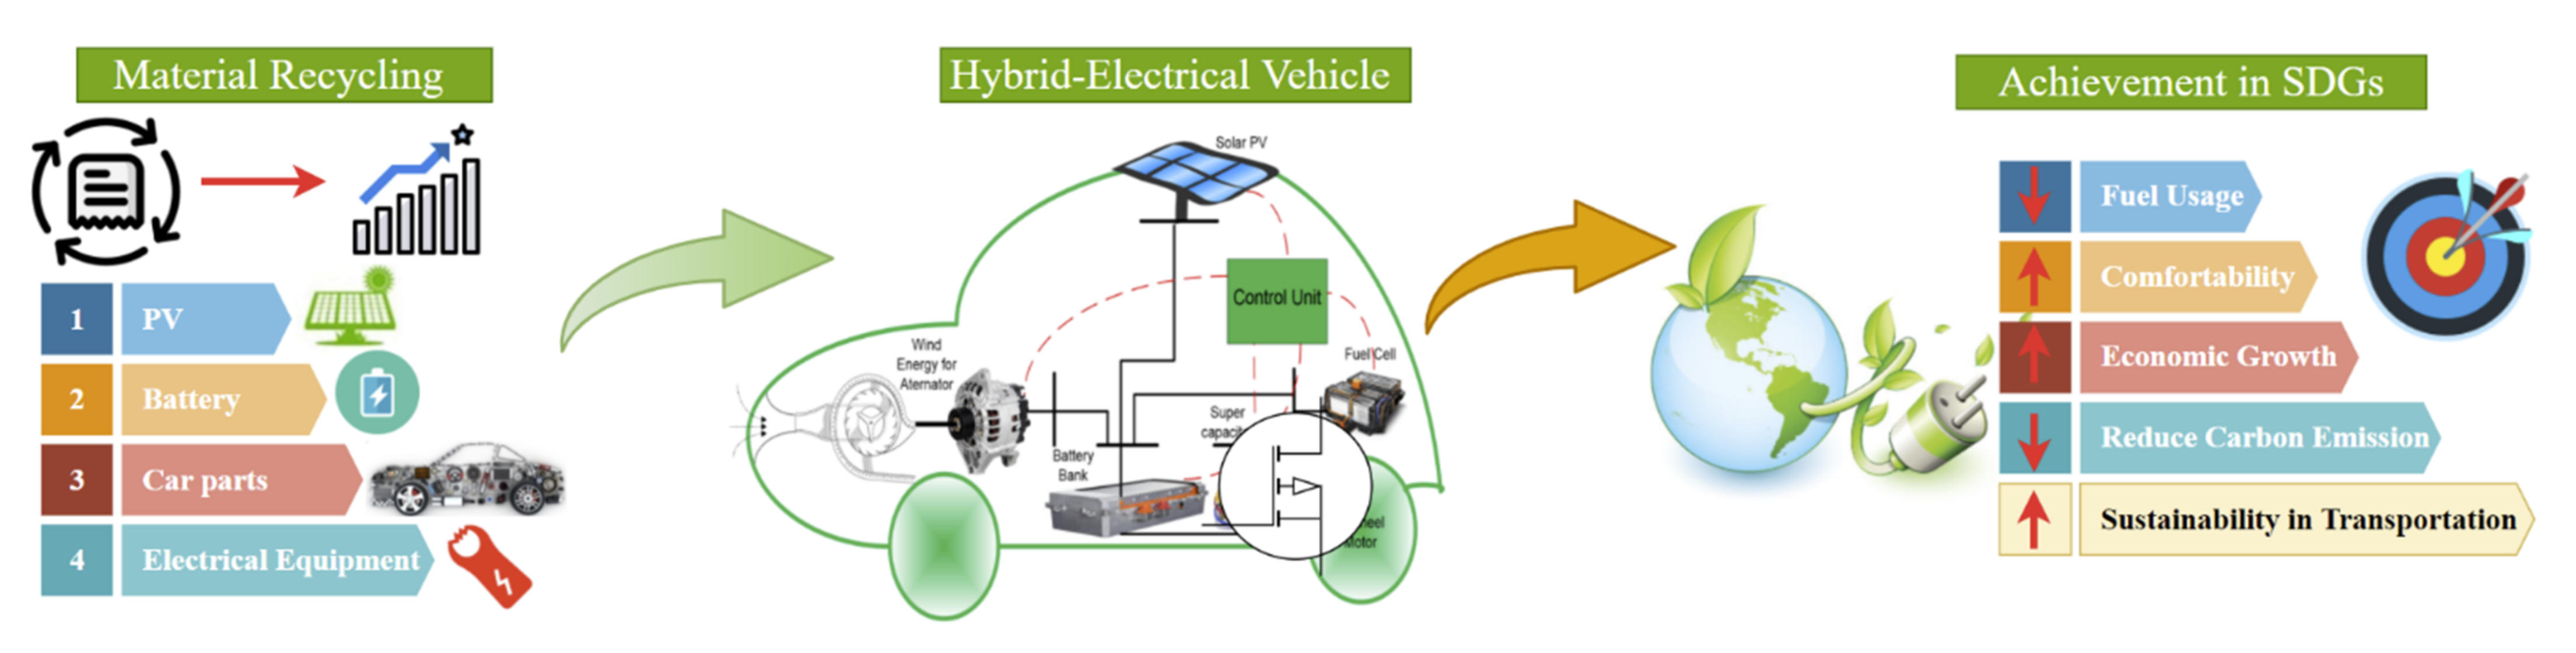
7. Interlinkages of EVs with SDGs

The exploration in this study initiates with the evaluation of significant impacts in the RERs and their impact on the EV’s potential to develop towards sustainability. In order to promote the path of energy sustainability, a simulation model is performed simultaneously from the key viewpoint of the hybrid renewable EVs and sustainable energy transition. The designed HEV provides clean, safe, and sustainable transportation that is economical and accessible to everyone, which is crucial for long-term growth. As a result, the transportation industry is intimately tied to SDGs 7, 8, 11, and 13 because it is sustained by energy. The Figure 26 shows how it contributes to the SDGs. As a consequence, evaluating SDGs priorities will allow interested scientists and government agencies to understand present and future EV research and industry objectives connected to certain SDGs.
  • SDG 7—Affordable and Clean Energy: Energy is a significant factor of the transportation world, whether be it water, air, rail, or land transport, hence it is critical to address and link with SDG7. The goal looks at providing affordable and clean energy requirements for the transport sector. The transportation sector can contribute by increasing the renewable energy mix in transportation and improving efficiency in the current and upcoming transport and its supporting technologies. Constant innovation through research and development has proved to be a sustainable way forward; in this research paper a new concept is being presented that would assist in achieving the sustainable transport sector.
  • SDG 8—Decent Work and Economic Growth: The race towards sustainable transport will initiate the development of new and innovative industries to exploit new target markets with transportation innovations creating further employment and economic growth as a whole, taking into consideration the increasing demands of transport-associated services and products in developing nations.
  • SDG 11—Sustainable Cities and Communities: The transportation sector is also an important sector and any enhancement in this sector will directly contribute towards sustainability in communities and cities. Hybrid electric vehicles will act as a frontline to reduce climate impacts and transition to a safe, resilient, and sustainable future for all.
  • Goal 13—Climate Action: Climate change is triggered by the transportation sector as it is responsible for around a quarter of CO2 emissions and other harmful emissions. As long as the transport sector is energized through fossil fuels, the harmful emissions will continue to increase. Introducing new renewable and hybrid renewable technologies as presented in this paper will not only reduce harmful emissions but will help eradicate climate change.
Integrating recycled materials into the manufacturing of EVs is one way to achieve sustainability in the transportation sector. Using recycled materials in the manufacturing of EVs will help to combat the increasingly global footprint of GHG emissions. Figure 26 highlights some of the essential goals that may be met by creating an EV out of recycled materials.

8. Future Trends of EVs with SDGs

Our literature review presented various significant ideas for future research towards the progress of EV applications based on SDGs. The automobile industry is one of the most significant and principal sources of greenhouse gas emissions, and e-mobility is viewed as one of the potential solutions; nevertheless, a social viewpoint must be explored further to enhance the public image and acceptance of EVs.
  • In terms of accomplishing SDGs in the transportation sector, the global adoption of EV applications has been explored. However, several EV-related concerns, such as limited driving ranges, battery lives, long charging times, high starting costs, and inefficient EV-based regulations, must be thoroughly investigated. Additional study is warranted to produce an effective EMS design with greater operational mechanisms, as well as to encourage market rules and worldwide cooperation for efficient electric vehicle operations.
  • Low impedance, excessive ripple current, and sensitive duty cycles are all problems with present converter designs used in EMSs. Additional research is needed in this area to enhance the converter design for high frequency and minimal losses. To achieve high robustness, mechanical strength, and power density, optimization based on mechanical design is also recommended.
  • The reliability and stability of battery operation have considerably increased as a result of the use of EMSs in EV applications for managing battery heating and cooling. Unfortunately, due to heat difficulties and deep-diving distance loss, the efficiency of electric vehicles is diminished. Furthermore, the presence of heat effects as a result of the electrochemical process causes EMSs to be inaccurate and unstable. The use of SC in the ESS has been reported to reduce dynamic instability difficulties. Furthermore, the EMSs technology optimization approach may significantly alleviate battery aging and power restriction problems.
  • While EMS-based EV applications have made significant progress towards the SDGs and decarbonization, environmental concerns such as soil and groundwater pollution must be taken into account. Battery disposal that is not perfect potentially leads to water and airborne health risks. Sufficient recycling and reusability procedures should be taken to avoid improper battery disposal in the environment.
“Climate actions” have been selected as the current priority. “Sustainable cities and communities”, which is becoming increasingly crucial, has the ability to become a future study, policy, and social priority.

9. Conclusions

The proposed ZFZE HEV where all the necessary energy was sourced from RE was modeled and simulated using MATLAB® and Simulink®. In this proposed HEV, a rule-based controller is used to perform supervisory activities, including controlling the energy source and prioritizing the energy source based on the required availability of energy during acceleration and deceleration. In addition to the vehicle chassis, RERs play a key role in achieving the SDGs 7, 11, and 13. The design system of HEV was locally implemented, and simulation results were generated to understand the performance. The carbon emissions into the atmosphere are negligible and the objectives are achieved through this proposed design and simulated using Simulink®. The wheel torque is calculated to function as rolling resistance, grade resistance, and acceleration force. The basic model for the vehicle also considered the surface on which the vehicle moves. For this simulation, asphalt was assumed to have a coefficient of kinetic friction to be 0.012 which acts against the wheel. Furthermore, the model also considered the inclination angle (α) of the road surface. The weight of the vehicle was counted as 15,000 N for this research, based on the physical model donated by Clay Energy for the prototype design and real-time implementation stage in progress.
Vehicle researchers and automobile engineers have taken many steps to promote alternative energy sources in the transportation sector. Huge attention and effort have been concentrated on compressed natural gas (CNG), liquefied petroleum gas (LPG), and EV and PHEV technologies. However, all these technologies are directly or indirectly dependent upon FF, which is one of the main reasons for carbon emission and environmental pollution.
Designing a vehicle with renewable energy is challenging and still under research. Hence, this proposed design, combining all the possible renewable sources to design an HEV, will significantly contribute to society and future research.

Author Contributions

Conceptualization, K.A.M., F.R.I. and A.A.C.; methodology, K.A.P., K.A.M., F.R.I. and K.P.; software, S.M. and K.K.G.; validation, K.A.M., F.R.I. and R.H.; formal analysis, K.A.M. and R.H.; investigation, F.R.I.; resources, K.A.M. and F.R.I.; data curation, K.P.; writing—original draft preparation, A.A.C., K.A.P., K.P., K.K.G. and K.A.M.; writing—review and editing, R.H.; visualization, F.R.I.; supervision, K.A.M. and F.R.I.; project administration, K.A.M. and F.R.I.; funding acquisition, K.A.M. and F.R.I. All authors have read and agreed to the published version of the manuscript.

Funding

This work was supported in part by the University of the South Pacific (USP) and Clay Energy, Fiji.

Institutional Review Board Statement

Not applicable.

Informed Consent Statement

Not applicable.

Data Availability Statement

Data is contained with the article.

Conflicts of Interest

The authors declare no conflict of interest.

Abbreviations

The following abbreviations are used in this manuscript:
BESSBattery Energy Storage System
ESSEnergy Storage System
EVElectric Vehicle
FCFuel Cell
FFFossil Fuel
FLFuzzy Logic
HEVHybrid Electric Vehicle
ICEVInternal Combustion Engine Vehicle
PEMProton Exchange Membrane
PEMFCProton Exchange Membrane Fuel Cell
PEMFC–UCProton Exchange Membrane Fuel Cell and Ultra-Capacitor
PHEVPlug-in Hybrid Electric Vehicle
PVPhotovoltaic
RERRenewable Energy Resource
SCSupercapacitor
SDGSustainable Development Goals
SDSSustainable Development Scenario
WEWind Energy
ZFZEZero-Fuel Zero-Emission

References

  1. IEA. Available online: https://www.iea.org/reports/tracking-transport-2019 (accessed on 10 October 2021).
  2. Khalili, S.; Rantanen, E.; Bogdanov, D.; Breyer, C. Global Transportation Demand Development with Impacts on the Energy Demand and Greenhouse Gas Emissions in a Climate-Constrained World. Energies 2019, 12, 3870. [Google Scholar] [CrossRef] [Green Version]
  3. Bureika, G.; Matijošius, J.; Rimkus, A. Alternative Carbonless Fuels for Internal Combustion Engines of Vehicles. In Ecology in Transport: Problems and Solutions; Springer: Cham, Switzerland, 2020; pp. 1–49. [Google Scholar]
  4. Wang, H.; Chen, W. Modeling of energy transformation pathways under current policies, NDCs and enhanced NDCs to achieve 2-degree target. Appl. Energy 2019, 250, 549–557. [Google Scholar] [CrossRef]
  5. Kumar, N.M.; Chopra, S.S.; Chand, A.A.; Elavarasan, R.M.; Shafiullah, G. Hybrid Renewable Energy Microgrid for a Residential Community: A Techno-Economic and Environmental Perspective in the Context of the SDG7. Sustainability 2020, 12, 3944. [Google Scholar] [CrossRef]
  6. Rodrigues, A.; Bordado, J.C.; Santos, R.G.D. Upgrading the glycerol from biodiesel production as a source of energy carriers and chemicals—A technological review for three chemical pathways. Energies 2017, 10, 1817. [Google Scholar] [CrossRef] [Green Version]
  7. Prakash, K.; Islam, F.R.; Mamun, K.A.; Pota, H.R. Configurations of aromatic networks for power distribution system. Sustainability 2020, 12, 4317. [Google Scholar] [CrossRef]
  8. Islam, F.M.; Mamun, K.; Prakash, K.; Lallu, A. Aromatic network for power distribution system. IP Aust. Grant Certif. 2017, 30, 201710. [Google Scholar]
  9. Kuo, T.C.; Tseng, M.L.; Lin, C.H.; Wang, R.W.; Lee, C.H. Identifying sustainable behavior of energy consumers as a driver of design solutions: The missing link in eco-design. J. Clean. Prod. 2018, 192, 486–495. [Google Scholar] [CrossRef]
  10. Mo, W.; Yang, C.; Chen, X.; Lin, K.; Duan, S. Optimal Charging Navigation Strategy Design for Rapid Charging Electric Vehicles. Energies 2019, 12, 962. [Google Scholar] [CrossRef] [Green Version]
  11. Prakash, K.; Ali, M.; Islam, M.R.; Mo, H.; Dong, D.; Pota, H. Optimal Coordination of Photovoltaics and Electric Vehicles for Ancillary Services in Low Voltage Distribution Networks. In Proceedings of the 2021 24th International Conference on Electrical Machines and Systems (ICEMS), Gyeongju, Korea, 31 October–3 November 2021; pp. 1008–1013. [Google Scholar]
  12. Global EV Outlook 2019. Available online: https://www.iea.org/reports/global-ev-outlook-2019 (accessed on 10 October 2021).
  13. Islam, F.R.; Prakash, K.; Mamun, K.A.; Lallu, A.; Pota, H.R. Aromatic network: A novel structure for power distribution system. IEEE Access 2017, 5, 25236–25257. [Google Scholar] [CrossRef]
  14. Prakash, K.; Lallu, A.; Islam, F.R.; Mamun, K.A. Review of power system distribution network architecture. In Proceedings of the 2016 3rd Asia-Pacific World Congress on Computer Science and Engineering (APWC on CSE), Nadi, Fiji, 5–6 December 2016; pp. 124–130. [Google Scholar]
  15. Gherairi, S. Hybrid Electric Vehicle: Design and Control of a Hybrid System (Fuel Cell/Battery/Ultra-Capacitor) Supplied by Hydrogen. Energies 2019, 12, 1272. [Google Scholar] [CrossRef] [Green Version]
  16. Motavalli, J. Forward Drive: The Race to Build the Clean Car of the Future; Routledge: New York, NY, USA, 2014. [Google Scholar]
  17. Moriarty, P.; Honnery, D. The prospects for global green car mobility. J. Clean. Prod. 2008, 16, 1717–1726. [Google Scholar] [CrossRef]
  18. Amick, J.L.; Amick James, L. Wind-Powered Car. U.S. Patent 4,117,900, 1978. [Google Scholar]
  19. Saidur, R.; Masjuki, H.H.; Hasanuzzaman, M. Perfromance of an improved solar car ventilator. Int. J. Mech. Mater. Eng. 2009, 4, 24–34. [Google Scholar]
  20. Kendall, A.; Ambrose, H.; Maroney, E.; Deng, H. Program for Vehicle Regulatory Reform: Assessing Life Cycle-Based Greenhouse Gas Standards; University of California: Oakland, CA, USA, 2018. [Google Scholar]
  21. None, N. FY2017 Analysis Annual Progress Report (No. DOE/EE-1706); Vehicle Technologies Office, Dept. of Energy (DOE): Washington, DC, USA, 2018. [Google Scholar]
  22. Li, C.; Brewer, E.; Pham, L.; Jung, H. Reducing Mobile Air Conditioner (MAC) Power Consumption Using Active Cabin-Air-Recirculation in A Plug-In Hybrid Electric Vehicle (PHEV). World Electr. Veh. J. 2018, 9, 51. [Google Scholar] [CrossRef] [Green Version]
  23. Joshi, A. Review of vehicle engine efficiency and emissions. SAE Int. J. Adv. Curr. Pract. Mobil. 2019, 1, 734–761. [Google Scholar]
  24. Fahrenbruch, A.; Bube, R. Fundamentals of Solar Cells: Photovoltaic Solar Energy Conversion; Elsevier: Amsterdam, The Netherlands, 2012. [Google Scholar]
  25. Rekioua, D.; Bensmail, S.; Bettar, N. Development of hybrid photovoltaic-fuel cell system for stand-alone application. Int. J. Hydrogen Energy 2014, 39, 1604–1611. [Google Scholar] [CrossRef]
  26. Kumar, A.; Reddy, R.G. Effect of channel dimensions and shape in the flow-field distributor on the performance of polymer electrolyte membrane fuel cells. J. Power Source 2003, 113, 11–18. [Google Scholar] [CrossRef]
  27. Khaligh, A.; Li, Z. Battery, ultracapacitor, fuel cell, and hybrid energy storage systems for electric, hybrid electric, fuel cell, and plug-in hybrid electric vehicles: State of the art. IEEE Trans. Veh. Technol. 2010, 59, 2806–2814. [Google Scholar] [CrossRef]
  28. Cheng, Y.; Lataire, P. Research and test platform for hybrid electric vehicle with the super capacitor based energy storage. In Proceedings of the 2007 European Conference on Power Electronics and Applications, Aalborg, Denmark, 2–5 September 2007; pp. 1–10. [Google Scholar]
  29. Horrein, L.; Bouscayrol, A.; Cheng, Y.; Dumand, C.; Colin, G.; Chamaillard, Y. Influence of the heating system on the fuel consumption of a hybrid electric vehicle. Energy Convers. Manag. 2016, 129, 250–261. [Google Scholar] [CrossRef]
  30. Reddy, K.J.; Natarajan, S. Energy sources and multi-input DC-DC converters used in hybrid electric vehicle applications—A review. Int. J. Hydrogen Energy 2018, 43, 17387–17408. [Google Scholar] [CrossRef]
  31. Karunarathne, L.; Economou, J.T.; Knowles, K. Model based power and energy management system for PEM fuel cell/Li-Ion battery driven propulsion system. In Proceedings of the 5th IET International Conference on Power Electronics, Machines and Drives (PEMD 2010), Brighton, UK, 19–21 April 2010. [Google Scholar]
  32. Allag, T.; Das, T. Robust control of solid oxide fuel cell ultracapacitor hybrid system. IEEE Trans. Control Syst. Technol. 2011, 20, 1–10. [Google Scholar] [CrossRef]
  33. Yang, Y.P.; Liu, J.J.; Hu, T.H. An energy management system for a directly-driven electric scooter. Energy Convers. Manag. 2011, 52, 621–629. [Google Scholar] [CrossRef]
  34. Sperandio, G.S.; Nascimento, C.L.; Adabo, G.J. Modeling and simulation of nickel-cadmium batteries during discharge. In Proceedings of the 2011 Aerospace Conference, Big Sky, MT, USA, 5–12 March 2011; pp. 1–9. [Google Scholar]
  35. Castaner, L.; Silvestre, S. Modelling Photovoltaic Systems Using PSpice; John Wiley and Sons: Hoboken, NJ, USA, 2002. [Google Scholar]
  36. Lukic, S.; Mulhall, P.; Emadi, A. Energy Autonomous Solar⁄ battery Auto Rickshaw. J. Asian Electr. Veh. 2008, 6, 1135–1143. [Google Scholar] [CrossRef] [Green Version]
  37. Ustun, O.; Yilmaz, M.; Gokce, C.; Karakaya, U.; Tuncay, R.N. Energy management method for solar race car design and application. In Proceedings of the 2009 IEEE International Electric Machines and Drives Conference, Miami, FL, USA, 3–6 May 2009; pp. 804–811. [Google Scholar]
  38. Uzunoglu, M.; Alam, M.S. Dynamic modeling, design and simulation of a PEM fuel cell/ultra-capacitor hybrid system for vehicular applications. Energy Convers. Manag. 2007, 48, 1544–1553. [Google Scholar] [CrossRef]
  39. Barret, S. Japanese fuel cell rail vehicle in running tests. Fuel Cell Bull. 2006, 12, 2–3. [Google Scholar]
  40. García, P.; Torreglosa, J.P.; Fernández, L.M.; Jurado, F. Control strategies for high-power electric vehicles powered by hydrogen fuel cell, battery and supercapacitor. Expert Syst. Appl. 2013, 40, 4791–4804. [Google Scholar] [CrossRef]
  41. Fathabadi, H. Novel standalone hybrid solar/wind/fuel cell power generation system for remote areas. Sol. Energy 2017, 146, 30–43. [Google Scholar] [CrossRef]
  42. Jia, J.; Wang, G.; Cham, Y.T.; Wang, Y.; Han, M. Electrical characteristic study of a hybrid PEMFC and ultracapacitor system. IEEE Trans. Ind. Electron. 2009, 57, 1945–1953. [Google Scholar]
  43. Rahman, A.U.; Zehra, S.S.; Ahmad, I.; Armghan, H. Fuzzy Supertwisting Sliding Mode-Based Energy Management and Control of Hybrid Energy Storage System in Electric Vehicle Considering Fuel Economy. J. Energy Storage 2021, 37, 102468. [Google Scholar] [CrossRef]
  44. Xiao, B.; Ruan, J.; Yang, W.; Walker, P.D.; Zhang, N. A Review of Pivotal Energy Management Strategies for Extended Range Electric Vehicles. Renew. Sustain. Energy Rev. 2021, 149, 111194. [Google Scholar] [CrossRef]
  45. Zou, R.; Fan, L.; Dong, Y.; Zheng, S.; Hu, C. DQL Energy Management: An Online-Updated Algorithm and Its Application in Fix-Line Hybrid Electric Vehicle. Energy 2021, 225, 120174. [Google Scholar] [CrossRef]
  46. Polverino, P.; Arsie, I.; Pianese, C. Optimal Energy Management for Hybrid Electric Vehicles Based on Dynamic Programming and Receding Horizon. Energies 2021, 14, 3502. [Google Scholar] [CrossRef]
  47. Piperidis, S.; Chrysomallis, I.; Georgakopoulos, S.; Ghionis, N.; Doitsidis, L.; Tsourveloudis, N. A ROS-Based Energy Management System for a Prototype Fuel Cell Hybrid Vehicle. Energies 2021, 14, 1964. [Google Scholar] [CrossRef]
  48. Thanapalan, K.; Zhang, F.; Premier, G.; Maddy, J.; Guwy, A. Energy Management Effects of Integrating Regenerative Braking into a Renewable Hydrogen Vehicle. In Proceedings of the 2012 UKACC International Conference on Control, Cardiff, UK, 3–5 September 2012; pp. 924–928. [Google Scholar]
  49. Yang, Y.P.; Guan, R.M.; Huang, Y.M. Hybrid Fuel Cell Powertrain for a Powered Wheelchair Driven by Rim Motors. J. Power Source 2012, 212, 192–204. [Google Scholar] [CrossRef]
  50. Lv, Y.; Yuan, H.; Liu, Y.; Wang, Q. Fuzzy Logic Based Energy Management Strategy of Battery-Ultracapacitor Composite Power Supply for HEV. In Proceedings of the 2010 1st International Conference on Pervasive Computing, Signal Processing and Applications, PCSPA, Harbin, China, 17–19 September 2010; pp. 1209–1214. [Google Scholar]
  51. Rehman, U.; Feng, D.; Su, H.; Numan, M.; Abbas, F. Network Overloading Management by Exploiting the In-System Batteries of Electric Vehicles. Int. J. Energy Res. 2021, 45, 5866–5880. [Google Scholar] [CrossRef]
  52. Chen, L.; Ma, X.; Wei, S.; Yuan, D. Real-Time Energy Management Strategy of Multi-Wheel Electric Drive Vehicles with Load Power Prediction Function. IEEE Access 2021, 9, 20681–20694. [Google Scholar] [CrossRef]
  53. Deng, T.; Tang, P.; Luo, J. A Novel Real-Time Energy Management Strategy for Plug-in Hybrid Electric Vehicles Based on Equivalence Factor Dynamic Optimization Method. Int. J. Energy Res. 2021, 45, 626–641. [Google Scholar] [CrossRef]
  54. Tarascon, J.-M.; Recham, N.; Armand, M.; Chotard, J.-N.; Barpanda, P.; Walker, W.; Dupont, L. Hunting for Better Li-Based Electrode Materials via Low Temperature Inorganic Synthesis. Chem. Mater. 2009, 22, 724–739. [Google Scholar] [CrossRef]
  55. Hoque, M.M.; Hannan, M.A.; Mohamed, A. Optimal CC-CV Charging of Lithium-Ion Battery for Charge Equalization Controller. In Proceedings of the 2016 International Conference on Advances in Electrical, Electronic and Systems Engineering, ICAEES 2016, Putrajaya, Malaysia, 14–16 November 2017; pp. 610–615. [Google Scholar]
  56. Xu, H.; Shen, M. The Control of Lithium-Ion Batteries and Supercapacitors in Hybrid Energy Storage Systems for Electric Vehicles: A Review. Int. J. Energy Res. 2021, 45, 20524. [Google Scholar] [CrossRef]
  57. Torabi, R.; Gomes, Á.; Morgado-Dias, F. Energy Transition on Islands with the Presence of Electric Vehicles: A Case Study for Porto Santo. Energies 2021, 14, 3439. [Google Scholar] [CrossRef]
  58. Zhang, Q.; Li, G. Experimental Study on a Semi-Active Battery-Supercapacitor Hybrid Energy Storage System for Electric Vehicle Application. IEEE Trans. Power Electron. 2020, 35, 1014–1021. [Google Scholar] [CrossRef]
  59. Perullo, C.; Mavris, D. A Review of Hybrid-Electric Energy Management and Its Inclusion in Vehicle Sizing. Aircr. Eng. Aerosp. Technol. Int. J. 2014, 86, 550–557. [Google Scholar] [CrossRef]
  60. Yang, B.; Wang, J.; Zhang, X.; Wang, J.; Shu, H.; Li, S.; He, T.; Lan, C.; Yu, T. Applications of Battery/Supercapacitor Hybrid Energy Storage Systems for Electric Vehicles Using Perturbation Observer Based Robust Control. J. Power Source 2020, 448, 227444. [Google Scholar] [CrossRef]
  61. De Melo, R.R.; Tofoli, F.L.; Daher, S.; Antunes, F.L.M. Interleaved Bidirectional DC–DC Converter for Electric Vehicle Applications Based on Multiple Energy Storage Devices. Electr. Eng. 2020, 102, 2011–2023. [Google Scholar] [CrossRef]
  62. Hu, Y.; Yu, Y.; Huang, K.; Wang, L. Development Tendency and Future Response about the Recycling Methods of Spent Lithium-Ion Batteries Based on Bibliometrics Analysis. J. Energy Storage 2020, 27, 101111. [Google Scholar] [CrossRef]
  63. Dunn, J.B.; Gaines, L.; Sullivan, J.; Wang, M.Q. Impact of Recycling on Cradle-to-Gate Energy Consumption and Greenhouse Gas Emissions of Automotive Lithium-Ion Batteries. Environ. Sci. Technol. 2012, 46, 12704–12710. [Google Scholar] [CrossRef]
  64. Amarakoon, S.; Smith, J.; Segal, B. Application of Life-Cycle Assessment to Nanoscale Technology: Lithium-Ion Batteries for Electric Vehicles; United States Environmental Protection Agency: Washington, DC, USA, 2013. [Google Scholar]
  65. Notter, D.A.; Gauch, M.; Widmer, R.; Wäger, P.; Stamp, A.; Zah, R.; Althaus, H.-J. Contribution of Li-Ion Batteries to the Environmental Impact of Electric Vehicles. Environ. Sci. Technol. 2010, 44, 6550–6556. [Google Scholar] [CrossRef]
  66. Liu, T.; Tang, X.; Wang, H.; Yu, H.; Hu, X. Adaptive Hierarchical Energy Management Design for a Plug-In Hybrid Electric Vehicle. IEEE Trans. Veh. Technol. 2019, 68, 11513–11522. [Google Scholar] [CrossRef]
  67. Papadis, E.; Tsatsaronis, G. Challenges in the Decarbonization of the Energy Sector. Energy 2020, 205, 118025. [Google Scholar] [CrossRef]
  68. Jägemann, C.; Fürsch, M.; Hagspiel, S.; Nagl, S. Decarbonizing Europe’s Power Sector by 2050—Analyzing the Economic Implications of Alternative Decarbonization Pathways. Energy Econ. 2013, 40, 622–636. [Google Scholar] [CrossRef]
  69. Child, M.; Kemfert, C.; Bogdanov, D.; Breyer, C. Flexible Electricity Generation, Grid Exchange and Storage for the Transition to a 100% Renewable Energy System in Europe. Renew. Energy 2019, 139, 80–101. [Google Scholar] [CrossRef]
  70. Li, Y.; Taghizadeh-Hesary, F. The economic feasibility of green hydrogen and fuel cell electric vehicles for road transport in China. Energy Policy 2022, 160, 112703. [Google Scholar] [CrossRef]
  71. Schulz, F.; Rode, J. Public charging infrastructure and electric vehicles in Norway. Energy Policy 2022, 160, 112660. [Google Scholar] [CrossRef]
  72. Yang, C. Running battery electric vehicles with extended range: Coupling cost and energy analysis. Appl. Energy 2022, 306, 118116. [Google Scholar] [CrossRef]
  73. Podder, A.K.; Supti, S.A.; Islam, S.; Malvoni, M.; Jayakumar, A.; Deb, S.; Kumar, N.M. Feasibility Assessment of Hybrid Solar Photovoltaic-Biogas Generator Based Charging Station: A Case of Easy Bike and Auto Rickshaw Scenario in a Developing Nation. Sustainability 2022, 14, 166. [Google Scholar] [CrossRef]
  74. Pal, A.; Bhattacharya, A.; Chakraborty, A.K. Placement of Public Fast-Charging Station and Solar Distributed Generation with Battery Energy Storage in Distribution Network Considering Uncertainties and Traffic Congestion. J. Energy Storage 2021, 41, 102939. [Google Scholar] [CrossRef]
  75. Fang, Y.; Asche, F.; Novan, K. The costs of charging Plug-in Electric Vehicles (PEVs): Within day variation in emissions and electricity prices. Energy Econ. 2018, 69, 196–203. [Google Scholar] [CrossRef]
  76. Pautasso, E.; Osella, M.; Caroleo, B. Addressing the Sustainability Issue in Smart Cities: A Comprehensive Model for Evaluating the Impacts of Electric Vehicle Diffusion. Systems 2019, 7, 29. [Google Scholar] [CrossRef] [Green Version]
  77. King, N.; Burgess, M.; Harris, M. Electric vehicle drivers use better strategies to counter stereotype threat linked to pro-technology than to pro-environmental identities. Transp. Res. Part F Traffic Psychol. Behav. 2019, 60, 440–452. [Google Scholar] [CrossRef]
  78. Onat, N.C.; Kucukvar, M.; Aboushaqrah, N.N.; Jabbar, R. How sustainable is electric mobility? A comprehensive sustainability assessment approach for the case of Qatar. Appl. Energy 2019, 250, 461–477. [Google Scholar] [CrossRef]
  79. Prakash, K.; Mamun, K.A.; Islam, F.R.; Chand, A.A.; Prasad, K.A.; Goundar, K.K.; Maharaj, S. Hybrid electric vehicle: Designing a control of solar/wind/battery/capacitor/fuel cell hybrid system. In Proceedings of the 2019 29th Australasian Universities Power Engineering Conference (AUPEC), Nadi, Fiji, 26–29 November 2019; pp. 1–6. [Google Scholar]
Figure 1. Current and future trends of investment in EVs [12].
Sustainability 14 02538 g001
Figure 2. Schematic presentation of the multi-source HEV system.
Sustainability 14 02538 g002
Figure 3. Different models chosen for simulation: (a) without duct and exhaust; (b) with duct but without exhaust; (c) with duct and full exhaust and (d) with duct and partial exhaust.
Sustainability 14 02538 g003
Figure 4. Schematic illustration of the electrical and control system.
Sustainability 14 02538 g004
Figure 5. SC with DC–DC converter and two motor loads.
Sustainability 14 02538 g005
Figure 6. FC with motor load.
Sustainability 14 02538 g006
Figure 7. Measuring RPM at various excitation voltages.
Sustainability 14 02538 g007
Figure 8. Output voltages at various RPM and excitation voltages.
Sustainability 14 02538 g008
Figure 9. Algorithm for the source activation in the proposed HEV.
Sustainability 14 02538 g009
Figure 10. Simulink® model for 6 kW motor load.
Sustainability 14 02538 g010
Figure 11. Simulation results for torque, power, RPM and speed against time.
Sustainability 14 02538 g011
Figure 12. Simulation results for torque, power, voltage, SOC, and speed against time.
Sustainability 14 02538 g012
Figure 13. Simulink® block diagram showing the load powered by FC.
Sustainability 14 02538 g013
Figure 14. Simulation results for torque, power, SOC, current, and speed against time when FC is used as the source.
Sustainability 14 02538 g014
Figure 15. Battery charger Simulink® block with solar array.
Sustainability 14 02538 g015
Figure 16. Simulation results for current, voltage, and SOC against time for PV array.
Sustainability 14 02538 g016
Figure 17. Simulink® block diagram for alternator charging capacity.
Sustainability 14 02538 g017
Figure 18. Simulation results for alternator charging capacity in current, voltage, and SOC against time (s).
Sustainability 14 02538 g018
Figure 19. Velocity flow over different models: (a) without duct and exhaust; (b) with duct but without exhaust; (c) with duct and full exhaust; (d) with duct and partial exhaust.
Sustainability 14 02538 g019
Figure 20. Velocity vector over different models: (a) without duct and exhaust; (b) with duct but without exhaust; (c) with duct and full exhaust; (d) with duct and partial exhaust.
Sustainability 14 02538 g020
Figure 21. Pressure contour over different models: (a) without duct and exhaust; (b) with duct but without exhaust, (c) with duct and full exhaust; (d) with duct and partial exhaust.
Sustainability 14 02538 g021
Figure 22. Results obtained from the simulation for SC: acceleration, speed, voltage, braking power, and SOC against time (s).
Sustainability 14 02538 g022
Figure 23. Control panel of ZFZE.
Sustainability 14 02538 g023
Figure 24. Simulink® block model for ZFZE.
Sustainability 14 02538 g024
Figure 25. Results obtained from Simulink® simulation for ZFZE: acceleration, speed, battery SOC, FC SOC, SC FOC, and distance against time (s).
Sustainability 14 02538 g025
Figure 26. Opportunities related to HEVs and EVs.
Sustainability 14 02538 g026
Table 1. Summary of the literature on HEVs and EVs.
Ref.EV Description and
RE Integration
Operating Voltage (V) and Load PowerEfficiency (%)System Description and Analysis
[34]
-
Hybrid power generation
-
Wind+FC+SC
400,
110 kW
Better ESA proper simulation of power generation with electrolyze and hydrogen storage tank was conducted.
[35]
-
HEV (auto rickshaw)
-
PV+BESS
48,
5–7 kW
77 (E) and 73 (M)The system was designed using four wheels, one electric motor, a conventional with PV-assisted and parallel hybrid configuration.
[36]
-
EV
-
BESS+SC
48,
1.85 kW
70An advanced EMS directly-drive vehicle was designed.
[37]
-
HEV
-
PV+BESS
300,
3.5 kW
91 EMEMS in solar car race.
[38]
-
HEV
-
FC+SC
36,
300 W
45 FCDesign and development of FC and SC based on electric bicycle.
[39]
-
HEV
-
BESS+SC+FC+PV
42,
15 kW
Better ESPV/hydrogen-based hybrid power system combining BES/FC for HEV.
Table 2. Summary of reported issues associated with HEVs and EVs.
IssuesChallengesRef.
Power Distribution and Optimal EV Design
  • Several challenges relating to an optimal EV design and power distribution have been reported in the literature. On the other hand, the power flow and EV design, need to be improved. In-vehicle EMSs that employ a hybrid or a combination of energy sources, managing the power flow, and meeting the market’s high expectations, are crucial.
  • Due to the general complexity of the integration required among the existing systems in a vehicle, its configuration and controller design are two important difficulties. Power distribution among various components becomes more complex when the EMS is designed to minimize hydrogen consumption and increase the FC life expectancy, which is related to design optimization.
  • Due to the frequent charging from the FC to the battery and changes in the FC’s output power, power splits are a serious concern that influence the performance and service lives of the battery and FC. EMSs must be further studied and improved in terms of hardware or real-time applications to ensure the dependability of EV applications.
[43,44,45,46,47,48,49,50]
Battery Thermal Management
  • The subject of battery temperature control was also studied in the literature. Chemical processes create high temperatures, which is a key concern that affects all batteries. Batteries’ chemical properties are harmed by unusual temperatures, resulting in considerable performance declines.
  • Rechargeable batteries also require a temperature control system. A battery must, in most situations, perform at both low and high temperatures. However, its charging and discharging currents and power handling capacities are diminished by the influence of a low temperature which slows the chemical processes and transforms active chemicals.
  • On the other hand, an increasing temperature of the battery generates a set of difficult circumstances that cause abnormal chemical activity and finally result in the rechargeable batteries bursting. Whereas the Arrhenius effect can save some power, a larger current results in a higher temperature which leads to thermal runaway causing in a positive thermal response.
  • Specific efforts must be undertaken to prevent the battery from overheating. Compared to other common batteries, the Li-ion battery’s capacity increases as the temperature rises at the expense of the battery’s life.
  • As a result, more emphasis is required to solve the battery’s thermal concerns to maximize efficiency.
[43,44,51,52,53,54]
Battery Storage Life Cycle and Aging
  • Many studies have been conducted on the life cycle and aging issues of a battery energy storage system (BESS). Although the loss of performance of a battery cell owing to voltage and heat impacts has been investigated, the battery’s lifetime is also affected.
  • It is worth mentioning that using a battery cell outside its typical operating range causes permanent loss of capacity.
  • This abnormality has a cumulative effect as it reduces the battery’s life and perhaps results in its complete and permanent loss of functionality. Its lifetime decreases slowly at low temperatures (below 10 °C) owing to anode plating but substantially at high temperatures (above 60 °C) because of chemical disintegration.
[43,44,47,55,56,57]
Power Electronic Controller and Converter
  • Switching loss, high ripple current, voltage stress, high voltage gain, high impedance, optimization integration, and sophisticated control approaches have all been investigated for power electronics controllers and converters.
  • A power electronic interface is necessary for an EV. Open circuit failures cause increments in a FC stack’s ripple currents and place additional stress on the inductors which require actions to be taken before the problem gets worse. An excessive voltage, current, and transients, driver failure, inappropriate gate voltage, device damage, and transients, are all potential issues.
  • The FC system’s DC–DC converter must be boosted, and the storage device requires a bidirectional DC–DC converter. Therefore, buck-boost converters are often used in the battery and SC.
  • Therefore, to build an effective controller and converter for an EV design, further research is necessary.
[58,59,60,61]
Environmental and Decarburization
  • Focusing on sustainability of EV and carbon emission reductions is challenging. More study into the effects of EVs on carbon emissions reduction is needed. As oil prices increase and the demand for significant quantities of energy for sustainable transportation develops, automobile electrification, such as EVs, HEVs, and PHEVs, is becoming increasingly popular.
  • According to Toyota, EVs will account for more than 7% of global transportation by 2020. Despite their good impact on the environment by reducing the number of oil-based automobiles, lithium-ion batteries emit CO2 and greenhouse gases during their production and disposal. The US Environmental Protection Agency previously investigated Li-ion batteries as they use nickel- and cobalt-based cathodes, as well as solvent-based electrode processing, and discovered significant environmental impacts, including resource depletion, global warming, ecological toxicity, and human health effects, among others.
  • According to this study, using cobalt and nickel metal compounds in their production, processing, or usage of EVs may risk for respiratory, pulmonary, and neurological problems. This can be reduced by recycling Li-ion batteries to save natural resources and reduce the use of nickel and cobalt. Therefore, the environmental effects of EVs and their contributions to achieving SDGs must be improved.
[57,62,63,64,65]
Standard Regulation and Policy
  • In the EV industry, there are many concerns regarding crucial policies and regulations. The three main elements of the Kyoto Protocol the UN has defined as cost-effectively meeting their emission reduction objectives are clean development mechanisms (CDMs), carbon trading (CT), and joint implementation (JT).
  • To decarbonize Europe’s energy industry, several steps have been adopted. The economic consequences of the alternative energy plan for Europe’s power industry to lower glasshouse gas emissions by 80 to 95 percent by 2050 from those of 1990 were evaluated using a linear dynamic optimization model.
  • Using the EMS transition model created by the Lappeenranta University of Technology, Europe will transform to a 100% renewable energy system by 2050. Although a few successful programs designed to encourage the use of EVs have been implemented, more focus needs to be on the long-term planning for EV usage, including developing standards, rules, enforcement, protocols, regulations, financial incentives, and policies, need more focus.
[66,67,68,69]
Table 3. Summary of connecting SDGs to HEVs and EVs.
Ref.YearDescriptionConnecting SDGs
[70]2022A model was developed using FC to estimate the carbon emission of the hydrogen supply for an EV.
  • Economic growth
  • Sustainable cities and communities
  • Clean energy and climate action
  • Development related policies
[71]2022A public charging station was modeled and developed for EVs in Norway.
  • Economic growth
  • Sustainable cities and communities
  • Clean energy and climate action
  • Development related policies
[72]2022In relation to EV, an effective cost analysis for a BESS is presented.
  • Economic growth
  • Sustainable cities and communities
  • Clean energy and climate action
[73]2021A feasibility study of a hybrid solar PV-biogas generator-based charging station for an easy bike and auto rickshaw scenario in a developing nation was analyzed.
  • Cost of energy (COE) analysis
  • Sustainable cities and communities
  • Clean energy and climate action
  • Good health and well-being
[74]2021Public fast-charging stations (PFCSs), solar distributed generation, and BESs as well as their scheduling, were designed.
  • Sustainable cities and communities
  • Clean energy and climate action
  • Economic growth
[75]2019The maximum electricity emission rates and marginal electricity prices for charging an EV on a daily basis were assessed.
  • Cost of energy (COE) analysis
  • Sustainable cities and communities
  • Clean energy and climate action
[76]2019A direct qualitative study to determine the elements that influence individual acceptance of self-driving electric buses was conducted.
  • Sustainable cities and communities
  • Clean energy and climate action
  • Development related policies
  • Good health and well-being
[77]2019The effects of categorizing threats on EV drivers was examined.
  • Sustainable cities and communities
[78]2019A life cycle sustainability assessment was conducted for EV technologies.
  • Sustainable cities and communities
  • Clean energy and climate action
  • Development related policies
  • Good health and well-being
Table 4. In wheel motor characteristics.
CharacteristicValue
Power3000 W
Voltage72 V DC
Maximum Current70–80 A
Maximum Torque90–150 Nm
Wheel Diameter300 mm
Table 5. Battery bank specification.
CharacteristicValue
Capacity150 Ah
Bank Voltage72 V DC
Single Battery Voltage70 V
Quantity in series6
Table 6. Torque characteristics.
CharacteristicValue
Weight15,000 N
Coefficient   of   rolling   Resistance   C r r w 0.012 on asphalt
Gravitational Acceleration g10 m/s2
Radius   of   Wheel   R w h e e l 0.15 m
Friction   Factor   R f 0.1
Angle of Inclinationα
Torque (Total)τ
Table 7. Vehicle characteristics.
CharacteristicValue
RPM (maximum)1000 rpm
Speed (maximum)56.55 km/hr
Acceleration (maximum)0.262 m/s2
Revolutions per minute0.015708 m/s
Table 8. In wheel motor characteristics.
CharacteristicValue
τmax405 Nm
Wheel circumference1.7687 m
∆ speed166.8 m/mim
Angular velocity6.18 rad/s
Maximum power2.5 kW
Table 9. Capacity and size of PV source.
Solar Array SizingValue
Power rating70 W
Peak efficiency19.3%
Maximum power current4.07 A
Maximum power voltage17.2 V
Open circuit voltage21.6 V
Short circuit current4.35 A
Panel connected in series5
Table 10. Capacity and size of PV source.
ActionAcceleration (m/s2)Time (s)
Park0
Accelerate0.262100
Release Accelerator and Cruise0160
Full Brake−31000
Accelerate0.2621200
Release Accelerator and Cruise01260
Half Brake−1.52000
Accelerate0.2622005
Release Accelerator and Cruise02035
Full Brake−35000
Accelerate0.2625100
Release Accelerator and Cruise05160
Full Brake0.26220,000
Accelerate020,010
Release Accelerator and Cruise020,070
Full Brake−33500
Accelerate0.26235,010
Release Accelerator and Cruise035,070
Publisher’s Note: MDPI stays neutral with regard to jurisdictional claims in published maps and institutional affiliations.

