Abstract
When designing a product, many decisions are made that determine the environmental impacts that the product will eventually exert on our planet. Therefore, it is paramount to have considered the environmental performance already in the design phase. In this contribution, we showcase the application of the recently developed resource pressure (RP) method to assess the environmental sustainability of various carpet design alternatives. This method consists of qualitative guidelines and a quantitative indicator. With the Earth’s carrying capacity as a reference, the product system is evaluated in relation to its consumption of primary resources and the final generation of waste. Several scenarios are developed by following the design guidelines provided by this method. Those scenarios aim at identifying the most promising circular strategies for reducing the products’ resource pressure. To assess the validity of the RP method, the results are compared to a simplified LCA study. This comparison showed a close correlation for most of the considered impact categories. It confirms that the RP method can effectively predict environmental impacts across a wide range of impact categories, reducing the amount of necessary data and simplifying the calculations. It can therefore support designers in considering the environmental effects easily, from the beginning of the design process onward. Moreover, the simplicity of this method makes it attractive for application by practitioners who are not themselves experts in environmental assessments.
1. Introduction
Today’s environmental burdens are mostly caused by the extraction and usage of natural resources [1]. The safe limits for many vital Earth system processes have already been crossed [2,3], leading to the current climate crisis and biodiversity loss. Therefore, it is essential to develop solutions by which to preserve our primary resources.
The overall sustainability of a product, and, thus, the potential resource utilization efficiency, is determined to a large extent by its conception and design [4]. The European Commission report on the strategy for plastics in a circular economy (CE) shows that over 80% of the environmental impacts related to products are determined during the design stage [5]. Applying circular strategies to product design has the potential to significantly reduce the environmental impacts on our planet [6,7]. However, CE potentials for most sectors are still unclear, hindering investments into new circular business models and waste management infrastructures [8]. Moreover, the current structure, composition, and assembly of complex products such as carpets prevent closing these material cycles and, thus, pose challenges in reaching circularity. The carpet sector, however, poses great potential for circular innovation as Europe generates 1.6 million tons of post-consumer carpet waste every year, 60% of which is landfilled, 37–39% is incinerated, and only 1–3% is recycled [9].
Today, design guidance for making circular products and services environmentally sustainable is available either in the form of guidelines (e.g., [10,11]) or are based on simplified LCA approaches (e.g., [12]). Neither of the types of approaches is widely adopted in industry, as they either depend on specific knowledge or rely on time-consuming and complex procedures [7,13]. LCA is usually applied ex post, analyzing the environmental impacts of the finished products, and it has little influence on design decisions [13,14]. Furthermore, LCA was designed for analyzing the linear economy and there is a need to develop approaches for measuring circularity in a standardized way [15]. Circularity metrics, in contrast, describe the circularity of material flows only, missing their environmental (and social) implications [15,16,17]. Few studies compare the results obtained with design methods with ex post LCAs (e.g., [18,19]); however, such an assessment would be required for documenting the effectiveness of design methods.
For easy use at the company level, a scientifically sound but easy-to-apply method is required. In this contribution, we have applied the recently developed resource pressure (RP) method [7] to assess the environmental sustainability of different carpet designs and circular strategies. The RP method comprises qualitative guidelines and a quantitative indicator, with the aim of minimizing the consumption of limited resources. Respecting planetary boundaries [3], primary resource consumption is limited by the environmental impacts caused during extraction, processing, and disposal [20]. Product systems induce resource consumption both directly, through the consumption of primary materials, and indirectly, through the generation of final waste. Circularity strategies can reduce both the required primary material and the generated final losses. The RP method allows researchers to quantify on a case-by-case basis the effectiveness of circularity strategies on reducing primary resource consumption, as well as environmental impacts.
Today’s carpet industry uses a wide range of fibers [21] for the creation of a complex and multi-component structure [22]. The basic structure for tufted and woven carpets are shown in Figure 1 and include: pile yarn (loop or cut pile), primary backing, a bonding agent and a secondary backing for the former (a), and pile yarn (loop or cut pile), binding chain, stuffer (filling chain), weft yarn, and a bonding agent for the latter (b). The spectrum of materials that can be used is large: it ranges from natural fibers, like cotton (CO) and wool (WO), to synthetic fibers like polyamide-6 (PA6) or polyamide-66 (PA66), polyester (PES), polypropylene (PP), and acrylics. Therefore, numerous possible material combinations within one product are employed [23].
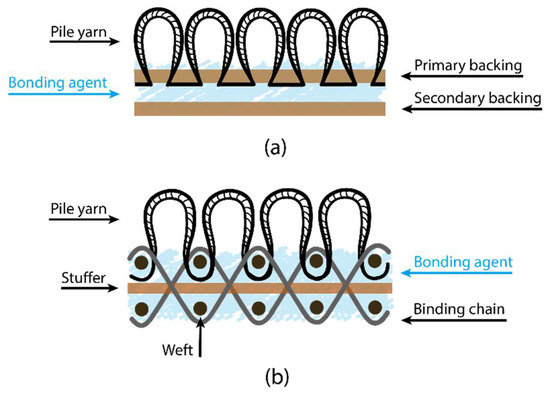
Figure 1.
The basic structure of carpet for a tufted model (a) and a woven model (b).
PA6 and wool are primarily used as pile yarn for tufted and woven carpets. The bonding agent links and secures the face fibers to the primary backing (tufting) or the supporting yarn construction (weaving). For tufted products, the secondary backing gives further stability to the carpet structure.
Additional layers, such as foam backing, although not investigated here, provide further features, such as thermal and acoustic insulation [24].
Depending on the carpet’s intended application, each of the components has a specific function and must, therefore, satisfy a set of requirements. Residential and commercial buildings require vastly different specifications [25]. Customer expectations influence both the visual design and the construction. While, e.g., wear resistance is more relevant in the commercial sector, comfort plays a large role in residential orders [25,26]. Other notable properties are insulation, wear resistance, acoustics, moisture resistance, color-fastness, light-fastness, and reflection [27]. An overall classification and rating of carpets, based on their features, can be found in the European standard for textile floor coverings, EN 1307:2014 [28].
2. Materials and Methods
The RP method is a tool for supporting design decisions, based on the utilization of resources, and its detailed description can be found in the recently published paper by Desing et al. [7]. The RP method quantifies the pressure exerted by the ecological resource budgets (ERB) [20,29,30] on the amount of a resource that is necessary to produce a product with a specific design. ERBs measure environmental impacts in relation to Earth system boundaries, originating from primary resource extraction and end-of-life (EoL) treatment. ERBs can be calculated either based on the ecological resource availability (ERA) method [20], if the absolute environmental performance of a product with regard to a defined resource consumption pattern is of concern, or based on the ecological resource potential (ERP) method [30], if the aim is to reduce the environmental impacts of a new design. Since this study focuses on design improvements, ERBs were obtained using the ERP method.
The RP method provides the designer with a tool allowing, at the same time, the reduction of the pressure on primary resources and the maximization of the utility of materials. As shown in Figure 2, the RP of a product depends on ERBs, together with product design parameters such as its mass (mproduct), manufacturing losses (γm), product lifetime (tL), primary material content (α’), recyclability (ηr) and cascadability (ηc). Those factors represent the essential elements for the calculation of the RP, according to Equation (1).
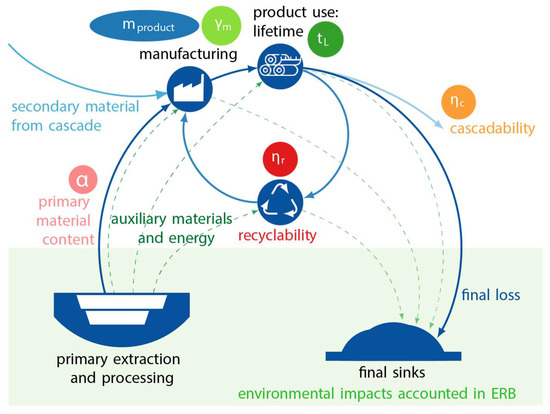
Figure 2.
Overview of the resource pressure design method, reproduced and adapted from [4].
Thus far, the RP method has not been tested on complex products, such as carpets. Therefore, the present study applies the RP method to the development and evaluation of various carpet designs and compares their results with a simplified life-cycle assessment (LCA). LCA is a well-established but ex post methodology for the assessment of environmental performance. With the on-hand comparison, the potential benefits and drawbacks of both approaches are highlighted within the context of CE. The term “simplified” refers to the fact that the LCA was established, mainly using averaged data from the database ecoinvent v3.6, instead of modeling the processes with case-specific information. All calculations for RP and the simplified LCA were carried out using Microsoft® Excel®.
3. Case Study
In collaboration with Tisca Tischhauser AG, a Swiss textile company, we assessed the environmental sustainability of different carpet designs. The various design scenarios are based on different circular strategies and demonstrate the application of the RP method.
Tisca Tischhauser AG is a full-service provider of high-quality textiles for indoor and outdoor use. The product range includes textile floor coverings, curtains, upholstery and decorative fabrics, as well as sports turf. Among others, woven and tufted carpets are produced, which were selected for this case study. For both types of carpets, different design scenarios are developed and evaluated in the present study. The two types differ significantly, both in the technique with which they are produced and also in their basic structure (see Figure 1). Due to this wide range of possibilities, it was possible to investigate different scenarios for both product groups. Environmental impacts and potential improvements in circularity and sustainability were considered separately for the two carpet types. Six to ten scenarios were developed for woven (W1–6) and tufted (T1–10) carpets, respectively. A simplified LCA was carried out for a subset of the selected scenarios and compared to the results of the RP method. The overall goal of the study was to determine the influence of design changes within each carpet type, based on the RP results.
In order to select a reference product for each of the two case studies, a screening process was carried out, comparing the available products from Tisca in each respective category. The carpet design scenarios were then developed in both categories by following the design guidelines provided in the RP method itself (Table 1) and converting those guidelines into technically feasible design choices for the respective carpet type. The latter process was supported by the expertise of the company’s personnel.

Table 1.
Carpet design scenarios (rows) for the woven (W1–6) and tufted (T1–10) types developed following the RP design guidelines (ticked columns).
For both methods (i.e., RP and LCA), the functional unit (FU) is equal to 500 m2 of commercial floor covering, having a lifespan of 10 years. The system boundaries for the LCA are defined as “cradle-to-grave”, referring to the carpet product system only, thus using the cut-off approach for secondary resources (Figure 3). This means that secondary material inputs enter the product system burden-free, i.e., without the environmental burdens related to their primary material production. Impacts for secondary materials are counted only in terms of their processing for the specific application. On the other hand, primary material inputs are evaluated, including the environmental impacts of raw material extraction. Environmental impacts for EoL treatment are considered for any processes that involve the carpet product system only; thus, this represents either incineration or recycling. Cascading and the cascaded product system are not included in the simplified carpet LCA.
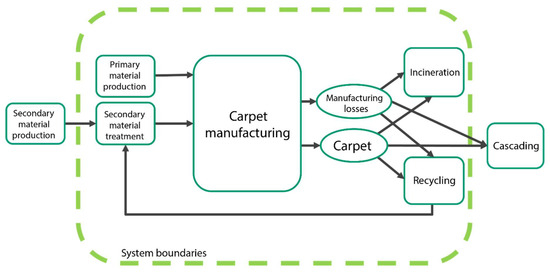
Figure 3.
Carpet product system LCA: the green dashed box represents the system boundaries for the LCA study; therefore, the environmental impacts were only evaluated for the unit processes included within the system boundaries. Elements in ovals represent the product outputs of the carpet’s manufacturing process and do not contribute to any environmental impacts themselves.
4. Results
4.1. Screening Process
The screening process across the entire range of the company’s products yielded the following general tendencies for carpet design characteristics, regarding resource pressure:
- Pile mass ↑: RP value ↑.
- RP (wool carpets) > RP (synthetic pile material).
- RP (PA66 pile material) > RP (PA6 pile material).
- RP (Commercial sector) < RP (Residential sector).
From the full range of products, one woven (W0) and one tufted (T0) carpet, both for commercial application and made from PA6 as a pile material, with average RP values, were selected as the respective reference products. The spread in terms of RP across the different products ranged from 22% lower than the selected product and 68% higher for the woven, 32% lower, and 35% higher for tufted carpets, respectively. Choosing an average product allows for a scenario involving a lighter product, as well as other designs that might lead to improvements in the carpet’s sustainability.
4.2. RP and LCA Results
The RP method aims at giving designers guidance on potential strategies to improve the sustainability of their products. Compared to the reference product, every design scenario can then be evaluated in terms of reduced resource pressure. Figure 4 shows the relative resource pressure of all considered design scenarios for woven and tufted carpets. It is essential to note that the numerical value of RP itself is irrelevant for the comparison of different design scenarios. It is only when the RP is calculated with ERA budgets that its value represents the fraction of global sustainable resource availability consumed by the production of a FU. The RP serves here as a relative score, comparing and ranking the design alternatives. Thus, it helps in identifying the best- and worst-case scenarios. We compared the RP for woven and tufted carpet scenarios separately, due to their different structures and properties, as they exhibit different potentials for design change.
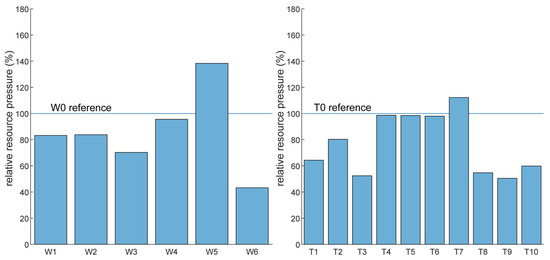
Figure 4.
Relative resource pressure for woven (left) and tufted (right) carpets and the corresponding design scenarios.
The RP results show that scenarios involving the choice of a material with large ERBs (i.e., W4, T4 and T5) do not significantly improve the RP result compared to the reference scenario. This is because the carpet’s structural elements that were subjected to this material substitution represent just a marginal part of the overall carpet, being indeed an insignificant weight-fraction of the overall carpet. Material substitutions only result in a large benefit when their share in the product and/or the difference in ERPs is large. If all the structural components of the carpet, including the pile material, were converted to materials with a larger ERP, greater improvement in the RP result could be obtained. However, material substitutions in the design are limited by the functional requirements, applications, and aesthetics, which are of crucial importance for success in the market. Moreover, the implementation of circular EoL strategies like recycling or cascading might require the use of a specific material and, therefore, represent a further limitation in the spectrum of potential material to be used.
On the other hand, reducing the mass in the product has a major impact on lowering the RP of the reference product. These scenarios (W1, T1) show much lower RP compared to the reference scenarios, as well as to the previously mentioned ones (i.e., W4 and T4–5). Carpet mass reduction with respect to the reference product is assumed to be according to the feasibility of this operation within the two types of carpets, i.e., the grade of reduction is different between woven (11% mass reduction) and tufted (21%) carpet design scenarios, due to the substantial difference in their structure. In both cases, the mass reduction is determined by the difference between the reference product and the lightest available product in the company’s portfolio. Therefore, it is not surprising that the difference between the RP result of the tufted carpet compared to its reference is of a greater magnitude than in the case of the woven carpet, but this is rather a function of which reference product was chosen.
While reducing mass leads to an intuitive reduction in RP, reducing the primary material content requires a more detailed interpretation. In these scenarios (i.e., W2 and T2), the environmental impacts related to the production of primary material are avoided by using secondary material, while the mass of the product remains unchanged. Furthermore, additional impacts related to the energy involved in the processing of secondary material are considered. For this reason, the RP value for these scenarios, even if it is advantageous with respect to the reference products, does not contribute to better performance when compared to the mass-reduction scenarios. It must be noted that there is no significant difference between W1 and W2, given the limited mass reduction that could be attained for woven carpets. Combining the mass reduction with the reduction of primary material, and assuming 100% renewable energy for the required processing of secondary material (W3 and T3), results in the lowest RP among the scenarios W0–3 and T0–3.
For recycling scenarios, a chemical recycling process is considered. Material can only be recycled when it fulfills strict requirements regarding its composition and contamination. The multi-material composition of the selected reference products does not allow the chemical recycling of the entire carpet but only of a small portion, in the case of the tufted carpet (T6), which leads to a slight improvement in the RP value compared to its reference. Consequently, a recyclable carpet was designed for the woven and tufted types of carpet that fulfill the requirements of the chemical recycling process. The structure of the so-called “recyclable carpet design” (i.e., W5 and T7) had to be changed significantly from its reference product. The RP of this recyclable carpet design with its different composition, which does not get recycled, is significantly higher than the reference product. Only when they are actually recycled (W6, T8, and T9) do they perform best.
As recycling 100% of the carpet is physically impossible, primary input material is still necessary, although in reduced quantities. Replacing this remaining primary material input with secondary material from other product systems (e.g., PET bottles) reduces the RP further (T9 in comparison to T8).
Results regarding the product cascading (T10), e.g., by using EoL carpets for insulation purposes, can reduce the RP, but these results need to be carefully interpreted, as will be explained further in the discussion section.
To validate the RP, a comparison between RP and LCA results was undertaken and is shown in Figure 5. RP, as a single-score indicator, provides clear guidance on which design scenario is the best to implement. LCA, on the other hand, provides information on a wide range of impact categories, providing a more comprehensive understanding of the environmental impacts of each scenario. This, however, adds complexity to the interpretation of the results and prevents a straightforward and unambiguous ranking. By using these two different approaches for the assessment of the environmental impacts of a product, we aimed to find out how far the “simpler” RP method could predict the more comprehensive results of an LCA. The prediction accuracy (covariance) of impacts across multiple LCA impact categories with RP is further reported in Table 2.
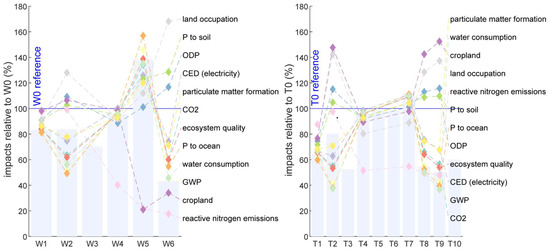
Figure 5.
RP and LCA results for the woven (left) and tufted (right) carpet scenarios. ODP = ozone depletion potential, CED = cumulative energy demand, GWP = global warming potential, P = phosphorus, CO2 = carbon dioxide.
Table 2.
Pearson covariance among RP and LCA impact categories for both woven and tufted CDSs. Results are distinguished into three categories, based on the type of correlation: green refers to a strong positive correlation (>0.8), orange to a weak but still positive correlation (0 < x < 0.8), and red to none or a negative correlation (<0). ODP = ozone depletion potential, CED = cumulative energy demand, GWP = global warming potential, P = phosphorus, CO2 = carbon dioxide.
Figure 5 shows that RP (bars) corresponds with many, but not all impact categories (lines). Furthermore, some scenarios show diverging results for different impact categories, making their interpretation more complex.
For both woven and tufted carpets, the highest difference across impact categories is shown by scenarios involving the use of secondary material and recycling, which both include the recycling process’s energy-related impacts. This means that this type of process-related impact requires particular attention in scenario modeling and the subsequent result interpretation operations through the two methodologies.
The correlation between the RP and the LCA results for the different impact categories can be expressed using Pearson covariance. Its results (summarized in Table 2) show a close correlation among RP and CO2 emissions, GWP, CED, ecosystem quality, water consumption, particulate matter formation, and the addition of phosphorus (P) to the ocean. All these impact categories identify W1, W2, W6, and T1, T2, T9 scenarios as the most promising strategies by which to improve the carpet’s sustainability.
In contrast, those results related to the other impact categories, i.e., P to the soil, reactive nitrogen (N) emissions, ODP, land occupation, and cropland use, show inversely correlated or uncorrelated results. For example, the LCA results for CO2 emissions, GWP, CED, ecosystem quality, water consumption, particulate matter formation, and the addition of P to the ocean of scenarios W6 and T8–9 follow the RP results; however, for the impact categories of P to the soil, ODP, land occupation and cropland, impacts are even worse than the reference products (W0 and T0). This is because, in the ERP calculation, the most pressing environmental category becomes limiting for each resource, which, in most cases, is CO2. As such, any impact category correlated with the limiting boundary can be predicted well, while others are not. This is, however, not a problem, as the most limiting boundary category is identified in the ERP procedure.
5. Discussion and Outlook
This study shows an application of the resource pressure method to a complex product, with a carpet consisting of several materials. The method itself is applied in a straightforward manner, with the data needed mostly covered by key performance indicators (KPIs) that are typically monitored at the company. For instance, a rejection rate in manufacturing gives additional information on the average material cost of a produced product apart from its material weight. The main challenge of the application of the method was the initial data collection and compilation inside and outside the company, as the method requires data in a new format. Nevertheless, after having defined the relevant parameters and their interconnectedness, the method can be used by product designers and technical specialists with minimal training.
It is true, however, that the results obtained through the RP method showed, in some cases, a significant divergence from the results of the LCA study. In addition, LCA results for different impact categories also differ, making it difficult to give absolute preference to one design alternative over the others. In addition, LCA has been performed only for all impact categories included in the ERP method [30], acknowledging that other impact categories may be relevant as well. A weighting procedure for the LCA impact categories could be used to obtain guidance for the prioritization of design scenarios. However, such a weighting procedure would require defining how relevant the impact categories are for this specific case study. An impact category can be of more or less relevance to the subject under investigation. Weighting is the subject of an ongoing debate among LCA practitioners because of the subjectivity that this operation involves. In contrast, the RP method provides a single score result, despite considering multiple environmental impact categories for the calculation of ERBs. The most limiting boundary and, therefore, the most relevant impact category is limiting the ERB of each material that comprises the product. Throughout this procedure, all impact categories can be taken into account and the one most relevant with respect to Earth system boundaries is automatically selected. The limiting boundary for all the materials comprising the carpet is CO2 emissions, and the RP and LCA results for the related impact categories are strongly correlated (>0.85, see Table 2). This way, even if not all indicators point in the same direction, the RP result should be followed, keeping in mind that there are other impact categories that may suggest something different. Thus, an added, simplified LCA might help with choosing between two similar RP scenarios.
The scope of this RP-based study is still limited to a scenario of cradle-to-gate plus the additional EoL impacts. Environmental impacts from the use phase (e.g., through cleaning or wear) have been neglected in the present calculations. Furthermore, as we have selected the so-called “cut-off” system model, impacts occurring in other but related product systems (e.g., the product system using cascaded material from the carpet) are excluded. Therefore, future studies should try to include these systems as well.
The study is further limited to a chosen set of scenarios. Further scenarios, which could be of relevance for carpets, are possibilities for the cascading use of waste carpets, life extensions, or the use of alternative materials (e.g., bio-based polymers [31]). Cascadability, for instance, is not only a function of the material’s properties and the product requirements but also of the available market. Thus, only a fraction of the material can be considered for cascading, the fraction for which an actual and large enough market exists [7]. Reported alternative applications for carpet waste include equestrian surface materials [32], low-cost composite tooling materials [33], eco-efficient lightweight concrete [34], noise barriers for highway and infrastructure applications [35], and injection-molded thermoplastics [32]. Studies investigating the potential application of cascaded carpet in structural composites have been extensively reviewed by Sotayo et al. [36], showing a vast range of alternative processes for carpet waste to be diverted from EoL treatment. Using carpets as an alternative raw material in the production of acoustic panels, for example, is already feasible [35,37,38,39]. Cascading, however, should be evaluated together with the up- and downstream applications. Detailed studies need to be carried out, comparing the resulting environmental impacts of the treatment of carpets to produce such a finished product, and verifying whether this would represent an advantage over the current state of the art. Another interesting aspect that should be taken into account is the end of life of the “secondary product”. If the acoustic panels could be recycled at the end of their life, thus allowing the recovery of at least part of the raw materials to produce new products, this would be a mechanism perfectly in line with the circular economy. On the other hand, if these products were not recyclable, this would, in a way, be prolonging the lifespan of the materials and, thus, delaying but not preventing the final loss.
The resource pressure method can serve as an absolute environmental indicator [7], assessing the absolute environmental sustainability of an item with regard to Earth system boundaries. However, resource budgets need to be calculated alongside the ERA method [20], as these are absolutely sustainable resource budgets under a specified allocation approach. To be useful in guiding design decisions [7,20], “desirable” resource budgets need to be defined based on a set of societal values, guaranteeing the fulfillment of basic needs for a decent life for all. Using these desirable ERA budgets will allow the setting of targets for the reduction of primary resource consumption for society and regarding specific products [40].
6. Conclusions
The circular design of carpets can reduce resource pressure significantly. However, a design for recycling alone leads to a higher RP; only when an item is recycled can it yield substantial improvements. This requires companies, consumers, and countries to ensure that circular strategies are implemented to their full capacity. It is not only new business models that can help but also regulations and take-back schemes. The organization of reverse logistics and ownership questions need to be addressed. More transparent supply chains can enable better recycling [41].
The RP method has proved to be applicable to complex products and effective in guiding design decisions. In comparison with LCA, RP correlates with many impact categories; however, this is not the case with all categories, thus requiring a careful interpretation of the obtained results.
The RP method still showed significant potential in providing design guidance in the context of CE, successfully integrating all the relevant design parameters in a very simple and straightforward structure. The RP method constitutes an initial step in promoting the transition toward CE, enabling designers to include environmental considerations in the product design process. The present work has shown that recycling and using secondary material input are the most promising strategies to improve carpet sustainability. Further evaluations, also including the economic and social aspects related to CE, need to be carried out in order to assess the feasibility of bringing the identified circular strategies into practice. From a purely methodological perspective, the RP method showed several advantages in supporting the decision-making process. Unlike LCA, it avoids the need to investigate which impact categories are relevant or not in the context of the case study, still taking into account the most relevant impact categories in relation to the boundaries. Therefore, the RP method proved to be more suitable in the context of product design from a CE perspective. However, it could still be associated with an LCA study to obtain more detailed information across a wider range of impact categories. Future progression in the RP method through more comprehensive data, tools for estimating the necessary parameters, and potential adaptations to special cases may result in its establishment as an independent method, therefore providing scientific guidance in the design phase to a wider spectrum of users.
Author Contributions
Conceptualization, H.D. and B.M.Q.; methodology, H.D.; validation, H.D. and R.H.; formal analysis, V.L.; investigation, V.L. and H.D.; resources, B.M.Q. and R.H.; data curation, V.L. and B.M.Q.; writing—original draft preparation, V.L.; writing—review and editing, all authors; visualization, H.D. and V.L.; supervision, H.D. and B.M.Q.; project administration, B.M.Q. and R.H.; funding acquisition, R.H. and V.L. All authors have read and agreed to the published version of the manuscript.
Funding
V.L. was funded by the EIT Climate-KIC Master Label Program and Tisca Tischhauser AG. H.D. was funded by the Swiss National Science Foundation (SNSF) in the framework of the project “LACE—Laboratory for an Applied Circular Economy” (grant number 407340_172471) as part of the National Research Program “Sustainable Economy: resource-friendly, future-oriented, innovative” (NRP 73).
Institutional Review Board Statement
Not applicable.
Informed Consent Statement
Not applicable.
Data Availability Statement
The data presented in this study may be available on request from the corresponding author. The data are not publicly available due to their confidential character.
Acknowledgments
V.L. acknowledges Nick Tischhauser, Volkmar Reichmann, Annett Waibel, Oliver Mildner, Pascal Weber and Tina Korthing for the support in providing all the technical data necessary to carry out the study presented in this paper.
Conflicts of Interest
M.Q., as an employee of Tisca, has collected data, edited the manuscript, and vetoed the inclusion of data if that data pertains to innovation that is yet to be published and marketed. No data was changed or misrepresented. V.L. is similarly bound by an NDA. All other authors declare no conflict of interest.
References
- United Nations Environment Programme—UNEP. Global Resource Outlook; UNEP: Nairobi, Kenya, 2019.
- Rockström, J.; Steffen, W.; Noone, K.; Lambin, E.; Lenton, T.M.; Scheffer, M.; Folke, C.; Schellnhuber, H.J.; De Wit, C.A.; Hughes, T.; et al. Planetary Boundaries: Exploring the Safe Operating Space for Humanity. Ecol. Soc. 2009, 14, 1–33. [Google Scholar] [CrossRef]
- Steffen, W.; Richardson, K.; Rockström, J.; Cornell, S.E.; Fetzer, I.; Bennett, E.M.; Biggs, R.; Carpenter, S.R.; de Vries, W.; de Wit, C.A.; et al. Planetary Boundaries: Guiding Human Development on a Changing Planet. Science 2015, 347, 1259855. [Google Scholar] [CrossRef] [Green Version]
- Reuter, M.A.; van Schaik, A.; Gutzmer, J.; Bartie, N.; Abadías-Llamas, A. Challenges of the Circular Economy: A Material, Metallurgical, and Product Design Perspective. Annu. Rev. Mater. Res. 2019, 49, 253–274. [Google Scholar] [CrossRef]
- European Commission. A European Strategy for Plastics in a Circular Economy. 2018. Available online: https://eur-lex.europa.eu/legal-content/EN/TXT/?qid=1516265440535&uri=COM:2018:28:FIN (accessed on 18 December 2020).
- Desing, H.; Brunner, D.; Takacs, F.; Nahrath, S.; Frankenberger, K.; Hischier, R. A Circular Economy within the Planetary Boundaries: Towards a Resource-Based, Systemic Approach. Resour. Conserv. Recycl. 2020, 155, 104673. [Google Scholar] [CrossRef]
- Desing, H.; Braun, G.; Hischier, R. Resource Pressure—A Circular Design Method. Resour. Conserv. Recycl. 2021, 164, 105179. [Google Scholar] [CrossRef]
- Wilts, H. Germany on the Road to a Circular Economy? Friedrich Ebert Stiftung: Bonn, Germany, 2016. [Google Scholar]
- Deutsche Umwelthilfe, e.V. Swept under the Carpet: The Big Waste Problem of the Carpet Industry in Germany; Environemntal Action Germany: Radolfzell, Germany, 2017. [Google Scholar]
- Bovea, M.D.; Pérez-Belis, V. Identifying Design Guidelines to Meet the Circular Economy Principles: A Case Study on Electric and Electronic Equipment. J. Environ. Manag. 2018, 228, 483–494. [Google Scholar] [CrossRef]
- Toxopeus, M.E.; van den Hout, N.B.; van Diepen, B.G.D. Supporting Product Development with a Practical Tool for Applying the Strategy of Resource Circulation. Procedia CIRP 2018, 69, 680–685. [Google Scholar] [CrossRef]
- Broeren, M.L.M.; Molenveld, K.; van den Oever, M.J.A.; Patel, M.K.; Worrell, E.; Shen, L. Early-Stage Sustainability Assessment to Assist with Material Selection: A Case Study for Biobased Printer Panels. J. Clean. Prod. 2016, 135, 30–41. [Google Scholar] [CrossRef]
- Brundage, M.P.; Bernstein, W.Z.; Hoffenson, S.; Chang, Q.; Nishi, H.; Kliks, T.; Morris, K.C. Analyzing Environmental Sustainability Methods for Use Earlier in the Product Lifecycle. J. Clean. Prod. 2018, 187, 877–892. [Google Scholar] [CrossRef]
- Desing, H. Product and Service Design for a Sustainable Circular Economy; ETH Zürich: Zürich, Switzerland, 2021. [Google Scholar]
- Rigamonti, L.; Mancini, E. Life Cycle Assessment and Circularity Indicators. Int. J. Life Cycle Assess. 2021, 26, 1937–1942. [Google Scholar] [CrossRef]
- Haupt, M.; Hellweg, S. Measuring the Environmental Sustainability of a Circular Economy. Environ. Sustain. Indic. 2019, 1–2, 100005. [Google Scholar] [CrossRef]
- Corona, B.; Shen, L.; Reike, D.; Rosales Carreón, J.; Worrell, E. Towards Sustainable Development through the Circular Economy—A Review and Critical Assessment on Current Circularity Metrics. Resour. Conserv. Recycl. 2019, 151, 104498. [Google Scholar] [CrossRef]
- Schöggl, J.-P.; Baumgartner, R.J.; Hofer, D. Improving Sustainability Performance in Early Phases of Product Design: A Checklist for Sustainable Product Development Tested in the Automotive Industry. J. Clean. Prod. 2017, 140, 1602–1617. [Google Scholar] [CrossRef]
- Suppipat, S.; Teachavorasinskun, K.; Hu, A.H. Challenges of Applying Simplified LCA Tools in Sustainable Design Pedagogy. Sustainability 2021, 13, 2406. [Google Scholar] [CrossRef]
- Desing, H.; Braun, G.; Hischier, R. Ecological Resource Availability: A Method to Estimate Resource Budgets for a Sustainable Economy. Glob. Sustain. 2020, 3, e31. [Google Scholar] [CrossRef]
- Chaudhuri, S.K. 2—Structure and properties of carpet fibres and yarns. In Advances in Carpet Manufacture, 2nd ed.; Goswami, K.K., Ed.; The Textile Institute Book Series; Woodhead Publishing: Sawston, UK, 2018; pp. 17–34. [Google Scholar]
- Wang, Y.; Zhang, Y.; Polk, M.; Kumar, S.; Muzzy, J. Recycling of Carpet and Textile Fibers. In Plastics and the Environment; Andrady, A.L., Ed.; John Wiley & Sons: New York, NY, USA, 2005; pp. 697–725. ISBN 9780471721550. [Google Scholar]
- The Carpet and Rug Institute (CRI). The Carpet Primer; The Carpet and Rug Institute, Inc.: Dalton, GA, USA, 2012. [Google Scholar]
- Ege Carpets. Carpet Handbook; Ege Carpets. egecarpets, Print.: Herning, Denmark, 2018. [Google Scholar]
- Whitefoot, D. 1—Carpet types and requirements. In Advances in Carpet Manufacture; Goswami, K.K., Ed.; Woodhead Publishing Series in Textiles; Woodhead Publishing: Sawston, UK, 2009; pp. 1–18. ISBN 978-1-84569-333-6. [Google Scholar]
- Baranwal, B. 17—Classification of carpets. In Advances in Carpet Manufacture, 2nd ed.; Goswami, K.K., Ed.; The Textile Institute Book Series; Woodhead Publishing: Sawston, UK, 2018; pp. 467–483. [Google Scholar]
- Ege Carpets. The Architect’s Guide to Choosing the Right Carpet; Ege Carpets Online Guide: Herning, Denmark, 2019. [Google Scholar]
- EN 1307:2014; Textile Floor Coverings Classification. European Committee for Standardization (CEN): Brussels, Belgium, 2014.
- Desing, H.; Widmer, R.; Beloin-Saint-Pierre, D.; Hischier, R.; Wäger, P. Powering a Sustainable and Circular Economy—An Engineering Approach to Estimating Renewable Energy Potentials within Earth System Boundaries. Energies 2019, 12, 4723. [Google Scholar] [CrossRef] [Green Version]
- Desing, H.; Braun, G.; Hischier, R. Ecological Resource Potential. MethodsX 2020, 7, 101151. [Google Scholar] [CrossRef]
- Ivanović, T.; Hischier, R.; Som, C. Bio-Based Polyester Fiber Substitutes: From GWP to a More Comprehensive Environmental Analysis. Appl. Sci. 2021, 11, 2993. [Google Scholar] [CrossRef]
- Jain, A.; Pandey, G.; Singh, A.K.; Rajagopalan, V.; Vaidyanathan, R.; Singh, R.P. Fabrication of Structural Composites from Waste Carpet. Adv. Polym. Technol. 2012, 31, 380–389. [Google Scholar] [CrossRef]
- Mishra, K.; Das, S.; Vaidyanathan, R. The Use of Recycled Carpet in Low-Cost Composite Tooling Materials. Recycling 2019, 4, 12. [Google Scholar] [CrossRef] [Green Version]
- Fashandi, H.; Pakravan, H.R.; Latifi, M. Application of Modified Carpet Waste Cuttings for Production of Eco-Efficient Lightweight Concrete. Constr. Build. Mater. 2019, 198, 629–637. [Google Scholar] [CrossRef]
- Mishra, K.; Vaidyanathan, R.K. Application of Recycled Carpet Composite as a Potential Noise Barrier in Infrastructure Applications. Recycling 2019, 4, 9. [Google Scholar] [CrossRef] [Green Version]
- Sotayo, A.; Green, S.; Turvey, G. Carpet Recycling: A Review of Recycled Carpets for Structural Composites. Environ. Technol. Innov. 2015, 3, 97–107. [Google Scholar] [CrossRef]
- Lakshminarayanan, K. Scaling Up of Manufacturing Processes of Recycled Based Carpet Composites; Oklahoma State University: Stillwater, OK, USA, 2011. [Google Scholar]
- Asdrubali, F. Survey on The Acoustical Properties of New Sustainable Materials for Noise Control. In Proceedings of Euronoise; European Acoustics Association: Tampere, Finland, 2014. [Google Scholar]
- Pan, G.; Zhao, Y.; Xu, H.; Ma, B.; Yang, Y. Acoustical and Mechanical Properties of Thermoplastic Composites from Discarded Carpets. Compos. Part B Eng. 2016, 99, 98–105. [Google Scholar] [CrossRef] [Green Version]
- Desing, H.; Braun, G.; Hischier, R. The Resource Reduction Index—Evaluating Product Design’s Contribution to a Sustainable Circular Economy. In Proceedings of the European Roundtable on Sustainable Consumption and Production 2021, Graz, Austria, 8–10 September 2021. [Google Scholar]
- Braun, G.; Som, C.; Schmutz, M.; Hischier, R. Environmental Consequences of Closing the Textile Loop—Life Cycle Assessment of a Circular Polyester Jacket. Appl. Sci. 2021, 11, 2964. [Google Scholar] [CrossRef]
Publisher’s Note: MDPI stays neutral with regard to jurisdictional claims in published maps and institutional affiliations. |
© 2022 by the authors. Licensee MDPI, Basel, Switzerland. This article is an open access article distributed under the terms and conditions of the Creative Commons Attribution (CC BY) license (https://creativecommons.org/licenses/by/4.0/).