Article

Multiple Melting Temperatures in Glass-Forming Melts

by
Robert F. Tournier
1 and
Michael I. Ojovan
2,3,*
1
UPR 3228 Centre National de la Recherche Scientifique, Laboratoire National des Champs Magnétiques Intenses, European Magnetic Field Laboratory, Institut National des Sciences Appliquées de Toulouse, Université Grenoble Alpes, F-31400 Toulouse, France
2
Department of Materials, Imperial College London, London SW7 2AZ, UK
3
Department of Radiochemistry, Lomonosov Moscow State University, 119991 Moscow, Russia
*
Author to whom correspondence should be addressed.
Sustainability 2022, 14(4), 2351; https://doi.org/10.3390/su14042351
Submission received: 29 December 2021 / Revised: 10 February 2022 / Accepted: 14 February 2022 / Published: 18 February 2022
(This article belongs to the Section Sustainable Materials)

Abstract

:
All materials are vitrified by fast quenching even monoatomic substances. Second melting temperatures accompanied by weak exothermic or endothermic heat are often observed at Tn+ after remelting them above the equilibrium thermodynamic melting transition at Tm. These temperatures, Tn+, are due to the breaking of bonds (configurons formation) or antibonds depending on the thermal history, which is explained by using a nonclassical nucleation equation. Their multiple existence in monoatomic elements is now demonstrated by molecular dynamics simulations and still predicted. Proposed equations show that crystallization enthalpy is reduced at the temperature Tx due to new vitrification of noncrystallized parts and their melting at Tn+. These glassy parts, being equal above Tx to singular values or to their sum, are melted at various temperatures Tn+ and attain 100% in Cu46Zr46Al8 and 86.7% in bismuth. These first order transitions at Tn+ are either reversible or irreversible, depending on the formation of super atoms, either solid or liquid.

1. Introduction

Liquid–liquid phase transitions occur in glass-forming melts below and above Tm, the equilibrium thermodynamic melting transition of crystals. These transitions are driven by the density separation of two liquid states existing in all supercooled and overheated materials, including pure elements in which two liquid phases of the same composition coexist [1,2,3,4,5,6,7,8,9,10,11,12,13,14,15]. Denser glassy phases are built by vapor deposition below the glass transition temperature Tg, leading to higher glass transition temperatures and first order transitions toward liquid states [16,17,18,19]. Glacial phases with higher values of Tg result from first order transitions between Tg and Tm [20,21,22,23,24,25]. Denser phases, called G-Phases, are obtained in liquid elements by numerical simulations at very high heating rates, leading to second melting temperatures far above Tm [26,27,28,29]. Glass-forming melts undergo liquid–liquid transitions with endothermic or exothermic latent heats at nucleation temperatures Tn+ higher than Tm [30,31,32,33,34,35,36]. First order transitions are observed at temperatures Tn+ above Tm with nuclear magnetic resonance by cooling a homogeneous liquid, followed by the homogeneous nucleation of growth nuclei below Tn+, leading to melt crystallization [37,38]. Multiple liquid–liquid transitions were observed at low heating rates in bismuth [39,40] and glass-forming melts of Cu-Zr-Al [41]. It is the purpose of this publication to relate the various glass phases to melting transitions above Tm, following proposals of H. Tanaka [15,42].
Liquid−liquid structure transition plays an important role in the final microstructure and the properties of solid alloys [43]. Solidifying Bi2Te3 alloys after melting above Tn+ followed by various cooling rates refined the microstructure and increased the hardness with the cooling rate [44,45]. Solidifying magnetic melts after overheating below Tn+ in high magnetic fields built textured congruent and noncongruent substances [46], due to the presence of growth nuclei in melts above Tm. The classical nucleation equation cannot explain such nucleation phenomena [47,48].
A nonclassical nucleation equation involving two liquid states was built by adding an enthalpy contribution, εHm, with ε depending on θ2 = (T − Tm)2/Tm2 and being a fraction of the crystal melting heat, Hm, to complete the Gibbs free energy of nuclei above and below Tm [49]. The undercooling rates of liquid elements were predicted, leading to an average minimum value of ε = 0.217 for θ = 0 due to the Lindemann coefficient at Tm [50]. The nucleation equations of liquids 1 and 2 were used to successfully predict the specific heat jump at the glass transition temperature Tg, the Vogel–Fulcher–Tammann (VFT) temperatures of fragile liquids above Tm/3 [51] and the first temperature, Tn+ [52]. The nature of surviving entities are superclusters (super atoms), or bonds and configurons, melted by liquid homogeneous nucleation instead of surface melting. This completed classical nucleation equation successfully predicts their presence above Tm [53,54] and their melting by homogeneous nucleation. The enthalpy and entropy variations of supercooled water at TLL = 228.5 K [55] during the first cooling were predicted [56]. The formation, below Tg, of a glacial phase called Phase 3, having an enthalpy equal to the difference between those of liquids 1 and 2, explained why the transition at TLL disappears during the first heating. The theoretical first order transitions of Phase 3, under pressure, reproduced those found by Speedy and Angell [57]. The phase diagram of water confined into carbon nanotubes was similar to that predicted by numerical simulations [58,59].
The thermodynamic properties of glass-forming melts are easy to predict when Tg and Tm are known. The singular enthalpy values of Phase 3 are zero and those calculated at T = Tm, Tg, Tom, the VFT temperature of liquid 1 and the first temperature Tn+. The nucleation equations of glacial phases used these singular enthalpies as latent heats to fix the entropy driven transition temperatures [60,61] of triphenyl phosphite [22,25], D-mannitol [24], n-butanol [23,62,63], and Zr41.2Ti13.8Cu12.5Ni10Be22.5 [35,36]. The stable and ultrastable glasses formed by vapor deposition had enthalpies equal to singular values and their transition temperatures at Tg are driven by them. Other melts also had enthalpy driven transitions, such as Ti34Zr11Cu47Ni8 [64], and Co81.5B18.5 [43], in agreement with the predictions [61]. A critical supercooling and overheating rate, ΔT/Tm = 0.198 of liquid elements was predicted, in agreement with experiments on Sn droplets [65].
Phase 3 formation has, for its origin, a second order phase transition associated with critical exponents due to bonds breaking (configurons formation) when a glass is heated through Tg [66,67,68,69,70]. The Gibbs free energy of configurons disappears at Tn+ instead of Tg [58,71,72]. The debate about the absence and the presence of a phase transition at Tg is probably solved by these considerations.
The nonclassical nucleation model predicted the G-phase formation equivalent to Phase 3 formation in liquid elements via first order transitions, and the second melting temperatures observed by molecular dynamics simulations at very high heating rates [73].
The question of their observation at low heating rates was raised, considering that the crystallization enthalpy of these elements would be reduced and recovered via liquid–liquid transitions occurring above Tm [73]. The singular values of the latent heats in all glass-forming melts could correspond to percolation thresholds at various temperatures.
The coexistence of glassy phases with crystals is known and viewed as being due to phase separation after annealing near Tx, the crystallization temperature of glass-forming melts. This coexistence could result, in fact, from the presence of a glassy fraction in nanocrystallized materials having a glass transition temperature, Tg, higher than Tm, as already shown for liquid elements [73].
This paper is devoted to the second vitrification of melt fractions at first order transition temperatures, Tx, coexisting with crystals formation and predictions of multiple melting temperatures, Tn+, of this glassy fraction above Tm from singular enthalpies of glass-forming melts using a renewed completed classical nucleation equation and the configuron concept in relation with percolation thresholds. The reduction in the crystallization heat of polymers is well known and could be due to a glassy phase melted at much higher temperatures than Tm.

2. The Homogenous Nucleation of Two Glassy States

2.1. The Bulk Glassy State Below Tg

The Gibbs free energy change for a nucleus formation in a melt is given by (1) [49]:
G ls = θ   ε ls H m / V m × 4 π R 3 / 3 + 4 π R 2 σ ls ,
where R is the nucleus radius and, following Turnbull [47], σls its surface energy, given by (2), θ the reduced temperature (T − Tm)/Tm, ΔHm the melting enthalpy at Tm, and Vm the molar volume:
σ ls V m / N A 1 / 3 =   α ls H m / V m ,
A complementary enthalpy, εls × ΔHm/Vm, is introduced, authorizing the presence of growth nuclei above and below Tm, with εls being positive or negative above Tm depending on its increase or decrease with θ. In previous works, εls was only positive [49]. The discovery of positive or negative enthalpy above Tm related to the presence of antibonds or bonds sets this new rule [72]. The classical nucleation equation is obtained for εls = 0 and leads to a homogeneous liquid above Tm.
The critical thermally activated energy barrier, ΔG*ls/kBT, is calculated in (3), assuming dεls/dR = 0:
G ls * k B T = 16 π S m   α ls 3 3 N A k B 1 +   θ θ ε l s 2 ,
where ΔSm is the melting entropy [47,49,74]. This critical parameter is no longer infinite at the melting temperature Tm, because εls is not equal to zero. This event now occurs above Tm for θ = εls. The nucleation rate J = Kv exp(−ΔG*ls/kBT) is equal to 1 when (4) is respected:
G ls * / k B T   =   ln K v ,
The surface energy coefficient αls in (2) is determined from (3,4) and equal to (5):
α ls 3 = 3 N A k B   1 +   θ θ ε ls 2 16 π S m ln K v ,
The nucleation temperatures θn− and θn+ obtained for d α ls 3 /dθ = 0 obey (6):
d α ls 3 / d θ   ( θ n + ε ls ) 3 θ n + 2   ε ls = 0 ,
There are two families of nucleation temperatures: θn− = (εls − 2)/3 far below Tm and θn+= εls above Tm. In addition to the nucleation temperatures Tn− below Tm, the existence of a homogenous nucleation temperature Tn+ above Tm is confirmed by many experiments, observing the undercooling versus the overheating rates of liquid elements, and glass-forming melts [43,65,75,76,77,78]. This nucleation temperature has confirmed the existence of a second melting temperature, Tn+, of growth nuclei above Tm, and of their homogeneous nucleation at temperatures weaker than θn+, as shown in several publications [30,31,32,33,34,35,36,37,38,39,79,80,81,82].
The coefficient εls of the initial liquid state, called liquid 1, is a quadratic function of θ in (7) [49] for εls > 0 above Tm in (1):
ε ls = ε ls 0 ( 1 θ 2 / θ 0 m 2 ) ,
where θ0m is the Vogel–Fulcher–Tammann (VFT) reduced temperature, leading to εls = 0 for θ = θ0m, and the VFT temperature, T0m, of many fragile liquids being equal to ≅ 0.77 Tg. This quasi-universal value is known for numerous fragile liquids, including atactic polymers [83,84].
New liquid states are obtained for θ = θn+ = εls and θ= θn−= (εls − 2)/3, where εls is given in (7). The reduced nucleation temperatures, θn−, are solutions of the quadratic equation (8):
ε ls 0 θ n 2 / θ 0 m 2 + 3 θ n + 2 ε ls 0 ε   = 0 ,   or   ε l s θ = 0 = 3 θ n + 2 ε / 1 θ n 2 θ 0 m 2
where Δε is an enthalpy–coefficient change, which can induce a first order transition [52].
There is a minimum value of εls0 plotted as a function of θ0m using (8) for Δε = 0 and θn− = (εls − 2)/3, determining the relation (9) between θ20m and εls0, for which the two solutions of (8) are equal in fragile liquids. These values define the temperature where the surface energy is minimum and θ20m and εls0 obey (9) and (10):
θ 0 m 2 = 8 9 ε ls 0 4 9 ε ls 0 2 ,
ε ls θ   = 0 = ε ls 0 = 1.5 θ n + 2 =   a θ g + 2 ,
Equation (9) leads to T0m = 0.769 × Tg for a = 1, in agreement with many experimental values.
All melts and even liquid elements undergo, in addition, a bulk glass transition because another liquid state called liquid 2 exists, characterized by an enthalpy coefficient, εgs, given by (11), inducing an enthalpy change from that of liquid 1 at the thermodynamic transition at θg [50]:
ε gs = ε gs 0 ( 1   θ 2 / θ 0 g 2 ) ε ,
where θ0g2 and εgs0 obey (12) and (13) for εls > 0 and Δε is zero at the glass transition:
θ 0 g 2 = 8 9 ε gs 0 4 9 ε gs 0 2 ,
ε gs θ   = 0 =   ε gs 0 = 1.5 θ n + 2 = 1.5 θ g + 2 ,
The reduced nucleation temperatures θn− are solutions of the quadratic Equation (14):
ε g 0 θ n 2 / θ 0 g 2 + 3 θ n + 2   ε gs 0 ε   = 0 ,   or   ε g s θ = 0 = 3 θ n + 2 ε / 1 θ n 2 θ 0 g 2
where Δε is the enthalpy coefficient change inducing a first order transition [52,62]. Equations (8) and (14) lead to the same nucleation temperature, Tn− = Tg, for the same coefficient, Δε, in fragile liquids.

2.2. The Glassy State of Phase 3 up to the Melting Temperature Tn+ above Tm

The difference between the coefficients εls and εgs, Δεlg in (15), determines the Phase 3 and the configuron enthalpies when the quenched liquid has escaped crystallization [55,71]:
ε lg θ = ε ls ε gs = [ ε ls 0 ε gs 0 ε θ 2 ε ls 0 θ 0 m 2 ε gs 0 θ 0 g 2 ] ,
The assumption of a = 1 in (10), defining the value of T0m in (9), is the unique value for which the activation energies B1RT/(T − T0m) and B2RT/(T − T0g) of liquids 1 and 2 are equal at Tg, leading to an activation energy equal to zero for Phase 3 [71].
When the enthalpy coefficients εls (θ) and εgs (θ) are negative in (1), the phase 3 enthalpy coefficient Δεlg (θ) becomes equal to (16):
ε lg θ = ε ls ε gs = [ ε ls 0 ε gs 0 ε θ 2 ε ls 0 θ 0 m 2 ε gs 0 θ 0 g 2 ] ,
It increases with θ in (15) or decreases in (16), because of its dependence on the thermal history, and disappears at Tn+. Two reduced glass transition temperatures, θg and −θg, exist. Another analogous equation leading to Δεlg (θ), given in (16), can be determined using the new coefficients, εls0 and εgs0, in (10) and (13), obtained by changing θg in −θg and θ20m, θ20g deduced from (9) and (12) using these new values of εls0 and εgs0.
These new considerations show the existence of a glassy state of a melt fraction disappearing at the virtual transition temperature, T′g= 2Tm − Tg, governing the thermodynamics of all Phases 3, including those nucleated by first order transitions. This phenomenon of double glass state occurs because all glass-forming melts heated from their glass state are composites containing an ordered fraction of percolating bonds or antibonds (15 ± 1 % minimum) and a homogeneous liquid (85 % maximum) [58,71,72]. The first glass transition temperature, observed at Tg below Tm by heating, corresponds to the percolation of configurons in the bulk liquid, while the second transition, only due to Phase 3, disappears at Tn+, far above Tm. The partial glass state is preserved up to the nucleation temperature θn+= Δεlgg) because the ordered fraction remains equal to the percolation threshold observed at θg below Tm. The melt transformations at θn+ are sharp and only observable below the virtual glass transition occurring at θ′g = −θg. Note that the two VFT temperatures above Tm corresponding to this virtual glass transition are also virtual because θ20m and θ20g are negative in this case.

3. Reduction of the Crystallization Enthalpy at the Crystallization Temperature Tx

The enthalpy recovery during heating is endothermic at Tn+ for bonds and exothermic for antibonds breaking [72]. The total melting enthalpy, H, depends on the reduced temperature, θn+, because this homogeneous nucleation temperature, Tn+, occurs above Tm with the enthalpy change given by Equation (17) [1]:
ε lg   θ n + = ± θ n +   where   θ n + < θ g
Heating from the glass state below Tg can induce, at the same time, a first order transition at Tx, toward crystallization or not and nucleation of a new glassy state of Phase 3 with a latent heat (−ΔεHm) and a new glass transition temperature T′g = 2Tm − Tg. The reduced temperature θx is given by Equation (14), with Δε equal to singular values of the enthalpy coefficient Δεlg of Phase 3. These singular values are zero, Δεlg0 /2, θn+, Δεlg0, −Δεlg0m) or the sum of several singular values as observed in liquid elements and as expected from hidden thresholds of configurons [73]. The crystallization enthalpy at Tx of the liquid phase coexisting with glassy Phase 3 is given by (18):
H cr = H m 1 + ε ,
The melting heat, H3m, of each Phase 3 depends on its singular value and its contribution to Δε at Tx. This melting, depending on the heating rate, occurs at various reduced temperatures, θn+, defined for each singular value of Δε, or is associated with other singular values or leads to a unique melting temperature θn+ = Δε as shown in Equation (17):
H 3 m = H m × θ n + ,
The temperature Tx separates the two domains of glassy phases between Tg and Tn+. Below Tg = Tx, the bulk glassy domain takes place after the first-order transition at Tx, while the glassy fractions induced at Tx disappear at Tn+ without attaining the virtual glass transition temperature T′g equal to (2Tm − Tg). The glass enthalpy disappears at Tn+ < T′g by heating from − ε H m to 0 , giving rise to homogeneous liquid.

4. Gleaning Information in Published Works to Predict the Crystallized Fraction from the Knowledge of Tx or Melting Temperatures of Various Phases 3 above Tm

4.1. Three Melting Temperatures of Bismuth Were Observed above Tm in Two Different Experiments

DSC measurements of bismuth with a heating rate of 0.083 K/s showed two endothermic transitions, at T1n+ = 504.9 °C (778 K) and T2n+= 511.5 K (784.6 K), above the melting temperature Tm = 544.5 K, as shown in Figure 1 [39]. A third transition was observed with the density at T3n+ = 1013 K in another experiment, in the absence of transformations at T1n+ and T2n+ [40].
With the model already developed for other liquid elements [73], these temperatures are used to calculate a Bi Lindemann coefficient equal to 0.09119, in good agreement with the value 0.095 recently found [85]. The glass transition temperature is predicted at Tg = 203.5 K and the singular enthalpy coefficients Δε are Δεlg0 = 0.1907, −Δεlgg) = 0.094065, −Δεlg0m = −2/3) = 0.10594 and −Δεlg (θ= −1) = 0.238375. The experimental coefficients, Δε, giving rise to θ1n+= 778/544.5 −1= 0.429 and θ2n+ = 784.6/544.5 −1= 0.44096, are equal to the theoretical ones, 0.1907 + 0.238375 = 0.429075 and 0.094065 + 0.10594 + 0.238375 = 0.43838, respectively. The total glassy fraction melted at the two temperatures, Tn+, represent 86.7%, while the crystallized fraction melted at Tm would be 13.3%. The transition at T3n+ is expected at θ3n+ = 0.8675 (T3n+ = 1.8675Tm), corresponding to 1016 K in the absence of transitions at T1n+ and T2n+, in agreement with the second experiment. The formation of distinct glassy phases with singular enthalpies at Tx depends on the heating rate.

4.2. Crystallization Enthalpy Reduction of Pd40Ni40P20 at the Temperature Tx after Quenching and Various Annealing of the Same Duration at Lower Temperatures

The bulk melting temperature is Tm = 870 K; the glass transition temperature of ribbons is Tg = 575 K (θg = −0.33909) and the virtual glass transition temperature T′g = 2Tm-Tg = 1165 K (θn+ = 0.33909). The first order transition at Tx is unique and shown in Figure 2 [86]. An endothermic transition was observed at T1n+ = 984 K above Tm [87]. The enthalpy coefficients are calculated using (9), (10), (12) and (13), θg = −0.33908 and a = 1. Liquids 1, 2, and 3 obey (20)–(22), respectively:
ε ls = 1.66092 ( 1   θ 2 / 0.250305 ) ,
ε gs = 1.49138 ( 1   θ 2 / 0.33713 ) ,
ε lg θ = ε ls ε gs = 0.16954 ε   2.2118 × θ 2 .  
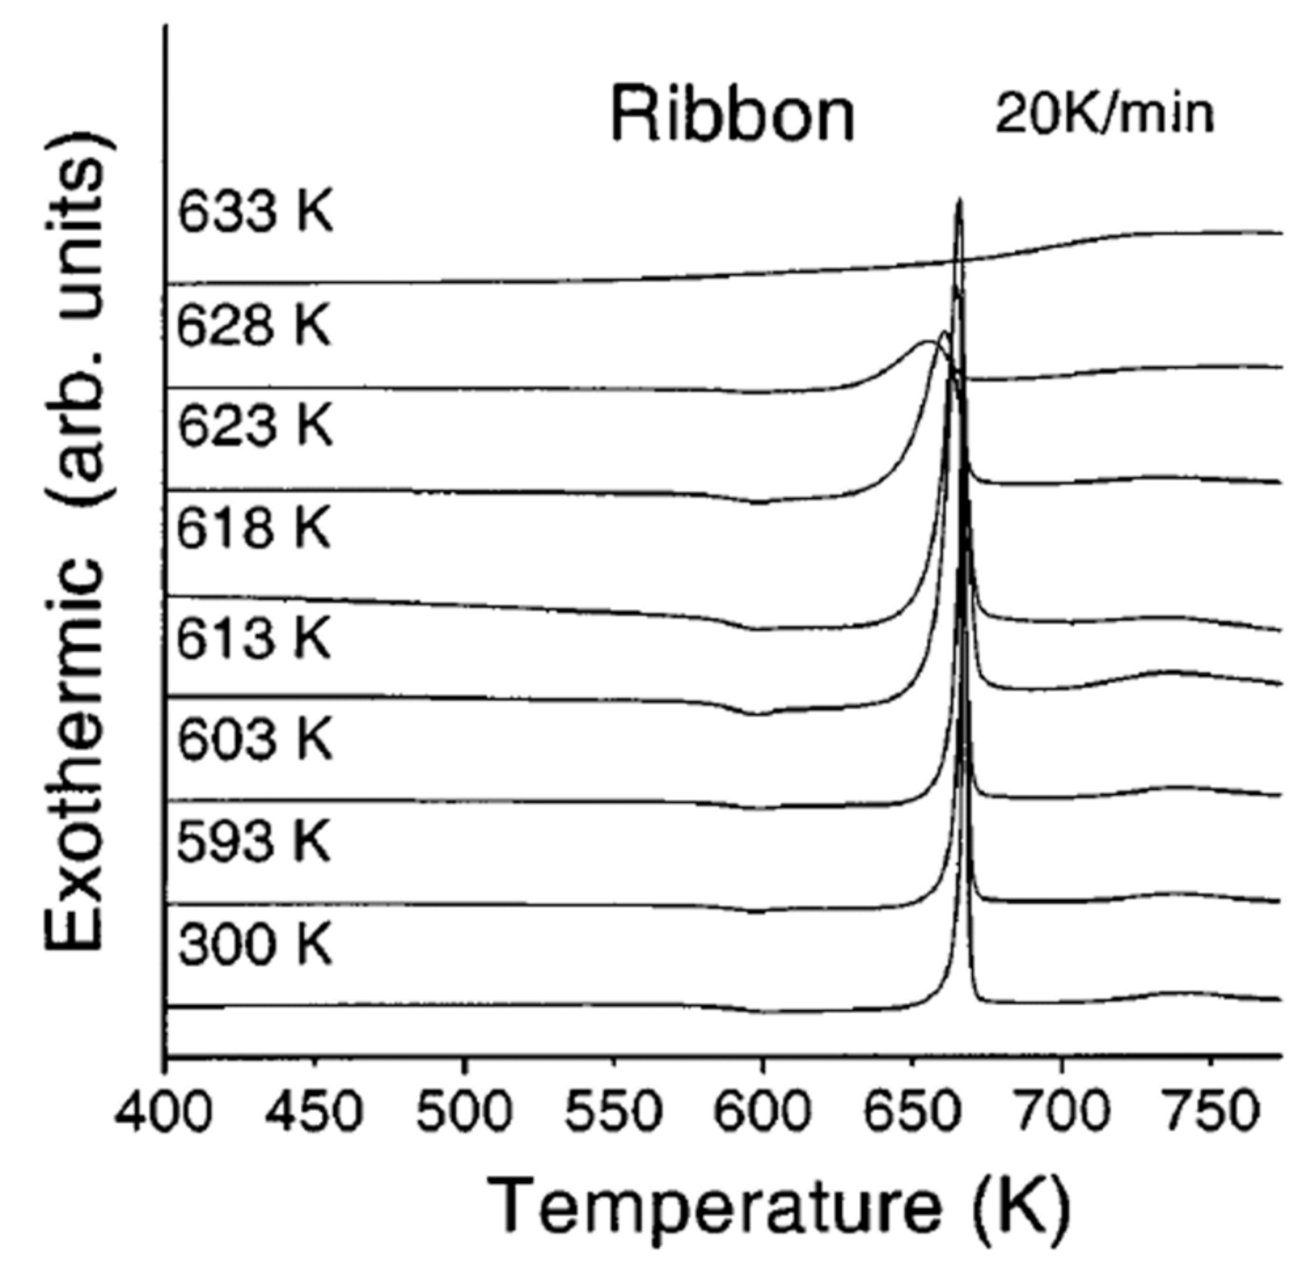
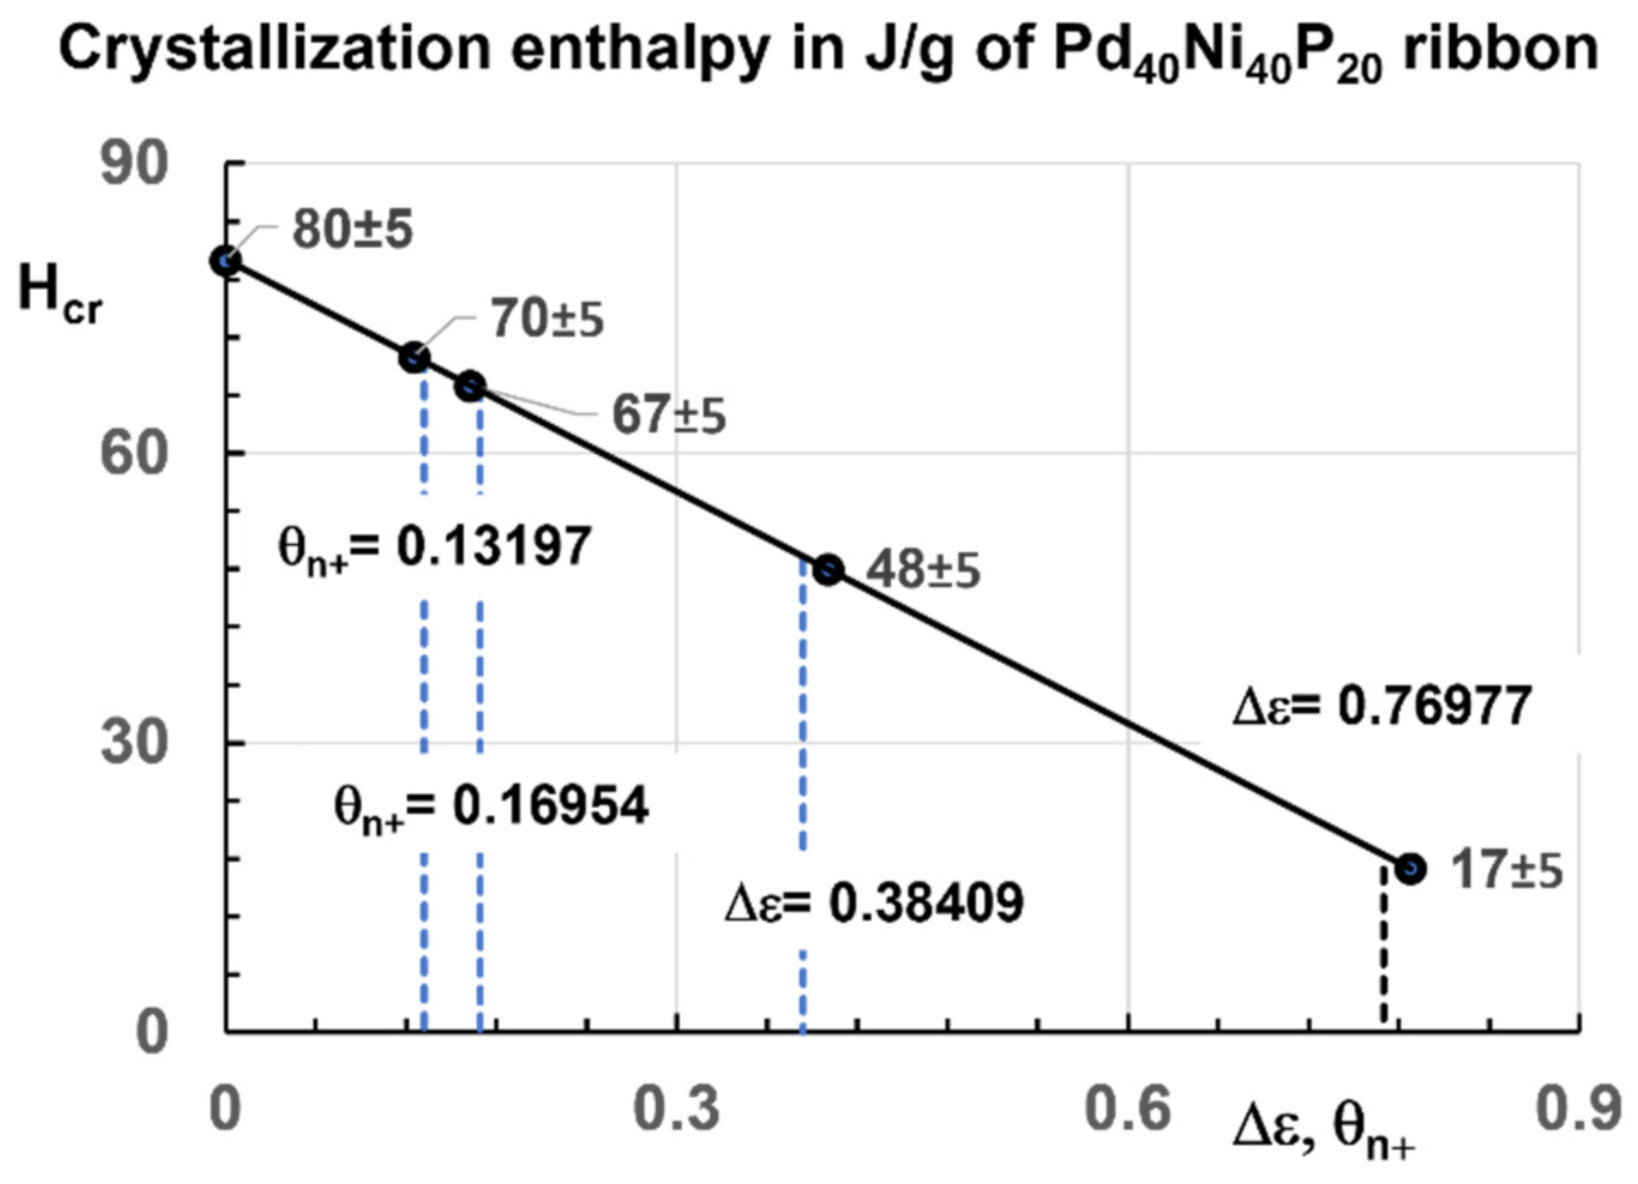
The singular enthalpy coefficients, Δε = θn+, are: 0, −Δεlg0/2 = −0.08477, ±0.13197 at T1n+, −Δεlg0 = −0.16984, −Δεlg0m) = 0.38409. The first order transition at Tx = 658.4 K, driven by the entropy of Phase 3, counted from its formation temperature at 506.7 K, being equal to (−Δεlg − 0.25431) × Hm/Tx, leads to a singular enthalpy of Phase 3 equal to −0.25431 × Hm [60,61]. The crystallization enthalpies roughly correspond to these singular values of θn+, as shown in Figure 3, with (18) respected. The transition at Tx is sharp, in Figure 2, up to Ta = 618 K and broader above. The transition at θn+ above Tm is expected to be observable up to θg = 0.33909 = 2Tm − Tg. Too high values of Δε above θ′g led to higher fractions of crystalline phase. The crystallization enthalpy in Figure 3 is strongly reduced after various annealing, because the melt starts with more and more crystals when the annealing temperature Ta passes 623 K before heating up to higher temperatures.
A first order transition predicted at Tx = 673.3K using Equation (14), could induce, by cooling, a maximum glassy fraction Δε = 0.33908 = 0.25431+0.08477 equal to θ′g = 0.33908.

4.3. Melting Temperatures of Co76Sn24 above Tm = 1392 K

The melting temperature of Co76Sn24 is Tm = 1382 K. The first temperature, T1n+, of this alloy is observed at 1583 ± 10 K, accompanied by an endothermic enthalpy [76,88]. Using (23) [52], the glass transition temperature, Tg, is predicted as being equal to 866.9 K (θg = −0.37275) for Tn+ = 1581.6 K (θn+ = 0.14441) while the virtual glass transition is (2Tm−Tg) = 1897.14 K:
θ n + = 0.38742 × θ g .  
The enthalpy coefficients are calculated using (9,10,12,13) and a = 1. Liquids 1, 2, and 3 obey (24)–(26), respectively:
ε ls = 1.62725 ( 1 θ 2 / 0.26958 ) ,
ε gs = 1.44088 ( 1 θ 2 / 0.35806 ) ,
ε lg θ = ε ls ε gs = 0.18637 2.0121 × θ 2 .
The singular values of the enthalpy coefficient Δεlg (θ) are: Δεlgg) = −Δεlg0 /2 = −0.18637/2 for a stable glass, Δεlg1n+) = −0.14441, Δεlg0 = −0.18637 for an ultrastable glass, Δεlg0m) = −0.35605. Two first order transition temperatures were observed at Tn− = 1129 K and 1263 K by supercooling [76,88]. They are predicted using (14) with the singular values of Δε = θn+ = 0.14441 and 0.33078 = 0.14441 + 0.18637. The transition for Δεlg= −0.35605 does not exist because it would lead to a second melting temperature higher than the glass transition T′g = 1897.14 K.
The Equations (27)–(29), used to predict Phase 3 enthalpy decreasing with temperature, are determined with θg = 0.37275 (Tg = 1897.14 K) and (9), (10), (12) and (13).
ε ls = 2.37275 ( 1 +   θ 2 / 0.34266 ) ,
ε gs = 2.49617 ( 1 θ 2 / 0.55046 ) ,
ε lg θ = ε ls ε gs = 0.18637 + 2.0121 × θ 2 .
Lines 1 and 2 determined by (26) and (29) in Figure 4 are obtained by heating from various glassy states depending on thermal history and heating rate and leading to exothermic or endothermic transitions at T1n+ = 1581.6 K. An endothermic transition was observed at T1n+ [88].
The transformation at the temperature, Tx,, of Phase 3, by heating from the glassy state, is predicted using (14) with Δε = 0.33078 = 0.14441 + 0.1837, εls0 = 1.44088, and θ0g2 = 0.35806 and leads to a negative enthalpy coefficient equal to −0.33078, as shown in Figure 4. The enthalpy of Phase 3, 0.33078 × Hm, would be recovered at the second melting temperatures Tn+ = 1581.6 K (θn+ = 0.14441) and 1639.6 K (θn+ = 0.18637). The melting enthalpy of the crystallized part would be (1−0.33078) Hm = 0.66933×Hm, while the crystallization enthalpy would be −0.66933 × Hm.
The temperatures, Tx, would separate two domains of glassy states. The melt would be fully glassy below Tx after transition at Tx and partially glassy from Tx to Tn+. The glassy fractions of the melt would be 33.078% from Tx to 1581.6 K and 18.637% from 1581.6 to 1639.6 K.

4.4. Melting Temperatures of Bi2Te3 and Its Alloys above Tm = 864 K

Liquid–liquid structure transitions in metallic melts have an impact on solidification [89] and play an important role in the final microstructure and the properties of the solid alloys. We note that the compound Bi2Te3 is used for most Peltier cooling devices and thermoelectric generators. In alloys based on this compound, during the first heating process, a temperature induced liquid–liquid structural transition existed at a temperature that we call T1n+, which disappeared in the resistivity measurements by cooling from higher temperatures than Tn+ [44,45]. Solidifying at various cooling rates in these conditions, the microstructures were refined, and the hardness increased with the cooling rate. The glass transition temperature of Bi2Te3 and its alloys were unknown. Applying (23) to this compound with Tm = 864 K and T1n+ = 967.8 K [90], the two glass transition temperatures are predicted at θg = −0.29576 (Tg = 586 K) and θ′g = 0.29576 (T′g = 1132 K). The presence of nucleation and recalescence temperatures and a temperature of recalescence below Tm upon cooling was dependent on cooling rate. The exothermic transition at Tn+ was also observed by DSC during cooling at 135 K/min.
The Equations (30)–(32) used to predict Phase 3 enthalpy increasing with temperature are determined with θg = −0.29576 (Tg = 586 K) and (9,10,12,13):
ε ls = 1.68981 ( 1 θ 2 / 0.23296 ) ,
ε gs = 1.53472 ( 1 θ 2 / 0.31736 ) ,
ε lg θ = ε ls ε gs = 0.15509 2.4179 × θ 2 .
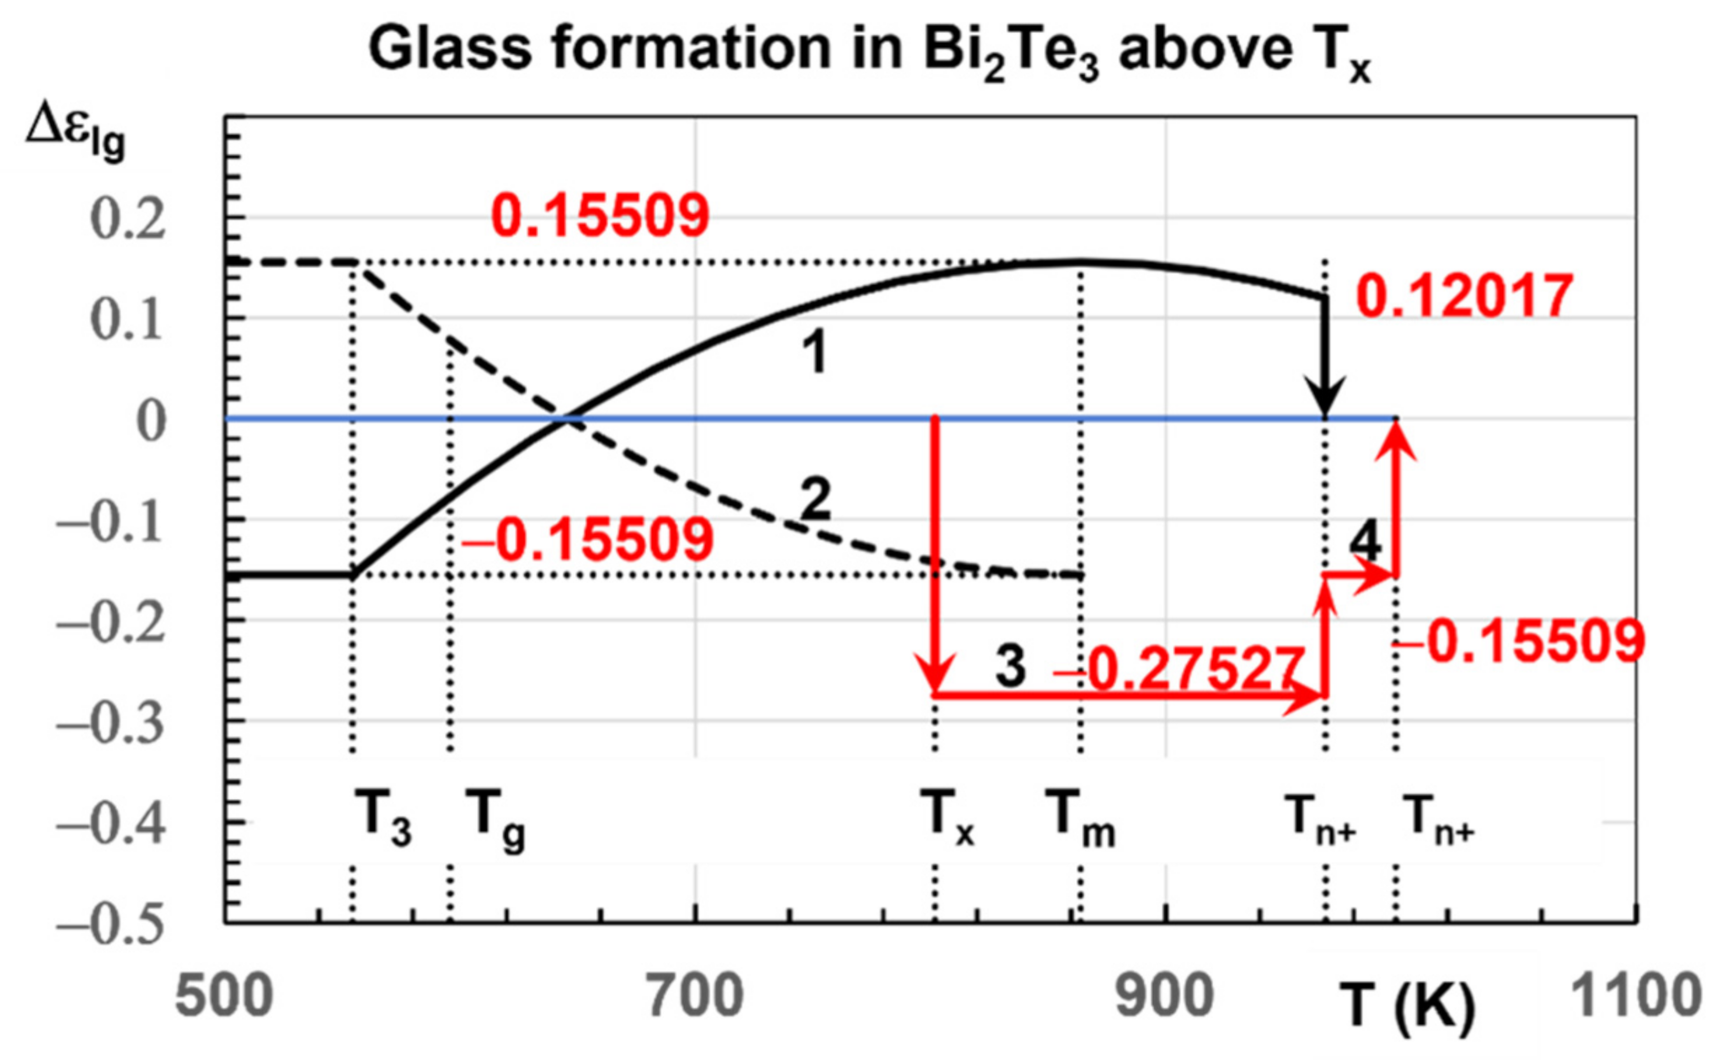
The singular values of the enthalpy coefficient Δεlg (θ) are: Δεlgg) = −Δεlg0 /2= −0.15509/2, −Δεlgn+) = −0.12017, −Δεlg0= −0.15509, Δεlg0m) = −0.40818. The first order transition for Δε= 0.40818 does not exist because it would lead to a second melting temperature higher the second glass transition T′g at 1897.1 K. It is replaced by a first order transition with Δε = 0.12017 + 0.15509 = 0.27527. Two first order transition temperatures are expected for θn+= Δε = 0.12017 and θn+ = Δε= 0.27527.
The Equations (33)–(35) used to predict Phase 3 enthalpy decreasing with temperature are determined with θg= 0.29576 (Tg = 1132 K) and (9), (10), (12), (13).
Ε ls = 2.31019 ( 1 +   θ 2 / 0.31848 )
ε gs = 2.46528 ( 1   θ 2 / 0.5098 ) ,
ε lg θ = ε ls   ε gs = 0.15509 + 2.4179 ×   θ 2 .
Lines 1 and 2, determined by (32) and (35) in Figure 5 obtained by heating from the glassy state, depend on thermal history and heating rate and lead to exothermic and endothermic transitions at T1n+ = 967.8 K.
The crystallization of Phase 3 by heating from the glassy state is predicted at Tx = 802 K using (14), with Δε = 0.12017 + 0.15509 = 0.27527, εls0 = 1.53472, and θ0g2 = 0.31736 and lead to the negative enthalpy coefficient, −0.27527, as shown in Figure 5. This transition at 802 K was observed by supercooling at 135 K/min [90] and was viewed as the nucleation temperature of nanocrystals. The glassy enthalpy −0.27527×Hm would be recovered at the second melting temperatures Tn+ = 967.9 K (θn+ = 0.12017) and 998 K (θn+ = 0.15509). The melting enthalpy of the crystallized part would be (1−0.27527) Hm = 0.72473×Hm, while the crystallization enthalpy would be −0.72473 × Hm.

4.5. The Six Melting Temperatures of Zr46Cu46Al8 above 1200 K

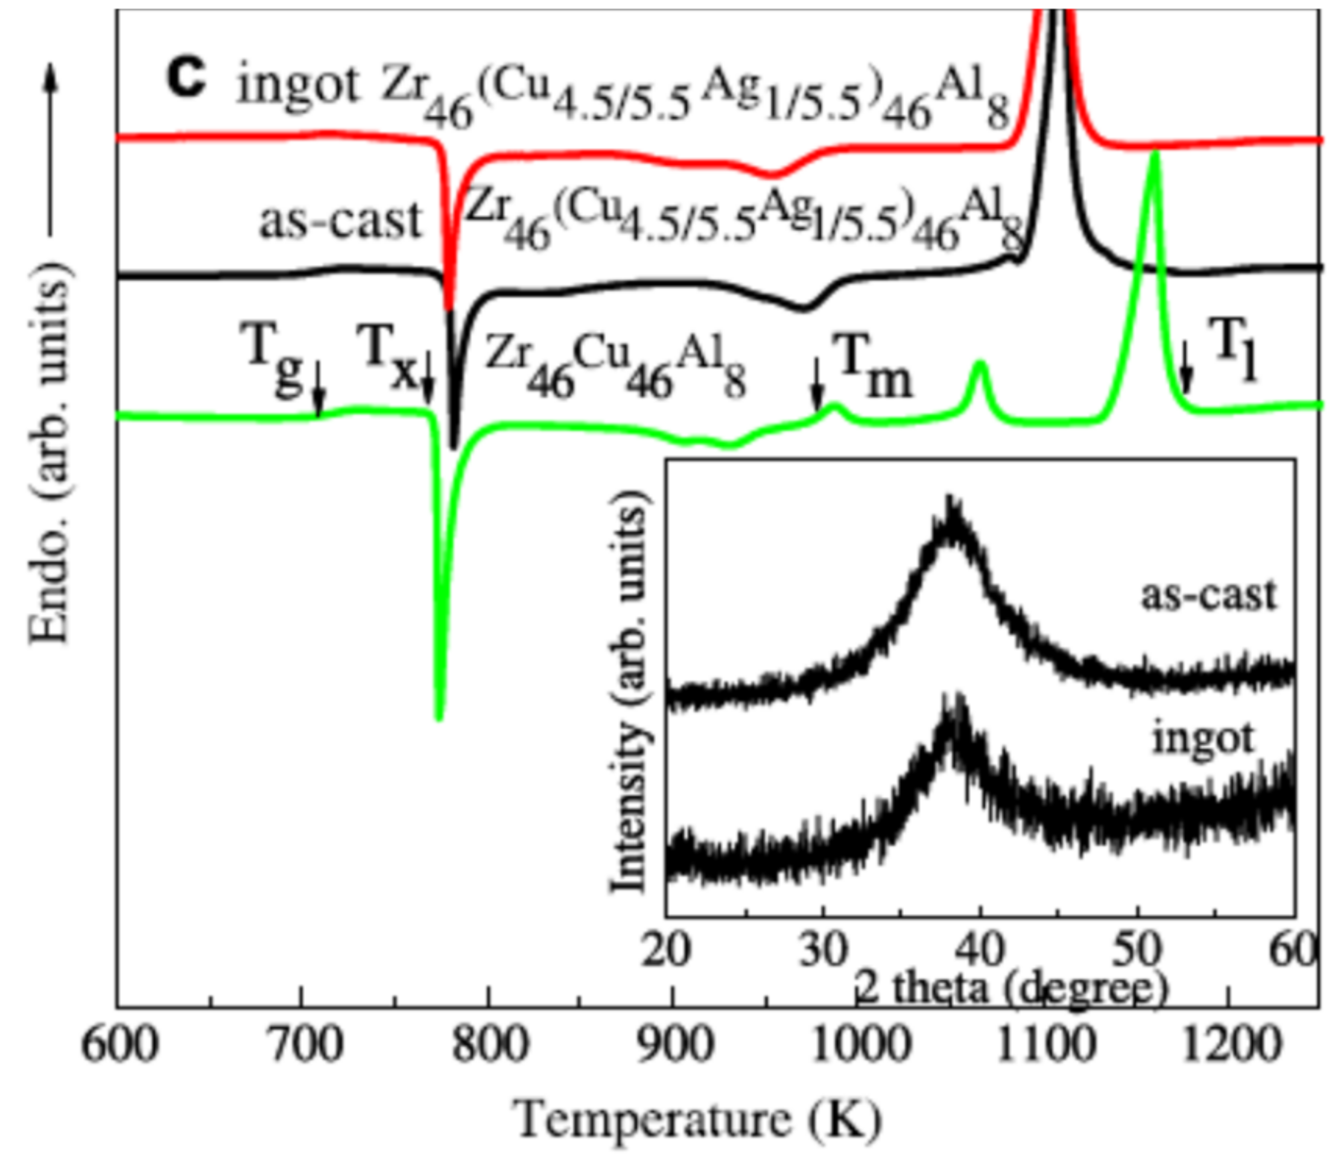
The glass transition temperature of Zr46Cu46Al8 is Tg= 715 K. There are three melting temperatures 962 K, 1034 K and 1125 K, as shown in Figure 6, inducing three unknown Phases 3 observed with heating rates between 0.1666 and 2 K/s in this noncongruent alloy and three theoretical virtual glass transition temperatures equal to 1209 K, 1353 K, and 1535 K, respectively [91]. Consequently, there are different coefficients εls0, εgs0, θ0g2, θ0m2, Δεlg0m), Δε = θn+ for every one of them, given in Table 1 and calculated with (9, 10, 12, 13, 15), a = 1 and θg = −0.25676 for Tm = 962 K, −0.30851 for Tm = 1034 K and −0.36444 for Tm = 1125 K. The main phase having the highest melting enthalpy corresponds to Tm = 1125 K.
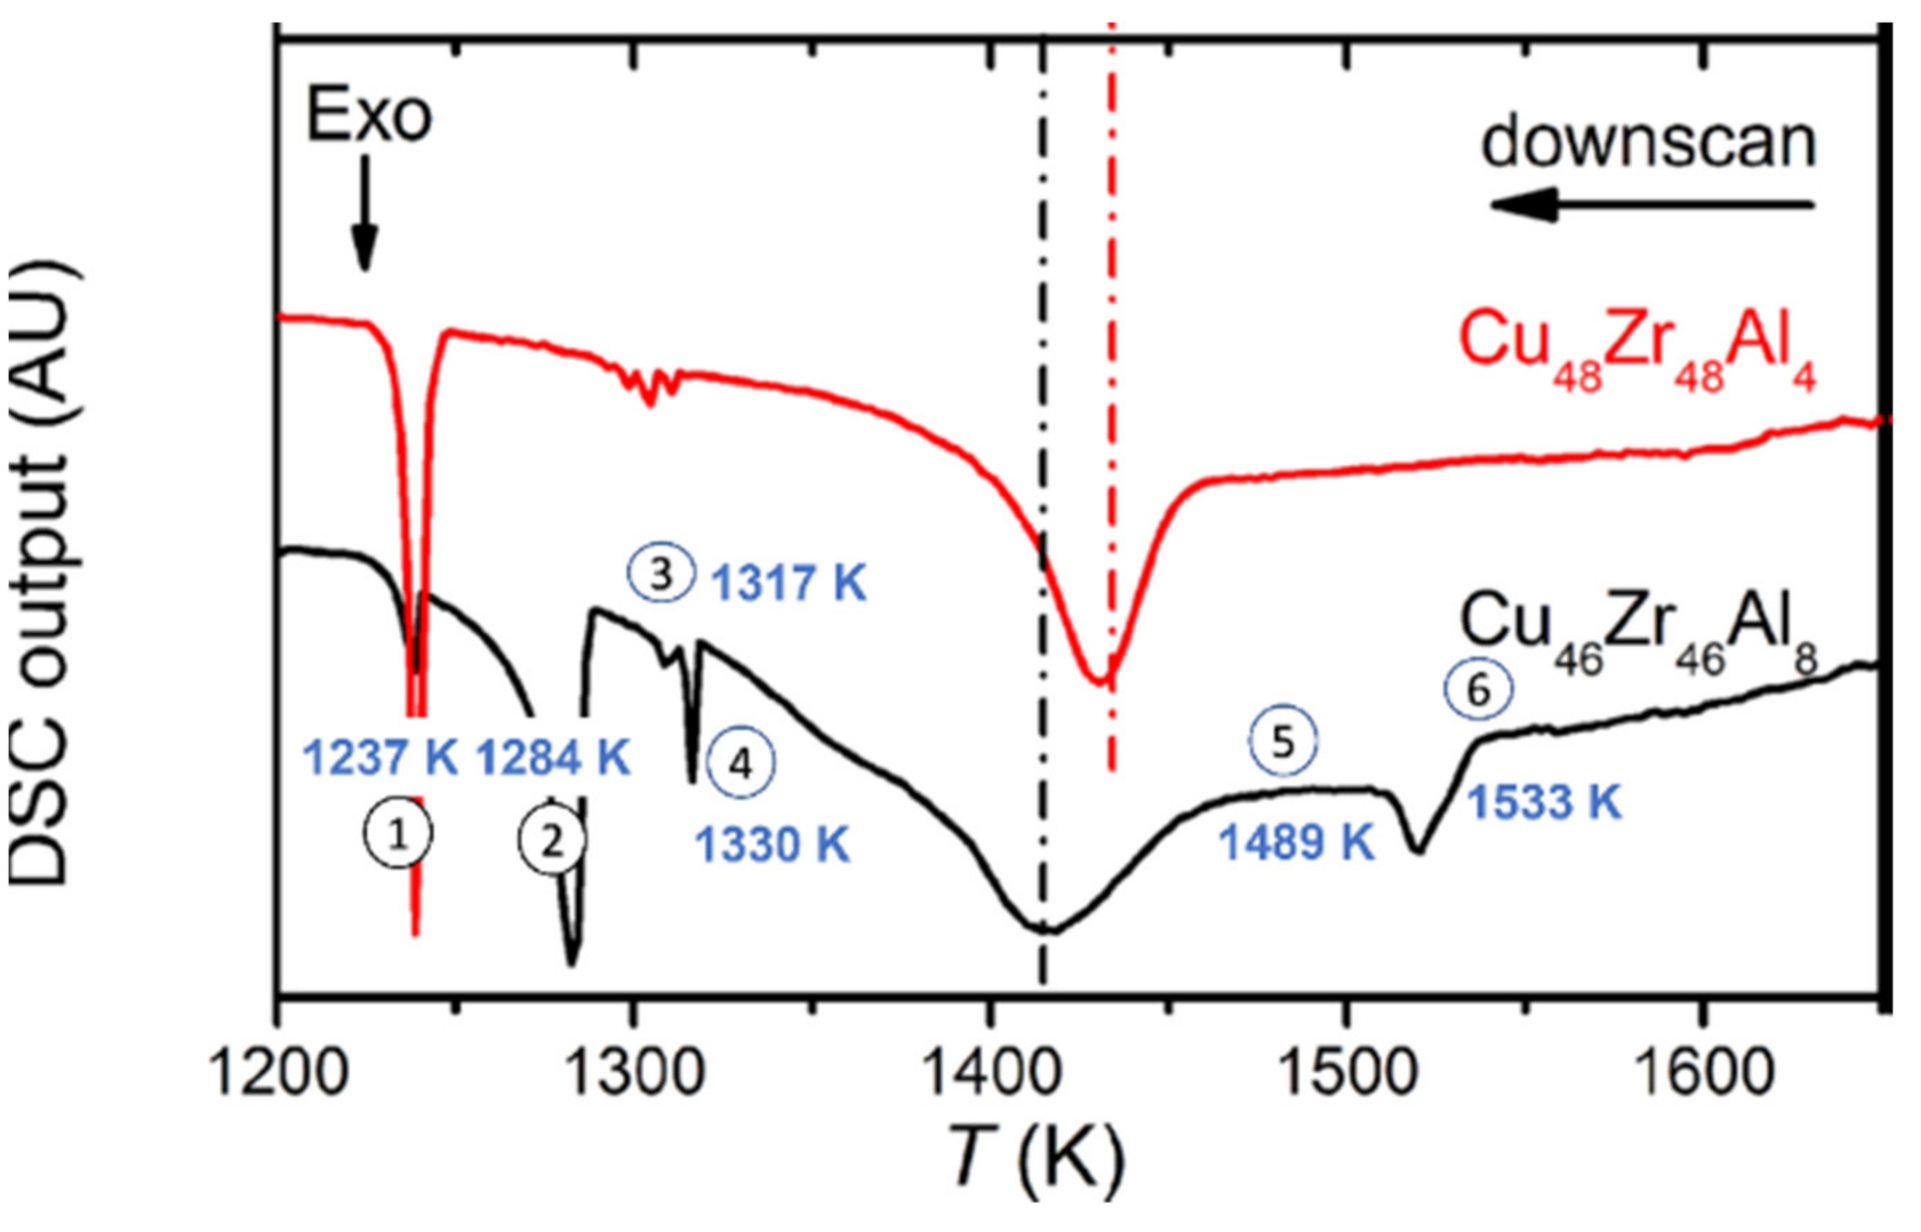
Six first order transition temperatures accompanied by exothermic latent heats were observed above 1200 K by cooling the melt from 1650 K, as shown in Figure 7 [41]. These temperatures predicted in Table 1 are melting temperatures upon heating. Peaks numbered 1 to 6 correspond to predicted temperatures Tn+: for Tm = 1125 K (N°2-1284K, N°4-1330 K, N°5- 1489 K, N°6- 1533 K); for Tm = 1034 K (N°1- 1237 K, N°3- 1317 K) and for Tm = 962 K, no Tn+ above 1200 K. Peaks N°s1 and 3 are weak compared to N°s 2, 4, 5 and 6. The sum of the predicted enthalpy coefficients of peaks N°s2, 4, 5 and 6 is equal to − 0.1412 − 0.18222 − 0.32342 − 0.36293 = −1.0098 ≅ −1 below T1n+ = 1284 K instead of Tm = 1125 K, in good agreement with the melting of a glass having an enthalpy coefficient equal to −1, the enthalpy coefficient of full crystallization. A full glassy state exists below T1n+ = 1284 K and then the glassy state fraction declines with three increases in Tn+ from T1n+ to T4n+ = 1533 K.
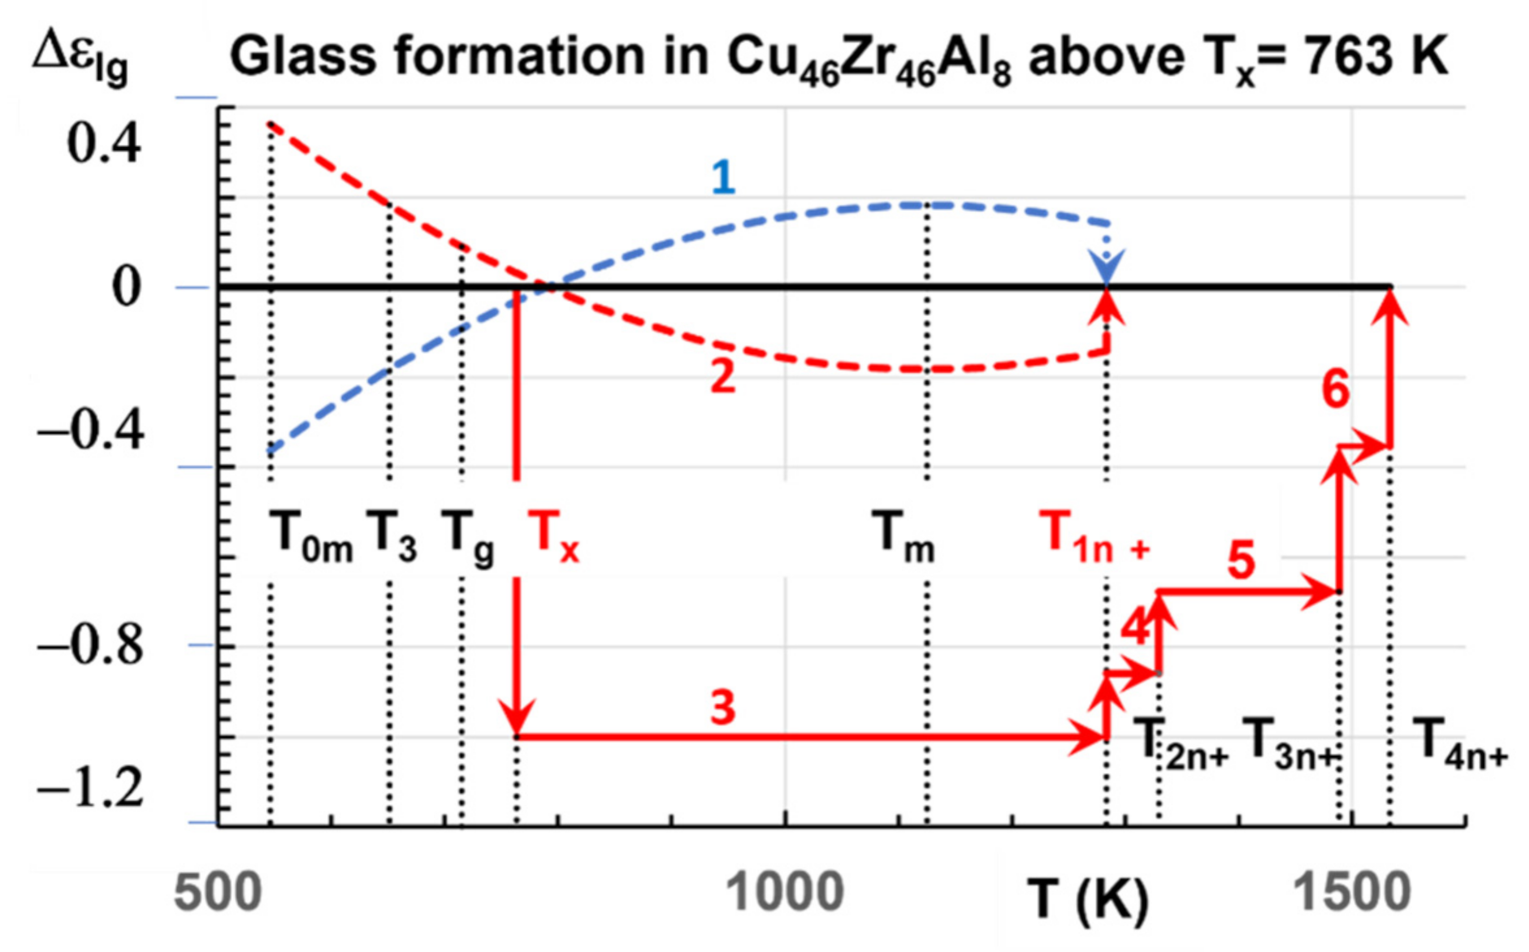
All transitions of Phases 3 with Tm = 1125 K are represented in Figure 8. Lines 1 and 2 represent Equations (15) and (16). The transition at Tx = 760.3 K occurs when Δεlg = 0 for the phase 3 enthalpy coefficient corresponding to the lowest melting temperature Tm = 962 K. The formation, by heating, of a glass phase having an enthalpy equal to that of crystals, occurs using heating rates inducing a first order transition at Tx without crystallized fraction. The observation of glass fractions melting above Tm could be obtained by heating because all first order transitions at Tn+ were reversible and corresponded to singular enthalpies of the glassy phase and probably various percolation thresholds [41]. The first order transition at Tx = 760.3 K leading to a glassy fraction equal to 100 % corresponds to Δε= −1 at a temperature far below Tm = 1125 K, using a low heating rate. Nevertheless, a crystallization enthalpy occurs at Tm = 1125 K, as shown in Figure 6, because the melt, in this case, has not been overheated above T4n+ = 1533 K before cooling [91]. The glassy state obtained at Tx = 760.3 K could totally escape crystallization following the red broken line N°3 using low heating rates such as 0.333 K/s, if the melt is previously overheated above T′g = 1535 K before cooling, as shown in Figure 7.
The first order transitions are due to liquid super atom formation at Tn+. Observations of multiple temperatures, Tn+, are facilitated in this alloy because they have a first order character much stronger than those observed in La50Al35Ni15 and Pd42.5Ni42.5P15 studied by [37,38], due here to the spontaneous formation and percolation of solid super atoms instead of having bonds progressively built-in liquid super atoms (clusters–bound colloids) during slow cooling [72].

5. The Case of a Few Polymers

The glass transition reveals the full entropy of melting while the crystallization entropy is weaker or even disappears in atactic polymers. The incubation time of first order transitions is much higher in these polymers than in metallic and molecular glass-forming melts. The heat capacity jump at Tg is equal to 1.5 Sm without including the diverging contribution due the phase transition at Tg [52].

5.1. Polyvinyle Acetate (C4H6O2)n

The glass transition occurred at Tg ≅ 309 K with ΔCp (Tg) = 1.02 J/g in [92]. The melting entropy Sm was equal to 29.8 J/mole/K. The melting temperature Tm was 333 K. The crystallization was not observed because Tg was close to Tm. A long annealing above Tm is necessary to crystallize this material without undercooling.

5.2. Polymer Called 1,2-Propadeniol

The glass transition temperature was Tg = 170.3 K, the solidus temperature Ts= 225 K and the partial melting heat 4900 J/mole [93]. The heat capacity jump at Tg was 77.6 J/mole due to a melting entropy of 51.74 J/mole/K and a melting enthalpy of 11642 J/mole. The recovery of the missing enthalpy (6742 J/mole) is expected at much higher temperatures than 225 K.

5.3. Poly(ethylene terephthalate)

The heat capacity jump Δεlg (Tg) at Tg is (0.446 J/g/K) after rapid quenching, corresponds to a full melting entropy (0.2974 J/K/mole) [94,95]. The partial melting heat is 44% less giving rise after crystallization to a heat capacity jump reduction by 44%.

5.4. Bisphenol-A Polycarbonate (PC) and Poly(3-hydroxybutyrate) (PHB)

Rigid amorphous fractions, found in PC and PHB, occurred in the temperature range between the crystallization and the glass transition [96]. The authors highlight the question of when this amorphous material vitrifies. The answer could be found in this paper.

5.5. Interaction between Globular Proteins and Proteins Solutions

The interplay between crystallization and a metastable liquid–liquid phase separation (protein rich–protein poor) is of paramount importance for obtaining protein crystals of good quality [97] and this system can be modelled with a hard sphere followed by a Yukawa tail; liquid–liquid phase separation in hard sphere models of colloidal mixtures has also been studied extensively [98] but little is known at a fundamental level about thermodynamic coexistence between the crystal and glassy phases. Predictions of the interaction between globular proteins and proteins solutions (the partial glass phase discussed above) was out of the scope of current paper and could be an area of utilization of the methodological approach discussed herewith, to analyze the computer simulation data reported in the literature for basic, interaction models of statistical mechanics.

6. Conclusions

This paper is devoted to liquid–liquid transitions in glass-forming melts. A first liquid-liquid transition was often observed at a temperature T1n+ above the equilibrium thermodynamic transition Tm after heating from the glassy state without previous first order transition at a temperature Tx weaker than Tm. This transition at Tn+ was exothermic or endothermic and associated with antibonds or bonds breaking predicted by the nonclassical nucleation model and in agreement with the configuron percolation model, as already shown in previous publications.
Separation phenomena were observed by molecular dynamics simulations of monoatomic liquid elements at very high heating rates and remain predicted. Full melting of Ag, Cu, Zr and Fe were obtained at temperatures much higher than Tm, showing that the crystal fraction can fully profit from the disappearance of any glass phase above Tm. An increase in the melting temperature of glassy phases at high heating rates is due to the finite mobility of configurons – broken chemical bonds, which at relatively low heating rates quickly condense causing the typical first order phase transformation, arrest at the temperature Tx. At higher heating rates, however, there is not enough time for condensation to occur and, thus, the melting occurs at a much higher temperature when the percolation via configurons occurs.
In this paper, some mysterious aspects of the first order transition occurring at Tx and leading to crystallization were enlightened, considering phase separation between a glassy fraction having a glass transition temperature higher than Tm and a second fraction, crystallizing at Tx, and melting at Tm. The nonclassical nucleation model predicts the existence of two glassy phases, at Tg and T′g, in two different temperature domains separated by the temperature Tx. The transition at Tx increases Tg up to Tx and induces a new glassy phase above Tx. The temperature T′g is virtual because the glass phase has a melting temperature higher than Tm and lower than T′g.
These new melting temperatures are observable at Tn+ at low heating rates, as already anticipated by the reduction in the crystallization enthalpy of some monoatomic elements after supercooling and recalescence. Several new examples were found in publications. Three liquid–liquid transitions in bismuth observed in two different experiments lead to a total glassy fraction of 86.7% and a melting temperature equal to 1.867Tm in one of the two experiments and to 1.438Tm in the other. Four reversible first order liquid–liquid transitions in Cu46Zr46Al8 lead to a glassy fraction of 100 %, for the phase with Tm= 1125 K and a melting temperature of 1.36Tm. Predictions of complementary liquid–liquid transitions were made for Co76Sn24, Pd40Ni40P20, and Bi2Te3 beyond the first liquid–liquid transitions already observed. A rigid amorphous fraction, found in two polymers, did not participate in the glass fraction below Tg and appeared in the range of temperatures between Tg and Tm without knowing its vitrification temperature.
The first order transitions at Tx observed by heating were accompanied by latent heats composed of singular values of the glass enthalpy or of their sum, as already shown for monoatomic elements. They determined the first order liquid–liquid transitions at Tn+ above Tm which were reversible in Cu46Zr46Al8 and observed with the same latent heats by cooling from homogeneous liquid state and heating due to the melting and formation of percolating solid superclusters (superatoms), respectively. The same transitions at Tn+ observed in La50Al35Ni15 and Pd42.5Ni42.5 P15 involve much weaker latent heats by cooling because percolating liquid superclusters (superatoms) formed at Tn+ from homogeneous liquid are progressively solidified by cooling from Tn+ instead of being fully solidified at Tn+.
The melts are rejuvenated above T′g = 2Tm-Tg because all the growth nuclei of crystals are eliminated by superheating above T′g. Many techniques of quenching, used to avoid crystallization, do not overheat melts far above Tm before quenching and are not able to reveal the various glassy states above Tx.

Author Contributions

Conceptualization, R.F.T.; methodology, R.F.T.; investigation and formal analysis, R.F.T. and M.I.O.; data curation, R.F.T.; writing—original draft preparation, R.F.T.; writing—review and editing, R.F.T. and M.I.O.; All authors have read and agreed to the published version of the manuscript.

Funding

This research received no external funding.

Institutional Review Board Statement

Not applicable.

Informed Consent Statement

Not applicable.

Data Availability Statement

Data are reported within the paper.

Acknowledgments

Authors are grateful to anonymous reviewers whose comments helped to improve the paper.

Conflicts of Interest

The authors declare no conflict of interest.

References

  1. Poole, P.H.; Grande, T.; Sciorfino, F.; Angel, C.A. Amorphous polymorphism. Comput. Mater. Sci. 1995, 4, 373–382. [Google Scholar] [CrossRef]
  2. Brazhkin, V.V.; Popova, S.V.; Voloshin, R.N. High pressure transformations in simple metals. Int. J. High Press. Res. 1997, 15, 207–305. [Google Scholar]
  3. Poole, P.H.; Grande, T.; Angell, C.A.; McMillan, P.F. Polymorphic phase transitions in liquids and glasses. Science 1997, 275, 322. [Google Scholar] [CrossRef]
  4. Mishima, O.; Stanley, H.F. The relationship between liquid, supercooled and glassy water. Nature 1998, 396, 329–335. [Google Scholar] [CrossRef]
  5. Stillinger, F.H.; Debenedetti, P.G. Supercooled liquids and the glass transition. Nature 2001, 410, 259–267. [Google Scholar]
  6. Angilella, G.N.; Leys, F.E.; March, N.H.; Pucci, R. Phase transitions in liquids and glasses. Phys. Chem. Liq 2003, 41, 211–226. [Google Scholar] [CrossRef]
  7. Debenedetti, P.G. Supercooled and glassy water. J. Phys. Condens. Matter. 2003, 15, 1669–1726. [Google Scholar] [CrossRef] [Green Version]
  8. McMillan, P.F. Polyamorphic transformations in liquids and glasses. J. Mater. Chem. 2004, 14, 1506–1512. [Google Scholar] [CrossRef]
  9. McMillan, P.F.; Wilson, M.; Wilding, M.C.; Daisenberger, D.; Mezouar, M.; Greaves, G.N. Polyamorphism and liquid-liquid phase transitions: Challenges for experiment and theory. J. Phys. Condens. Matter. 2007, 19, 415101. [Google Scholar] [CrossRef]
  10. Berthier, L.; Biroli, G. Theoretical perspective on the glass transition and amorphous materials. Rev. Mod. Phys. 2011, 83, 587. [Google Scholar] [CrossRef]
  11. Stanley, H.E. Liquid Polymorphism; Wiley Online Library: Hoboken, NJ, USA, 2013; Volume 152. [Google Scholar]
  12. Gallo, P.; Amann-Winkel, K.; Angell, C.A.; Anisimov, M.A.; Caupin, F.; Chakravarty, C.; Lascaris, E.; Loerting, T.; Panagiotopoulos, A.Z.; Russo, J.; et al. A tale of two liquids. Chem. Rev. 2016, 116, 7463–7500. [Google Scholar] [CrossRef]
  13. Handle, H.; Loerting, T.; Sciortino, F. Supercooled and glassy water: Metastable liquid(s), amorphous solid(s), and a no-man’s land. Proc. Natl. Acad. Sci. USA 2017, 114, 13336–13344. [Google Scholar] [CrossRef] [Green Version]
  14. Palmer, J.C.; Poole, P.H.; Sciorfino, F.; Debenedetti, P.G. Advances in computational studies of the liquid–liquid transition in water and water-like models. Chem. Rev. 2018, 118, 9129–9151. [Google Scholar] [CrossRef]
  15. Tanaka, H. Liquid-liquid transition and polyamorphism. J. Chem. Phys. 2020, 153, 130901. [Google Scholar] [CrossRef] [PubMed]
  16. Kearns, K.L.; Swallen, S.F.; Ediger, M.D.; Wu, T.; Sun, Y.; Yu, L. Hiking down the energy landscape: Progress toward the Kauzmann temperature via vapor deposition. J. Phys. Chem. B 2008, 112, 4934–4942. [Google Scholar] [CrossRef] [PubMed]
  17. Kearns, K.L.; Swallen, S.F.; Ediger, M.D.; Wu, T.; Yu, L. Influence of substrate temperature on the stability of glasses prepared by vapor deposition. J. Chem. Phys. 2007, 127, 154702. [Google Scholar] [CrossRef] [PubMed] [Green Version]
  18. Leon-Gutierrez, E.; Sepulveda, A.; Garcia, G.; Clavaguera-Mora, M.T.; Rodriguez-Vieja, J. Stability of thin film glasses of toluene and ethylbenzene formed by vapor deposition: An in situ nanocalorimetric study. Phys. Chem. Chem. Phys. 2010, 12, 14693–14698. [Google Scholar] [CrossRef]
  19. Ishii, K.; Nakayama, H.; Hirabayashi, S.; Moriyama, R. Anomalously high-density glass of ethylbenzene prepared by vapor deposition at temperatures close to the glass-transition temperature. Chem. Phys. Lett. 2008, 459, 109–112. [Google Scholar] [CrossRef]
  20. Ha, A.; Cohen, I.; Zhao, X.; Lee, M.; Kivelson, D. Supercooled liquids and polyamorphism. J. Phys. Chem. Lett. 1996, 100, 1–4. [Google Scholar] [CrossRef]
  21. Kivelson, D.; Kivelson, S.A.; Zhao, X.; Nussinov, Z.; Tarjus, G. A thermodynamic theory of supercooled liquids. Physica A. 1995, 219, 27–38. [Google Scholar] [CrossRef]
  22. Miltenburg, K.V.; Blok, K. Calorimetric investigation of a new solid phase in Triphenylphosphite. J. Phys. Chem. 1996, 100, 16457–16459. [Google Scholar] [CrossRef]
  23. Kurita, R.; Tanaka, H. On the abundance and general nature of the liquid-liquid phase transition in molecular systems. J. Phys. Condens. Matter. 2005, 17, L293–L302. [Google Scholar] [CrossRef]
  24. Zhu, M.; Wang, J.-Q.; Perepezko, J.H.; Yu, L. Possible existence of two amorphous phases of D-Mannitol related by a first-order transition. J. Chem. Phys. 2015, 142, 244504. [Google Scholar] [CrossRef]
  25. Kobayashi, K.; Tanaka, H. The reversibility and first-order nature of liquid-liquid transition in a molecular liquid. Nature Comm. 2016, 7, 13438. [Google Scholar] [CrossRef] [Green Version]
  26. An, Q.; Johnson, W.L.; Samwer, K.; Corona, S.L.; Goddart, W.A., III. Formation of two glass phases in binary Cu-Ag liquid. Acta Mater. 2020, 195, 274–281. [Google Scholar] [CrossRef]
  27. An, Q.; Johnson, W.L.; Samwer, K.; Corona, S.L.; Goddard, W.A., III. First-order transition in liquid Ag to the heterogeneous G-Phase. J. Phys. Chem. Lett. 2020, 11, 632–645. [Google Scholar] [CrossRef] [Green Version]
  28. Bazlov, A.I.; Louzguine-Luzguin, D.V. Crystallization of FCC and BCC liquid metals studied by molecular dynamics simulation. Metal. 2020, 10, 1532. [Google Scholar]
  29. Becker, S.; Devijver, E.; Molinier, R.; Jakse, N. Glass-forming ability of elemental zirconium. Phys. Rev. B 2020, 102, 104205. [Google Scholar] [CrossRef]
  30. Popel, P.S.; Sidorov, V.E. Microheterogeneity of liquid metallic solutions and its influence on the structure and propertes of rapidly quenched alloys. Mater.Sci. Eng. A 1997, 226, 237–244. [Google Scholar] [CrossRef]
  31. Kim, Y.H.; Kiraga, K.; Inoue, A.; Masumoto, T.; Jo, H.H. Crystallization and high mechanical strengthof Al-based amorphous alloys. Mater. Trans. 1994, 35, 293–302. [Google Scholar] [CrossRef] [Green Version]
  32. Hu, Q.; Sheng, H.C.; Fu, M.W.; Zeng, X.R. Influence of melt temperature on the Invar effect in (Fe71.2B.024Y4.8)96Nb4 bulk metallic glasses. J. Mater. Sci. 2019, 48, 6900–6906. [Google Scholar]
  33. Jiang, H.-R.; Bochtler, B.; Riegler, X.-S.; Wei, S.S.; Neuber, N.; Frey, M.; Gallino, I.; Busch, R.; Shen, J. Thermodynamic and kinetic studies of the Cu-Zr-Al(-Sn) bulk metallic glasses. J. Alloys Compd. 2020, 844, 156126. [Google Scholar] [CrossRef]
  34. Yue, Y. Experimental evidence for the existence of an ordered structure in a silicate liquid above its liquidus temperature. J. Non-Cryst. Sol. 2004, 345, 523–527. [Google Scholar] [CrossRef]
  35. Wei, S.; Yang, F.; Bednarcik, J.; Kaban, I.; Shuleshova, O.; Meyer, A.; Busch, R. Liquid-liquid transition in a strong bulk metallic glass-forming liquid. Nat. Commun. 2013, 4, 2083. [Google Scholar] [CrossRef] [Green Version]
  36. Way, C.; Wadhwa, P.; Busch, R. The influence of shear rate and temperature on the viscosity and fragility of the Zr41.2Ti13.8Cu12.5Ni10.0Be22.5 metallic-glass-forming liquid. Acta Mater. 2007, 55, 2977–2983. [Google Scholar] [CrossRef]
  37. Chen, E.-Y.; Peng, S.-X.; Peng, L.; Di Michiel, M.; Vaughan, G.B.M.; Yu, Y.; Yu, H.-B.; Ruta, B.; Wei, S.; Liu, L. Glass-forming ability correlated with the liquid-liquid transition in Pd42.5Ni42.5P15 alloy. Scr. Mater. 2021, 193, 117–121. [Google Scholar] [CrossRef]
  38. Xu, W.; Sandor, M.T.; Yu, Y.; Ke, H.-B.; Zhang, H.P.; Li, M.-Z.; Wang, W.-H.; Liu, L.; Wu, Y. Evidence of liquid-liquid transition in glass-forming La50Al35Ni15 melt above liquidus temperature. Nat. Commun. 2015, 6, 7696. [Google Scholar] [CrossRef]
  39. Wang, L.; Bian, X.; Liu, J. Discontinuous structural phase transition of liquid metal and alloys. Phys. Lett. A 2004, 326, 429–435. [Google Scholar] [CrossRef]
  40. Greenberg, Y.; Yahel, E.; Caspi, E.N.; Benmore, C.; Beuneu, B.; Daniel, M.P.; Markov, G. Evidence for a temperature-driven structural transition in liquid bismuth. EPL 2009, 86, 36004. [Google Scholar] [CrossRef]
  41. Zhou, C.; Hu, L.; Sun, Q.; Qin, J.; Brian, X.; Yue, Y. Indication of liquid-liquid phase transition in CuZr-based melts. Appl. Phys. Lett. 2013, 103, 171904. [Google Scholar] [CrossRef]
  42. Tanaka, H. Bond orientational order in liquids: Towards a unified description of water-like anomalies, liquid-liquid transition, glass transition, and crystallization. Eur. Phys. J. 2012, 35, 113. [Google Scholar] [CrossRef] [Green Version]
  43. He, Y.-X.; Li, J.; Wang, J.; Kou, H.; Beaugnon, E. Liquid-liquid structure transition and nucleation in undercooled Co-B eutectic alloys. Appl. Phys. A 2017, 123, 391. [Google Scholar] [CrossRef]
  44. Yu, Y.; Wu, Z.; Cojocaru-Morédin, O.; Zhu, B.; Wang, X.-Y.; Gao, N.; Zhuang, Y.; Zu, F.-Q. Dependence of solidification for Bi2Te3-xSex alloys on their liquid states. Sci. Rep. 2017, 7, 2463. [Google Scholar] [CrossRef] [Green Version]
  45. Yu, Y.; Lv, L.; Wang, X.-Y.; Zhu, B.; Huang, Z.-Y.; Zu, F.-Q. Influence of melt overheating treatment on solidification behavior of BiTe-based alloys at different cooling rates. Mater. Des. 2015, 88, 743–750. [Google Scholar] [CrossRef]
  46. Tournier, R.F.; Beaugnon, E. Texturing by cooling a metallic melt in a magnetic field. Sci. Technol. Adv. Mater. 2009, 10, 014501. [Google Scholar] [CrossRef]
  47. Turnbull, D. Kinetics of solidification of supercooled liquid mercury. J. Chem. Phys. 1952, 20, 411. [Google Scholar] [CrossRef]
  48. Kelton, K.F. Crystal nucleation in liquids and glasses. Sol. State Phys. 1991, 45, 75–177. [Google Scholar]
  49. Tournier, R.F. Presence of intrinsic growth nuclei in overheated and undercooled liquid elements. Physica B. 2007, 392, 79–91. [Google Scholar] [CrossRef]
  50. Tournier, R.F. Lindemann’s rule applied to the melting of crystals and ultra-stable glasses. Chem. Phys. Lett. 2016, 651, 198–202, Erratum in 2017, 675, 174. [Google Scholar] [CrossRef] [Green Version]
  51. Tournier, R.F. Thermodynamic and kinetic origin of the vitreous transition. Intermetallics 2012, 30, 104–110. [Google Scholar] [CrossRef]
  52. Tournier, R.F. Glass phase and other multiple liquid-to-liquid transitions resulting from two-liquid competition. Chem. Phys. Lett. 2016, 665, 64–70. [Google Scholar] [CrossRef] [Green Version]
  53. Tournier, R.F. Crystallization of supercooled liquid elements induced by superclusters containing magic atom numbers. Metals 2014, 4, 359–387. [Google Scholar] [CrossRef] [Green Version]
  54. Franck, F.C. Supercooling of liquids. Proc. Roy. Soc. Lond. 1952, A215, 43–46. [Google Scholar]
  55. Tournier, R.F. Homogeneous nucleation of phase transformations in supercooled water. Physica B 2020, 579, 411895. [Google Scholar] [CrossRef]
  56. Oguni, M.; Maruyama, S.; Wakabayashi, K.; Nagoe, A. Glass transitions of ordinary and heavy water within silica-gel nanopores. Chem. Asian J. 2007, 2, 514–520. [Google Scholar] [CrossRef] [PubMed]
  57. Speedy, R.J.; Angell, C.A. Isothermal compressibility of supercooled water and evidence for a thermodynamic singularity at −45 °C. J. Chem. Phys. 1976, 65, 851–858. [Google Scholar] [CrossRef]
  58. Tournier, R.F.; Ojovan, M.I. Dewetting Temperatures of Prefrozen and Grafted Layers in Ultrathin Films Viewed as Melt-Memory Effects. Physica B 2021, 611, 412796. [Google Scholar] [CrossRef]
  59. Takaiwa, D.; Atano, I.; Koga, K.; Tanaka, H. Phase diagram of water in carbon nanotubes. Proc. Natl. Acad. Sci. USA 2008, 105, 39–43. [Google Scholar] [CrossRef] [Green Version]
  60. Assland, S.; McMillan, P.F. Density-driven liquid-liquid phase separation with system Al2O3-Y2O3. Nature 1994, 369, 633–636. [Google Scholar] [CrossRef]
  61. Tournier, R.F. First-order transitions in glasses and melts induced by solid superclusters nucleated by homogeneous nucleation instead of surface melting. Chem. Phys. 2019, 524, 40–54. [Google Scholar] [CrossRef] [Green Version]
  62. Hassaine, M.; Jimenez-Rioboo, R.J.; Sharapova, I.V.; Korolynk, O.A.; Krivchikov, A.I.; Ramos, M.A. Thermal properties and Brillouin -scattering study of glass, crystal, and “glacial” states in n-butanol. J. Chem. Phys. 2009, 131, 174508. [Google Scholar] [CrossRef]
  63. Krivchikov, A.I.; Hassaine, M.; Sharapova, I.V.; Korolyuk, O.A.; Jimenez-Rioboo, R.J.; Ramos, M.A. Low temperature properties of glassy and crystalline states of n-butanol. J. Non-Cryst. Sol. 2011, 357, 524–529. [Google Scholar] [CrossRef]
  64. Hays, C.C.; Johnson, W.L. Undercooling of bulk metallic glasses processed by electrostatic levitation. J. Non-Cryst. Sol. 1999, 250, 596–600. [Google Scholar] [CrossRef]
  65. Yang, B.; Perepezko, J.H.; Schmelzer, J.W.P.; Gao, Y.; Schick, C. Dependence of crystal nucleation on prior liquid overheating by differential fast scanning calorimeter. J. Chem. Phys. 2014, 140, 104513. [Google Scholar] [CrossRef]
  66. Ojovan, M.I. Glass formation in amorphous SiO2 as a percolation phase transition in a system of network defects. J. Exp. Theor. Phys. Lett. 2004, 79, 632–634. [Google Scholar] [CrossRef]
  67. Ozhovan, M.I. Topological characteristics of bonds in SiO2 and GeO. oxide systems at glass-liquid transition. J. Exp. Theor. Phys. 2006, 103, 819–829. [Google Scholar] [CrossRef]
  68. Ojovan, M.I. Ordering and structural changes at the glass-liquid transition. J. Non-Cryst. Sol. 2013, 382, 79. [Google Scholar] [CrossRef]
  69. Sanditov, D.S.; Ojovan, M.I. On relaxation nature of glass transition in amorphous materials. Physica B 2017, 523, 96–113. [Google Scholar] [CrossRef]
  70. Ojovan, M.I.; Louzguine Luzgin, D.V. Revealing Structural Changes at Glass Transition via Radial Distribution Functions. J. Phys. Chem. B 2020, 124, 3186–3194. [Google Scholar] [CrossRef]
  71. Tournier, R.F.; Ojovan, M.I. Undercooled Phase Behind the Glass Phase with Superheated Medium-Range Order above Glass Transition Temperature. Physica B 2021, 602, 412542. [Google Scholar] [CrossRef]
  72. Tournier, R.F.; Ojovan, M.I. Building and breaking bonds by homogenous nucleation in glass-forming melts leading to three liquid states. Materials 2021, 14, 2287. [Google Scholar] [CrossRef] [PubMed]
  73. Tournier, R.F.; Ojovan, M.O. Prediction of Second Melting Temperatures Already Observed in Pure Elements by Molecular Dynamics Simulations. Materials 2021, 14, 6509. [Google Scholar] [CrossRef] [PubMed]
  74. Vinet, B.; Magnusson, L.; Fredriksson, H.; Desré, P.J. Correlations between surface and interface energies with respect to crystal nucleation. J. Coll. Interf. Sci. 2002, 255, 363–374. [Google Scholar] [CrossRef] [PubMed]
  75. Mukherjee, S.; Zhou, Z.; Schroers, J.; Johnson, W.L.; Rhim, W.K. Overheating threshold and its effect on time-temperature-transformation diagrams of zirconium based bulk metallic glasses. Appl. Phys. Lett. 2004, 84, 5010–5012. [Google Scholar] [CrossRef] [Green Version]
  76. Wang, J.; Li, J.; Hu, R.; Kou, H.; Beaugnon, E. Evidence for the structure transition in a liquid Co-Sn alloy by in-situ magnetization measurement. Mater. Lett. 2015, 145, 261–263. [Google Scholar] [CrossRef]
  77. He, Y.; Li, J.; Li, L.; Wang, J.; Yildiz, E.; Beaugnon, E. Composition dependent characteristic transition temperatures o Co-B melts. J. Non-Cryst. Sol. 2019, 522, 119583. [Google Scholar] [CrossRef]
  78. Wang, J.; He, Y.; Li, J.; Li, C.; Kou, H.; Zhang, P.; Beaugnon, E. Nucleation of supercooled Co melts under a high magnetic field. Mater. Chem. Phys. 2019, 225, 133–136. [Google Scholar] [CrossRef]
  79. Bian, X.F.; Sun, B.A.; Hu, L.N.; Jia, Y.B. Fragility of superheated melts and glass-forming ability in Al-based alloys. Phys. Lett. A 2005, 335, 61–67. [Google Scholar] [CrossRef]
  80. Lan, S.; Ren, Y.; Wei, X.Y.; Wang, B.; Gilbert, E.P.; Shibayama, T.; Watanabe, S.; Ohnuma, M.; Wang, X.-L. Hidden amorphous phase and reentrant supercooled liquid in Pd-Ni-P metallic glass. Nat. Commun. 2017, 8, 14679. [Google Scholar] [CrossRef]
  81. Tournier, R.F.; Ojovan, M.I. Comments about a recent publication entitled entitled “Improving glass forming ability of off-eutectic metallic glass formers by manipulating primary crystallization reactions”. Scr. Mater. 2021, 205, 114039. [Google Scholar] [CrossRef]
  82. Zeng, Y.Q.; Yu, J.S.; Tian, Y.; Hirata, A.; Fujita, T.; Zhang, X.H.; Nishiyama, N.; Kato, H.; Jiang, J.Q.; Inoue, A.; et al. Response to the commentary by Robert Tournier and Michael Ojovan on our publication entitled “Improving glass forming. Scr. Mater. 2021, 205, 114035. [Google Scholar] [CrossRef]
  83. Adams, G.; Gibbs, J.H. On the temperatutre dependence of cooperative relaxation properties in glass-forming liquids. J. Chem. Phys. 1965, 43, 139. [Google Scholar] [CrossRef] [Green Version]
  84. Liu, C.-Y.; He, J.; Keunings, R.; Bailly, C. new linearized relation for the universal viscosity-temperature behavior of polymer melts. Macromolecules 2006, 39, 8867–8869. [Google Scholar] [CrossRef]
  85. Vopson, M.M.; Rugers, N.; Hepburn, I. The generalized Lindemann Melting coefficient. Sol. State Commun. 2020, 318, 113977. [Google Scholar] [CrossRef]
  86. Jiang, J.; Saksl, K.; Nishiyama, N.; Inoue, A. Crystallization in Pd40N0P20 glass. J. Appl. Phys. 2002, 92, 3651–3656. [Google Scholar] [CrossRef] [Green Version]
  87. Wilde, G.; Görler, G.P.; Willnecker, R.; Dietz, G. The thermodynamic properties of Pd40Ni40P20 in the glassy, liquid, and crystalline states. Appl. Phys. Lett. 1994, 65, 397–399. [Google Scholar] [CrossRef]
  88. Qiu, X.; Li, J.; Wang, J.; Guo, T.; Kou, H.; Beaugnon, E. Effect of liquid-liquid structure transition on the nucleation in undercooled Co-Sn eutectic alloy. Mater. Chem. Phys. 2016, 170, 261–265. [Google Scholar] [CrossRef]
  89. He, Y.X.; Li, J.S.; Wang, J.; Beaugnon, E. Liquid-liquid structure transition in metallic melt and its impact on solidification: A review. Trans. Nonferrous Met. Soc. China 2020, 30, 2293–2310. [Google Scholar] [CrossRef]
  90. Connel, L.C.; Pokhrel, N.; Logan, M.; Voss, C.; Buna, D. Thermal Characterization of Semi-Conductor Bi2Te3 Alloys Using Differential Calorimetry. Available online: https://www.ramapo.edu/scholarsday/files/formidable/9/EngPhys-BunaBi2Te3-DSC-Research-Poster-.pptx (accessed on 19 December 2021).
  91. Jian, Q.K.; Wang, X.D.; Nie, X.P.; Zhang, G.Q.; Ma, H.; Fecht, H.J.; Bendnarck, J.; Franz, H.; Liu, Y.G.; Cao, Q.P.; et al. Zr-(Cu,Ag)-Al bulk metallic glasses. Acta Mater. 2008, 56, 1785–1796. [Google Scholar] [CrossRef] [Green Version]
  92. Jabroui, H.; Ouaskit, S.; Richard, J.; Garden, J.-L. Determination of entropy production during glass transition: Theory and experiment. J. Non-Cryst. Sol. 2020, 533, 119907. [Google Scholar] [CrossRef] [Green Version]
  93. Jabrane, S.; Létoffé, J.M.; Claudy, P. Vitrification and crystallization in the R(-)1,2-propanediol-S(+)1,2-propadeniol system. Therm. Chim. Act. 1995, 258, 33–47. [Google Scholar] [CrossRef]
  94. Righetti, M.C. Crystallization of polymers investigated by temperature-modulated DSC. Materials 2017, 10, 442. [Google Scholar] [CrossRef] [Green Version]
  95. Okazaki, I.; Wunderlich, B. Reversible melting in polymer crystals detected by temperature-modulateddifferential scanning calorimetry. Macromolecules 1997, 30, 1758–1764. [Google Scholar] [CrossRef]
  96. Schick, C.; Wurm, A.; Mohamed, A. Vitrification and devitrificationof the rigid fraction amorphous of semi- crystalline polymers revealed from frequency-dependent heat capacity. Colloid Polym. Sci. 2001, 279, 800–806. [Google Scholar] [CrossRef]
  97. Caccamo, C.; Pellicane, G.; Costa, D. Phase transitions in hard-core Yukawa fluids: Toward a theory of phase stability in protein solutions. J. Phys. Condens. Matter 2000, 12, A437. [Google Scholar] [CrossRef]
  98. Fiumara, G.; Pandaram, O.D.; Pellicane, G.; Saija, F. Theoretical and computer simulation study of phase coexistence of nonadditive hard-disk mixtures. J. Chem. Phys. 2014, 141, 214508. [Google Scholar] [CrossRef] [PubMed]
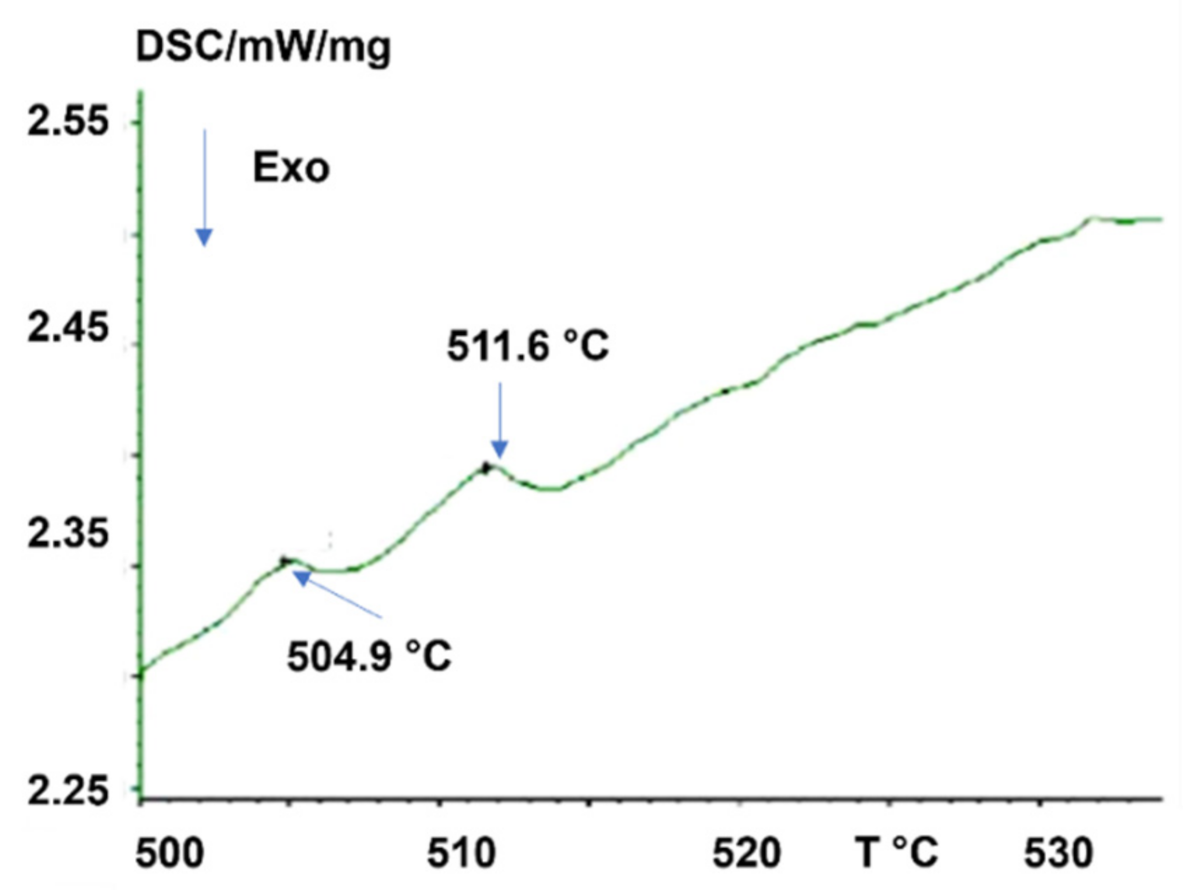
Figure 1. Experimental results for DSC of bismuth. Reproduced with permission from [39] Figure 2a. Copyright 2004 Elsevier.
Sustainability 14 02351 g001
Figure 2. The DSC traces of the as prepared Pd40Ni40P20 ribbon glass reproduced with permission from [86]. Samples annealed at different temperatures in the supercooled liquid region for 30 minutes and heated from 300 K at a heating rate of 20 K/min under a flow of purified argon. Copyright 2002 AIP Publishing.
Sustainability 14 02351 g002
Figure 3. Crystallization enthalpies Hcr in J/g, measured in Pd40Ni40P20 ribbon by [86] versus the glassy Phase 3 melting at θn+ and calculated with (18). The singular enthalpy coefficients are deduced from (27)–(29). The experimental uncertainty on Hcr is ± 5 J/g. Crystallizations for Δε = 0.76977 and 0.38409 occurring after annealing at temperatures too close to Tx. The glassy fraction is always weaker than 0.38409. Values of Hcr taken from [86] Figure 3.
Sustainability 14 02351 g003
Figure 4. Phase 3 enthalpy coefficients above the temperatures T1x and T2x. T1x = 1263 K, T2x = 1382 K, T1n+ = 1581.6 and T2n+ =1639.6 K. Lines 1 and 2 calculated with equations (26,29) in the absence of transition at Tx. Glassy state of 33.078% of the melt up to 1581.6 K and 18.637% from 1581.6 to 1639.6 K. Lines 1 and 2 without transition at Tx corresponding to 14.441% of glassy Phase 3.
Sustainability 14 02351 g004
Figure 5. Phase 3 enthalpy coefficients above the temperature Tx. Tx = 802 K, Tm = 864 K, Tn+ = 967.9 and 998 K. Lines 1 and 2 in the absence of transition at Tx. Glassy state of 27.527% of the melt up to 967.9 K and 15.509% from 967.9 to 998 K. Lines 1 and 2 without transition at Tx corresponding to 12.017% of glassy Phase 3.
Sustainability 14 02351 g005
Figure 6. DSC of Zr46Cu46Al8 in green around the melting temperatures using heating rates between 0.166 and 2 K/s. Reproduced with permission from [91] “XRD patterns and DSC curves of the arc-melted Zr46(Cu4.5/5.5 Ag1/5.5)46Al8 ingot and as-cast Zr46(Cu4.5/5.5 Ag1/5.5)46Al8 BMG sample, together with DSC curve of as-cast Zr46Cu46Al8 BMG alloy”. Melting temperatures of three phases in Zr46Cu46Al8: 962 K, 1034 K and 1125 K. Copyright 2008 Elsevier.
Sustainability 14 02351 g006
Figure 7. Melt phase transitions in Cu46Zr46Al8 above 1200 K. Reproduced with permission from [41]. “Melt phase transitions in Cu48Zr48Al4 and Cu46Zr46Al8. The DSC upon cooling for Cu48Zr48Al4 (red one) and Cu46Zr46Al8 (black one) melts in arbitrary unit (AU) upon cooling from 1623 K with a 0.167 K/s rate”. Copyright 2014 American Physical Society. Peaks numbered 1 to 6 for Cu46Zr46Al8 with predicted temperatures Tn+: for Tm = 1125 K (N°2- 1284 K, N°4- 1330 K, N°5- 1489 K, N°6- 1533 K); for Tm = 1034 K (N°1- 1237 K, N°3- 1317 K) and for Tm = 962 K, no temperature Tn+ above 1200 K. Copyright 2013 AIP Publishing.
Sustainability 14 02351 g007
Figure 8. Multiple transitions and glassy states expected in the melt fraction with Tm= 1125 K of Cu46Zr46Al8. Equation (15,16) represented by Lines 1 and 2 using enthalpy coefficients given in Table 1 for Tm= 1125 K. Glass states of Phases 3 noted 3, 4, 5, and 6. T0m = 545.9; T3 = 651.6 K; Tg = 715 K; Tx = 760.3 K; Tm = 1125 K; T1n+ = 1283.9; T2n+= 1330 K; T3n+ = 1488.8 K; T4n+ = 1533.3 K. The reversible red broken Line N°3 observed above 1200 K with cooling and heating rates of 0.333 K/s in Figure 7.
Sustainability 14 02351 g008
Table 1. Multiple melting temperatures Tm and Tn+ of Cu46Zr46Al8. Tg = 715 K; Tm, the first melting temperature; θg, the reduced glass transition temperature; εls0, θ0m2, εgs0, θ0g2 calculated with (9,) (10), (12) and (13); Δεlg0m) with (15), the enthalpy coefficient of Phase 3 at θ= θ0m; Δε= θn+ the enthalpy coefficient singular values of glassy Phase 3 above Tx = 763 K; Tn+ (K), the theoretical second melting temperatures; Obs., with yes when Tn+ has been observed in Figure 7; T′g, the virtual glass transition temperature above Tn+.
TgTmθgεls0θom2εgs0θog2Δεlg0m)Δε= θn+Tn+Obs.T′g
715962−0256761.743240.198931.614860.27642−0.45270.06419 1209
715962−0.256761.743240.198931.614860.27642−0.45270.099471057 1209
715962−0.256761.743240.198931.614860.27642−0.45270.128381086 1209
715962−0.256761.743240.198931.614860.27642−0.45270.227851181 1209
7151034−0.308511.691490.231931.537230.31617−0.409570.07713 1353
7151034−0.308511.691490.231931.537230.31617−0.409570.119531158 1353
7151034−0.308511.691490.231931.537230.31617−0.409570.154261194 1353
7151034−0.308511.691490.231931.537230.31617−0.409570.196651237Yes1353
7151034−0.308511.691490.231931.537230.31617−0.409570.273781317Yes1353
7151125−0.364441.635560.264921.453330.35311−0.362960.09111 1535
7151125−0.364441.635560.264921.453330.35311−0.362960.14121284Yes1535
7151125−0.364441.635560.264921.453330.35311−0.362960.182221330Yes1535
7151125−0.364441.635560.264921.453330.35311−0.362960.323421489Yes1535
7151125−0.364441.635560.264921.453330.35311−0.362960.362961533Yes1535
Publisher’s Note: MDPI stays neutral with regard to jurisdictional claims in published maps and institutional affiliations.