Abstract
Peri-urban and urban green are considered among the basic priorities of the local government’s regional policy agenda, in line with the principles of spatial planning. This agenda is promoted at both the national and European levels through a variety of technical and institutional measures. Green spaces in urban and suburban areas are directly linked to the quality of life of urban residents and their environment. In this context, the purpose of this study is to investigate and identify the characteristics and factors that influence the residents of a small Greek city in terms of the value they attach to urban and suburban green spaces. These factors are identified through the residents’ willingness to pay (WTP) using the contingent valuation method (CVM). In general, the analysis aims to document the value of environmental economic methods as a tool in the management of natural heritage. According to the research, income and knowledge of environmental issues (global and local) as well as the benefits of green spaces (urban and suburban) are the key factors that drive residents to place a higher value on them. Future work may explore whether or how the COVID-19 pandemic affected city residents’ willingness to pay for green spaces.
1. Introduction
1.1. Green Infrastructure and Green Spaces in the Sustainable Development of the City
Urban green, together with its infrastructure, contributes to the upgrading and enhancement of the role of the neighborhood and, more broadly, to the strengthening of the social cohesion of the city. High-quality urban green areas located around the built urban environment can affect housing costs, as property prices near such areas usually increase [1,2]. Urban green spaces provide many ecosystem services that could help combat many urban problems and contribute to improving the quality of life of residents, including their health [3,4,5,6,7].
Green spaces near or within the urban fabric provide residents with the opportunity to keep in touch with nature, exercise and engage in mild sports activities. There are many benefits, especially if the frequency of visits to the site and the length of stay are significant [8,9]. Among the factors that support the use of green spaces are the feelings of safety on the part of those who use them, as well as their high aesthetic standards [10]. The most frequent users of green spaces are individuals who are motivated to improve or restore their well-being in a variety of ways [10,11,12,13]. The presence of green spaces improves the quality of the environment by minimizing the impact of intense human interference in natural areas. Access to green spaces is recognized as an issue of environmental justice and is a matter of high global concern [6,7,14,15].
Peri-urban areas are socially dynamic; within their competences, various social forms are constantly being created, modified and discharged. They are areas of social compression or intensification, where the density of social forms increases, which indicates the presence of conflicts and, necessarily, the attempt to resolve these conflicts [16,17,18]. Farmers, workers, trade workers, entrepreneurs in the industrial, craft and technology sectors: the entire urban middle class can co-exist in the same territory, regardless of the different and competitive interests of its members. Based on the institutional view, peri-urban interconnection is complex, because some administrative activities may come under rural or urban policies. Peri-urban populations are subjected to or affected by both urban and rural laws and institutions, creating a state of legal pluralism. Therefore, peri-urban space can be considered as the transitional space, where there are overlaps between urban growth, urban expansion and pressures on agricultural and forest conservation in the natural landscape [17,19,20].
In landscaping and especially in the management of large areas of green and peri-urban areas, maintaining the dynamics of the ecological and environmental systems within them is a fundamental principle. Planning and management should be such that green areas are flexible, adaptable and socially dynamic and can offer precisely what a city lacks. They must be ‘resilient’ spaces, i.e., they must be able to respond to change or disruption without altering their fundamental condition and structure [21,22]. This is the vision of urban ecology, and integrating it into the planning stages of landscaping and site upgrading can be useful for studying the tensions that may arise in the area and trying to provide dynamic responses based on the capacity of the city and the peri-urban environment to absorb the impending changes [22].
1.2. Contingent Valuation of Green Spaces and Models
Urban and suburban green constitute environmental resources that possess public good characteristics (without exclusion and without competition) including free access. Consequently, urban and suburban green are not traded in the markets and cannot be priced in a relatively easy way.
Failure to evaluate urban and suburban green may lead to reckless use or misuse and certainly failure to fulfill the social and ecological functions described by many researchers in this area for urban green [6,23,24,25,26,27,28,29,30,31,32,33,34,35] and for suburban green [36,37,38,39,40,41,42].
The indirect benefits that green spaces give us can be quantified by economics methods that attribute or assign an economic value to a good that is intangible. The CVM is commonly used in environments such as the one under study (urban and peri-urban green areas). It is a direct method for estimating willingness to pay (WTP) based on a hypothetical scenario for one or more environmental resources [41,43].
CVM is a method used to overcome the fact that environmental goods cannot be traded in the market. It is based on the assessment of the willingness of the person being asked to pay (WTP) for the continued existence or improvement of an environmental good they consume or their willingness to accept compensation (WTA) for the loss of an environmental good they consume. This estimate is based on questionnaires for hypothetical or experimental markets. As there is no information on prices for environmental values, a hypothetical market is created, asking respondents to state the amount they would be willing to pay. The analysis of the statement of preference, i.e., the amount available to the respondents to contribute, is an economic method used to determine the monetary value of non-tradable goods [41,44,45,46,47].
The contingent valuation method (CVM) has been widely used in environmental economics [48,49]. Davis [50] first applied CVM to the study of recreational values in the forest of Maine in the USA. During the 1980s and 1990s, CVM was widely used in the assessment of ecosystem services in western countries. The method has been used to evaluate public goods as well as policies pursued with ecosystem research areas, tourism and urban green spaces. Most of the studies that have been published on urban green spaces mainly investigate the costing of “green services” provided to green consumers, the accessibility of these spaces to users, the analysis of the spatial properties of green areas and the analysis of leisure facilities provided to citizens according to the equipment and amenities they have [1,51,52].
The disadvantages of the method include distortions related to issues of strategy, hypothesis, information, planning, payment method and differences in behavior. In detail, strategic biases refer to the behaviors of individuals who deliberately underestimate or multiply the payment amount. Hypothetical biases include doubts about the match between individuals’ actual consumption behavior and that reported. Information biases relate both to issues of understanding the questions and to issues of lack of confidence in the survey. Design biases relate to the structure of the questionnaire, the types of questions and the survey sample. Vehicle or payment biases are related to the payment method and arise from the many different payment proposals (e.g., direct or indirect taxation) that follow each scenario [53,54,55]. These weaknesses were known, and every effort was made from the beginning of the investigation to eliminate or reduce them as much as possible.
Models are generally used to predict either the variable itself being studied or the underlying environmental, economic and social factors that affect the variable in question. The integrated assessment of environmental, social and economic values may require the integration of modelling techniques from different disciplines that may operate at different spatial scales [56,57,58]. Modeling is widely used in the field of ecosystem services, as it has considerable potential for assessing both the structure and functioning of ecosystem services and the supply and demand of ecosystem services. In addition, it provides the possibility to investigate the impacts of environmental change and to manage future benefits of ecosystem services through scenarios [59,60,61]. The main purpose of this study is to explore the impact that specific parametric variables have on the WTP of the residents of Florina for the use of urban and suburban green spaces in the city. These parametric variables have been extracted from a CVM questionnaire. The study attempts to identify ways of increasing WTP for green spaces so that the same can be protected, maintained and developed with the participation of citizens. Specifically, it aims to investigate the motivations and quantify the willingness to pay for the “consumption” of urban and suburban green spaces.
The contribution of the study is to unlock the attitudes and motivations of green-space users in order to enable decision makers to design policies that promote ways of sustainable management of these areas. As part of this study, a comprehensive CVM-based assessment system and also linear and logistic regression models were developed to investigate the key factors associated with residents’ WTP and their evaluation of green spaces.
The added value of the CVM methodology is that it calculates the total economic value of an environmental asset, such as the urban and suburban green space in the city. Furthermore, the results can be seen as a socially acceptable proposal, generated by the users themselves, and can be beneficial for the local government with substantial contributions to the planning of the respective environmental policy. The results of the survey are essentially an ex ante evaluation of a possible environmental intervention, which is the improvement and enhancement of the urban and suburban greenery of the city in question. The novelty of this study compared to previous ones is that it advances a WTP model that focuses on the role of stakeholders, namely their satisfaction and values, in terms of their global and local awareness of environmental problems. In turn, this leads to a more complete analysis and contributes to the originality of the paper.
2. Study Area
The region of Western Macedonia is located in the northwestern part of Greece and includes four regional units (Florina, Grevena, Kastoria and Kozani). The regional unit of Florina is located on the borders of three countries (North Macedonia, Albania and Greece) and the capital of this regional unit is the city of Florina (Figure 1). The distance between the city of Florina and Athens (capital of Greece) is 571 km, and Florina is 170 km from Thessaloniki (second largest in Greece). Due to its border location, Florina is a gateway to the Western Balkan countries and a regional transport center. According to the last census of 2011, the population of Florina Regional Unit is 51,414 inhabitants and it covers an area of 1927 km2 [62,63].
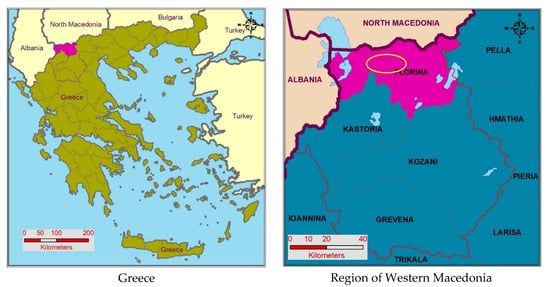
Figure 1.
Location of the research area.
It consists of three municipalities and is divided into 90 municipal and local communities, most of which are less-favored areas, and some are mountainous, according to regulation (EEC) No. 268/75. The region of Florina, due to its particular soil and climate conditions, natural and cultural resources, is considered an attraction mainly for winter tourism and an emerging agri-tourism destination. There are six natural lakes, four dams and high mountains in the area. Among the rich ecological resources, the Prespes wetland (Ramsar Convention) has a prominent position as the largest National Park in Greece [64,65].
The city has four university departments, many buildings with special architectural features, especially on both sides of the river that runs through the city, museums and many cultural associations. The urban green space per inhabitant of the city is 16.02 m2 of urban green space. If private spaces, such as the yards of houses and the gardens, are added, they correspond to 70.14 m2 of greenery per inhabitant of the city [62].
The open spaces of Florina are either traditional squares or modern, small and medium-sized, urban parks. It has 1 large park (60,000 m2) in the western part of the city, 4 medium-sized ones (10,000 m2) and 7–8 smaller, scattered throughout the city. There are also open common areas, such as traffic junctions, islets and lawns, which have vegetation coverage and, together with the Sakuleva riverbed, complement the urban open spaces [62,63]. All the parks have basic equipment (water, electricity, accessibility, children’s toys, etc.) and only the central park of the city has the most modern fitness and play equipment.
The city used as a case study is a typical small-scale city, with a representative character certainly within Greek territory. The main criteria for its selection are the size of the resident population and the existing infrastructure. In Greece, there are only three large-scale urban centers with the total population of all three together corresponding to more than half of the country’s total population. The other cities are located in rural areas, are a lot smaller and rich in green infrastructure. Florina is similar to other cities in the country, such as Kilkis, Drama, Orestiada, Tripoli, etc.
3. Materials and Methods
3.1. Analysis of Willingness to Pay
The total population of the city amounts to 17,907 inhabitants according to the last official census of 2011. The study area includes five local communities near the city with 2078 inhabitants. It is estimated that the people who use the urban and suburban green spaces of the city of Florina are the total population (19,985) plus approximately 5000 students and visitors to the city who may also use it. In this research, the population N is estimated (17,907 + 2078 + 5000) at 25,000 people [62].
The sample size was determined after calculating the accuracy (±€ 31.64) and the level of reliability of the survey (p = 99.7%). The variance of the payment amount for suburban green, S2 = 32,746.09, and the standard deviation, s = 180.96, were determined with a preliminary sample (or pilot sample) of 50 people. The value of z depends on the level of reliability (p) required; when applying the sample size determination, it is usual to take a value of z = 3, which corresponds to a level of reliability p = 99.7%. According to Equation (1) it is estimated that the minimum sample of respondents should be 291 people [62,66].
Calculation of the minimum sample of respondents.
The questionnaires were completed between January and April 2018, during the economic crisis experienced by the Greek economy and before the COVID-19 pandemic. If the economic crisis in Greece, which started in 2009, was excluded as an influential factor, the WTP score would certainly be higher, as respondents would have higher incomes and a different propensity to consume. The questionnaires were completed with the help of Google Forms and fewer by personal interview. The personal interview was mainly limited to helping the respondents to fill in the Google form, and this was done to avoid influencing the respondent’s answers. The first results from the questionnaires have already been presented using descriptive statistics and hypothesis evaluation [62]. Of the completed questionnaires, the first 291 were used in the analyses as originally determined in the sample size of the survey.
Some of the key questions included in the survey questionnaire are presented. At the beginning, there were questions to determine the profile of the respondents, i.e., gender, age, level of education, marital status, employment and annual individual or family income. This was followed by questions to explore the users’ awareness of environmental issues, both locally and globally. That is, “do you consider yourself aware of environmental issues in Florina (lignite mines, smog in winter, etc.)?” and “do you consider yourself aware of global environmental issues (climate change, global warming, etc.)?” Information was then asked about the use of the suburban green, such as: “how many times have you visited the peripheral mountains of the city (Grove of Agios Panteleimon, Stavros, 1033, Taima, etc.), e.g., for sports, walking or recreation within the year 2017?” and “how long do you usually stay in the peripheral mountains of the city when you visit them?” This was followed by questions designed to explore residents’ desires of green spaces, including:
How important are the following for you?
- Protecting and preserving the green for continued use
- Improving and preserving green space for future generations
- Improving and maintaining green space even if you are not yet using it
- The potential of green spaces for sports and recreation
- The benefits we derive from green spaces and improve our quality of life (oxygen, aesthetic value, protection against erosion, etc.)
And what activities would you like to do in suburban green spaces when you visit them?
- Horse riding
- Mountain biking
- Moto cross/4 × 4 cars
- Paragliding
- Rock climbing
- Other: …
The following are the main questions of the CVM:
Suppose a plan is proposed with all the necessary actions for the improvement and maintenance of the city’s suburban greenery, by an independent, reliable body set up specifically for this purpose. If the improvement and maintenance plan is approved, there will be a financial cost. If the total cost of the plan cannot be financed by the state or another source, would you be willing to contribute to the independent and trusted entity with a one-time financial contribution?
The answer was YES or NO and depending on the answer went as follows:
If YES, why?
- Because it is worth preserving the greenery for future generations
- Because it is worth living with nature and greenery
- Because we upgrade Florina aesthetically and touristically
- Other: …
If ΝO, why?
- I do not want to contribute due to low income
- I want it to be paid by the State or the Local Government
- I do not want to contribute because my money will go to another cause
- I am not interested …
- Other: …
Those who answered yes also answered the following question: What maximum amount in euros (€) would you be willing to contribute to the independent, trusted body with a one-time financial contribution? (From 0 € to as many € as you want) for the suburban green: €. The same basic CVM questions were repeated about urban green.
A parametric assessment of WTP for urban and suburban green spaces was carried out (without the zero prices; without the people who refused to pay). The sample used is slightly different from that of the first analysis [62], because the first assessment excluded records indicated in the corresponding boxplots and replaced these with other records (6 documents in total). The methodology followed in the first analysis was the non-parametric estimation of the average WTP for urban and suburban green spaces (with simple statistical indicators such as the Kaplan–Meier estimator survival function average, median, typical error, lower and upper bound), whereas, in the present study, the analysis is increased one level and a parametric estimation of the WTP for urban and suburban green spaces (Spearman’s rank correlation) is followed and the WTP is investigated by logistic and linear regression.
The descriptive analysis of the variables should not be quoted again, as the differences are considered negligible. The analyses will focus on the parametric estimation of willingness to pay for both suburban and urban green spaces. The Spearman’s rank correlation coefficient and IBM SPSS Statistics version 21 software were used to test the correlations of the ordered variables.
3.2. Investigating the WTP for Urban and Suburban Green Spaces with Logistic and Linear Regression
In this analysis, with the help of logistic and linear regression, the variables of the questionnaire are used to investigate the willingness of people to pay or not for all the necessary actions for the improvement and maintenance of the urban and suburban green of a city [62]. These variables may be some of the demographic or socioeconomic characteristics of the respondents or other characteristics, such as their perceptions and beliefs about various questionnaire responses, as well as their preferences for other questions.
To determine the factors influencing the respondents’ WTP, the logit binary regression model was applied. The dependent variable in the model was the probability that the respondent would be willing to pay. The explanatory variables included the quantity of supply, respondents’ awareness of environmental issues (global and local), certain social and economic variables, respondents’ views on the use of green space by future generations and the expected benefits. Similarly, the willingness to pay is explored by linear regression.
4. Results
4.1. Analysis of Correlations of Parametric Variables
The Spearman’s rank correlation coefficient was used to test the correlations of the ordered variables and the most important results can be seen in Table 1.

Table 1.
Results of Spearman’s rank correlation statistical processing of willingness to pay for urban and suburban green.
Based on the test results, there is a statistically significant correlation with a positive direction between the WTP for suburban green and the variables: Age—Age (rho = 0.144), Children—Number of Children (rho = 0.157), Income—Annual Individual or Family Income (rho = 0.346), Awlocal—Awareness on local environmental issues (rho = 0.311), Awglobal—Awareness of global environmental issues (rho = 0.297) and Benef—The benefits of greening and improving our quality of life (rho = 0.398). Futgen relates to improving and preserving greenery for future generations (this variable is not correlated but is used in the linear regression).
Regarding urban green, there is a statistically significant correlation between the WTP for urban green and the variables: Age—Age (rho = 0.146), Income—Annual Individual or Family Income (rho = 0.380), Awlocal—Awareness of local environmental issues (rho = 0.239), Awglobal—Awareness of global environmental issues (rho = 0.194) and Benef—The benefits of greening and improving our quality of life (rho = 0.650).
Initially, the analysis was based on variables mentioned in the literature and the linear relationships of each with the dependent variables were examined. This was done with Spearman’s rho and those found to be related to the dependents were fitted to the model after being tested for multilinearity problems.
A summary of the data analyzed for suburban green is given in Table 2. Similarly, for urban green, Table 3.
Table 2.
The descriptive table of sample characteristics (192) for peri-urban green.
Table 3.
The descriptive table of sample characteristics (182) for urban green.
4.2. Logistic Regression Results of the WTP for Suburban and Urban Green
Based on the results of the binary model in Table 4, it is observed that the variable (Income) “Annual Individual or Family Income” and the variable (Awglobal) “Awareness of global environmental issues” are part of the predictive model for the WTP for suburban green spaces. Specifically, based on the results, for each unit increase in the income scale of the respondent (up to € 5000, from € 5001 to € 10,000, from € 10,001 to € 25,000, from € 25,001 to € 40,000 and over € 40,001) the probability of the respondent being willing to give money for suburban green space development increases by 68.2%. Similarly, for each unit increase in the scale (Not at all, Little, Enough, Much and Too much) of “Global Environmental Awareness” (i.e., the more aware the participant is about global environmental problems) the probability that the respondent would be willing to give money for the maintenance and improvement of suburban green increases by 61.7%. Finally, for each unit increase in the participant’s response to the variable (Benef) “The benefits of greenery and improving our quality of life” (i.e., oxygen, aesthetics value, anti-corrosion protection, etc.), the probability that the respondent will choose to give money, with each order change, increases by 57.4%. The scale of classes ranges from “Not at all” to “Too much”, with three other intermediate options, “Little”, “Enough” and “Much”.
Table 4.
Logistic regression results of the WTP for suburban green.
The Nagelkerke/Cragg and Uhler pseudo-R2 estimators were used to calculate the model fit, which gave a result of 0.433, suggesting that the above model explains 43.3% of the dependent variable predicted by the model.
Similarly, for urban greening, the results can be seen Table 5. It can be observed that, ultimately, the only variable that remains in the forecast model of the WTP for urban green spaces is (Income) “Annual Individual or Family Income”. Specifically, based on the results, for each unit increase in the income scale of the respondent (up to € 5000, from € 5001 to € 10,000, from € 10,001 to € 25,000, from € 25,001 to € 40,000 and over € 40,001) the probability of the respondent being willing to give money for urban green development, increases by 34.5%. Similarly, for each unit increase in the level of awareness of the respondent on global environmental issues (forest fires, global warming, soil nitrification, climate change, etc.) the probability of choosing to give money for the development of urban greenery in the city increases by 39.3%. The scale followed is Not at all, Little, Enough, Much and Too much. Finally, the more the participant believes that urban greenery benefits them and improves their quality of life, the higher the likelihood of choosing to pay for the development of urban greening in their city; in particular, for each incremental increase in this belief, on the same scale (Not at all, A little, A lot, A lot and Very much), the likelihood of choosing to pay for the improvement and maintenance of urban greening increases by 52%.
Table 5.
Logistic regression results of the WTP for urban green.
The Nagelkerke/Cragg and Uhler pseudo-R2 estimators were used to calculate the model fit, which gave a result of 0.423, suggesting that the above model explains 42.3% of the dependent variable predicted by the model.
4.3. Linear Regression Results of the WTP for Suburban and Urban Green
Based on the results in Table 6, it appears that participants are willing to pay a larger amount of money to maintain suburban green space as their annual family or personal income increases (Income). As expected, visitors who are more positive about whether they feel aware of global environmental issues (Awglobal) are willing to pay more. It also appears that people who believe that the benefits they derive from green spaces (Benef) are greater, are willing to pay higher amounts than those who do not. Furthermore, people who do not consider it so essential to improve and maintain green areas for future generations (Futgen) are willing to give more money for suburban green space development.
Table 6.
Linear regression effects of WTP for suburban green.
In the analysis conducted by Kalfas et al. in 2020 [62], it is found that the respondents are willing to pay 73.11 € for suburban greenery and 67.09 € for urban greenery. There is a difference of 6.02 € in favor of suburban green which can be explained by its proximity and the direct access of the residents to it. Another fact that reinforces this preference of residents, is that the urban parks of Florina are lacking equipment and are certainly small.
The Nagelkerke/Cragg and Uhler pseudo-R2 estimators were used to calculate the model fit, which yielded a result of 0.432, suggesting that the above model explains 43.2% of the variability predicted by the model.
The average value of willingness to pay based on its correlation with the above parameters is described by Equation (2):
Average amount for suburban green = −31.889 + 11.111 × (Income) + 18.185 × (Aw-global) − 9.915 × (Futgen) + 12.906 × (Benef),
Calculation of average WTP based on the survey of suburban green.
Figure 2 provides scatter plots for suburban green to show the changes in WTP relative to the changes in the independent variables included in the model.
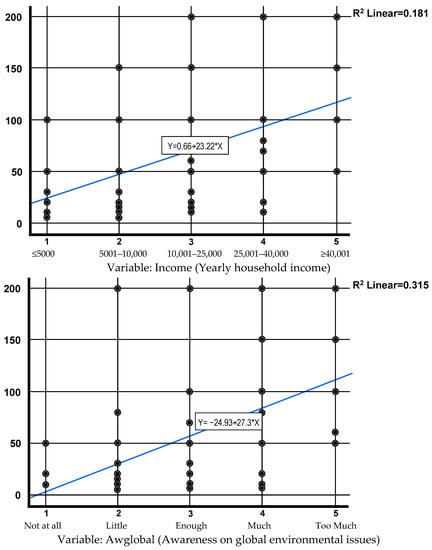
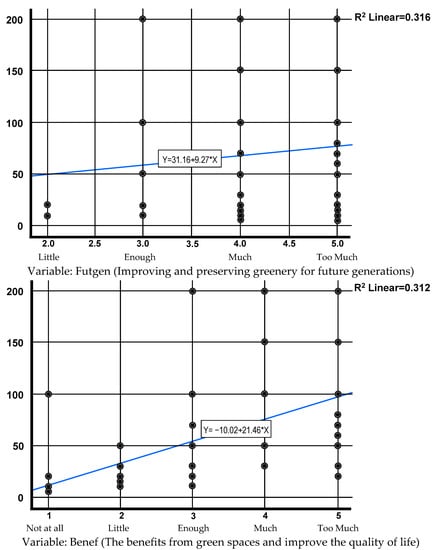
Figure 2.
Scatter plots for peri-urban green in order to show the changes in the WTP against changes in independent variables.
Likewise, for urban green, the results can be seen in Table 7. It appears that the participants intend to pay a larger amount of money as their annual family or personal income grows (Income). As expected, visitors who are more positive about whether they consider themselves aware of global environmental issues (Awglobal) are willing to pay more. It also appears that people who think that the benefits they receive from green spaces (Benef) are greater, are willing to pay higher amounts than those who do not. Moreover, people who consider themselves less sensitive to environmental issues in Florina (Awlocal) are willing to give more money for the development of urban greenery.
Table 7.
Linear regression effects of WTP for urban green.
To calculate the fit of the model, R2 was calculated, which gave a result of 0.525, indicating that the above model explains 52.5% of the variability of the dependent variable predicted by the model.
The average value of the willingness to pay based on its correlation with the above parameters is described by Equation (3):
Average amount for urban green = −50.448 + 9.65 × (Income) − 8093 × (Awlocal) + 19.236 × (Awglobal) + 13.037 × (Benef),
Calculation of average WTP based on the survey of urban green.
The scatter plots for urban greening are given in Figure 3 to show the changes in WTP relative to the changes in the independent variables included in the model.
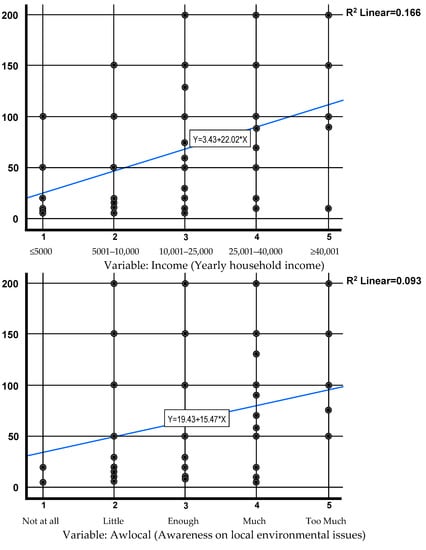
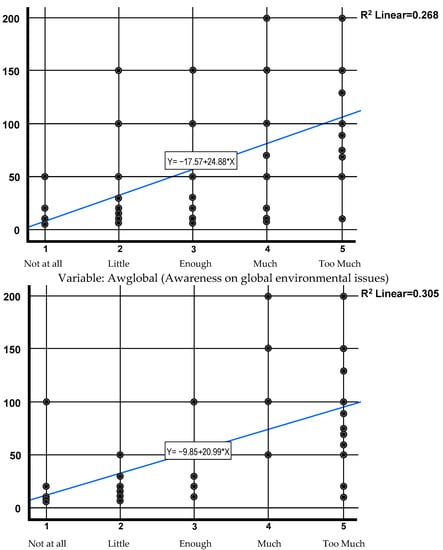
Figure 3.
Scatter plots for urban green in order to show the changes in the WTP against changes in independent variables.
5. Discussion
This study focused on the motivating factors for the management of urban and suburban green spaces. Research estimations from previous analyses have shown that these factors influence user behavior and lead users to perceive benefits associated with their WTP. Meeting the requirements of green-space users and the incremental value of their WTP should be at the heart of urban and suburban green space valuation strategies [41]. The motivating factors are the driving force for visitors of urban and suburban green areas and understanding that could lead to the improvement of their physical and emotional health in an era such as the pandemic of COVID-19 [67,68,69].
Since the 1950s, Greece has experienced changes at all levels of the economic, social and environmental domains. These changes have negatively affected local resources and jeopardized the country’s long-term environmental sustainability. Recently, the eco-nomic crisis has led to a decline in the importance of environmental issues in the public perception, a reduction in funding for conservation and research, an acceleration of efforts to convert environmental assets into livelihoods or marketable goods, a reduction in environmental protection and increased poaching and other similar illegal activities [70,71,72,73,74,75]. The impending phasing-out of lignite in the region of Western Macedonia is another challenge and will have a significant impact on employment, income, output, consumption and regional GDP in this geographical unit [76,77]. The COVID-19 pandemic, which is plaguing the entire planet, also remains a challenge [78,79,80]. The lifestyle of the inhabitants of Greek cities has deteriorated mainly due to all these economic and social problems. Green spaces in cities used to be retreats and places of escape for residents from their daily problems and recent isolation. In small Greek cities, the problems of green spaces remain significant, even if the small cities are located in rural areas. In small Greek cities, the management of green spaces is worse than in bigger cities as financial resources are limited, but what remains significant is the need of inhabitants for green spaces.
Spatial urban and suburban development requires a series of institutional transformations based on the need for co-ownership of resources but also on their optimal use [81,82,83,84]. Two factors are crucial for the implementation of strategic projects: institutional planning and the capture of value. Institutional planning institutionalizes and realizes the conception of value [85].
As local governments are responsible for investing in services and infrastructure, strengthening existing sources of revenue through the implementation of non-traditional financial instruments are critical aspects of urban development [86]. A non-traditional means with good potential for financing urban and suburban projects is to capture the value. Capturing value has proven to be an innovative tool for solving the funding shortage dilemma. Although many local governments use a wide range of value capture tools, their use has not yet fully exploited its potential [87]. Determining the most appropriate means of financing a project depends on multiple variables, but, in planning practice, if relevant value capture instruments of implementation are lacking then the plan is more likely to fail.
Regarding the policy proposals for implementation, we could mention the possibility of adopting policies that would incorporate in part or in full the results of the present work at the level of municipal authorities and government. Specifically, to the national level but also at a local level (e.g., for the city of Florina), two policies could be proposal for adopted.
The first policy proposed is to develop the awareness of young people and citizens, which will move at two levels: at the central level of the country, where it will provide for mandatory participation in courses in basic and secondary education related to ecology, global environmental problems and green areas. At the municipal level, it will provide for the adoption of annual programs of lectures and training for young people and citizens in relation to urban ecology and the management of urban and suburban green.
The second policy should be developed also on two axes, where the first will concern the involvement of civil society in the management of urban and suburban green, and the second, the sustainable management and utilization of green infrastructure. In the case of municipalities, a mandatory governing body for the management of urban and suburban green infrastructure should be established, which will provide for the mandatory and effective participation of civil society (non-governmental, environmental organizations, citizens, etc.). At the same time, the second axis will provide actions for the parallel commercial utilization of green infrastructure in an environmentally sustainable way which will be envisaged (e.g., creation of pet parks within the paid green infrastructure or use infrastructure by the inhabitants for a price, etc.), so that there is an understanding of the economic value of greenery and relevant respect for green infrastructure.
The limitations of this research relate mainly to the disadvantages of design and implementation. Issues such as the strategic biases, the hypothetical biases and information and design biases are likely to exist even if efforts have been made to avoid them. A future, similar analysis may explore whether or how the COVID-19 pandemic affected city residents’ willingness to pay for green spaces. A similar analysis can be performed in cities of the country which have better climatic conditions and where green public spaces are used throughout the year. Such cities with a Mediterranean temperament can include Corfu, Ialyssos in Rhodes, Agios Nikolaos in Crete, Ermoupolis in Syros, etc.
6. Conclusions
“Greenery” is a social good generously provided by nature and is distinguished by various values (historical, cultural, aesthetic, scientific, etc.). Green spaces in cities and suburbs are most often the result of planning and management but nevertheless embody the same values as nature’s greenery and serve the same needs of people. The bond between cities’ residents and green spaces is related to the factors or characteristics that influence the value that residents place on these areas.
The main results of this research are that knowledge of environmental issues (global or local) and the benefits of green spaces (urban and suburban) are what ultimately influence WTP, along with income (individual or family). This conclusion is in line with other studies implemented on issues other than greenery [88,89,90,91]. Further, it is found that environmental education in a general sense can contribute positively to the current demands of society because it increases knowledge about contemporary environmental issues [27,92,93,94,95].
Urban and suburban greenery as an entity contains a latent but dynamic monetary value. A value which, if ignored, can over time be the cause of its degradation and, possibly, its disappearance. This value includes the utility of these spaces, their aesthetics and attractiveness and characteristics, together with other key elements, the urban environment and the spaces where the residents can usually ‘escape’.
The residents’ willingness to pay for their cities’ green spaces is a measure of this value, because underlying this are all these personal characteristics and knowledge that reflect and embody these values. The factors of income and knowledge can be supportive of the management of green spaces and the adoption of relevant policies. The combination of the above can also create a new agenda for the conservation and improvement of natural and cultural heritage, thus contributing to the multi-functionality of the natural environment.
Author Contributions
Conceptualization, D.K. and F.C.; methodology, D.K. and E.L.; software, D.K. and K.M.; validation, F.C., E.L. and K.M.; formal analysis, D.K.; investigation, D.K.; writing—original draft preparation, D.K.; writing—review and editing, F.C., E.L. and K.M. All authors have read and agreed to the published version of the manuscript.
Funding
This research received no external funding.
Institutional Review Board Statement
The study was conducted in accordance with the Declaration of Helsinki, and approved by the Research Ethics Committee of the University of Western Macedonia (REC-UOWM) (protocol code 28 and date of approval 14/01/2022).
Informed Consent Statement
Informed consent was obtained from all subjects involved in the study.
Acknowledgments
This research did not receive any specific grant from funding agencies in the public, commercial or not-for-profit sectors. The authors thank the editor and the anonymous reviewers for the feedback and their insightful comments on the original submission. All errors and omissions remain the responsibility of the authors.
Conflicts of Interest
The authors declare no conflict of interest.
References
- Song, X.; Lv, X.; Li, C. Willingness and motivation of residents to pay for conservation of urban green spaces in Jinan, China. Acta Ecol. Sin. 2015, 35, 89–94. [Google Scholar] [CrossRef]
- Luttik, J. The value of trees, water and open space as reflected by house prices in the Netherlands. Landsc. Urban Plan. 2000, 48, 161–167. [Google Scholar] [CrossRef]
- Olszewska-Guizzo, A.; Mukoyama, A.; Naganawa, S.; Dan, I.; Husain, S.F.; Ho, C.S.; Ho, R. Hemodynamic Response to Three Types of Urban Spaces before and after Lockdown during the COVID-19 Pandemic. Int. J. Environ. Res. Public Health 2021, 18, 6118. [Google Scholar] [CrossRef] [PubMed]
- De Luca, C.; Libetta, A.; Conticelli, E.; Tondelli, S. Accessibility to and Availability of Urban Green Spaces (UGS) to Support Health and Wellbeing during the COVID-19 Pandemic—The Case of Bologna. Sustainability 2021, 13, 11054. [Google Scholar] [CrossRef]
- Schiappacasse, P.; Müller, B. Planning Green Infrastructure as a Source of Urban and Regional Resilience—Towards Institutional Challenges. Urbani Izziv 2015, 26, S13–S24. [Google Scholar] [CrossRef]
- Wolch, J.R.; Byrne, J.; Newell, J.P. Urban green space, public health, and environmental justice: The challenge of making cities “just green enough”. Landsc. Urban Plan. 2014, 125, 234–244. [Google Scholar] [CrossRef] [Green Version]
- Kalfas, D.G. The contribution of urban and suburban green areas and the sustainable development in the town of Florina. Ph.D. Thesis, Aristotle University of Thessaloniki, Thessaloniki, Greece, 2019. (In Greek). [Google Scholar]
- Hansen-møller, J.; Oustrup, L. Emotional, Physical/Functional and Symbolic Aspects of an Urban Forest in Denmark to Nearby Residents. Scand. J. For. Res. 2004, 19, 56–64. [Google Scholar] [CrossRef]
- Larcher, F.; Pomatto, E.; Battisti, L.; Gullino, P.; Devecchi, M. Perceptions of Urban Green Areas during the Social Distancing Period for COVID-19 Containment in Italy. Horticulturae 2021, 7, 55. [Google Scholar] [CrossRef]
- Neuvonen, M.; Sievänen, T.; Tönnes, S.; Koskela, T. Access to green areas and the frequency of visits—A case study in Helsinki. Urban For. Urban Green. 2007, 6, 235–247. [Google Scholar] [CrossRef]
- Meo, S.A.; Almutairi, F.J.; Abukhalaf, A.A.; Usmani, A.M. Effect of Green Space Environment on Air Pollutants PM2.5, PM10, CO, O3, and Incidence and Mortality of SARS-CoV-2 in Highly Green and Less-Green Countries. Int. J. Environ. Res. Public Health 2021, 18, 13151. [Google Scholar] [CrossRef]
- Gobster, P.H. Recreation and Leisure Research from an Active Living Perspective: Taking a Second Look at Urban Trail Use Data. Leis. Sci. 2005, 27, 367–383. [Google Scholar] [CrossRef]
- Spennemann, D.H.R. Exercising under COVID-2x: Conceptualizing Future Green Spaces in Australia’s Neighborhoods. Urban Sci. 2021, 5, 93. [Google Scholar] [CrossRef]
- Chaudhary, S.; McGregor, A.; Houston, D.; Chettri, N. Environmental justice and ecosystem services: A disaggregated analysis of community access to forest benefits in Nepal. Ecosyst. Serv. 2018, 29, 99–115. [Google Scholar] [CrossRef]
- Mayen Huerta, C.; Cafagna, G. Snapshot of the Use of Urban Green Spaces in Mexico City during the COVID-19 Pandemic: A Qualitative Study. Int. J. Environ. Res. Public Health 2021, 18, 4304. [Google Scholar] [CrossRef]
- Narain, V.; Nischal, S. The peri-urban interface in Shahpur Khurd and Karnera, India. Environ. Urban. 2007, 19, 261–273. [Google Scholar] [CrossRef] [Green Version]
- Fazal, S.; Banu, N.; Sultana, S. Expanding Cities, Contested Land: Role of Actors in the Context of Peri-Urban Interface. Curr. Urban Stud. 2015, 3, 187–198. [Google Scholar] [CrossRef] [Green Version]
- Hubbard, G.; Daas, C.D.; Johnston, M.; Murchie, P.; Thompson, C.W.; Dixon, D. Are Rurality, Area Deprivation, Access to Outside Space, and Green Space Associated with Mental Health during the COVID-19 Pandemic? A Cross Sectional Study (CHARIS-E). Int. J. Environ. Res. Public Health 2021, 18, 3869. [Google Scholar] [CrossRef]
- Fernández-Pablos, E.; Verdú-Vázquez, A.; López-Zaldívar, Ó.; Lozano-Diez, R. V Periurban Areas in the Design of Supra-Municipal Strategies for Urban Green Infrastructures. Forests 2021, 12, 626. [Google Scholar] [CrossRef]
- Narain, V. Growing city, shrinking hinterland: Land acquisition, transition and conflict in peri-urban Gurgaon, India. Environ. Urban. 2009, 21, 501–512. [Google Scholar] [CrossRef]
- Ahern, J. From fail-safe to safe-to-fail: Sustainability and resilience in the new urban world. Landsc. Urban Plan. 2011, 100, 341–343. [Google Scholar] [CrossRef] [Green Version]
- Verdú-Vázquez, A.; Fernández-Pablos, E.; Lozano-Diez, R.V.; López-Zaldívar, Ó. Development of a methodology for the characterization of urban and periurban green spaces in the context of supra-municipal sustainability strategies. Land Use Policy 2017, 69, 75–84. [Google Scholar] [CrossRef]
- Takano, T.; Nakamura, K.; Watanabe, M. Urban residential environments and senior citizens’ longevity in megacity areas: The importance of walkable green spaces. J. Epidemiol. Community Health 2002, 56, 913–918. [Google Scholar] [CrossRef] [PubMed] [Green Version]
- Kaplan, S.; Kaplan, R. Health, supportive environments, and the reasonable person model. Urban Ecol. Int. Perspect. Interact. Hum. Nat. 2008, 93, 557–565. [Google Scholar] [CrossRef]
- Baur, J.W.R. Urban green spaces, recreation and spiritual experiences. Leisure/Loisir 2018, 42, 205–229. [Google Scholar] [CrossRef]
- Nath, T.K.; Zhe Han, S.S.; Lechner, A.M. Urban green space and well-being in Kuala Lumpur, Malaysia. Urban For. Urban Green. 2018, 36, 34–41. [Google Scholar] [CrossRef]
- Xu, F.; Wang, Y.; Xiang, N.; Tian, J.; Chen, L. Uncovering the willingness-to-pay for urban green space conservation: A survey of the capital area in China. Resour. Conserv. Recycl. 2020, 162, 105053. [Google Scholar] [CrossRef]
- Korpela, K.; Hartiig, T. Restorative qualities of favourite places. J. Environ. Psychol. 1996, 16, 221–233. [Google Scholar] [CrossRef] [Green Version]
- Chiesura, A. The role of urban parks for the sustainable city. Landsc. Urban Plan. 2004, 68, 129–138. [Google Scholar] [CrossRef]
- Rossman, B.B.; Ulehla, Z.J. Psychological Reward Values Associated with Wilderness Use A Functional-Reinforcement Approach. Environ. Behav. 1977, 9, 41–66. [Google Scholar] [CrossRef]
- Korpela, K.M.; Hartig, T.; Kaiser, F.G.; Fuhrer, U. Restorative experience and self-regulation in favorite places. Environ. Behav. 2001, 33, 572–589. [Google Scholar] [CrossRef]
- Baycan-Levent, T.; Vreeker, R.; Nijkamp, P. A multi-criteria evaluation of green spaces in European cities. Eur. Urban Reg. Stud. 2009, 16, 193–213. [Google Scholar] [CrossRef]
- Ulrich, R.S.; Simons, R.F.; Losito, B.D.; Fiorito, E.; Miles, M.A.; Zelson, M. Stress recovery during exposure to natural and urban environments. J. Environ. Psychol. 1991, 11, 201–230. [Google Scholar] [CrossRef]
- Song, Y.; Gee, G.C.; Fan, Y.; Takeuchi, D.T. Do physical neighborhood characteristics matter in predicting traffic stress and health outcomes? Transp. Res. Part F Traffic Psychol. Behav. 2007, 10, 164–176. [Google Scholar] [CrossRef] [Green Version]
- van den Berg, A.E.; Maas, J.; Verheij, R.A.; Groenewegen, P.P. Green space as a buffer between stressful life events and health. Soc. Sci. Med. 2010, 70, 1203–1210. [Google Scholar] [CrossRef] [Green Version]
- Samara, T.; Tsitsoni, T. Selection of forest species for use in urban environment in relation to their potential capture to heavy metals. Glob. NEST J. 2014, 16, 966–974. [Google Scholar]
- Kontogianni, A.; Tsitsoni, T.; Goudelis, G. An index based on silvicultural knowledge for tree stability assessment and improved ecological function in urban ecosystems. Ecol. Eng. 2011, 37, 914–919. [Google Scholar] [CrossRef]
- Vecchiato, D.; Tempesta, T. Valuing the benefits of an afforestation project in a peri-urban area with choice experiments. For. Policy Econ. 2013, 26, 111–120. [Google Scholar] [CrossRef]
- Brander, L.M.; Koetse, M.J. The value of urban open space: Meta-analyses of contingent valuation and hedonic pricing results. J. Environ. Manag. 2011, 92, 2763–2773. [Google Scholar] [CrossRef]
- Chen, W.Y.; Jim, C.Y. Contingent valuation of ecotourism development in country parks in the urban shadow. Int. J. Sustain. Dev. World Ecol. 2012, 19, 44–53. [Google Scholar] [CrossRef]
- López-Mosquera, N.; Sánchez, M. Emotional and satisfaction benefits to visitors as explanatory factors in the monetary valuation of environmental goods. An application to periurban green spaces. Land Use Policy 2011, 28, 151–166. [Google Scholar] [CrossRef]
- Bernath, K.; Roschewitz, A. Recreational benefits of urban forests: Explaining visitors’ willingness to pay in the context of the theory of planned behavior. J. Environ. Manag. 2008, 89, 155–166. [Google Scholar] [CrossRef] [PubMed]
- Wang, W.; Jin, J.; He, R.; Gong, H.; Tian, Y. Farmers’ Willingness to Pay for Health Risk Reductions of Pesticide Use in China: A Contingent Valuation Study. Int. J. Environ. Res. Public Health 2018, 15, 625. [Google Scholar] [CrossRef] [PubMed] [Green Version]
- Hou, Y.; Li, B.; Müller, F.; Fu, Q.; Chen, W. A conservation decision-making framework based on ecosystem service hotspot and interaction analyses on multiple scales. Sci. Total Environ. 2018, 643, 277–291. [Google Scholar] [CrossRef]
- Sarvilinna, A.; Lehtoranta, V.; Hjerppe, T. Are Urban Stream Restoration Plans Worth Implementing? Environ. Manag. 2017, 59, 10–20. [Google Scholar] [CrossRef] [PubMed]
- Borger, T. Keeping up appearances: Motivations for socially desirable responding in contingent valuation interviews. Ecol. Econ. 2013, 87, 155–165. [Google Scholar] [CrossRef]
- Venkatachalam, L. The contingent valuation method: A review. Environ. Impact Assess. Rev. 2004, 24, 89–124. [Google Scholar] [CrossRef]
- Sattout, E.J.; Talhouk, S.N.; Caligari, P.D.S. Economic value of cedar relics in Lebanon: An application of contingent valuation method for conservation. Ecol. Econ. 2007, 61, 315–322. [Google Scholar] [CrossRef]
- Birdir, S.; Ünal, Ö.; Birdir, K.; Williams, A.T. Willingness to pay as an economic instrument for coastal tourism management: Cases from Mersin, Turkey. Tour. Manag. 2013, 36, 279–283. [Google Scholar] [CrossRef]
- Davis, R.K. Recreation Planning as an Economic Problem. Nat. Resour. J. 1963, 3, 239–249. [Google Scholar]
- Grahn, P.; Stigsdotter, U.K. The relation between perceived sensory dimensions of urban green space and stress restoration. Landsc. Urban Plan. 2010, 94, 264–275. [Google Scholar] [CrossRef]
- Jim, C.Y.; Chen, W.Y. Recreation–amenity use and contingent valuation of urban greenspaces in Guangzhou, China. Landsc. Urban Plan. 2006, 75, 81–96. [Google Scholar] [CrossRef]
- Throsby, D. Determining the Value of Cultural Goods: How Much (or How Little) Does Contingent Valuation Tell Us? J. Cult. Econ. 2003, 27, 275–285. [Google Scholar] [CrossRef]
- Epstein, R.A. The Regrettable Necessity of Contingent Valuation. J. Cult. Econ. 2003, 27, 259–274. [Google Scholar] [CrossRef]
- Li, Z.; Xia, J.; Deng, X.; Yan, H. Multilevel modelling of impacts of human and natural factors on ecosystem services change in an oasis, Northwest China. Resour. Conserv. Recycl. 2021, 169, 105474. [Google Scholar] [CrossRef]
- Kelly, R.A.; Jakeman, A.J.; Barreteau, O.; Borsuk, M.E.; ElSawah, S.; Hamilton, S.H.; Henriksen, H.J.; Kuikka, S.; Maier, H.R.; Rizzoli, A.E.; et al. Selecting among five common modelling approaches for integrated environmental assessment and management. Environ. Model. Softw. 2013, 47, 159–181. [Google Scholar] [CrossRef]
- Dunford, R.W.; Harrison, P.A.; Bagstad, K.J. Computer modelling for ecosystem service assessment. In Mapping Ecosystem Services; Burkhard, B., Maes, J., Eds.; Pensoft Publishers: Sofia, Bulgaria, 2017; pp. 126–137. ISBN 978-954-642-829-5. [Google Scholar]
- Dunford, R.W.; Smith, A.C.; Harrison, P.A.; Hanganu, D. Ecosystem service provision in a changing Europe: Adapting to the impacts of combined climate and socio-economic change. Landsc. Ecol. 2015, 30, 443–461. [Google Scholar] [CrossRef] [PubMed] [Green Version]
- Mouchet, M.A.; Rega, C.; Lasseur, R.; Georges, D.; Paracchini, M.L.; Renaud, J.; Stürck, J.; Schulp, C.J.E.; Verburg, P.H.; Verkerk, P.J.; et al. Ecosystem service supply by European landscapes under alternative land-use and environmental policies. Int. J. Biodivers. Sci. Ecosyst. Serv. Manag. 2017, 13, 342–354. [Google Scholar] [CrossRef]
- Schröter, M.; Remme, R.P.; Sumarga, E.; Barton, D.N.; Hein, L. Lessons learned for spatial modelling of ecosystem services in support of ecosystem accounting. Ecosyst. Serv. 2015, 13, 64–69. [Google Scholar] [CrossRef]
- Zulian, G.; Stange, E.; Woods, H.; Carvalho, L.; Andrews, C.; Baró, F.; Vizcaino, P.; Barton, D.N.; Nowel, M.; Rusch, G.M.; et al. Practical application of spatial ecosystem service models to aid decision support. Ecosyst. Serv. 2018, 29, 465–480. [Google Scholar] [CrossRef]
- Kalfas, D.G.; Zagkas, D.T.; Dragozi, E.I.; Zagkas, T.D. Estimating value of the ecosystem services in the urban and peri-urban green of a town Florina-Greece, using the CVM. Int. J. Sustain. Dev. World Ecol. 2020, 27, 310–321. [Google Scholar] [CrossRef]
- Kalfas, D.G.; Zagkas, D.T.; Raptis, D.I.; Zagkas, T.D. The multifunctionality of the natural environment through the basic ecosystem services in the Florina region, Greece. Int. J. Sustain. Dev. World Ecol. 2019, 26, 57–68. [Google Scholar] [CrossRef]
- Chatzitheodoridis, F.; Kontogeorgos, A. Exploring of a Small-Scale Tourism Product under Economic Instability: The Case of a Greek Rural Border Area. Economies 2020, 8, 52. [Google Scholar] [CrossRef]
- Chatzitheodoridis, F.; Michailidis, A.; Theodosiou, G.; Loizou, E. Local cooperation: A dynamic force for endogenous rural development. Contrib. Econ. 2013, 3, 121–132. [Google Scholar] [CrossRef]
- Kalfas, D.G.; Tyrselis, X.S.; Grigoriadis, N.S.; Matsinos, Y.G. Sustainable management of local resources regarding mountainous regions. the case of Nymfaio in Florina, Greece. J. Environ. Prot. Ecol. 2013, 14, 655–663. [Google Scholar]
- Reinwald, F.; Haluza, D.; Pitha, U.; Stangl, R. Urban green infrastructure and green open spaces: An issue of social fairness in times of COVID-19 crisis. Sustainability 2021, 13, 606. [Google Scholar] [CrossRef]
- Herman, K.; Drozda, Ł. Green Infrastructure in the Time of Social Distancing: Urban Policy and the Tactical Pandemic Urbanism. Sustainability 2021, 13, 1632. [Google Scholar] [CrossRef]
- Yamazaki, T.; Iida, A.; Hino, K.; Murayama, A.; Hiroi, U.; Terada, T.; Koizumi, H.; Yokohari, M. Use of Urban Green Spaces in the Context of Lifestyle Changes during the COVID-19 Pandemic in Tokyo. Sustainability 2021, 13, 9817. [Google Scholar] [CrossRef]
- Dimopoulos, P.; Drakou, E.; Kokkoris, I.; Katsanevakis, S.; Kallimanis, A.; Tsiafouli, M.; Bormpoudakis, D.; Kormas, K.; Arends, J. The need for the implementation of an Ecosystem Services assessment in Greece: Drafting the national agenda. One Ecosyst. 2017, 2, e13714. [Google Scholar] [CrossRef]
- Katsanevakis, S.; Levin, N.; Coll, M.; Giakoumi, S.; Shkedi, D.; Mackelworth, P.; Levy, R.; Velegrakis, A.; Koutsoubas, D.; Caric, H.; et al. Marine conservation challenges in an era of economic crisis and geopolitical instability: The case of the Mediterranean Sea. Mar. Policy 2015, 51, 31–39. [Google Scholar] [CrossRef] [Green Version]
- Apostolopoulou, E.; Adams, W.M. Neoliberal Capitalism and Conservation in the Post-crisis Era: The Dialectics of “Green” and “Un-green” Grabbing in Greece and the UK. Antipode 2015, 47, 15–35. [Google Scholar] [CrossRef] [Green Version]
- Dimelli, D.P. Planning settlements in the Greek islands. Reg. Sci. Inq. 2016, 8, 23–38. [Google Scholar]
- Dimelli, D.P. The Effects of Tourism in Greek Insular Settlements and the Role of Spatial Planning. J. Knowl. Econ. 2017, 8, 319–336. [Google Scholar] [CrossRef]
- Petrakos, G.; Psycharis, Y. The spatial aspects of economic crisis in Greece. Camb. J. Reg. Econ. Soc. 2016, 9, 137–152. [Google Scholar] [CrossRef]
- Christiaensen, L.; Ferré, C. Just Coal Transition in Western Macedonia, Greece—Insights from the Labor Market; World Bank: Washington, DC, USA, 2020; p. 42. [Google Scholar]
- Alves Dias, P.; Kanellopoulos, K.; Medarac, H.; Kapetaki, Z.; Miranda Barbosa, E.; Shortall, R.; Czako, V.; Telsnig, T.; Vazquez Hernandez, C.; Lacal Arantegui, R.; et al. EU Coal Regions: Opportunities and Challenges Ahead; European Commission, Joint Research Centre: Petten, The Netherlands, 2018; p. 189. [Google Scholar]
- Xie, J.; Luo, S.; Furuya, K.; Sun, D. Urban Parks as Green Buffers During the COVID-19 Pandemic. Sustainability 2020, 12, 6751. [Google Scholar] [CrossRef]
- Luo, S.; Xie, J.; Furuya, K. “We Need such a Space”: Residents’ Motives for Visiting Urban Green Spaces during the COVID-19 Pandemic. Sustainability 2021, 13, 6806. [Google Scholar] [CrossRef]
- Danilina, N.; Tsurenkova, K.; Berkovich, V. Evaluating Urban Green Public Spaces: The Case Study of Krasnodar Region Cities, Russia. Sustainability 2021, 13, 14059. [Google Scholar] [CrossRef]
- Slaev, A.D. Types of planning and property rights. Plan. Theory 2016, 15, 23–41. [Google Scholar] [CrossRef]
- Slaev, A.D. Matching the degree of privateness/collectiveness to the scale of resource use. Land Use Policy 2022, 112, 105809. [Google Scholar] [CrossRef]
- Cozzolino, S.; Moroni, S. Multiple agents and self-organisation in complex cities: The crucial role of several property. Land Use Policy 2021, 103, 105297. [Google Scholar] [CrossRef]
- Slaev, A.D. Complex private-common property rights in institutional and planning theories. Plan. Theory 2019, 19, 193–213. [Google Scholar] [CrossRef]
- Alexander, E.R. Institutional Design for Value Capture and a Case: The Tel-Aviv Metropolitan Park. Int. Plan. Stud. 2012, 17, 163–177. [Google Scholar] [CrossRef]
- Blanco, A.G.; Moreno, N.; Vetter, D.M.; Vetter, M.F. The Potential of Land Value Capture for Financing Urban Projects: Methodological Considerations and Case Studies; Inter-American Development Bank: Washington, DC, USA, 2017. [Google Scholar]
- Wu, J.; Wu, G.; Zheng, T.; Zhang, X.; Zhou, K. Value capture mechanisms, transaction costs, and heritage conservation: A case study of Sanjiangyuan National Park, China. Land Use Policy 2020, 90, 104246. [Google Scholar] [CrossRef]
- Mamadzhanov, A.; McCluskey, J.J.; Li, T. Willingness to pay for a second-generation bioethanol: A case study of Korea. Energy Policy 2019, 127, 464–474. [Google Scholar] [CrossRef]
- Alfonso, E.; Maria, E.; Alejandro, V.-D. Valuing Visitor Willingness to Pay for Urban Green Space Conservation: Case of Maria Luisa Park in Seville, Spain. J. Urban Plan. Dev. 2021, 147, 5021020. [Google Scholar] [CrossRef]
- Yormirzoev, M.; Li, T.; Teuber, R. Consumers’ willingness to pay for organic versus all-natural milk—Does certification make a difference? Int. J. Consum. Stud. 2021, 45, 1020–1029. [Google Scholar] [CrossRef]
- Ghadikolaei, M.A.; Wong, P.K.; Cheung, C.S.; Zhao, J.; Ning, Z.; Yung, K.-F.; Wong, H.C.; Gali, N.K. Why is the world not yet ready to use alternative fuel vehicles? Heliyon 2021, 7, e07527. [Google Scholar] [CrossRef] [PubMed]
- Bauwelinck, M.; Zijlema, W.L.; Bartoll, X.; Vandenheede, H.; Cirach, M.; Lefebvre, W.; Vanpoucke, C.; Basagaña, X.; Nieuwenhuijsen, M.J.; Borrell, C.; et al. Residential urban greenspace and hypertension: A comparative study in two European cities. Environ. Res. 2020, 191, 110032. [Google Scholar] [CrossRef]
- Giezen, M.; Pellerey, V. Renaturing the city: Factors contributing to upscaling green schoolyards in Amsterdam and The Hague. Urban For. Urban Green. 2021, 63, 127190. [Google Scholar] [CrossRef]
- Astell-Burt, T.; Feng, X. Urban green space, tree canopy and prevention of cardiometabolic diseases: A multilevel longitudinal study of 46 786 Australians. Int. J. Epidemiol. 2020, 49, 926–933. [Google Scholar] [CrossRef] [Green Version]
- Bijnens, E.M.; Derom, C.; Thiery, E.; Weyers, S.; Nawrot, T.S. Residential green space and child intelligence and behavior across urban, suburban, and rural areas in Belgium: A longitudinal birth cohort study of twins. PLoS Med. 2020, 17, e1003213. [Google Scholar] [CrossRef]
Publisher’s Note: MDPI stays neutral with regard to jurisdictional claims in published maps and institutional affiliations. |
© 2022 by the authors. Licensee MDPI, Basel, Switzerland. This article is an open access article distributed under the terms and conditions of the Creative Commons Attribution (CC BY) license (https://creativecommons.org/licenses/by/4.0/).