
The Resilient Community: Strengthening People-Centered Disaster Risk Reduction in the Merapi Volcano Community, Java, Indonesia


Abstract
:1. Introduction
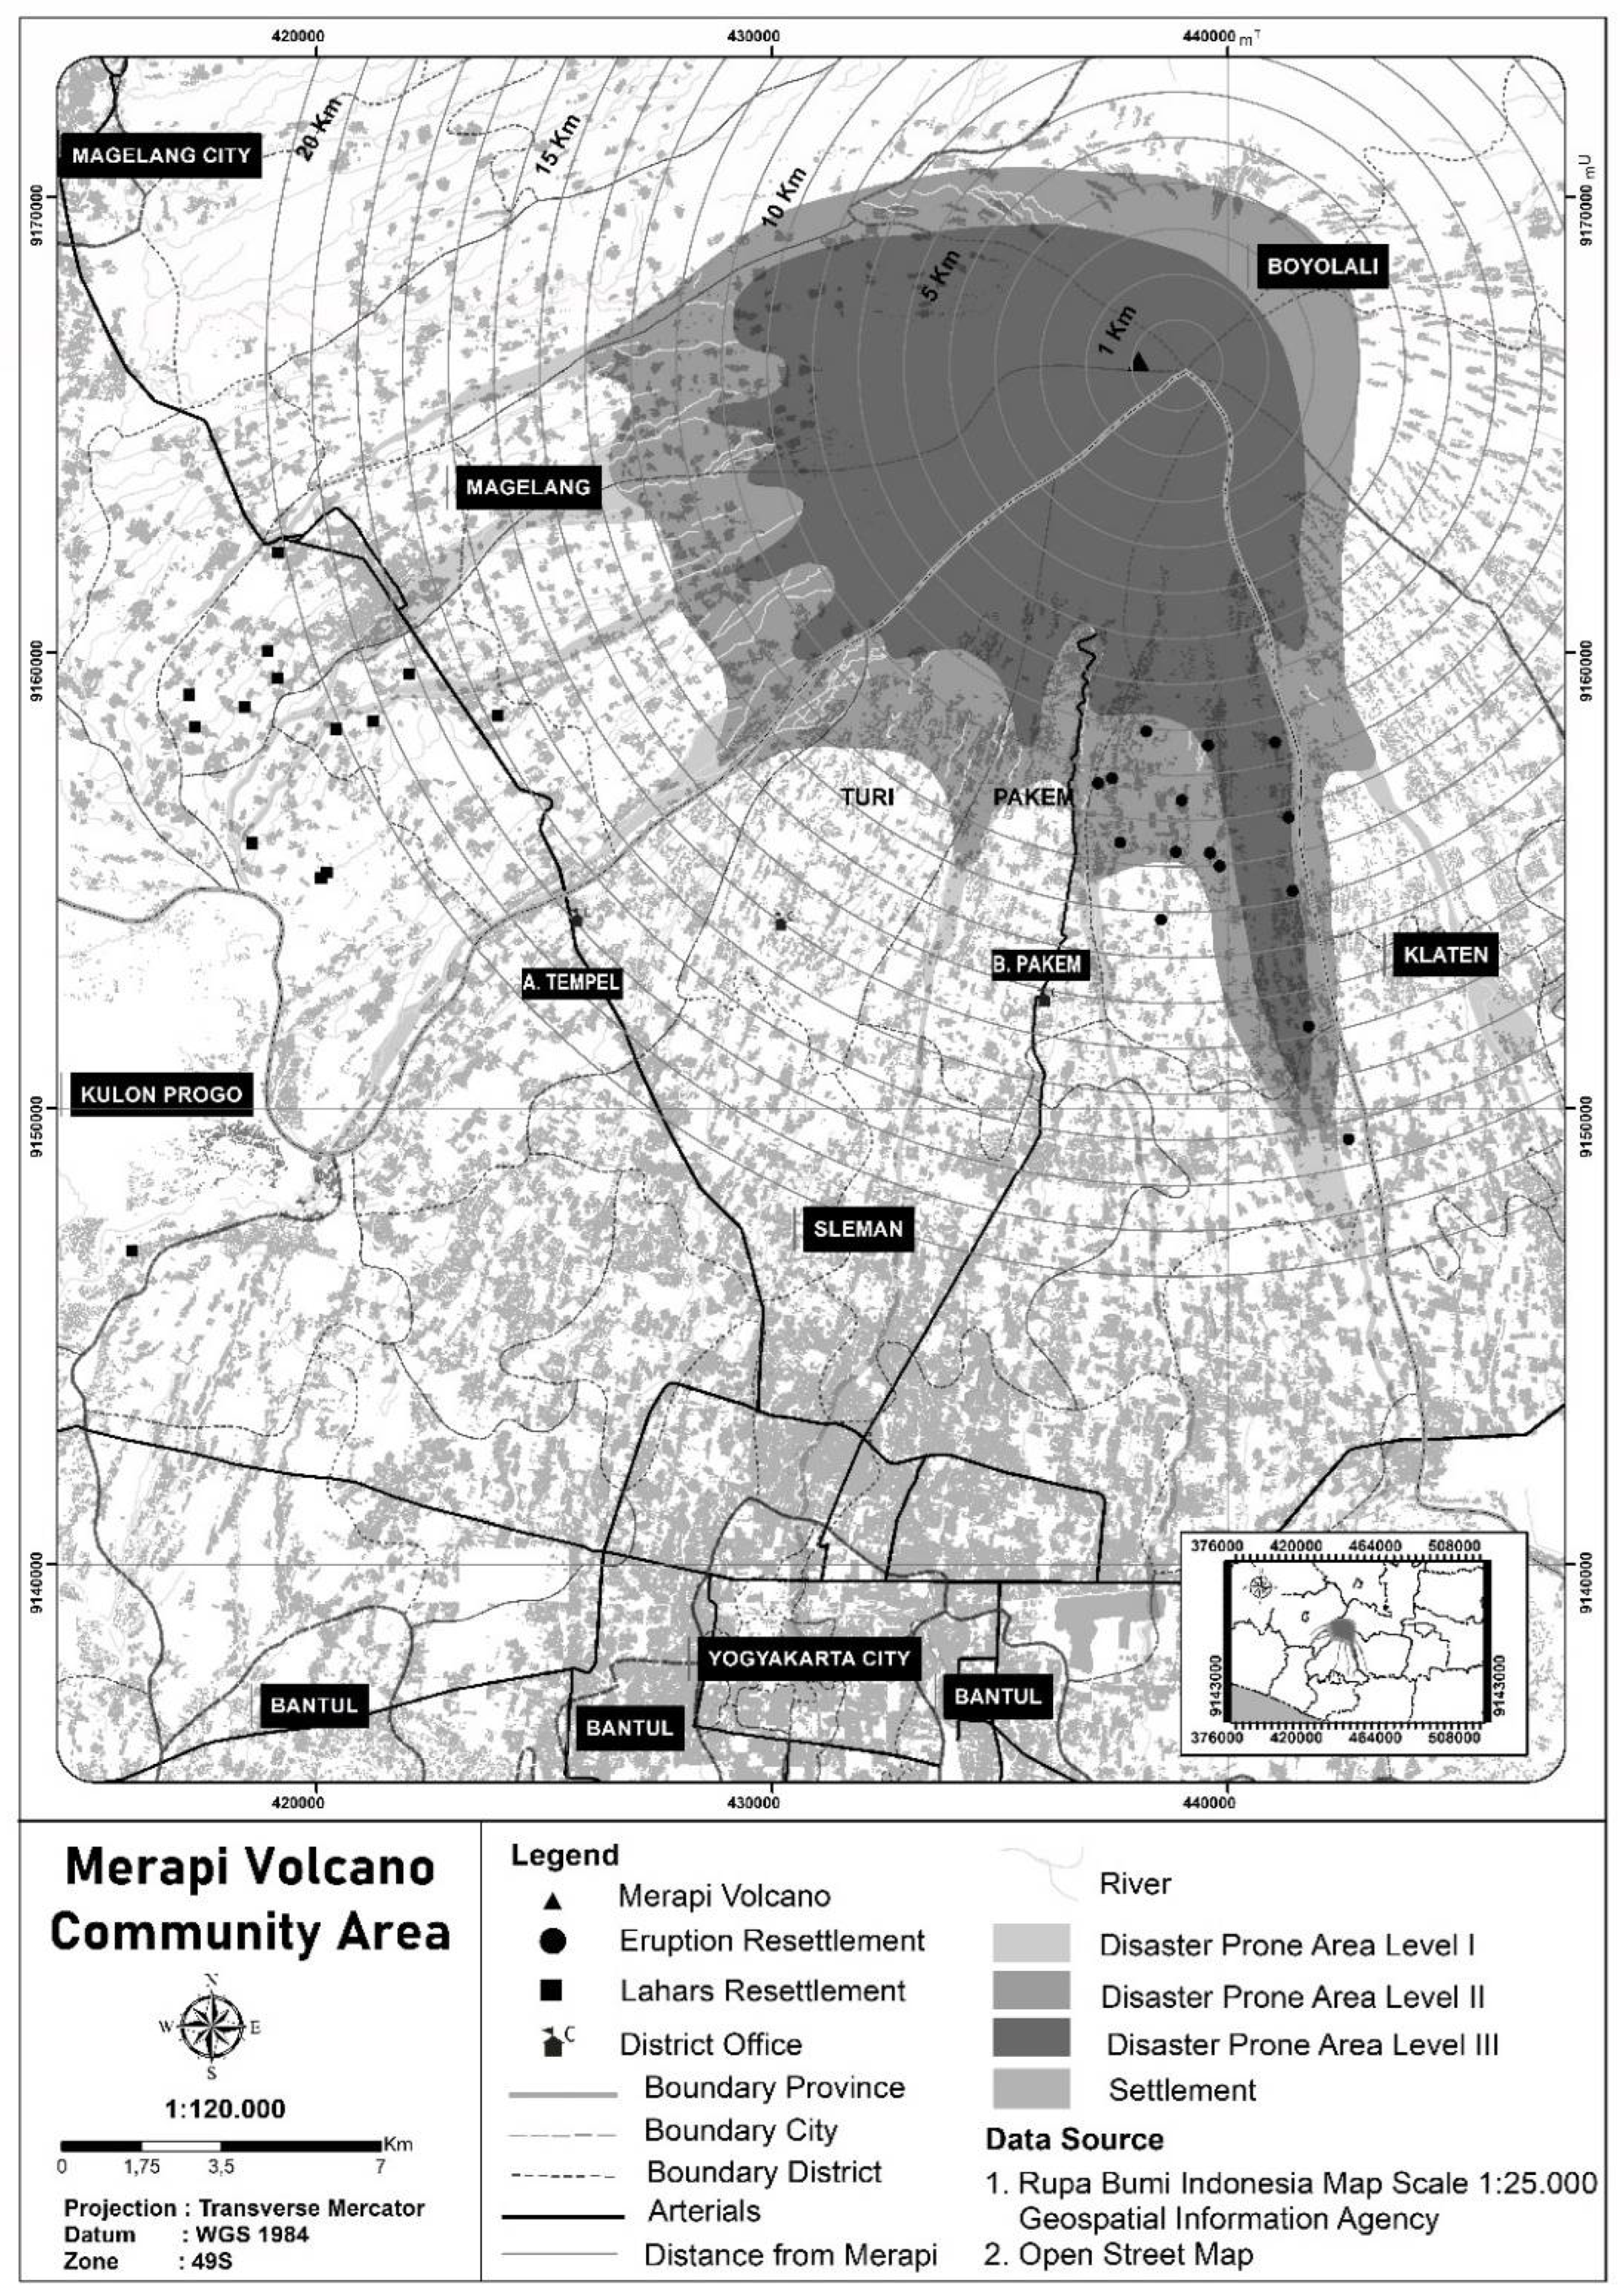
2. Study Area
3. Data and Methods
3.1. Survey and Sampling Design
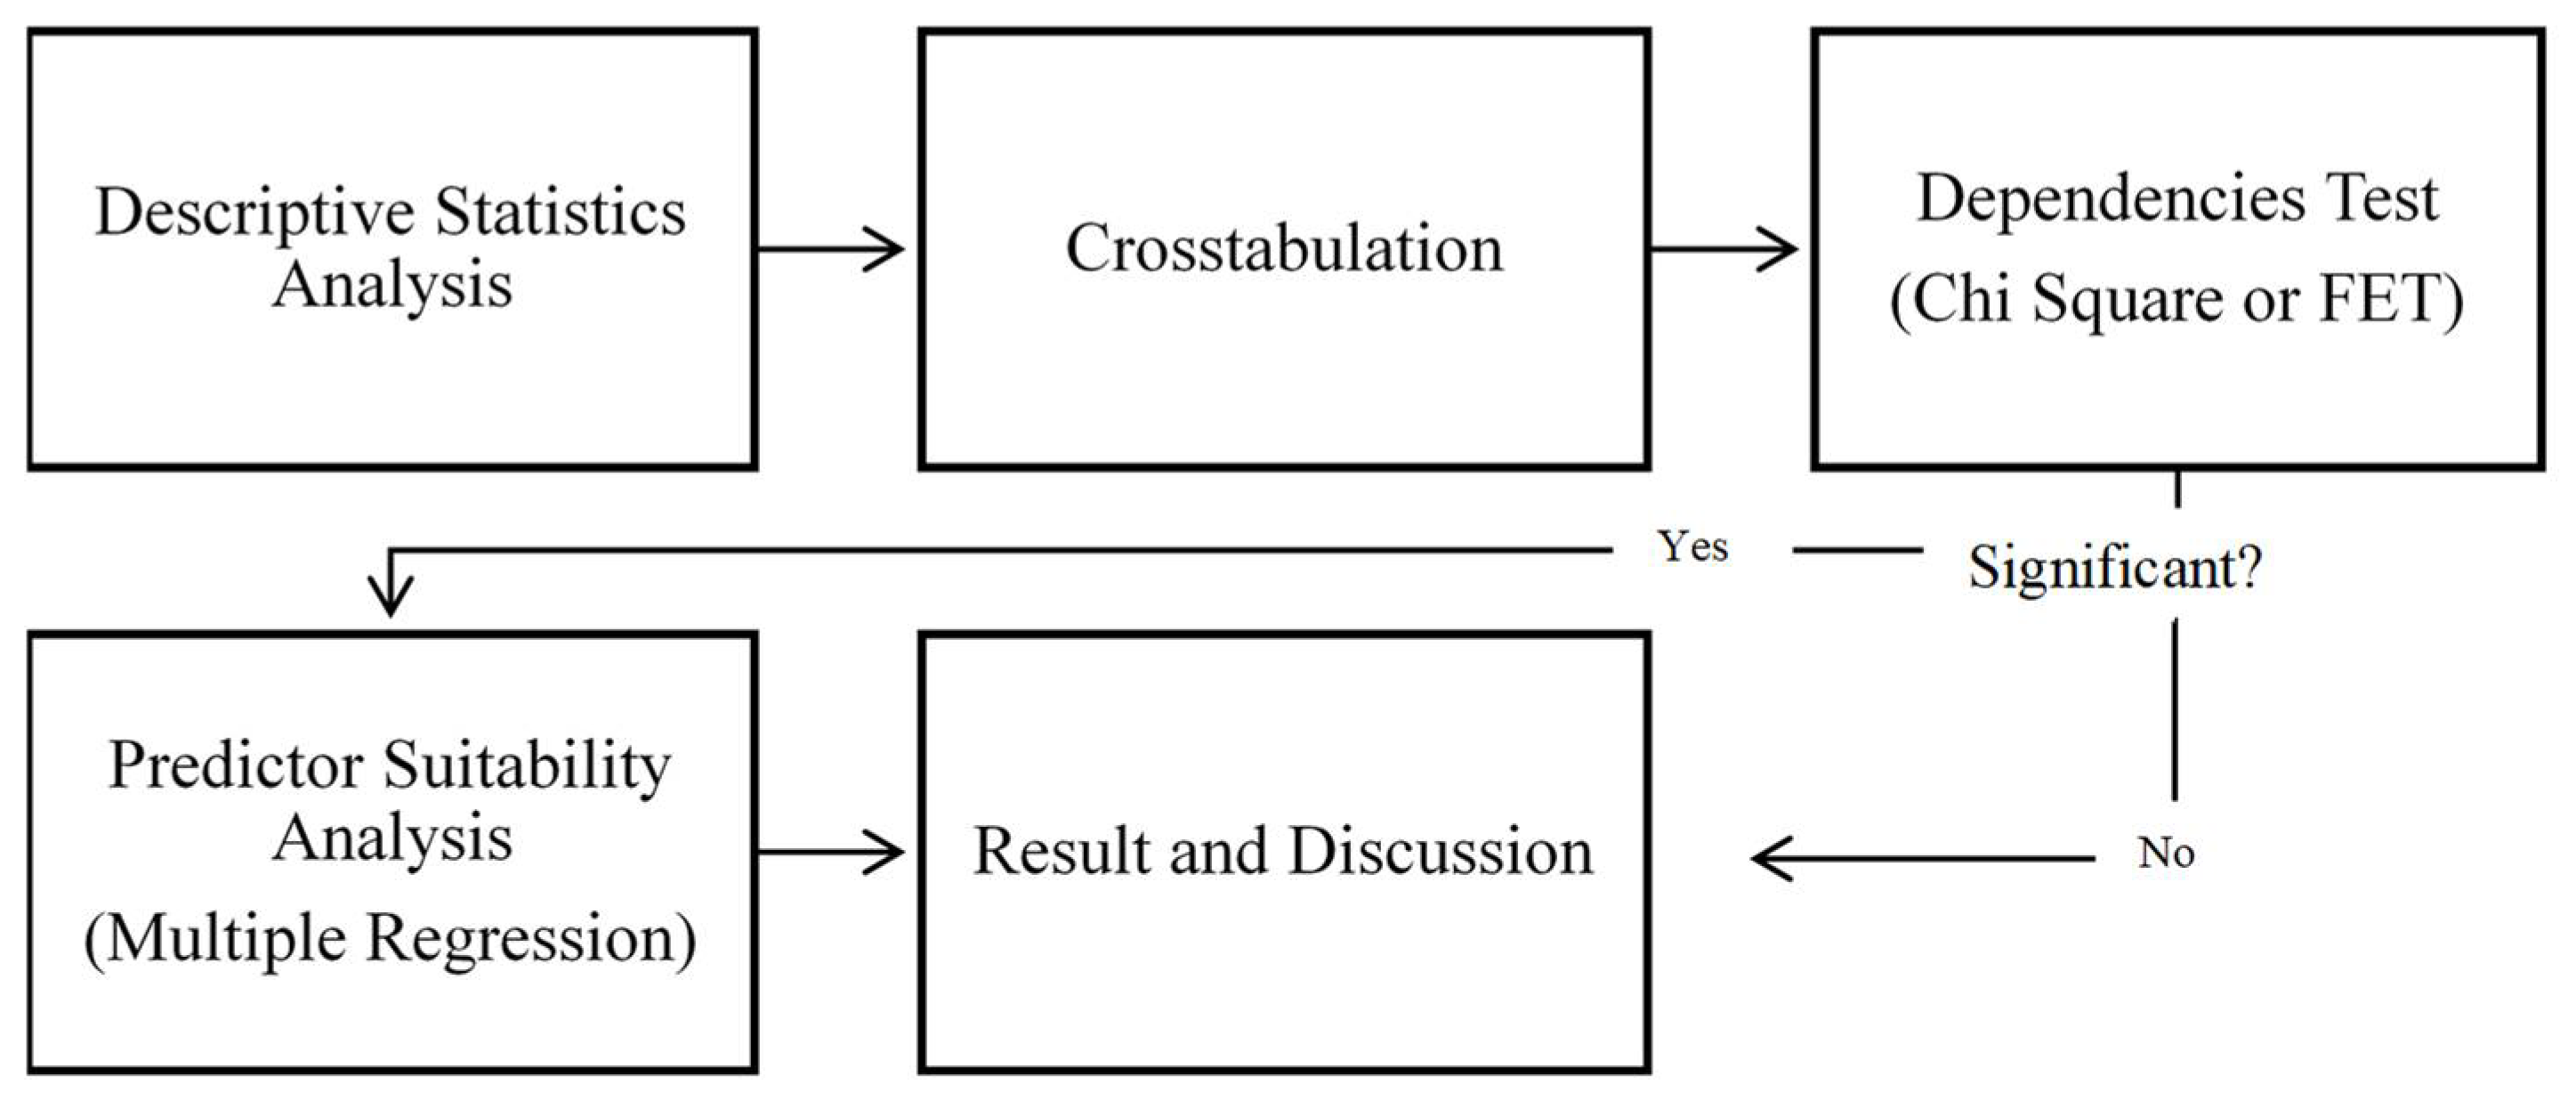
3.2. Data Analysis
3.2.1. Tools
3.2.2. Descriptive Analysis
3.2.3. The Goodness-of-fit Test
3.2.4. Multiple Regression for Predictor-Suitability Analysis
3.3. Survey Result
3.3.1. Individual Attributes Survey Result
3.3.2. Descriptive Statistics Disaster Risk Reduction
4. Result and Analysis
4.1. Local Community: Risk Knowledge and Disaster Information Access
4.2. Community DRR Program Experience
4.3. Community-based Disaster Risk Management (CBDRM), Community Roles, Networks, and Collaboration
4.4. Predictive Models of Sub-Variables of Individual Profile and DRR Programs
- Model 1: education level: primary (X1), secondary (X2), and tertiary (X3) to predict the perception of disaster information accessibility scores.
- Model 2: each gender (male (X1) and female (X2)) to predict the experience of DRR programs.
- Model 3: duration of staying in the neighborhood (≤10 (X1), 10–≤30 (X2), >30 (X3) years) to predict the experience of DRR programs.
- Model 4: people’s type of occupation (worker and homemaker–activity type 1 (X1), unemployed and retired–activity type 2 (X2), and students–activity type 3 (X3)) to predict their perception of the advantages of DRR programs for disaster preparedness.
- Model 5: whether a type of occupation (worker and homemaker–activity type 1 (X1), unemployed and retired–activity type 2 (X2), and students–activity type 3 (X3)) to predict the value of their awareness of CBDRM existence in their neighborhood.
- Model 6: education level (primary (X1), secondary (X2), and tertiary (X3)) to predict perceptions of the inclusive process during the disaster.
5. Discussion
6. Conclusions
Author Contributions
Funding
Institutional Review Board Statement
Informed Consent Statement
Data Availability Statement
Acknowledgments
Conflicts of Interest
Appendix A

| Questions | Programs | |
|---|---|---|
| A. Individual attributes as community members | ||
| 1. | Sex (Gender) | (1) Female; (2) Male; (3) Not Stated |
| 2. | Age (years) | (1) Less than 18; (2) 18–19; (3) 20–24; (4) 25–29; (5) 30–34; (6) 35–39; (7) 40–44; (8) 45–49; (9) 50–54, (10) 55–59; (11) 60–64; (12) 65–69; (13) More than 70 |
| 3. | Duration of stay in neighborhood (years) | (1) <1; (2) 1–3; (3) 3–5; (4) 5–10; (5) 10–15; (6) 15–20; (7) 20–25; (8) 25–30; (9) 30–35; (10) >35 |
| 4. | Education | (1) No education qualification; (2) Elementary School; (3) Junior HS; (4) Senior HS; (5) Professional Certificate/Diploma; (6) University Undergraduate; (7) University postgraduate (Master, Doctoral); (8) Others |
| 5. | Monthly income (Million IDR) | (1) Do not have fixed monthly income; (2) <3; (3) 3–5; (4) 5–8; (5) 8–10; (6) 10–15; (7) 15–25; (8) 25–35; (9) 35–45; (10) >45 |
| 6. | Daily activity | (1) Employed; (2) Unemployed; (3) Retired; (4) Homemaker (including Housewife); (5) Student; (6) Entrepreneur |
| 7. | Household profile | (1) Single person HH; (2) Couple without child; (3) Single parent with one child or more; (4) Parents with one child or more; (5) Others |
| B. Risk knowledge and information | ||
| 8. | What is the possibility that the following hazards could affect life: (1) Hydrometeorological hazard; (2) Earthquake; (3) Volcanic Eruption; (4) Flood; (5) Landslide; (6) Drought; (7) Climate change; (8) Work accident; (9) Household accident; (10) Pandemic; (11) Traffic accident; (12) Crime; (13) Infrastructure failure; (14) Recreational hazard | (1) Never; (2) Rarely; (3) Neutral; (4) Possible; (5) Highly Possible |
| 9. | Source of information | (1) TV; (2) social media; (3) Friends and family; (4) Internet (website); (5) News portal; (6) Local DMA; (7) National DMA; (8) Radio; (9) Community meeting; (10) Local government (aside local DMA); (11) DRR community (12) Workplace; (13) Printed information (billboard, brochure, etc.); (14) Emergency service; (15) School; (16) Insurance company; (17) Others |
| 10. | Type of disaster accessed information | (1) Recent and updated information of Merapi Volcano; (2) Knowledge about volcanic hazard; (3) Evacuation and emergencies procedure; (4) Evacuation shelter; (5) Evacuation route; (6) EWS—early warning system; (7) Time for evacuation; (8) CBDRM—community-based disaster risk management; (9) Contact and network communication during emergencies; (10) Disaster drill and simulation; (11) Live guidelines in the temporary shelters; (12) Organization of disaster emergency response; (13) Others |
| 11. | The accessibility of disaster information | (1) Yes; (2) Maybe; (3) No; (4) Do not know |
| C. Capacity building and future perspective | ||
| 12. | Experience of DRR programs | (1) Yes; (2) No; (3) Do not know |
| 13 | DRR programs participated in | (1) Disaster contingency plan making; (2) Disaster training and workshop (3) Disaster drill and simulation; (4) Community disaster camp (school or volunteer); (5) Making community emergency SOP—standard operational procedures; (6) Contributing into disaster evacuation route making and implementation; (7) Building another structural mitigation; (8) DRR campaign, fair, and feast; (9) Community meeting; (10) Livelihood based tourism on disaster-prone area training and capacity building; (11) Livestock management during an emergency; (12) Participating into social insurance for disaster emergency |
| 14. | Advantages of DRR program for preparing the community for a possible threat | (1) Yes; (2) Maybe; (3) No; (4) Do not know |
| D. Organization, roles, and network | ||
| 15. | Awareness of CBDRM organization in their neighborhood | (1) Yes; (2) No; (3) Do not know |
| 16. | Prioritizing the vulnerable group during and after the emergency | (1) Yes; (2) No; (3) Do not know |
| 17. | The importance of women group on the decision making and DRR | (1) Yes; (2) No; (3) Maybe |
| 18. | Example of women roles in DRR program | (1) Evacuation shelter and routes planning; (2) Well-being management in the shelter (e.g., sanitation availability, cleanliness, health facilities, etc.); (3) The psychological condition of refugees; (4) Children education during the emergency; (5) Logistics and necessities (management) during emergencies; (6) Others |
| 19. | Perception that collaborating with external stakeholders would give advantages for community preparedness | (1) Yes; (2) No; (3) Maybe |
Appendix B
| Hazards | Never | Rarely | Neutral | Possible | Highly Possible | Total | Weighted Average |
|---|---|---|---|---|---|---|---|
| Volcanic Eruption | 0.81% | 5.66% | 4.04% | 30.19% | 59.30% | 371 | 4.42 |
| Earthquake | 1.35% | 12.13% | 1.08% | 43.94% | 41.51% | 371 | 4.12 |
| Hydrometeorological Hazard | 2.70% | 14.29% | 3.50% | 46.36% | 33.15% | 371 | 3.93 |
| Pandemic | 4.31% | 11.32% | 5.12% | 48.52% | 30.73% | 371 | 3.90 |
| Climate Change | 0.81% | 12.67% | 12.67% | 48.79% | 25.07% | 371 | 3.85 |
| Traffic Accident | 1.89% | 16.44% | 8.89% | 48.25% | 24.53% | 371 | 3.77 |
| Infrastructure failure | 3.50% | 19.68% | 10.51% | 45.55% | 20.75% | 371 | 3.60 |
| Recreational hazard | 5.66% | 15.63% | 13.21% | 47.17% | 18.33% | 371 | 3.57 |
| Crime | 6.47% | 19.68% | 10.24% | 42.59% | 21.02% | 371 | 3.52 |
| Work Accident | 5.12% | 25.88% | 9.16% | 39.08% | 20.75% | 371 | 3.44 |
| Household Accident | 4.04% | 28.03% | 11.32% | 40.43% | 16.17% | 371 | 3.37 |
| Flood | 16.71% | 19.95% | 9.43% | 28.03% | 25.88% | 371 | 3.26 |
| Drought | 11.32% | 23.45% | 10.24% | 43.67% | 11.32% | 371 | 3.20 |
| Landslide | 25.34% | 28.30% | 8.63% | 24.80% | 12.94% | 371 | 2.72 |
| Source of Information | Responses | |
|---|---|---|
| TV | 91.16% | 268 |
| Social Media | 87.76% | 258 |
| Friends or Family | 78.91% | 232 |
| Internet (website) | 73.81% | 217 |
| News Portal | 66.33% | 195 |
| Local DMA | 57.82% | 170 |
| National DMA | 56.46% | 166 |
| Radio | 56.12% | 165 |
| Community Meeting | 51.02% | 150 |
| Local Government (aside Local DMA) | 42.52% | 125 |
| DRR Community | 40.82% | 120 |
| Workplace | 38.78% | 114 |
| Printed Information (Billboard, Brochure, etc.) | 37.07% | 109 |
| Emergency Service | 37.07% | 109 |
| School | 33.67% | 99 |
| Insurance Company | 5.10% | 15 |
| Others | 13 | |
| Total Respondents | 294 | |
Appendix C
| Sex | Total | |||
|---|---|---|---|---|
| Woman | Man | |||
| Yes | Count | 17a | 21b | 38 |
| Expected Count | 23.1 | 14.9 | 38.0 | |
| % | 44.7% | 55.3% | 100.0% | |
| No | Count | 31a | 10b | 41 |
| Expected Count | 24.9 | 16.1 | 41.0 | |
| % | 75.6% | 24.4% | 100.0% | |
| Total | Count | 48 | 31 | 79 |
| Expected Count | 48.0 | 31.0 | 79.0 | |
| % | 60.8% | 39.2% | 100.0% | |
| Activities | Responses | |
|---|---|---|
| Logistics and necessities (management) during emergency situations | 90.1% | 136 |
| Children education during the emergency | 70.2% | 106 |
| The psychological condition of refugees | 57.6% | 87 |
| Wellbeing management in shelter (e.g., sanitation availability, cleanliness, health facilities, etc.) | 53.0% | 80 |
| Evacuation shelter and routes planning | 27.8% | 42 |
| Others | 11.9% | 18 |
| Total Respondents | 151 | |
Appendix D
| Variables | n | Value | df | Asymptotic Significance (2-Sided) | Exact Sig. (2-Sided) | Test |
|---|---|---|---|---|---|---|
| Sex | 79 | 7.884 | 1 | 0.005 | 0.006 | Chi-square |
| Age group | 77 | 5.009 | 0.079 | Fisher’s exact test | ||
| Duration of staying in the neighborhood | 78 | 9.983 | 2 | 0.007 | 0.007 | Chi-square |
| Education | 78 | 2.850 | 0.419 | Fisher’s exact test | ||
| Monthly income | 71 | 6.039 | 3 | 0.110 | 0.112 | Chi-square |
| Activity | 78 | 1.923 | 0.448 | Fisher’s exact test | ||
| Household types | 69 | 1.993 | 0.474 | Fisher’s exact test |
| Variables | n | Value | df | Asymptotic Significance (2-Sided) | Exact Sig. (2-Sided) | Test |
|---|---|---|---|---|---|---|
| Sex | 46 | 3.067 | 1 | 0.080 | 0.187 | Chi-square * |
| Age group | 44 | 1.747 | 0.538 | Fisher’s exact test | ||
| Duration of staying in the neighborhood | 45 | 0.851 | 0.853 | Fisher’s exact test | ||
| Education | 45 | 1.853 | 0.621 | Fisher’s exact test | ||
| Monthly income | 44 | 1.231 | 0.867 | Fisher’s exact test | ||
| Activity | 46 | 8.711 | 0.014 | Fisher’s exact test | ||
| Household types | 41 | 1.589 | 0.616 | Fisher’s exact test |
| Variables | n | Value | df | Asymptotic Significance (2-Sided) | Exact Sig. (2-Sided) | Test |
|---|---|---|---|---|---|---|
| Sex | 155 | 1.034 | 1 | 0.309 | 0.323 | Chi-square |
| Age group | 152 | 1.936 | 2 | 0.380 | 0.393 | Chi-square |
| Duration of staying in the neighborhood | 153 | 0.052 | 2 | 0.974 | 0.979 | Chi-square |
| Education | 153 | 4.439 | 3 | 0.218 | 0.222 | Chi-square |
| Monthly income | 140 | 2.911 | 3 | 0.406 | 0.411 | Chi-square |
| Activity | 154 | 7.780 | 2 | 0.020 | 0.018 | Chi-square |
| Household types | 129 | 2.935 | 0.258 | Fisher’s exact test |
| Variables | n | Value | df | Asymptotic Significance (2-Sided) | Exact Sig. (2-Sided) | Test |
|---|---|---|---|---|---|---|
| Sex | 200 | 0.110 | 1 | 0.741 | 0.747 | Chi-square |
| Age group | 195 | 1.939 | 2 | 0.379 | 0.414 | Chi-square |
| Duration of staying in the neighborhood | 198 | 2.580 | 2 | 0.275 | 0.276 | Chi-square |
| Education | 196 | 8.051 | 3 | 0.045 | 0.044 | Chi-square |
| Monthly income | 175 | 6.727 | 3 | 0.081 | 0.081 | Chi-square |
| Activity | 198 | 0.639 | 2 | 0.727 | 0.739 | Chi-square |
| Household types | 162 | 4.050 | 0.120 | Fisher’s exact test |
| Variables | n | Value | df | Asymptotic Significance (2-Sided) | Exact Sig. (2-Sided) | Test |
|---|---|---|---|---|---|---|
| Sex | 187 | 0.996 | 1 | 0.318 | 0.361 | Chi-square * |
| Age group | 182 | 4.771 | 2 | 0.092 | 0.091 | Chi-square |
| Duration of staying in the neighborhood | 185 | 3.882 | 2 | 0.144 | 0.140 | Chi-square |
| Education | 182 | 6.261 | 3 | 0.100 | 0.101 | Chi-square |
| Monthly income | 162 | 2.733 | 3 | 0.435 | 0.442 | Chi-square |
| Activity | 186 | 2.179 | 2 | 0.336 | 0.352 | Chi-square |
| Household types | 152 | 3.252 | 0.208 | Fisher’s exact test |
| Variables | n | Value | df | Asymptotic Significance (2-Sided) | Exact Sig. (2-Sided) | Test |
|---|---|---|---|---|---|---|
| Sex | 210 | 1.826 | 1 | 0.177 | 0.186 | Chi-square |
| Age group | 205 | 0.210 | 2 | 0.900 | 0.924 | Chi-square |
| Duration of staying in the neighborhood | 208 | 0.692 | 2 | 0.708 | 0.691 | Chi-square |
| Education | 205 | 1.209 | 2 | 0.546 | 0.545 | Chi-square |
| Monthly income | 184 | 1.580 | 3 | 0.664 | 0.678 | Chi-square |
| Activity | 208 | 0.769 | 2 | 0.681 | 0.687 | Chi-square |
| Household types | 169 | 0.099 | 1.000 | Fisher’s exact test |
Appendix E
| Variables | Unstandardized B | Coefficients SE | Standardized Coefficients Beta (β) | t | p |
|---|---|---|---|---|---|
| (Constant) | 1.800 | 0.420 | 4.290 | 0.000 | |
| Primary | −0.133 | 0.457 | −0.047 | −0.292 | 0.771 |
| Secondary | −0.276 | 0.432 | −0.143 | −0.638 | 0.524 |
| Tertiary | −0.053 | 0.430 | −0.028 | −0.122 | 0.903 |
| Variables | Unstandardized B | Coefficients SE | Standardized Coefficients Beta (β) | t | p |
|---|---|---|---|---|---|
| (Constant) | 1.745 | 0.088 | 19.878 | 0.000 | |
| Sex Male | 0.005 | 0.121 | 0.004 | 0.044 | 0.965 |
| Sex Female | −0.230 | 0.134 | −0.168 | −1.715 | 0.089 |
| Variables | Unstandardized B | Coefficients SE | Standardized Coefficients Beta (β) | t | p |
|---|---|---|---|---|---|
| (Constant) | 1.695 | 0.056 | 30.108 | 0.000 | |
| Duration of stay 1 (≤10 years) | −0.028 | 0.358 | −0.007 | −0.079 | 0.937 |
| Duration of stay 2 (10–≤30 years) | −0.195 | 0.256 | −0.067 | −0.762 | 0.448 |
| Duration of stay 3 (>30 years) | 0.019 | 0.238 | 0.007 | 0.081 | 0.935 |
| Variables | Unstandardized B | Coefficients SE | Standardized Coefficients Beta (β) | t | p |
|---|---|---|---|---|---|
| (Constant) | 1.930 | 0.144 | 13.448 | 0.000 | |
| Activity 1 (workers and homemakers) | −0.744 | 0.203 | −0.367 | −3.666 | 0.000 |
| Activity 2 (unemployed and retired) | 1.070 | 0.681 | 0.156 | 1.571 | 0.120 |
| Activity 3 (students) | −0.310 | 0.317 | −0.097 | −0.977 | 0.331 |
| Variables | Unstandardized B | CoefficientsSE | Standardized Coefficients Beta (β) | t | p |
|---|---|---|---|---|---|
| (Constant) | 1.988 | 0.083 | 24.023 | 0.000 | |
| Activity 1 (workers and homemakers) | −0.207 | 0.101 | −0.134 | −2.051 | 0.041 |
| Activity 2 (unemployed and retired) | 0.346 | 0.193 | 0.108 | 1.791 | 0.074 |
| Activity 3 (students) | 0.140 | 0.052 | 0.170 | 2.705 | 0.007 |
| Variables | Unstandardized B | Coefficients SE | Standardized Coefficients Beta (β) | t | p |
|---|---|---|---|---|---|
| (Constant) | 1.780 | 0.096 | 18.490 | 0.000 | |
| Primary | −0.521 | 0.193 | −0.171 | −2.694 | 0.007 |
| Secondary | −0.274 | 0.136 | −0.140 | −2.022 | 0.044 |
| Tertiary | −0.008 | 0.130 | −0.004 | −0.063 | 0.950 |
References
- Mochizuki, J.; Keating, A.; Liu, W.; Hochrainer-Stigler, S.; Mechler, R. An Overdue Alignment of Risk and Resilience? A Conceptual Contribution to Community Resilience. Disasters 2018, 42, 361–391. [Google Scholar] [CrossRef] [PubMed]
- UNISDR. 2009 UNISDR Terminology on Disaster Risk Reduction; UNISDR: Geneva, Switzerland, 2009. [Google Scholar]
- Masterson, J.H.; Peacock, W.G.; Van Zandt, S.S.; Grover, H.; Schwarz, L.F.; Cooper, J.T.J. Planning for Community Resilience: A Handbook for Reducing Vulnerability to Disasters; Island Press: Washington, DC, USA, 2014. [Google Scholar]
- Kiniger-Passigli, D.; Biondi, A. A People-Centred, Preventive Approach to Disaster Risk. Erud. J. World Acad. Art Sci. 2015, 1, 32–39. [Google Scholar]
- Lallement, D.; Loos, S.; McCaughey, J.W.; Budhathoki, N.; Khan, F. Informatics for Equitable Recovery: Supporting Equitable Disaster Recovery through Mapping and Integration of Social Vulnerability into Post-Disaster Impact Assessments; ETH Zurich: Zurich, Switzerland, 2020. [Google Scholar]
- 2020: The Non-COVID Year in Disasters; Centre for Research on the Epidemiology of Disasters (CRED): Brussels, Belgium; The UN Office for Disaster Risk Reduction (UNDRR): Brussels, Belgium, 2021.
- Turner, B.A. The Organizational and Interorganizational Development of Disasters. Adm. Sci. Q. 1976, 21, 378–397. [Google Scholar] [CrossRef]
- Wisner, B.; Blaikie, P.; Cannon, T.; Davis, I. At Risk: Natural Hazards, People’s Vulnerability and Disasters; Psychology Press: Hove, UK, 2004. [Google Scholar]
- Collins, A.E.; Manyena, B.; Jayawickrama, J.; Jones, S. Introduction: Hazards, Risks, and Disasters in Society. In Hazards, Risks and Disasters in Society; Elsevier: Amsterdam, The Netherlands, 2015; pp. 1–15. [Google Scholar]
- Rufat, S.; Fekete, A.; Armaş, I.; Hartmann, T.; Kuhlicke, C.; Prior, T.; Thaler, T.; Wisner, B. Swimming Alone? Why Linking Flood Risk Perception and Behavior Requires More than “It’s the Individual, Stupid”. Wiley Interdiscip. Rev. Water 2020, 7, e1462. [Google Scholar] [CrossRef]
- Collins, A.E.; Jayawickrama, J.; Jones, S.; Manyena, B. Conclusion: Hazards, Risks, and Disasters in Society. In Hazards, Risks and Disasters in Society; Elsevier: Amsterdam, The Netherlands, 2015; pp. 391–396. [Google Scholar]
- Joseph, J.K.; Anand, D.; Prajeesh, P.; Zacharias, A.; Varghese, A.G.; Pradeepkumar, A.P.; Baiju, K.R. Community Resilience Mechanism in an Unexpected Extreme Weather Event: An Analysis of the Kerala Floods of 2018, India. Int. J. Disaster Risk Reduct. 2020, 49, 101741. [Google Scholar] [CrossRef]
- Odiase, O.; Wilkinson, S.; Neef, A. Risk of a Disaster: Risk Knowledge, Interpretation and Resilience. Jàmbá J. Disaster Risk Stud. 2020, 12, 1–9. [Google Scholar] [CrossRef] [PubMed]
- Scolobig, A.; Prior, T.; Schroter, D.; Jorin, J.; Patt, A. Towards People-Centred Approaches for Effective Disaster Risk Management: Balancing Rhetoric with Reality. Int. J. Disaster Risk Reduct. 2015, 12, 202–212. [Google Scholar] [CrossRef]
- Paton, D.; Buergelt, P. Risk, Transformation and Adaptation: Ideas for Reframing Approaches to Disaster Risk Reduction. Int. J. Environ. Res. Public Health 2019, 16, 2594. [Google Scholar] [CrossRef] [Green Version]
- Preston, J.; Chadderton, C.; Kitagawa, K.; Edmonds, C. Community Response in Disasters: An Ecological Learning Framework. Int. J. Lifelong Educ. 2015, 34, 727–753. [Google Scholar] [CrossRef] [Green Version]
- Samaddar, S.; Choi, J.; Misra, B.A.; Tatano, H. Insights on Social Learning and Collaborative Action Plan Development for Disaster Risk Reduction: Practicing Yonmenkaigi System Method (YSM) in Flood-Prone Mumbai. Nat. Hazards 2015, 75, 1531–1554. [Google Scholar] [CrossRef]
- Murti, R.; Mathez-Stiefel, S. Social Learning Approaches for Ecosystem-Based Disaster Risk Reduction. Int. J. Disaster Risk Reduct. 2019, 33, 433–440. [Google Scholar] [CrossRef]
- Thapa, A. A Collaborative Approach for Disaster Risk Reduction: Mapping Social Learning with Mistawasis Nehiyawak; University of Saskatchewan: Saskatoon, SK, Canada, 2020. [Google Scholar]
- Kitagawa, K. Situating Preparedness Education within Public Pedagogy. Pedagog. Cult. Soc. 2017, 25, 1–13. [Google Scholar] [CrossRef] [Green Version]
- Kitagawa, K. Disaster Risk Reduction Activities as Learning. Nat. Hazards 2021, 105, 3099–3118. [Google Scholar] [CrossRef]
- Kitagawa, K. Questioning “integrated” Disaster Risk Reduction and “All of Society” Engagement: Can “Preparedness Pedagogy” Help? Comp. J. Comp. Int. Educ. 2019, 49, 851–867. [Google Scholar] [CrossRef] [Green Version]
- Ray-Bennett, N.S.; Masys, A.; Shiroshita, H.; Jackson, P. Reactive to Proactive to Reflective Disaster Responses: Introducing Critical Reflective Practices in Disaster Risk Reduction. In Hazards, Risks and Disasters in Society; Elsevier: Amsterdam, The Netherlands, 2015; pp. 99–117. [Google Scholar]
- Witvorapong, N.; Muttarak, R.; Pothisiri, W. Social Participation and Disaster Risk Reduction Behaviors in Tsunami Prone Areas. PLoS ONE 2015, 10, e0130862. [Google Scholar] [CrossRef] [PubMed] [Green Version]
- Sadeka, S.; Mohamad, M.S.; Sarkar, M.S.K.; Al-Amin, A.Q. Conceptual Framework and Linkage Between Social Capital and Disaster Preparedness: A Case of Orang Asli Families in Malaysia. Soc. Indic. Res. 2020, 150, 479–499. [Google Scholar] [CrossRef]
- Saragih, B.; Ni’am, L.; Sirimorok, N.; Yunifa, P.; Abdullah, S. Asmaradana Merapi: Narasi Ketangguhan Orang-Orang Merapi; Sirimorok, N., Ed.; Badan Nasional Penanggulangan Bencana (BNPB): Jakarta, Indonesia, 2014. [Google Scholar]
- Surono, M.; Jousset, P.; Pallister, J.; Boichu, M.; Fabrizia, M.; Budisantoso, A.; Rodriguez, F.C.; Andreastuti, S.; Prata, F.; Schneider, D.; et al. The 2010 Explosive Eruption of Java’ s Merapi Volcano—A ‘100-Year’ Event To Cite This Version: HAL Id: Insu-00723412. J. Volcanol. Geotherm. Res. 2012, 241, 121–135. [Google Scholar] [CrossRef] [Green Version]
- BPS—Statistics of DI Yogyakarta Prov. Yogyakarta in Figure 2020; BPS—Statistics of DI Yogyakarta Prov.: Yogyakarta, Indonesia, 2020; Available online: https://yogyakarta.bps.go.id/publication/2020/04/27/f05ad6d5e9b43de46673d003/provinsi-di-yogyakarta-dalam-angka-2020.html (accessed on 22 February 2021).
- BPS—Statistics of Yogyakarta Municipality. Yogyakarta Municipality in Figure 2020; BPS—Statistics of Yogyakarta Municipality: Yogyakarta, Indonesia, 2020; Available online: https://jogjakota.bps.go.id/publication/2020/04/27/2a6bb713d16b766c86776231/kota-yogyakarta-dalam-angka-2020.html (accessed on 22 February 2021).
- BPS—Statistics of Magelang Regency. Magelang Regency in Figure 2020; BPS—Statistics of Magelang Regency: Magelang, Jawa Tengah, Indonesia, 2020; Available online: https://magelangkab.bps.go.id/publication/2020/04/27/0e5f89ea3d81aaa61f44896f/kabupaten-magelang-dalam-angka-2020.html (accessed on 22 February 2021).
- BPS—Statistics of Sleman Regency. Sleman Regency in Figure 2020; BPS—Statistics of Sleman Regency: Sleman, Indonesia, 2020; Available online: https://slemankab.bps.go.id/publication/2020/04/27/16714e3d5593acef2ff33d45/kabupaten-sleman-dalam-angka-2020.html (accessed on 22 August 2020).
- Newhall, C.G.; Bronto, S.; Alloway, B.; Banks, N.G.; Bahar, I.; Del Marmol, M.A.; Hadisantono, R.D.; Holcomb, R.T.; McGeehin, J.; Miksic, J.N. 10,000 Years of Explosive Eruptions of Merapi Volcano, Central Java: Archaeological and Modern Implications. J. Volcanol. Geotherm. Res. 2000, 100, 9–50. [Google Scholar] [CrossRef]
- Global Volcanism Program. Merapi (263250) in Volcanoes of the World, v. 4.10.4; Global Volcanism Program: Washington, DC, USA. Available online: https://volcano.si.edu/volcano.cfm?vn=263250 (accessed on 27 January 2022).
- National Disaster Management Agency of Indonesia. Action Plan for Rehabilitation and Reconstruction for Merapi Volcano Eruption Post-Disaster in DI. Yogyakarta and Jawa Tengah 2011–2013; National Disaster Management Agency of Indonesia: Jakarta, Indonesia, 2011. [Google Scholar]
- Sikoki, B.; Nugroho, J.E.; Widanto, F.A.S.; Umam, N.; Sakti, E.; Kawuryan, I.S.S.; Purwanto, E.; Yugyasmono; Fatimah, D.; Suriastini, N.W.; et al. Merapi: Pemulihan Penghidupan Warga Pasca Letusan 2010, Laporan Studi Longitudinal; Ma’arif, S., Sulistianto, B., Prasodjo, S.B., Muhammad, L., Andriono, R., Bayudono, Paripurno, E.T., Topatimasan, R., Eds.; Badan Nasional Penanggulangan Bencana (BNPB): Jakarta, Indonesia, 2013; Available online: https://insistpress.com/katalog/merapi-pemulihan-penghidupan-warga-pasca-letusan-2010-laporan-survei-longitudinal/ (accessed on 24 July 2021).
- Lavigne, F.; Morin, J.; Surono, M. Atlas of Merapi Volcano; Laboratoire de Geographie Physique: Meudon, France, 2015. [Google Scholar]
- Lavigne, F.; De Coster, B.; Juvin, N.; Flohic, F.; Gaillard, J.C.; Texier, P.; Morin, J.; Sartohadi, J. People’s Behaviour in the Face of Volcanic Hazards: Perspectives from Javanese Communities, Indonesia. J. Volcanol. Geotherm. Res. 2008, 172, 273–287. [Google Scholar] [CrossRef]
- Rindrasih, E. Under the Volcano: Responses of a Community-Based Tourism Village to the 2010 Eruption of Mount Merapi, Indonesia. Sustainability 2018, 10, 1620. [Google Scholar] [CrossRef] [Green Version]
- Yogyakarta, G. Governor of Yogyakarta Regulation No 62/2020 on Merapi Volcano Eruption Contingency Plan on Province Level; Government of DI Yogyakarta Province: Yogyakarta, Indonesia, 2020; Available online: http://www.birohukum.jogjaprov.go.id/produk_hukum_preview.php?id=15727 (accessed on 26 November 2021).
- Subkhi, W.B.; Mardiansjah, F.H. Pertumbuhan Dan Perkembangan Kawasan Perkotaan Di Kabupaten: Studi Kasus Kabupaten Sleman, Daerah Istimewa Yogyakarta. J. Wil. Lingkung. 2019, 7, 105–120. [Google Scholar] [CrossRef]
- SIARAN PERS Peningkatan Status Aktivitas Gunung Merapi dari “Waspada (Level II) ke Siaga (Level III)”. In Government Publication Number 523/45/BGV.KG/2020; Geology Berau of Ministry of Energy and Mineral Resources: Yogyakarta, Indonesia, 2020; Available online: https://www.jogjaprov.go.id/pengumuman/detail/132-siaran-pers-peningkatan-status-aktivitas-gunung-merapi-dari-waspada-level-ii-ke-siaga-level-iii (accessed on 27 December 2021).
- Roychani, M. Infografis Kejadian Bencana Kabupaten Magelang 2020 (1 Januari 2020–31 Desember 2020). BPBD Magelang: Magelang, Jawa Tengah, Indonesia. 2021. Available online: https://bpbd.magelangkab.go.id/home/detail/infografis-kejadian-bencana-kabupaten-magelang-2020---1-januari-2020-–-31-desember-2020-/562# (accessed on 27 December 2021).
- BPBD Magelang. Available online: http://sikk.bpbdmagelang.id/ (accessed on 27 December 2021).
- Eslamian, S.; Eslamian, F.A. Handbook of Disaster Risk Reduction for Resilience: New Frameworks for Building Resilience to Disasters; Springer: Berlin/Heidelberg, Germany, 2021. [Google Scholar]
- Sayudi, D.S. WLPB (Wajib Latih Penanggulangan Bencana) Dulu dan Di Masa New Normal: Dengan Studi Kasus, G. Merap. Presented at the Sosial Humaniora Seminar “Narasi Ketangguhan Warga Merapi”, part of Commererating of 10 years after 2010 Merapi Eruption: “Dasawarsa Merapi 2010: Refleksi Merapi 2010 untuk Mitigasi di Masa Pandemi”, Yogykarta, Indonesia, 20 October–4 November 2020. [Google Scholar]
- Subandriyo; Sayudi, D.S. Community Perception Survey as Evaluation of Disaster Management Training Programs in Disaster-Prone Areas of Mt. Merapi; The Center for Investigation and Development of Geological Disaster Technology (BPPTKG): Yogyakarta, Indonesia, Unpublished work, last saved 31 May 2019. Microsoft Word File.
- Mei, E.T.W.; Lavigne, F.; Picquout, A.; de Bélizal, E.; Brunstein, D.; Grancher, D.; Sartohadi, J.; Cholik, N.; Vidal, C. Lessons Learned from the 2010 Evacuations at Merapi Volcano. J. Volcanol. Geotherm. Res. 2013, 261, 348–365. [Google Scholar] [CrossRef]
- Elysia, V.; Wihadanto, A. The Sister Village Program: Promoting Community Resilience after Merapi Eruption. Indones. J. Plan. Dev. 2018, 3, 32–43. [Google Scholar] [CrossRef]
- Badan Nasional Penanggulangan Bencana (BNPB) Indonesia. The Sister Village Program: Submission of The Government of Indonesia to High-Level Panel on Internal Displacement; The Permanent Mission of the Republic Indonesia to United Nations, WTO and Other International Organizations: Geneva, Switzerland, 2020; Available online: https://www.un.org/internal-displacement-panel/sites/www.un.org.internal-displacement-panel/files/indonesias_submission.pdf (accessed on 28 January 2022).
- Jager, J.; Putnick, D.L.; Bornstein, M.H., II. More than Just Convenient: The Scientific Merits of Homogeneous Convenience Samples. Monogr. Soc. Res. Child Dev. 2017, 82, 13–30. [Google Scholar] [CrossRef] [PubMed] [Green Version]
- Pelupessy, D.C. Relocation: Sense of Community, Connection to Place, and the Role of Culture Following a Volcanic Eruption; Victoria University: Melbourne, Australia, 2016. [Google Scholar]
- Rahayu, L.; Febriani, D. The Efficiency of Red Chili Farming In Merapi Eruption Area, Yogyakarta, Indonesia. In E3S Web of Conferences; EDP Sciences: Les Ulis, France, 2021; Volume 232, p. 1023. [Google Scholar]
- Rahman, B.; Van den Broeck, P.; Parra, C. Post-Disaster Recovery as Socio-Ecological and Socio-Political Construction: Responses to the 2010 Merapi Eruption as a Case Study. In Proceeding of the 8th International Conference on Building Resilience (ICBR), Lisbon, Portugal, 14 November 2018–16 November 2018; pp. 86–91. Available online: https://3a5cb13e-4d06-41e6-9768-4b9fc2524ae2.filesusr.com/ugd/954133_6963cb668f4949a0bf7429d66a63c105.pdf (accessed on 20 May 2021).
- Prabowo, H.L. Region Based Development of Land Consolidation Through Land Consolidation Village. Proceeding of International Conference: Land Consolidation as an Instrument to Support Sustainable Spatial Planning National Land College, 2017, Yogyakarta, Indonesia, 16 November 2017; STPN Press Team, Ed.; National Land College: Yogyakarta, Indonesia; STPN Press: Yogyakarta, Indonesia, 2017; pp. 83–95. Available online: http://pppm.stpn.ac.id/sdm_downloads/proceeding-international-conference-land-consolidation-as-an-instrument-to-support-sustainable-spatial-planning (accessed on 24 December 2021).
- Pitoyo, A.J.; Triwahyudi, H. Dinamika Perkembangan Etnis Di Indonesia Dalam Konteks Persatuan Negara. Populasi 2017, 25, 64–81. [Google Scholar] [CrossRef] [Green Version]
- Rozaki, Z.; Rahmawati, N.; Wijaya, O.; Khoir, I.A.; Senge, M.; Kamarudin, M.F. Perception of Agroforestry Adopter and Non-Adopter on Volcano Risk and Hazard: A Case in Mt. Merapi, Java, Indonesia. Biodiversitas J. Biol. Divers. 2021, 22, 3829–3837. [Google Scholar] [CrossRef]
- Ikhsan, J. Study on Integrated Sediment Management in an Active Volcanic Basin. Ph.D. Thesis, Kyoto University, Kyoto, Japan, September 2010. [Google Scholar]
- Subandriyo. Penyebaran Informasi Kebencanaan G. Merapi 2010 Dan Masa Pandemi [Dissemination Disaster Information of Merapi Volcano 2010 and the Pandemic]. Presented at Seminar Manajemen Penanggulangan Bencana dan Sistem Peringatan Dini “Praktik Baik dari Merapi” [Disaster Management and Early Warning System “Best Practices from Merapi”], part of Commererating of 10 years after 2010 Merapi Eruption: “Dasawarsa Merapi 2010: Refleksi Merapi 2010 untuk Mitigasi di Masa Pandemi” [“A Decade of Merapi 2010: 2010 Merapi Reflection for Mitigation in the Pandemic”], Yogykarta, Indonesia, 20 October–4 November 2020. [Google Scholar]
- IBM Corp. IBM SPSS Statistics for Windows, Version 27.0; IBM Corp: Armonk, NY, USA, 2020. [Google Scholar]
- Kraska-Miller, M. Nonparametric Statistics for Social and Behavioral Sciences; CRC Press: Boca Raton, FL, USA, 2013. [Google Scholar]
- Ho, R. Handbook of Univariate and Multivariate Data Analysis with IBM SPSS; CRC Press: Boca Raton, FL, USA, 2013. [Google Scholar]
- Tarling, R. Statistical Modelling for Social Researchers: Principles and Practice; Routledge: Abingdon-on-Thames, Oxfordshire, UK, 2008. [Google Scholar]
- Howell, D.C. Chi-Square Test: Analysis of Contingency Tables BT. International Encyclopedia of Statistical Science; Lovric, M., Ed.; Springer: Berlin/Heidelberg, Germany, 2011; pp. 250–252. [Google Scholar] [CrossRef]
- Stockemer, D.; Stockemer, G. Quantitative Methods for the Social Sciences; Springer: Berlin/Heidelberg, Germany, 2019. [Google Scholar]
- Shan, G.; Gerstenberger, S. Fisher’s Exact Approach for Post Hoc Analysis of a Chi-Squared Test. PLoS ONE 2017, 12, e0188709. [Google Scholar] [CrossRef] [PubMed] [Green Version]
- Budiastuti, D.; Bandur, A. Validitas Dan Reabilitas Penelitian [Validity and Realiabilty in Research]; Mitra Wacana Media: Jakarta, Indonesia, 2018. [Google Scholar]
- Wagner, W.E., III. Using IBM® SPSS® Statistics for Research Methods and Social Science Statistics; Sage Publications: Thousand Oaks, CA, USA, 2019. [Google Scholar]
- Wardyaningrum, D. Perubahan Komunikasi Masyarakat Dalam Inovasi Mitigasi Bencana Di Wilayah Rawan Bencana Gunung Merapi. J. Aspikom 2014, 2, 179–197. [Google Scholar] [CrossRef] [Green Version]
- Biro Tata Pemerintahan Setda DIY. Population of DIY. Biro Tata Pemerintahan Setda DIY: Yogyakarta, Indonesia. 2022. Available online: https://kependudukan.jogjaprov.go.id/ (accessed on 27 January 2022).
- BPS—Statistics of Magelang Regency. Candimulyo Subdistrict in Figure 2020; BPS—Statistics of Magelang Regency: Magelang, Jawa Tengah, Indonesia, 2020; Available online: https://magelangkab.bps.go.id/publication/2020/09/28/f1999594678cef972a749362/kecamatan-candimulyo-dalam-angka-2020.html (accessed on 14 January 2022).
- BPS—Statistics of Magelang Regency, Mungkid Subdistrict in Figure 2020; BPS—Statistics of Magelang Regency: Magelang, Jawa Tengah, Indonesia. 2020. Available online: https://magelangkab.bps.go.id/publication/2020/09/28/172d5152e2b8ea719a26b994/kecamatan-mungkid-dalam-angka-2020.html (accessed on 14 January 2022).
- BPS—Statistics of Magelang Regency. Sawangan Subdistrict in Figure 2020; BPS—Statistics of Magelang Regency: Magelang, Jawa Tengah, Indonesia, 2020; Available online: https://magelangkab.bps.go.id/publication/2020/09/28/b2487f26c6ca2a3e348ef50a/kecamatan-sawangan-dalam-angka-2020.html (accessed on 14 January 2022).
- BPS—Statistics of Magelang Regency, Dukun Subdistrict in Figure 2020; BPS—Statistics of Magelang Regency: Magelang, Jawa Tengah, Indonesia. 2020. Available online: https://magelangkab.bps.go.id/publication/2020/09/28/79e551001de0abbb65420a15/kecamatan-dukun-dalam-angka-2020.html (accessed on 14 January 2022).
- BPS—Statistics of Magelang Regency, Srumbung Subdistrict in Figure 2020; BPS—Statistics of Magelang Regency: Magelang, Jawa Tengah, Indonesia. 2020. Available online: https://magelangkab.bps.go.id/publication/2020/09/28/1eff4651a5d597c7fa2bdfff/kecamatan-srumbung-dalam-angka-2020.html (accessed on 14 January 2022).
- BPS—Statistics of Magelang Regency, Salam Subdistrict in Figure 2020; BPS—Statistics of Magelang Regency: Magelang, Jawa Tengah, Indonesia. 2020. Available online: https://magelangkab.bps.go.id/publication/2020/09/28/e88339e572ce967998cdcd88/kecamatan-salam-dalam-angka-2020.html (accessed on 14 January 2022).
- BPS—Statistics of Magelang Regency, Muntilan Subdistrict in Figure 2020; BPS—Statistics of Magelang Regency: Magelang, Jawa Tengah, Indonesia. 2020. Available online: https://magelangkab.bps.go.id/publication/2020/09/28/736c3f94d064a57762a73e2f/kecamatan-muntilan-dalam-angka-2020.html (accessed on 14 January 2022).
- Krüger, F.; Bankoff, G.; Cannon, T.; Orlowski, B.; Schipper, E.L.F. Cultures and Disasters: Understanding Cultural Framings in Disaster Risk Reduction; Routledge: Abingdon-on-Thames, Oxfordshire, UK, 2015. [Google Scholar]
- BPBD Sleman. Rencana Kontingensi Erupsi Gunungapi Merapi Kabupaten Sleman Tahun 2020 [Merapi Volcano Eruption Contingency Plan of Sleman Regency 2020]; BPBD Sleman: Sleman, DI Yogyakarta, Indonesia, 2020. [Google Scholar]
- BPBD Magelang. Dokumen Rencana Kontingensi Erupsi Gunung Merapi Kabupaten Magelang Tahun 2020/2022 [Document of Merapi Volcano Eruption Contingency Plan Magelang Regency 2020/2022]; BPBD Magelang: Magelang, Jawa Tengah, Indonesia, 2020. [Google Scholar]
- Wahyu Hidayat. Tradisi “Pecah Celengan” Perempuan Merapi Hadapi COVID-19. Available online: https://magelangkab.go.id/home/detail/tradisi-pecah-celengan-perempuan-merapi-hadapi-covid-19/3466 (accessed on 5 March 2021).
- Muttarak, R.; Lutz, W. Is Education a Key to Reducing Vulnerability to Natural Disasters and Hence Unavoidable Climate Change? Ecol. Soc. 2014, 19, 42. [Google Scholar] [CrossRef] [Green Version]
- Wachinger, G.; Renn, O.; Begg, C.; Kuhlicke, C. The Risk Perception Paradox-Implications for Governance and Communication of Natural Hazards. Risk Anal. 2013, 33, 1049–1065. [Google Scholar] [CrossRef] [PubMed]
- Marchezini, V. “What Is a Sociologist Doing Here?” An Unconventional People-Centered Approach to Improve Warning Implementation in the Sendai Framework for Disaster Risk Reduction. Int. J. Disaster Risk Sci. 2020, 11, 218–229. [Google Scholar] [CrossRef] [Green Version]
- Aneshensel, C.S. Theory-Based Data Analysis for the Social Sciences; Sage Publications: Thousand Oaks, CA, USA, 2012. [Google Scholar]
- Thomalla, F.; Boyland, M.; Johnson, K.; Ensor, J.; Tuhkanen, H.; Gerger Swartling, A.; Han, G.; Forrester, J.; Wahl, D. Transforming Development and Disaster Risk. Sustainability 2018, 10, 1458. [Google Scholar] [CrossRef] [Green Version]
- Manyena, B.; Machingura, F.; O’Keefe, P. Disaster Resilience Integrated Framework for Transformation (DRIFT): A New Approach to Theorising and Operationalising Resilience. World Dev. 2019, 123, 104587. [Google Scholar] [CrossRef]
- Stanganelli, M. A People-Centred Approach to Disaster Risk Reduction. In SMC Sustainable Mediterranean Construction—Special Issue Landscape at Risk; Liguori Editore: Napoli, Italy, 2020. [Google Scholar]
- Eshach, H. Bridging In-School and out-of-School Learning: Formal, Non-Formal, and Informal Education. J. Sci. Educ. Technol. 2007, 16, 171–190. [Google Scholar] [CrossRef]
| Description | Observed Frequencies | Percentage (%) |
|---|---|---|
| Sex | ||
| Female | 139 | 64.7 |
| Male | 74 | 34.4 |
| Not stated | 2 | 0.9 |
| Age–A (years) | ||
| A ≤ 24 | 47 | 21.9 |
| 25 < A ≤ 54 | 142 | 66.0 |
| 54 < A | 21 | 9.8 |
| No answer (N/A) | 5 | 2.3 |
| D ≤ 10 | 55 | 25.6 |
| 10 < D ≤ 30 | 95 | 44.2 |
| 30 < 30 | 63 | 29.3 |
| No answer (N/A) | 2 | 0.9 |
| Education | ||
| Primary | 27 | 12.6 |
| Secondary | 82 | 38.1 |
| Tertiary | 101 | 47.0 |
| No answer (N/A) | 5 | 2.3 |
| Monthly income–I (USD) 1 | ||
| Do not have fixed monthly income | 65 | 30.2 |
| I ≤ 210.42 | 67 | 31.2 |
| 210.43 < I ≤ 350.70 | 35 | 16.3 |
| 350.71 < I | 22 | 10.2 |
| No answer (N/A) | 26 | 12.1 |
| Daily life activity | ||
| Work and homemakers | 163 | 75.8 |
| Unemployed and retirement | 18 | 8.4 |
| Students | 32 | 14.9 |
| No answer (N/A) | 2 | 0.9 |
| Household profile | ||
| Single person HH | 18 | 8.4 |
| Couple without child | 8 | 3.7 |
| Parent with one child or more | 146 | 67.9 |
| No answer (N/A) | 43 | 20.0 |
| Description | Observed Frequencies | Percentage (%) |
|---|---|---|
| The accessibility of disaster information | ||
| Yes | 137 | 63.7 |
| No | 20 | 9.3 |
| Maybe | 51 | 23.7 |
| Do not know | 7 | 3.3 |
| Awareness of Community based Disaster Risk Management (CBDRM) Organization existence in the community | ||
| Yes | 76 | 35.3 |
| No | 80 | 37.2 |
| Maybe | 59 | 27.4 |
| Experience with DRR program(s) | ||
| Yes | 38 | 17.7 |
| No | 41 | 19.1 |
| Maybe | 8 | 3.7 |
| No answer (N/A) | 128 | 59.5 |
| Advantages of DRR program for preparing the community for a possible threat | ||
| Yes | 40 | 18.6 |
| No | 0 | 0 |
| Maybe | 6 | 2.8 |
| No answer (N/A) | 169 | 78.6 |
| Prioritizing the vulnerable group during and after the emergency | ||
| Yes | 143 | 66.5 |
| No | 13 | 6.0 |
| Maybe | 59 | 27.4 |
| The importance of women group on the decision making and DRR | ||
| Yes | 102 | 47.4 |
| No | 26 | 12.1 |
| Maybe | 87 | 40.5 |
| Perception for collaborating with external stakeholders would give advantages for community preparedness | ||
| Yes | 176 | 81.9 |
| No | 3 | 1.4 |
| Maybe | 36 | 16.7 |
| Group of Topics | Topics | Responses | ||
|---|---|---|---|---|
| HI | Hazard information | Recent and updated information on Merapi Volcano | 93.5% | 275 |
| HI | Hazard information | Knowledge about volcanic hazard | 85.0% | 250 |
| E | Emergencies | Evacuation and emergencies procedure | 73.8% | 217 |
| E | Emergencies | Evacuation shelter | 72.1% | 212 |
| E | Emergencies | Evacuation route | 71.4% | 210 |
| E | Emergencies | EWS—early warning system | 69.7% | 205 |
| E | Emergencies | Time for evacuation | 58.2% | 171 |
| M | Mitigation | CBDRM—community-based disaster risk management | 51.7% | 152 |
| E | Emergencies | Contact and network communication during emergencies | 48.0% | 141 |
| p | Preparedness | Disaster drill and simulation | 44.6% | 131 |
| E | Emergencies | Live guidelines in the temporary shelters | 42.9% | 126 |
| E | Emergencies | Organization of disaster emergency response | 42.5% | 125 |
| HI | Hazard information | Folklore and traditional knowledge disaster-related | 36.1% | 106 |
| Total Respondent | 294 | |||
| Variables | n | Value | df | Asymptotic Significance (2-Sided) | Exact Sig. (2-Sided) | Test |
|---|---|---|---|---|---|---|
| Sex | 207 | 0.742 | 2 | 0.690 | 0.685 | Chi-square |
| Age group | 205 | 2.500 | 4 | 0.645 | 0.657 | Chi-square |
| Duration of staying in the neighborhood | 207 | 2.035 | 4 | 0.729 | 0.737 | Chi-square |
| Education | 204 | 12.673 | 6 | 0.049 | 0.047 | Chi-square |
| Monthly income | 183 | 6.578 | 6 | 0.362 | 0.366 | Chi-square |
| Activity | 207 | 7.762 | 0.084 | Fisher’s exact test | ||
| Household types | 168 | 5.450 | 0.187 | Fisher’s exact test |
| Categories of Topics | Programs | Responses | ||
|---|---|---|---|---|
| AR | Awareness-raising | Disaster drill and simulation | 67.90% | 55 |
| MP | Mitigation and preparedness | Disaster training and workshop | 50.62% | 41 |
| MP | Mitigation and preparedness | Community meeting | 40.74% | 33 |
| MP | Mitigation and preparedness | Disaster contingency plan-making | 34.57% | 28 |
| MP | Mitigation and preparedness | Contributing to disaster evacuation route making and implementation | 34.57% | 28 |
| MP | Mitigation and preparedness | Making community emergency SOP | 33.33% | 27 |
| AR | Awareness-raising | Community disaster camp (school or volunteer) | 32.10% | 26 |
| MP | Mitigation and preparedness | Building another structural mitigation | 27.16% | 22 |
| AR | Awareness-raising | DRR campaign, fair, and feast | 23.46% | 19 |
| LS | Livelihood securing | Livelihood based tourism on disaster-prone area training and capacity building | 16.05% | 13 |
| LS | Livelihood securing | Livestock management during emergency | 13.58% | 11 |
| LS | Livelihood securing | Participating in social insurance for disaster emergencies | 11.11% | 9 |
| Total Respondent | 81 | |||
| Variables | Case | n | Value | df | Asymptotic Significance (2-Sided) | Exact Sig. (2-Sided) | Test |
|---|---|---|---|---|---|---|---|
| Sex | 2 | 79 | 7.884 | 1 | 0.005 | 0.006 | Chi-square |
| 3 | 46 | 3.067 | 1 | 0.080 | 0.187 | Chi-square * | |
| Age group | 2 | 77 | 5.009 | 0.079 | Fisher’s exact test | ||
| 3 | 44 | 1.747 | 0.538 | Fisher’s exact test | |||
| Duration of staying in the neighborhood | 2 | 78 | 9.983 | 2 | 0.007 | 0.007 | Chi-square |
| 3 | 45 | 0.851 | 0.853 | Fisher’s exact test | |||
| Education | 2 | 78 | 2.850 | 0.419 | Fisher’s exact test | ||
| 3 | 45 | 1.853 | 0.621 | Fisher’s exact test | |||
| Monthly income | 2 | 71 | 6.039 | 3 | 0.110 | 0.112 | Chi-square |
| 3 | 44 | 1.231 | 0.867 | Fisher’s exact test | |||
| Activity | 2 | 78 | 1.923 | 0.448 | Fisher’s exact test | ||
| 3 | 46 | 8.711 | 0.014 | Fisher’s exact test | |||
| Household types | 2 | 69 | 1.993 | 0.474 | Fisher’s exact test | ||
| 3 | 41 | 1.589 | 0.616 | Fisher’s exact test |
| Variables | Case | n | Value | df | Asymptotic Significance (2-Sided) | Exact Sig. (2-Sided) | Test |
|---|---|---|---|---|---|---|---|
| Sex | 4 | 155 | 1.034 | 1 | 0.309 | 0.323 | Chi-square |
| 5 | 200 | 0.110 | 1 | 0.741 | 0.747 | Chi-square | |
| 6 | 187 | 0.996 | 1 | 0.318 | 0.361 | Chi-square * | |
| 7 | 210 | 1.826 | 1 | 0.177 | 0.186 | Chi-square | |
| Age group | 4 | 152 | 1.936 | 2 | 0.380 | 0.393 | Chi-square |
| 5 | 195 | 1.939 | 2 | 0.379 | 0.414 | Chi-square | |
| 6 | 182 | 4.771 | 2 | 0.092 | 0.091 | Chi-square | |
| 7 | 205 | 0.210 | 2 | 0.900 | 0.924 | Chi-square | |
| Duration of staying in the neighborhood | 4 | 153 | 0.052 | 2 | 0.974 | 0.979 | Chi-square |
| 5 | 198 | 2.580 | 2 | 0.275 | 0.276 | Chi-square | |
| 6 | 185 | 3.882 | 2 | 0.144 | 0.140 | Chi-square | |
| 7 | 208 | 0.692 | 2 | 0.708 | 0.691 | Chi-square | |
| Education | 4 | 153 | 4.439 | 3 | 0.218 | 0.222 | Chi-square |
| 5 | 196 | 8.051 | 3 | 0.045 | 0.044 | Chi-square | |
| 6 | 182 | 6.261 | 3 | 0.100 | 0.101 | Chi-square | |
| 7 | 205 | 1.209 | 2 | 0.546 | 0.545 | Chi-square | |
| Monthly income | 4 | 140 | 2.911 | 3 | 0.406 | 0.411 | Chi-square |
| 5 | 175 | 6.727 | 3 | 0.081 | 0.081 | Chi-square | |
| 6 | 162 | 2.733 | 3 | 0.435 | 0.442 | Chi-square | |
| 7 | 184 | 1.580 | 3 | 0.664 | 0.678 | Chi-square | |
| Activity | 4 | 154 | 7.780 | 2 | 0.020 | 0.018 | Chi-square |
| 5 | 198 | 0.639 | 2 | 0.727 | 0.739 | Chi-square | |
| 6 | 186 | 2.179 | 2 | 0.336 | 0.352 | Chi-square | |
| 7 | 208 | 0.769 | 2 | 0.681 | 0.687 | Chi-square | |
| Household types | 4 | 129 | 2.935 | 0.258 | Fisher’s exact test | ||
| 5 | 162 | 4.050 | 0.120 | Fisher’s exact test | |||
| 6 | 152 | 3.252 | 0.208 | Fisher’s exact test | |||
| 7 | 169 | .099 | 1.000 | Fisher’s exact test |
| Description | Model 1 | Model 2 | Model 3 | Model 4 | Model 5 | Model 6 | |
|---|---|---|---|---|---|---|---|
| R | 0.112 | 0.170 | 0.068 | 0.422 | 0.286 | 0.196 | |
| R2 | 0.013 | 0.029 | 0.005 | 0.178 | 0.082 | 0.038 | |
| F | F (3, 209) = 0.891 | F (2, 131) = 1.943 | F (3, 130) = 0.199 | F (3, 85) = 6.139 | F (3, 290) = 8.579 | F (3, 289) = 3.835 | |
| p | 0.447 | 0.147 | 0.897 | 0.001 | 0.001 | 0.010 | |
| Unstandardized B | C | 1.800 | 1.745 | 1.695 | 1.930 | 1.988 | 1.780 |
| X1 | −0.133 | 0.005 | −0.028 | −0.744 | −0.207 | −0.521 | |
| X2 | −0.276 | −0.230 | −0.195 | 1.070 | 0.346 | −0.274 | |
| X3 | −0.053 | - | 0.019 | −0.310 | 0.140 | −0.008 | |
| Coefficients SE | C | 0.420 | 0.088 | 0.056 | 0.144 | 0.083 | 0.096 |
| X1 | 0.457 | 0.121 | 0.358 | 0.203 | 0.101 | 0.193 | |
| X2 | 0.432 | 0.134 | 0.256 | 0.681 | 0.193 | 0.136 | |
| X3 | 0.430 | - | 0.238 | 0.317 | 0.052 | 0.130 | |
| Standardized Coefficients Beta (β) | C | ||||||
| X1 | −0.047 | 0.004 | −0.007 | −0.367 | −0.134 | −0.171 | |
| X2 | −0.143 | −0.168 | −0.067 | 0.156 | 0.108 | −0.140 | |
| X3 | −0.028 | - | 0.007 | −0.097 | 0.170 | −0.004 | |
| t | C | 4.290 | 19.878 | 30.108 | 13.448 | 24.023 | 18.490 |
| X1 | −0.292 | 0.044 | −0.079 | −3.666 | −2.051 | −2.694 | |
| X2 | −0.638 | −1.715 | −0.762 | 1.571 | 1.791 | −2.022 | |
| X3 | −0.122 | - | 0.081 | −0.977 | 2.705 | −0.063 | |
| p | C | 0.000 | 0.000 | 0.000 | 0.000 | 0.000 | 0.000 |
| X1 | 0.771 | 0.965 | 0.937 | 0.000 | 0.041 | 0.007 | |
| X2 | 0.524 | 0.089 | 0.448 | 0.120 | 0.074 | 0.044 | |
| X3 | 0.903 | - | 0.935 | 0.331 | 0.007 | 0.950 | |
| Results | Predictors: (Constant), Tertiary, Primary, Secondary | Predictors: (Constant), Sex Female, Sex Male | Predictors: (Constant), duration of stay 3 (>30 years), duration of stay 1 (≤10 years), duration of stay 2(10–≤30 years) | Predictors: (Constant), Activity 3 (students), Activity 2 (unemployed and retired), Activity 1 (workers and homemakers) | Predictors: (Constant), Activity 3 (students), Activity 2 (unemployed and retired), Activity 1 (workers and homemakers) | Predictors: (Constant), Tertiary, Primary, Secondary | |
| Interpretation | weak, not significantly contributed to predicting model | weak, not significantly contributed to predicting model | weak, not significantly contributed to predicting model | the medium could predict to model with X1 has a significant contribution to the model | weak, could predict to model with X1 and X3 have a significant contribution to the model | weak, could predict to model with X1 and X2 have a significant contribution to the model | |
| Significant predictors | - | - | - | X1: workers and homemakers | X1: workers and homemakers. X3: students | X1: primary X2: secondary | |
Publisher’s Note: MDPI stays neutral with regard to jurisdictional claims in published maps and institutional affiliations. |
© 2022 by the authors. Licensee MDPI, Basel, Switzerland. This article is an open access article distributed under the terms and conditions of the Creative Commons Attribution (CC BY) license (https://creativecommons.org/licenses/by/4.0/).
Share and Cite
Mutiarni, Y.S.; Nakamura, H.; Bhattacharya, Y. The Resilient Community: Strengthening People-Centered Disaster Risk Reduction in the Merapi Volcano Community, Java, Indonesia. Sustainability 2022, 14, 2215. https://doi.org/10.3390/su14042215
Mutiarni YS, Nakamura H, Bhattacharya Y. The Resilient Community: Strengthening People-Centered Disaster Risk Reduction in the Merapi Volcano Community, Java, Indonesia. Sustainability. 2022; 14(4):2215. https://doi.org/10.3390/su14042215
Chicago/Turabian StyleMutiarni, Yosi S., Hitoshi Nakamura, and Yasmin Bhattacharya. 2022. "The Resilient Community: Strengthening People-Centered Disaster Risk Reduction in the Merapi Volcano Community, Java, Indonesia" Sustainability 14, no. 4: 2215. https://doi.org/10.3390/su14042215
APA StyleMutiarni, Y. S., Nakamura, H., & Bhattacharya, Y. (2022). The Resilient Community: Strengthening People-Centered Disaster Risk Reduction in the Merapi Volcano Community, Java, Indonesia. Sustainability, 14(4), 2215. https://doi.org/10.3390/su14042215