Article

Role of Energy Mix in Determining Climate Change Vulnerability in G7 Countries

1
College of Management and Economics, Tianjin University, Tianjin 300072, China
2
Cooperative School of International Education, Tianjin University of Commerce, Tianjin 300134, China
3
Department of Economics, Applied Statistics and International Business, New Mexico State University, 1320 E University Ave, Las Cruces, NM 88003, USA
4
Department of Economics, Division of Management and Administrative Science, University of Education, Lahore 54000, Pakistan
5
Department of Economics and Statistics, University of Management and Technology, Lahore 54000, Pakistan
6
Department of Economics, University of Birmingham Edgbaston, Birmingham B15 2TT, UK
7
Department of Mathematics and Statistics, Hazara University, Mansehra 21300, Pakistan
8
School of Statistics, Jiangxi University of Finance and Economics, Nanchang 330013, China
*
Author to whom correspondence should be addressed.
Sustainability 2022, 14(4), 2161; https://doi.org/10.3390/su14042161
Submission received: 18 January 2022 / Revised: 4 February 2022 / Accepted: 5 February 2022 / Published: 14 February 2022
(This article belongs to the Special Issue Energy Economics and Energy Policy towards Sustainability)

Abstract

:
Anthropogenic activities are responsible for greenhouse gas emissions, causing extreme events like soil erosion, droughts, floods, forest fires and tornadoes. Fossil fuel consumption produces CO2, and trapping heat is the major reason for a rapid increase in global temperature, and electricity generation is responsible for 25% of greenhouse gas emissions. Fossil fuel consumption, CO2 emissions and their adverse impact have become the focus of efforts to mitigate climate change vulnerability. This study explores empirical determinants of vulnerability to climate change such as ecosystem, food, health and infrastructure. The sustainable use of energy is necessary for development, and a source of response to climate change. The present study focuses on renewable energy consumption to determine climate vulnerability in G7 countries between 1995 and 2019. The panel ARDL approach showed that the renewable to non-renewable energy mix showed a quadratic effect on vulnerability, whereby a minimum threshold of renewable energy is required to witness a reduction in food, health and infrastructure vulnerability. Other results indicate that trade openness and development expenditures reduce health vulnerability. Development expenditures also decrease ecosystem vulnerability, while trade openness increases it. However, both of these variables increase infrastructure vulnerability. Avoiding severe food and water crises requires investment to tackle climate change, conserve energy and water resources, reform global trade and food markets, and adapting and adopting climate-resilient responses to change.

1. Introduction

Earth’s average temperature is sharply increasing, which is taking its toll now. Recent studies estimate that heatwaves will become more frequent and severe due to climate change [1]. As the global mean temperature has increased 0.6 ± 0.2 °C since 1860, land erosion has increased approximately 0.5–1% per decade, and rainfall has decreased about 0.3% per decade [2]. From 1901 to 2015, a 19.5 cm global sea-level rise was observed to have a 1.7 mm increase per year [3]. According to an IPCC report in 2019, abrupt climate changes increased the global temperature during the last decade, shrinking the cryosphere, and ice sheets and glaciers have lost mass. Arctic snow cover on land has declined by 13.4 ± 5.4% from 1967–2018, and the total loss is approximately 2.5 million km2 [4]. Climate change constitutes a severe threat to the existence and stability of ecosystems. Countries have shaped various policies to reduce greenhouse gases [5] and amend their production processes [6].
Fossil fuel is the major reason for the rapid increase in global temperature. Burning of coal, oil and gases used to power factories is releasing carbon dioxide, which is trapping the heat from the sun and warming the earth. Electricity generation is the major sector responsible for the emissions of 25% of greenhouse gases, and is impacted by climate change. This energy vulnerability had led to several other forms of vulnerability, such as food provision, infrastructure and health. The vulnerability of power generation can be reduced by increasing the share of renewable energy [7,8]. Developed countries are not different from developing countries in terms of using traditional sources of electricity production. In the EU-27, 40% of the primary energy supply was used to produce electricity in 2005, out of which 55% of electricity was generated by fossil fuel [9].
Energy is an important development factor, but conventional energy sources have a cost in climate change. The high use of non-renewable energy resources is hurting food provision by starving aquatic life of oxygen, threatening marine life and the ecosystem [10]. According to the 2019 IUCN report, approximately 700 sites were affected due to low oxygen, and in the 1960s, there were only 45 affected sites. UNIDO’s third conference highlighted the importance of renewable energy resources. The use of non-renewable energy provides benefits in the short run, but at a high cost in the form of air pollution, noise, and chronic diseases [11,12]. Emissions from fossil fuel combustion include carbon dioxide (CO2) and numerous toxic air pollutants that pose a significant threat to children’s behavioral and cognitive development [13].
Food security and water scarcity are the major challenges of climate change. In 2050, high population growth will require 12,400 km3 water, up from 6800 km3 of water used today. After improving management and efficiency in irrigated agriculture, a deficit of 3300 km3 of water will still be left. Avoiding severe food and water crises requires investment to tackle climate change, conserving energy and water resources, reforming global trade and food markets, and adapting and adopting climate-resilient strategies [14,15]. Green infrastructure can mitigate climatic heat stress and improve health adaptations [16]. A global temperature rise equal or beyond 2 °C will cause glacial melting that will increase events of continental flooding and rising sea levels [17], a major threat to infrastructure that requires resilient infrastructure in those areas [18].
The promotion and development of renewable energy sources can solve these problems. Renewable energy sources include solar, wind, biomass and hydropower. Substituting conventional energy sources with renewable energy sources in the energy mix can reduce local pollution and reduce climate risks [6,19]. Renewable energy plays an important role in fulfilling Kyoto Protocol commitments, in which the EU-15 committed to reducing greenhouse emissions by 8% from 1990 to 2012 [20,21].
The Paris Agreement is an important international effort to tackle climate change. According to this agreement, the global temperature increase should be less than 2 °C. To achieve this target, production of harmful gases should be reduced, and the use of renewable energy resources expanded. A higher proportion of renewable energy resources to non-renewable resources in the energy mix can lead to economic expansion [19,22,23]. However, in the short run we face the cost of developing a renewable energy infrastructure. According to the 2021 IEA report, in order to achieve zero emissions, fossil-fuel fired boilers should not be sold after 2025, and by 2035 the sale of diesel and petrol cars must end. According to this report, the energy sector is responsible for 75% of the greenhouse gas emissions that are warming the global atmosphere [9]. Developed countries have the institutional and financial capacity to tackle climate change issues. They are at the forefront of championing the cause of the decrease in CO2 emissions, and asking other countries to return to their emission levels of 1990 [24]. Developed countries with high FDI and GDP per capita contribute more to environmental change through the emission of CO2 [25]. Some countries that are producers of climate change may be less vulnerable, and countries that are not the producers of climate change suffer the worst consequences of it [26]. This leads to climate injustice. Countries ranked higher in vulnerability have a mortality rate 15 times higher per hazard from drought, floods and storms than those ranked lower [27]. The cost of climate change can be spread across nations through trade. Countries that experience the moderate impact of climate change have sufficient financial resources for adaptation, but through the terms of trade effect, these countries have to bear the cost of climate change [28].
Several European regions have suffered due to flooding caused by climate change in recent times. Extreme fluvial flooding intensely damaged cultural heritage sites in central Europe, protection measures failed, and flood damages cost billions of euros [29]. In 2002, floods hit Austria, the Czech Republic, Germany, Poland, Slovakia, Romania, Hungary and Croatia; in 2006, Bulgaria, Romania, Serbia, Hungary, Germany, the Czech Republic and Macedonia; in 2009 Hungary, Austria, Poland, the Czech Republic, Romania, Turkey and Slovakia; and in 2013 Austria, Germany, Slovakia, the Czech Republic, Switzerland, Belarus, Hungary and Poland. Sea flooding due to storms, exceptional tides and heavy rain occurred in the Adriatic region of Europe in 2008, 2012 and 2018 [30].
During the 1980s, G7 countries accounted for more than 61% of world GDP and 14% of the world population. Now, G7 countries are home to just 10% of the world population and account for only 46% of global GDP. Meanwhile, G20 countries, including China and India, account for approximately 85% of global GDP and two-thirds of the world’s population. In the early 20th century, G7 countries were responsible for 70% of the world’s annual emission of greenhouse gases. In 1995, these countries accounted for approximately 50% of greenhouse gases. The emissions from these countries declined, but non-G7 countries’, especially China’s emissions, increased. In early 2010, China’s emissions were higher than the combined emissions of all G7 countries [31]. G7 countries have become smaller players in terms of their total share in emissions [32].
The target of net zero emissions will be achieved by advanced economies by 2035, while globally, it will be achieved in 2040. The transformation of the whole economy will generate new employment opportunities and boost growth. On the other hand, the countries that rely on fossil fuels will suffer losses, because their per capita income from gas and oil will fall approximately 75% from USD 1800 to USD 450 [9]. The whole process requires massive investment. In many countries, home heating with oil and gas is the major source of CO2 emissions. The UK and USA are responsible for 20% of greenhouse gas emissions [33].
Several barriers to the use of renewable energy technology have been identified. These barriers include technical and market barriers such as regulatory challenges and the volatile structure of prices, as well as social, political and environmental hurdles. There is a need to finance these renewable-energy technologies, and for this purpose, state intervention is necessary [34,35]. The main barrier to transforming the economy to green energy is the expense, and it requires the installation costs of wind farms and solar panels; however, operating costs and maintenance costs are low [22].
An improved energy mix (ratio of renewable energy to non-renewable energy) may cost us in the short run, but it has long-term benefits. Thus, the optimal sustainability-promoting proportion of renewable energy should be determined. Zahid et al. [22] highlighted that abrupt transformation to renewable energy may not provide favorable results. There is a tradeoff between the short-term benefits of non-renewable energy and the long-term benefits of renewable energy. Previous studies overlooked this non-linear transition effect.
The present study was conducted to analyze the role of the energy mix in determining climate change vulnerability in G7 countries. Energy mix is proposed to have a quadratic effect on growth and development [19,22], and thus it influences the capability to address the climate change vulnerability of the country. The climate change vulnerability index is measured using several indicators [36,37]. This paper aims to highlight the role of energy mix in determining the vulnerability to climate change in G7 countries by using four life-supporting sectors: ecosystem, food, health, and infrastructure, and empirically assesses the role of energy mix in determining the vulnerability of G7 countries to climate change. The panel ARDL approach was used in the analysis to provide a robust outcome for policymakers.
This paper is organized as follows: a review of previous studies is discussed in Section 2, methodology of the paper is explained in Section 3, and results are discussed in Section 4. Section 5 is comprised of the conclusion and policy recommendations.

2. Literature Review

Many researchers have focused on climate change information and hazard data such as rising sea levels, floods, etc., but they give less attention to assessing vulnerability to climate change. Birkmann et al. [27] conducted their research in order to divert the attention of researchers towards such an assessment. They used different options to validate vulnerability assessment in terms of external and internal validity. The findings of this study indicate that countries that are ranked higher in vulnerability have a mortality per hazard from drought, floods and storms 15 times higher than those countries that are ranked lower.
Gritti et al. [38] examined the vulnerability of ecosystems of the Mediterranean Basin by using the LPJ-GUESS ecosystem model. Results indicate that climate changes have a major impact on the composition of the ecosystem. Sites are becoming warmer and drier, causing a decline in temperate trees. Increasing CO2 emissions in the atmosphere and its fertilization effect led to a warm-temperate ecosystem. Vázquez-Rowe et al. [39] analyzed the impact of climate-centric policy on the electricity mix changes in two countries, Peru and Spain. Findings indicate that the policies focusing on reducing greenhouse gases have decreased air pollution and other toxic pollutants, but at the expense of water depletion in these countries. These countries have witnessed low carbon emissions compared to other countries at the same level of development. Tobin et al. [7] and Wen et al. [40] analyzed the vulnerability of power generation in European countries. Results of this study indicate that a high proportion of renewable energy resources can decrease the vulnerability of power generation to climate change.
Due to abrupt climate changes, projections about drought provide warnings of food shortages in many world regions. Reducing the vulnerability of agricultural food production is necessary to save the livelihood of millions of people, and reducing the emissions from fossil-fuel consumption is necessary for the world’s population [41].
Renewable energy is carbon neutral. Many countries have adopted renewable energy sources to tackle climate change, but this transformation includes many limitations. Elum and Momodu [42] discussed the initiative of renewable energy in the energy mix of Nigeria. They explored the obstacles responsible for the limited use of renewable energy in Nigeria’s energy mix, and found political and social obstacles are major barriers to the development of renewable energy resources for sustainable development. That said, the public is in favor of renewable energy [43,44].
Foidart et al. [5] conducted a macroeconomic analysis to examine the impact of energy mix on the environment of two European countries, namely Belgium and Spain, using a life cycle assessment. Findings indicate the deployment of renewable energy resources decreases the negative impact on the environment by replacing the traditional polluting sources of coal, gas and oil. Future projection for Spain indicates that a small amount of traditional sources mixed with 54% of renewable-energy sources could lead to environmental benefits, with 0.2 kg per kWh CO2 emission produced compared to 0.54 kg in 2005. However, in the case of Belgium, future scenarios with more gas and coal that include a smaller share of renewable energy sources could bring more harmful impacts on the environment.
Abdelzaher et al. [26] and Fang et al. [45] examined the impact of innovation, regulatory quality and trade on vulnerability to climate change. Longitudinal panel data for 73 countries for the time period 1998–2013 were used for the analysis. Results of this study indicate that trade openness, regulatory quality and R&D expenditures decrease the vulnerability of a country to climate change.
Lastly, Tanveer et al. [46] and Javaid et al. [47] explored the role of renewable energy consumption in the climate change risk of countries with high climate vulnerability. The results showed that an increase in the proportion of renewable energy leads to a decrease in risk from climate change.
The literature provided a link between energy and climate change risks, but assumed it to be linear. Studies such as Anwar et al., 2017; Zahid et al., 2021; Salem et al., 2021, Khan et al., 2021, and Wang et al., 2022 [19,21,22,48,49] noticed that there is a non-linear effect of specific types of energy on climate change; directly via CO2 emissions, or indirectly by creating the capacity to address climate change risk via growth and development. So when a nation transitions to renewable energy, there is a cost in developing the infrastructure, and the sunk cost of discontinuing non-renewable energy. Therefore, transition optimization is required to ensure a nation minimizes vulnerability by adjusting its energy consumption portfolio.

3. Methodology

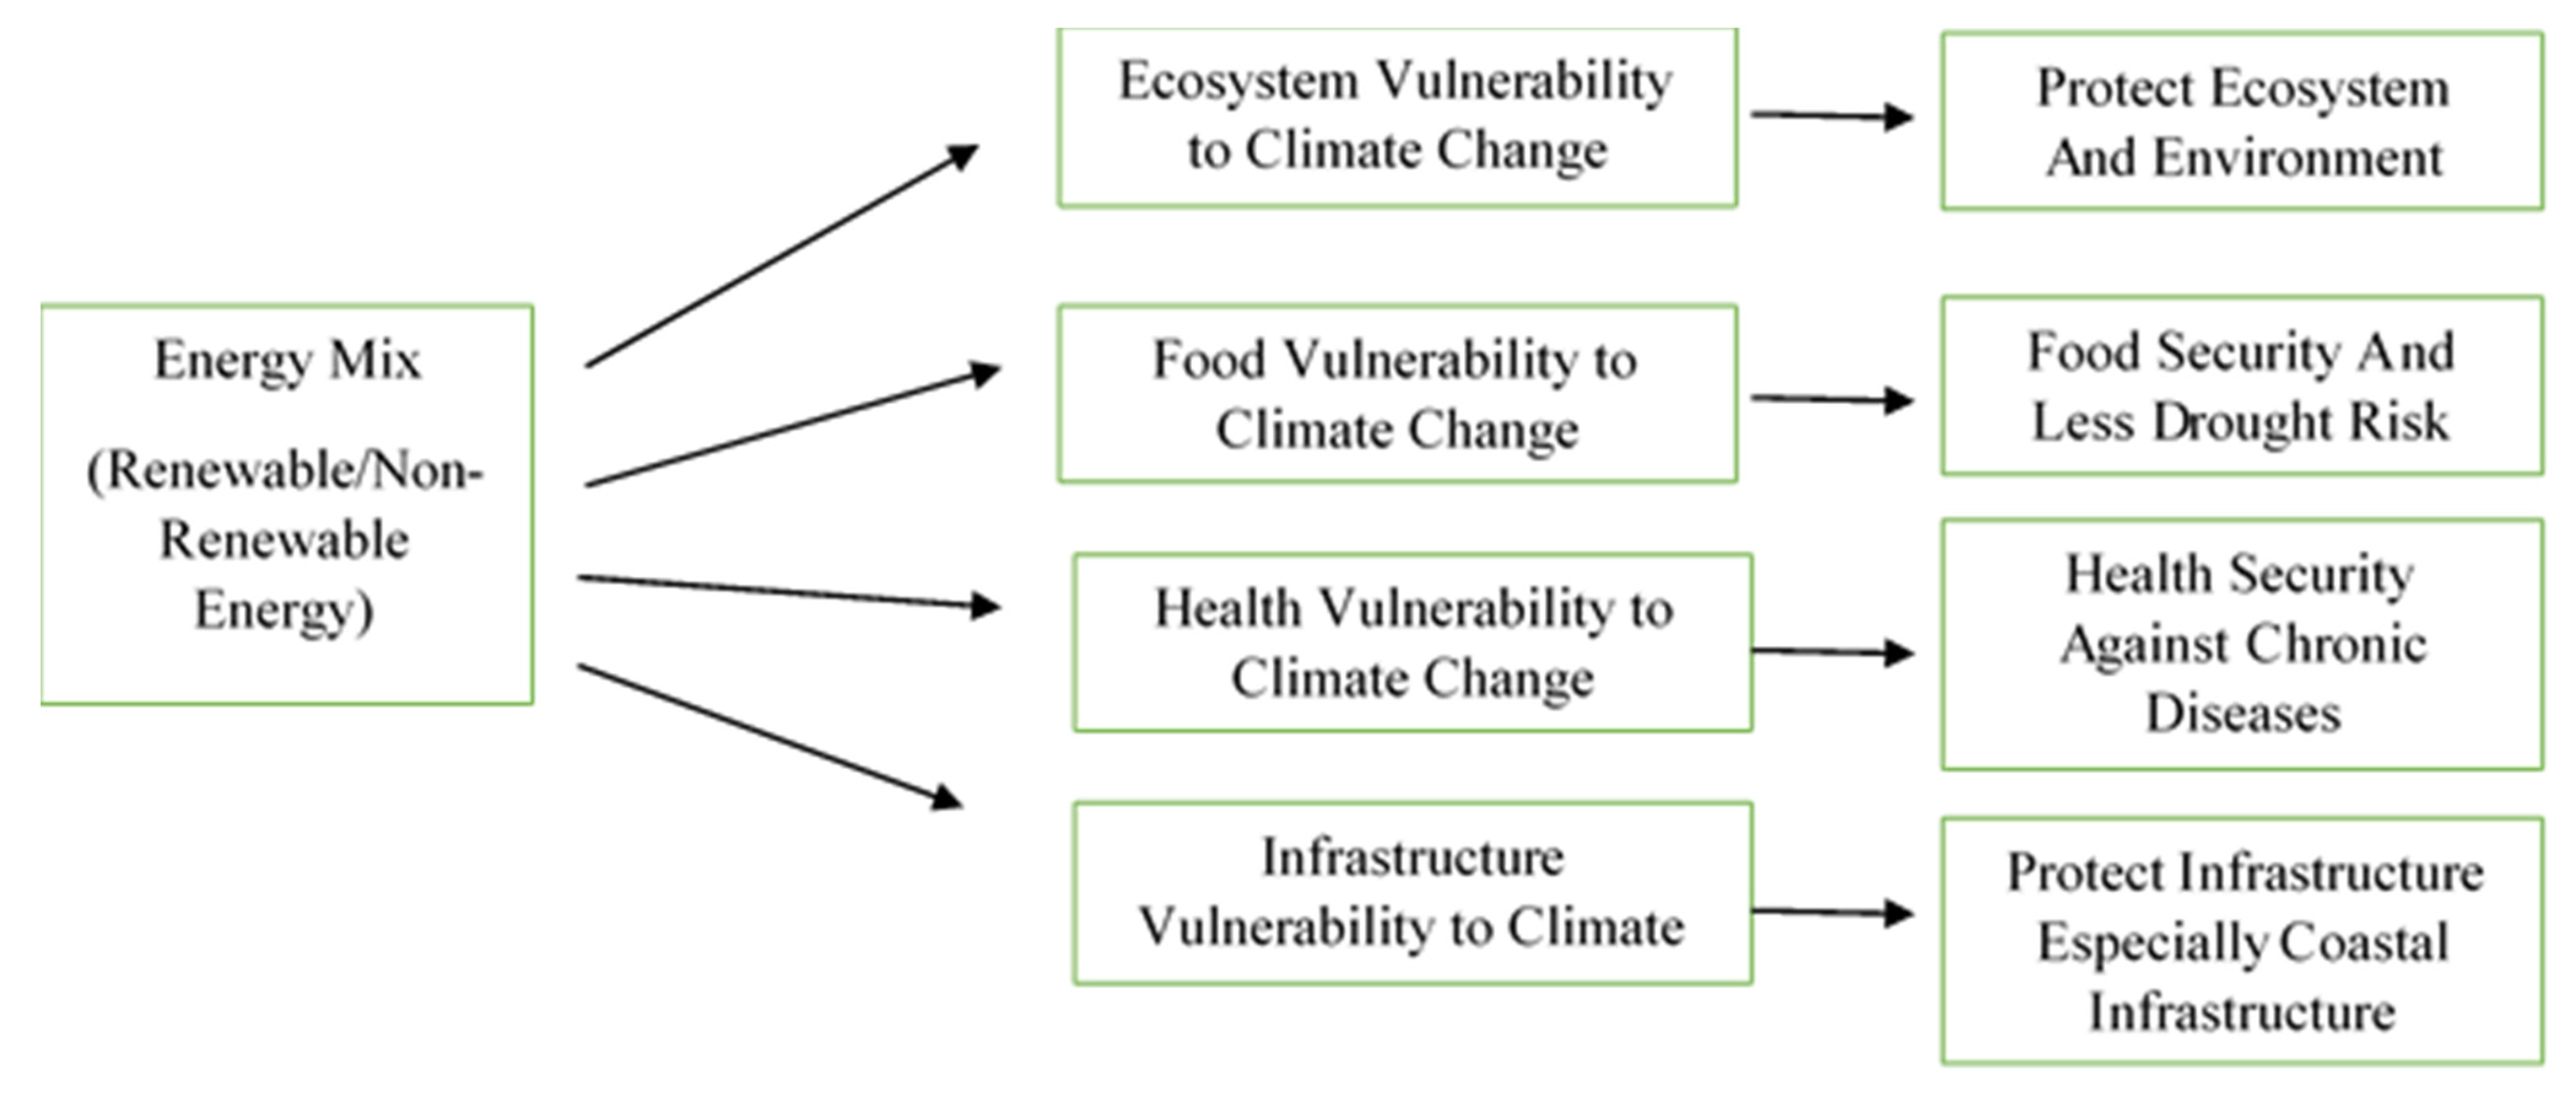
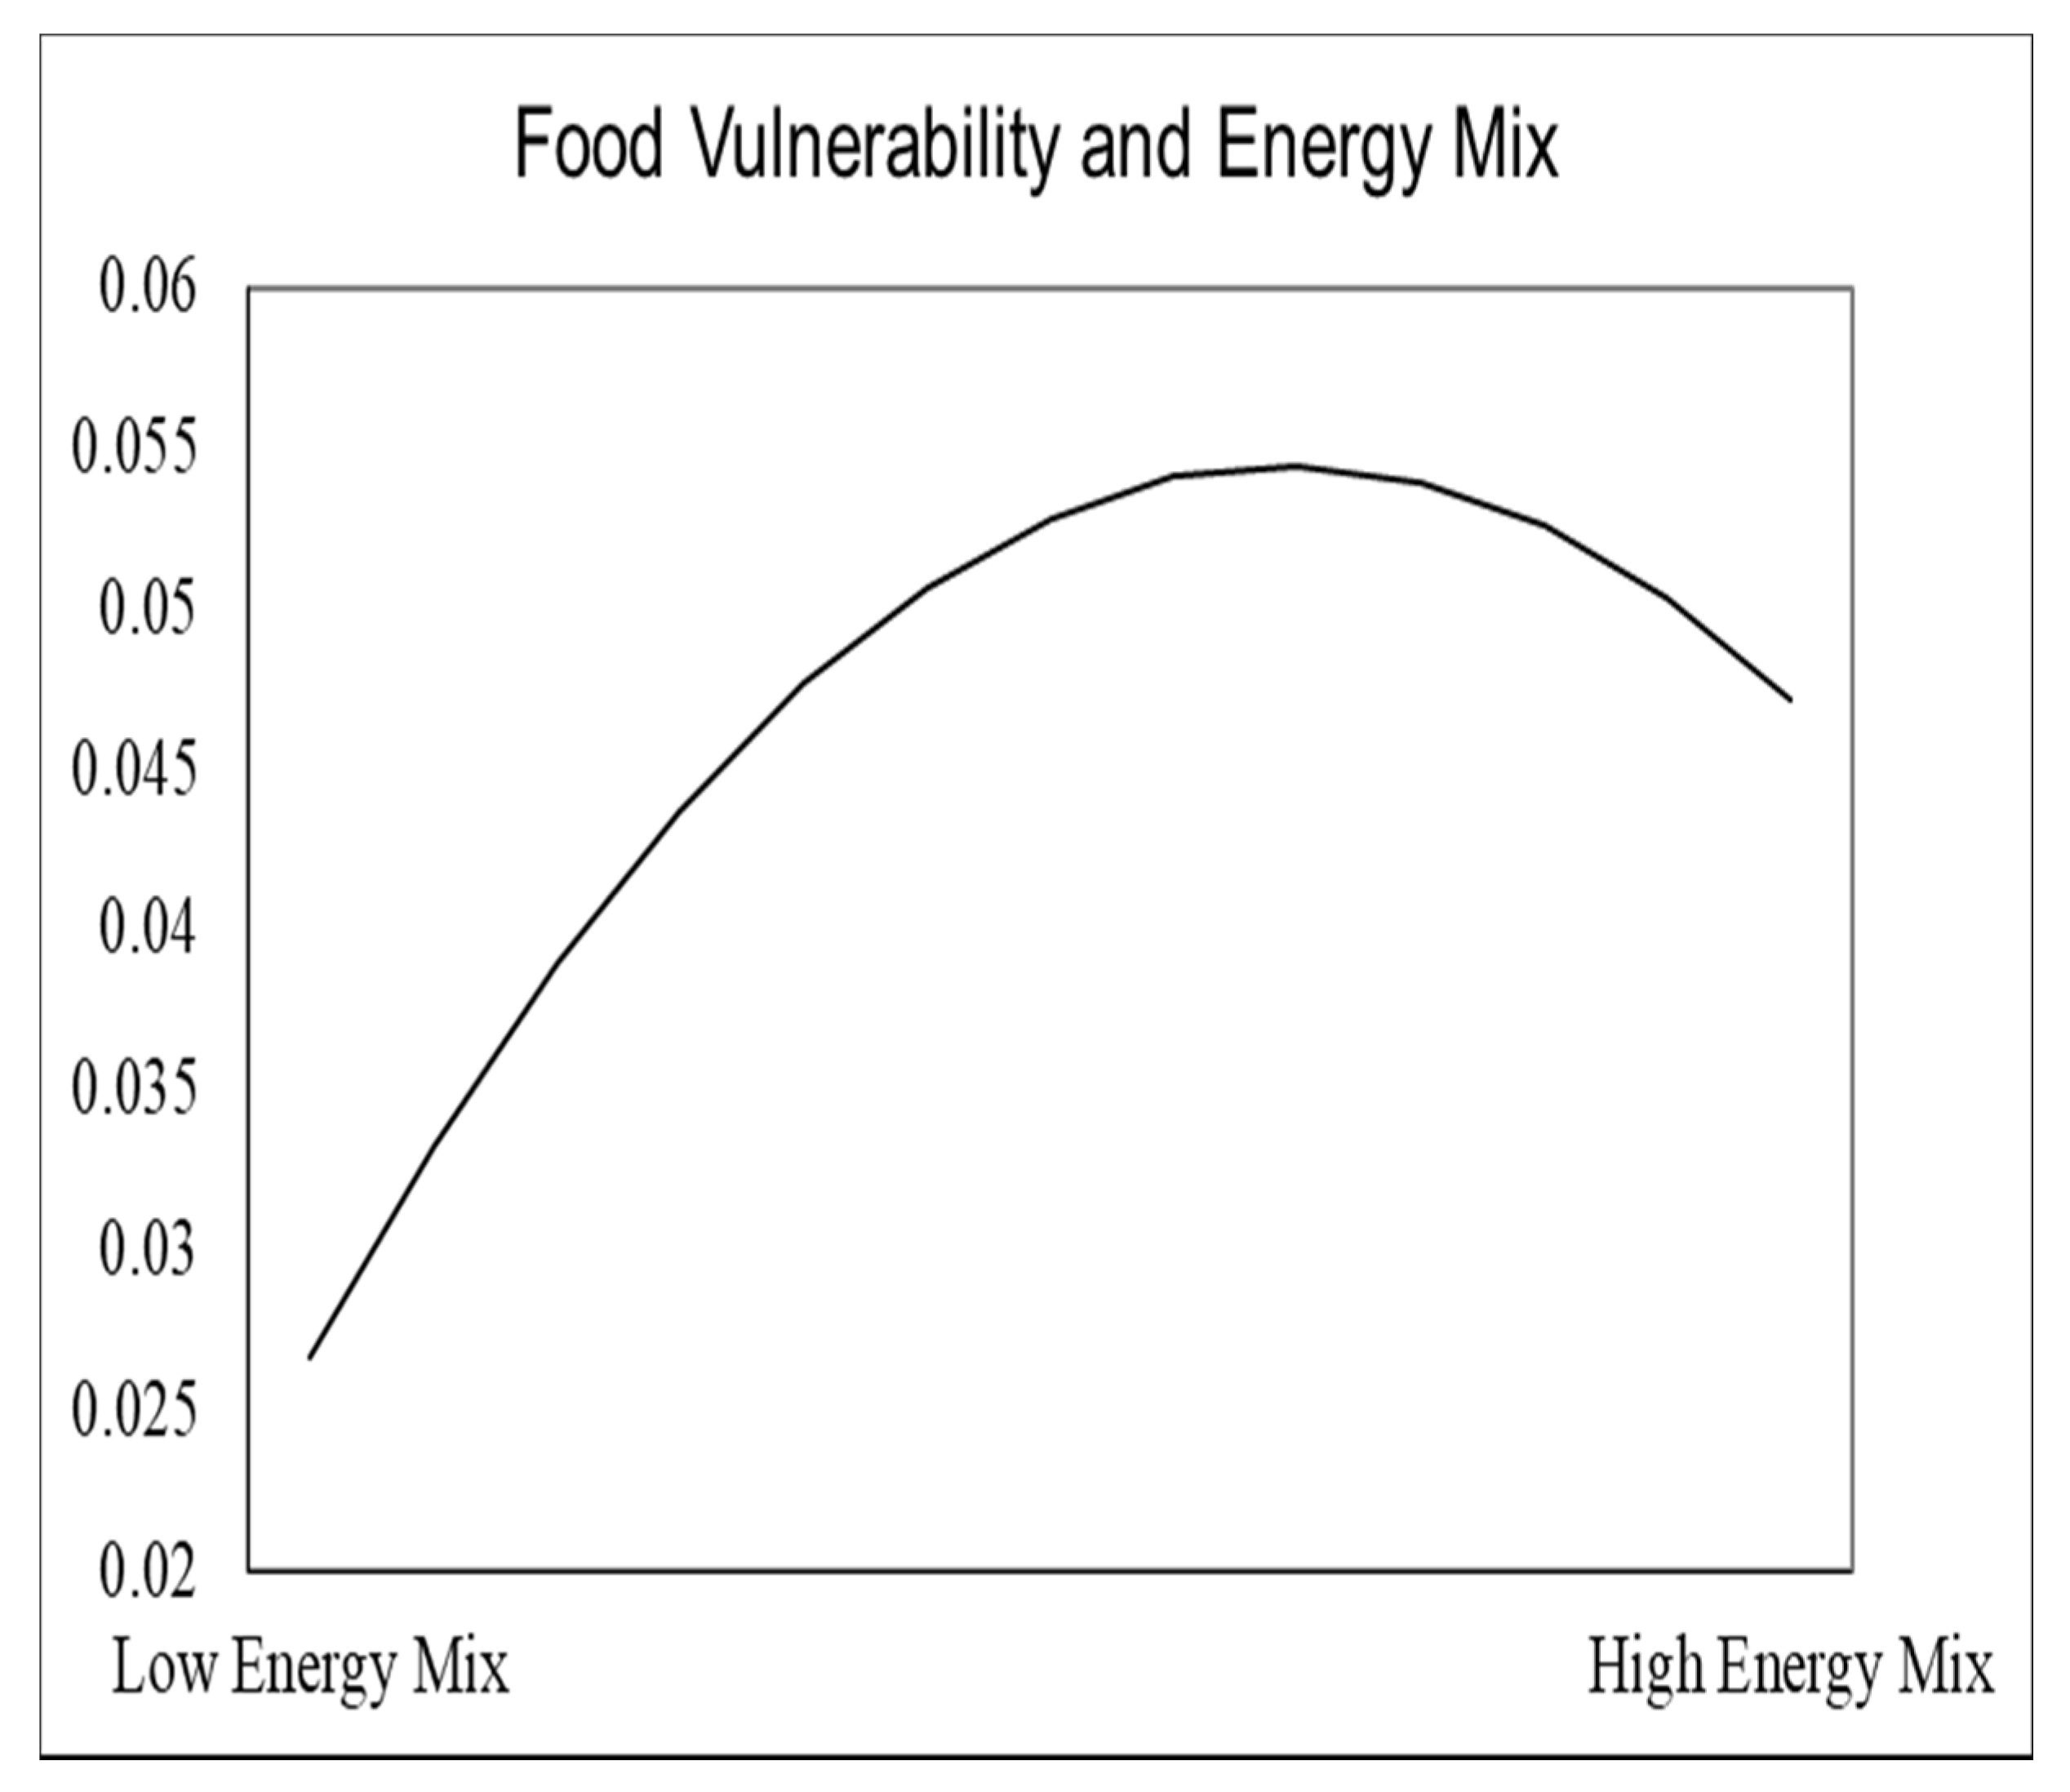
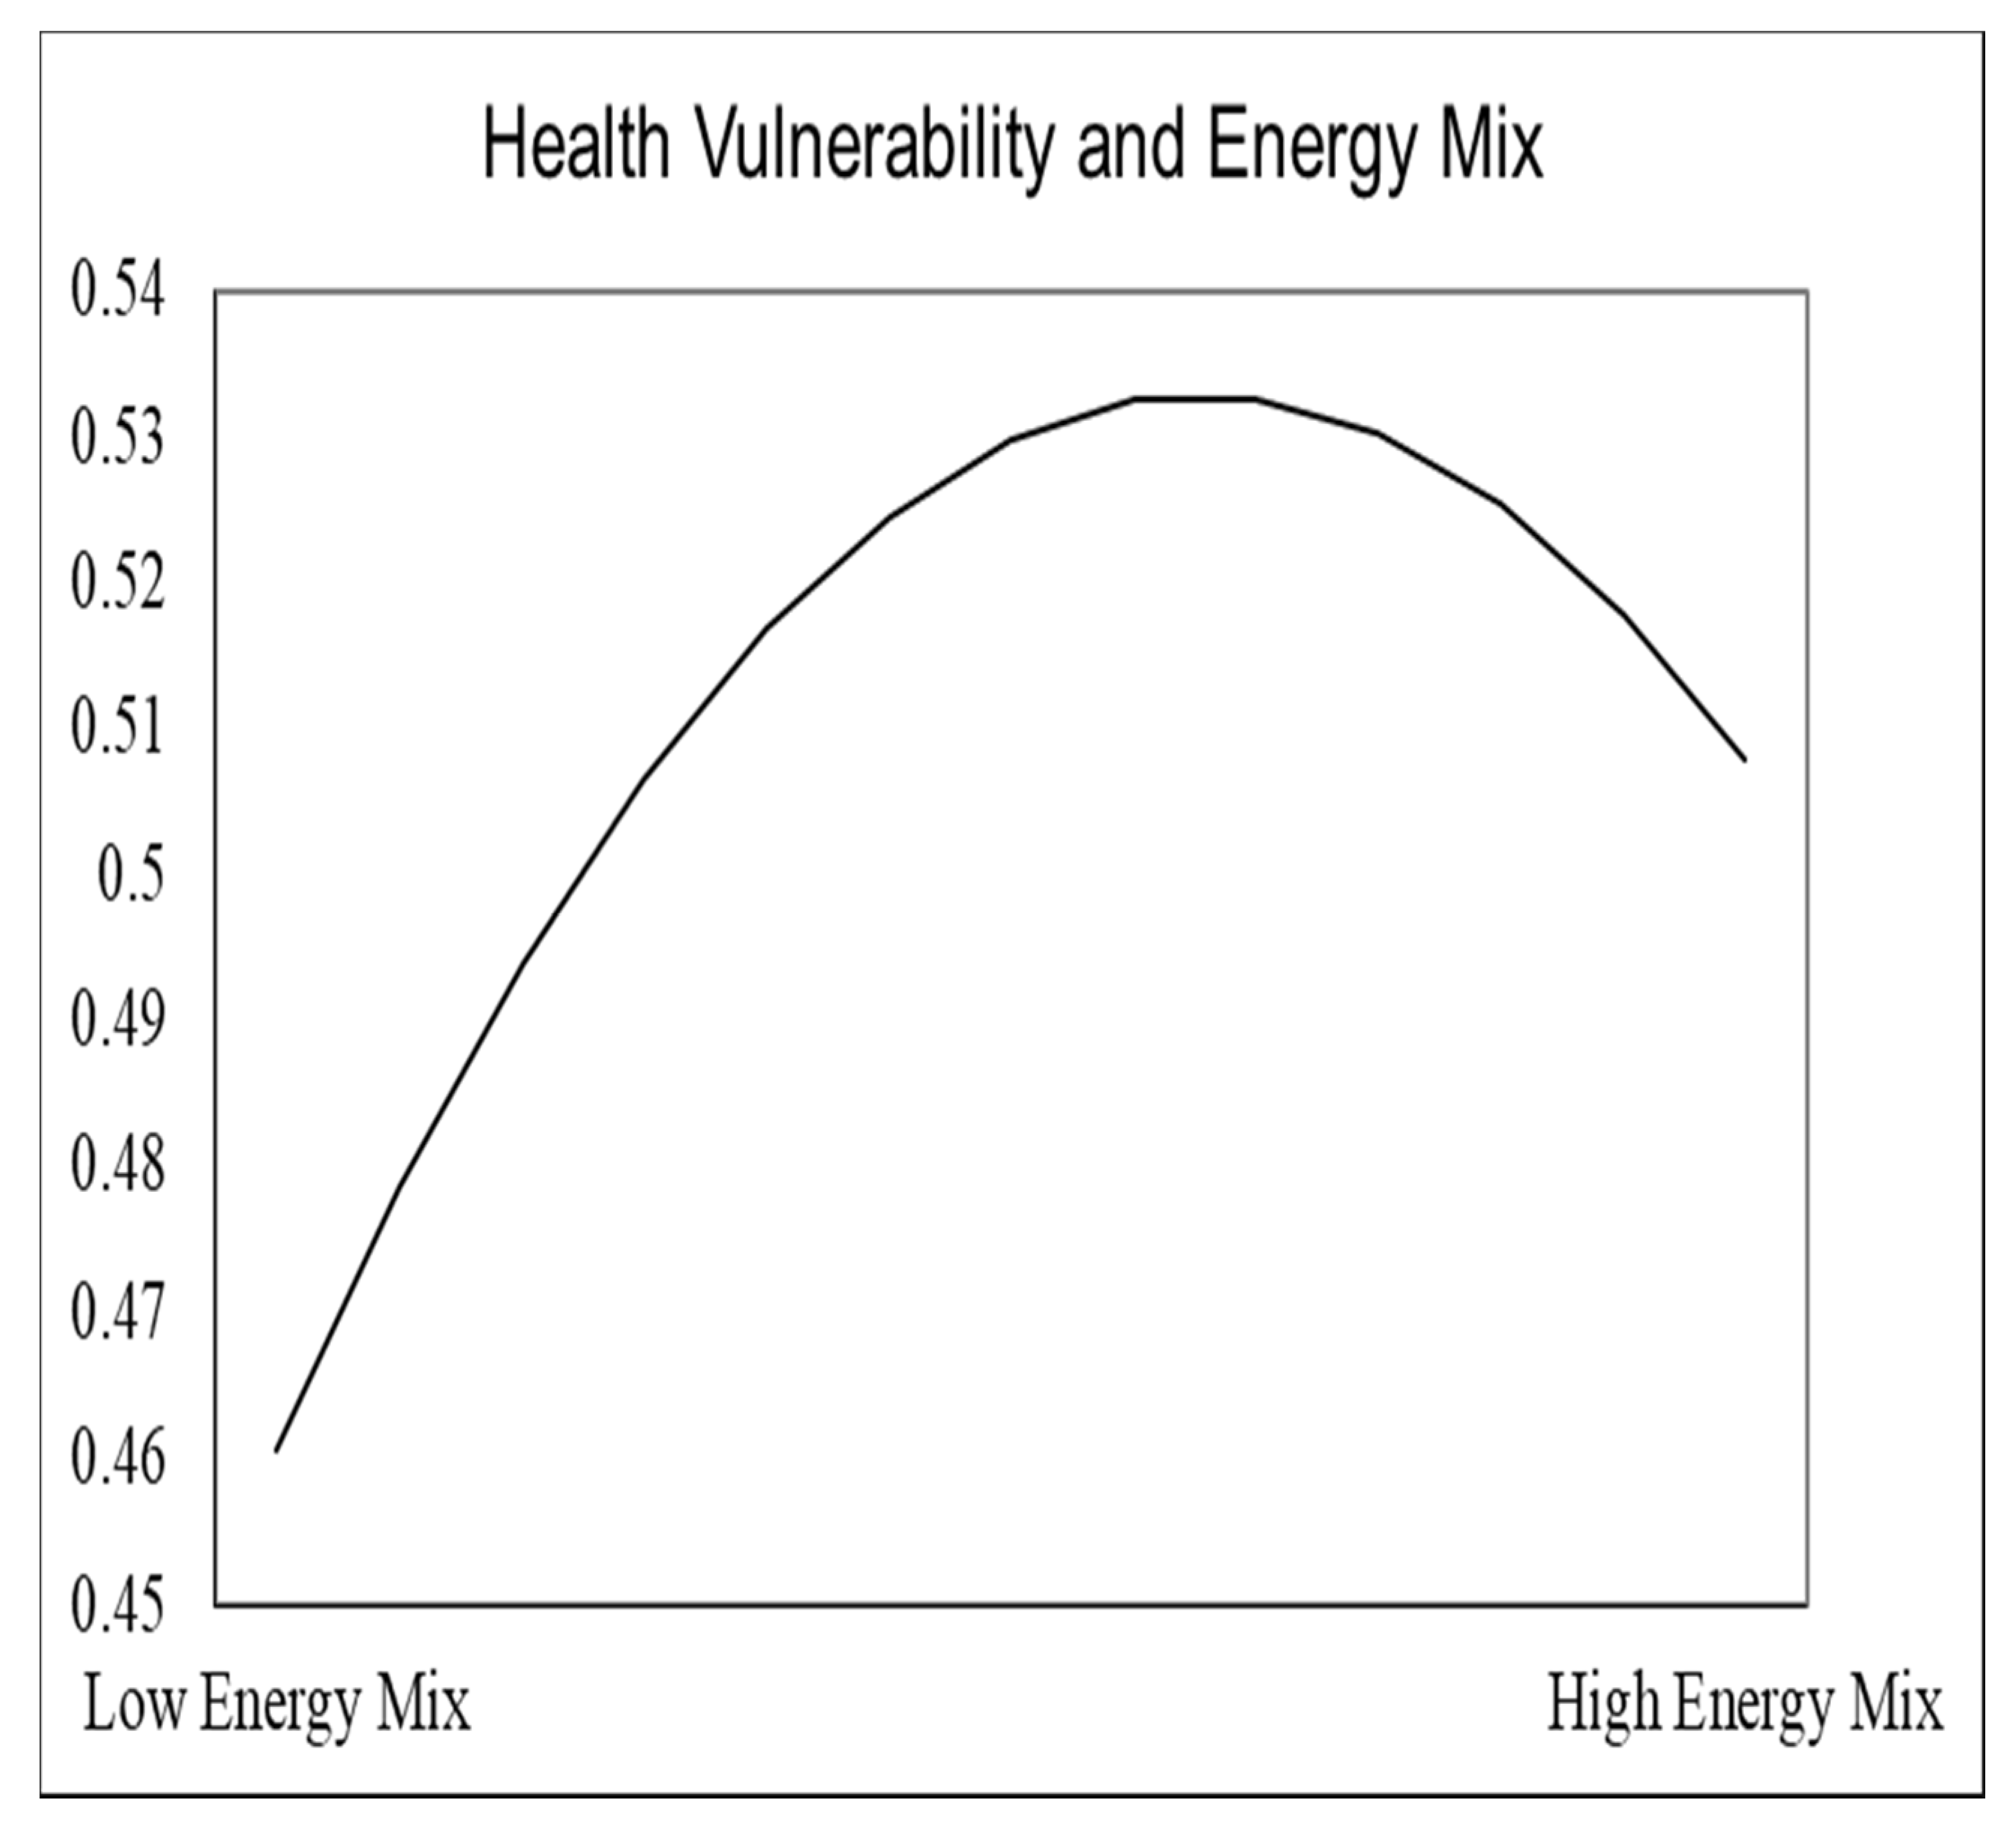
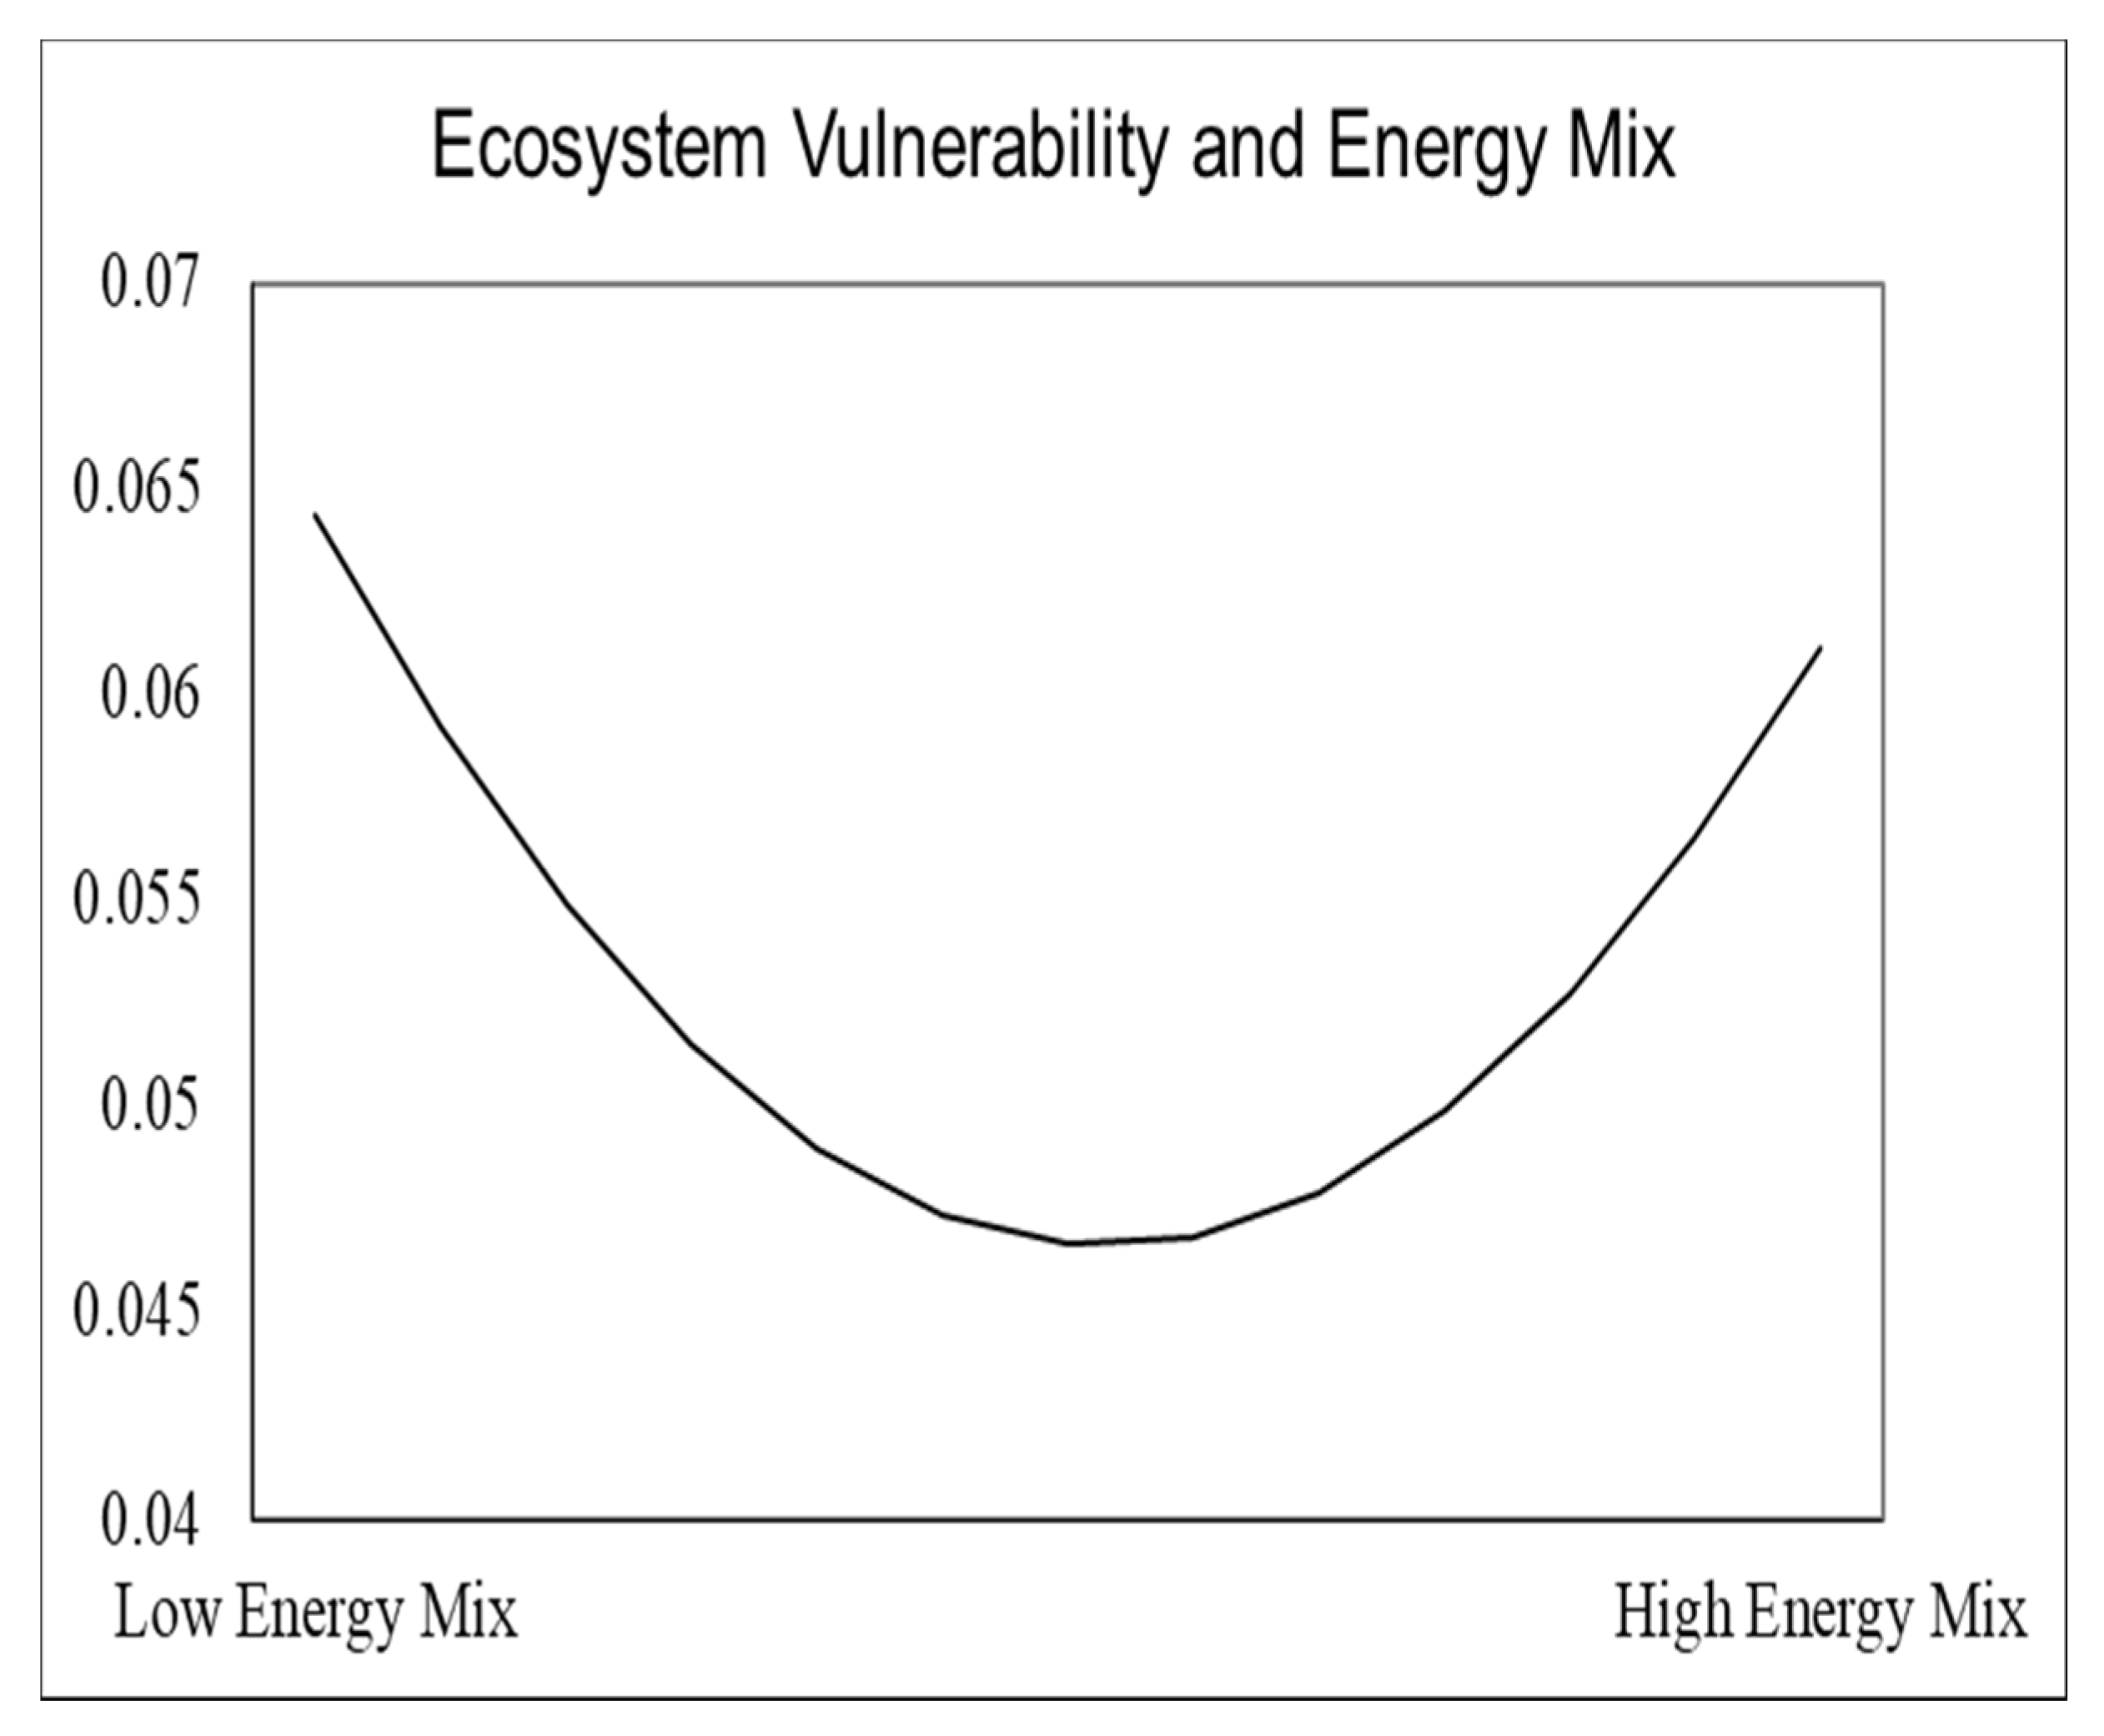
3.1. Theoretical Framework

Climate changes directly impact the chemical, physical and biological characteristics of an ecosystem and environmental systems. Oceans occupy about one-third of the earth’s surface; therefore, oceans can directly affect the atmosphere, and any changes in the atmosphere can change the properties of the ocean. Greenhouse gases in the atmosphere are responsible for warming and acidification, a major threat to marine ecosystems [50]. Due to CO2 emissions, more heat is trapped in the atmosphere, warming the surface temperature of the oceans, and it is responsible for declining pH levels. These changes are affecting ecosystems. Sea levels are rising, and the projected upper limit of rising sea levels is 1.5–2.0 m in the 21st century [51]. Coastal erosion and rising sea levels are causing economic and ecological damage; adaptation measures are necessary to curb this problem. An increase in temperature also has negative consequences for human health [52].
Heatwaves are putting stress on the energy supply, and increasing the risk of electricity shortages [53]. Abrupt changes in climate projections about droughts provide a warning of food shortages in many regions. According to these projections, globally, 60% more food will be needed, and in developing countries, demand for food will increase by 100% by the year 2050. Climate change is also putting more stress on water scarcity. Reducing the vulnerability of agricultural food production is necessary to save the lives of millions of people, and reducing emissions from fossil fuel consumption is necessary for the world’s population [41].
Although developing countries are more vulnerable to climate change, developed countries are also affected [54]. Increasing flood events, rising sea levels, and warmer climates are responsible for many countries’ high death rates and economic damage. Rise in sea level is a major threat to coastal infrastructure that demands resilient infrastructure to protect coastal areas [55,56].
The Environmental Kuznets Curve proposes that economic activities initially deteriorate the environment, but with maturity, the economy moves towards cleaner production [57]. Electricity is an important production source, and fossil fuel is used to power industries. The vulnerability of power generation can be reduced by increasing the share of renewable energy [7].
Zero emissions requires developed infrastructure, and the cost of transformation is very high [33]. Recent studies focus on the use of energy mix as a mitigation approach to climate change [5,7,39]. As the share of renewable energy in the energy mix increases, it can reduce the vulnerability to climate change [5].
This study proposes that, initially, renewable energy consumption will increase vulnerability to climate change, but with a transition towards renewable energy, it will decrease a country’s food, health and infrastructure vulnerability [5]. When renewable energy infrastructure is developed, it will provide long-term benefits in food security, population health, and development. This type of relationship produces an inverted U-shaped relationship between renewable energy consumption preference and country vulnerability to climate change. The link of energy mix and vulnerability is shown in Figure 1.
The use of fossil fuels provides short-term benefits, but at the cost of environmental pollution [13]. Transformation of the economy from the combustion of fossil fuel and coal/oil to renewable-energy resources requires heavy investment to install solar and wind plants. The whole process requires trained staff for these projects, and will disturb employment markets. Many people will lose their jobs because renewable energy resources require high installation costs but less maintenance, and have lower operating costs [22]. This process will also disturb the ecosystem. Renewable energy consumption initially reduces ecosystem vulnerability to climate change, but increased use of renewable energy will increase ecosystem vulnerability with maturity.
Conversion of energy from development-hindering to development-promoting indicates that the ratio of renewable-energy to non-renewable energy is a variable return to scale that a quadratic specification of energy mix can calculate. The square form can identify deviation from constant returns to scale [22].

3.2. Data Source

In order to determine the role of energy mix in determining the vulnerability of countries to climate, four life-supporting sectors are used in the analysis. These sectors include ecosystem, food, health and infrastructure. The sample comprised the G7 countries, namely UK, USA, Canada, France, Italy, Germany, and Japan, because of their major change in energy consumption. Since they have the highest ability to transition towards renewable energy, their initiatives will help other nations to adopt technologies and practices. Data on vulnerability is taken from ND-GAIN (Notre Dame Global Adaptation Initiative). The data on energy mix (renewable and non-renewable energy), trade openness, development expenditures and industrial sector value added percent of GDP is taken from WDI.

3.3. Model Specification

Climate change vulnerability indicators, including ecosystem, food, health and infrastructure, were used in the analysis [37]. A separate model was used to examine the role of the energy mix on the vulnerability of these sectors. The energy mix is expressed as a ratio of renewable energy to non-renewable energy. The transition of renewable energy from development-hampering to development-promoting indicates that this ratio has variable returns to scale. The non-linear specification of energy mix can calculate that. A similar strategy was adopted by [22]. Energy mix has a quadratic effect on the vulnerability of a country. Other control variables include trade openness, development expenditures, and industrial sector value added. These control variables are transformed into a log form. Table 1 presents the fundamental equations of the models, while Table 2 presents variable representations and their composition.

3.4. Estimation Technique

To assess the impact of energy mix on the ecosystem, food, health and infrastructure vulnerability of G7 countries to climate change, the panel ARDL approach was used as an estimation technique. The literature suggests that when the countries per cross section are above 20, then dynamic panel data must be applied to account for serial correlation and heteroskedasticity [58]. This approach provides short- and long-term results, accounting for the non-stationary patterns of variables [59]. Pesaran, Shin and Smith [60] introduced this panel ARDL model, which can be used in mixed order of variables (I(0) and I(1)). This study has ensured the variables are not I(2) in nature using panel unit root tests, and the existence of cointegration among the selected variables using the panel cointegration test.

4. Results Discussion

Results of descriptive statistics are presented in Table 3 below. As the means of all the variables are greater than their standard deviation, these variables are under-dispersed, and the selected variables follow a pattern around their mean value. Further, since skewness is not zero and kurtosis is not 3 for the selected variables, they are not statistically normal. This study uses the central limit theorem to assume that the data is asymptotically normal.
Table 4 presents the results of correlation among variables. Here we can see that energy mix is highly correlated with food volatility.
The final results of this paper were based on the panel ARDL approach. Four different models were used for this analysis. Vulnerability to climate change was measured using four life-supporting sectors: ecosystem, food, health, and infrastructure. Table 5 presents the long-term results of the models.
In the case of ecosystem vulnerability to climate change, 1 unit increase in the energy mix will reduce the ecosystem vulnerability to climate change by 0.41 units, and 1 unit increase in energy mix squared will increase the ecosystem vulnerability to climate change; this pointed to a U-shaped effect, shown in Figure 2. It means that initially, with energy mix the ecosystem’s vulnerability to climate change decreases, but as the renewable energy proportion increases in the energy mix, this increased proportion of renewable energy will increase ecosystem vulnerability. Because the transformation of an economy from fossil-fuel-based power plants to renewable energy plants requires heavy investment, it will change the market structure of an economy that demands trained labor [8,33,34]. Here the threshold value shows that food, health and infrastructure vulnerability will decrease when the renewable energy is at least 5% of non-renewable energy.
Other results show that an increase in trade openness will increase the ecosystem’s vulnerability to climate change, while an increase in development expenditures will decrease the ecosystem’s vulnerability.
In the case of food vulnerability to climate change, 1 unit increase in energy mix will increase food vulnerability by 0.56 units, and 1 unit increase in a square of energy mix will reduce the food vulnerability by 5.04 units. These results show that a high energy mix follows an inverted U-shaped pattern with food vulnerability, as shown in Figure 3. Other results indicate that trade openness and development expenditure will increase the vulnerability of food production to climate change.
In the case of health vulnerability to climate change, 1 unit increase in energy mix will increase health vulnerability by 1.50 units, and 1 unit increase in a square of energy mix will reduce health vulnerability 14.46 units. This also traces an inverted U-shaped relationship, as shown in Figure 4. Other results indicate that an increase in trade openness and development expenditures will reduce health vulnerability.
In the case of infrastructure vulnerability to climate change, 1 unit increase in energy mix will increase the infrastructure vulnerability by 1.39 units, and 1 unit increase in a square of energy mix will reduce infrastructure vulnerability by 13.76 units. This also follows the inverted U-shaped relationship, as shown in Figure 5. Other results indicate that an increase in trade openness and development expenditures will increase infrastructure vulnerability. Industrial share is insignificant in the case of all three models, and we found that industrial share had no significant impact on any of the four indicators of vulnerability to climate change.
The presence of an inverted U-shaped relationship in the case of food, health and infrastructure vulnerability to climate change indicates that initially, energy mix increases vulnerability, but as the proportion of renewable energy increases, vulnerability decreases in all three cases [5,7,61].
Short-term results are reported in Table 6. The ECM(−1) is negative in the case of three models, i.e., ecosystem, food and health vulnerability to climate change. A negative sign indicates that the convergence hypothesis holds for these three models, which means whenever macroeconomic shock occurs in an economy, these models tend to converge to equilibrium. Speed of convergence in the case of ecosystem and food vulnerability is 20%, while in the case of health, it is 68%. Speed of adjustment indicates that models 1 and 2 will take 5 years to remove disequilibrium from the model, while in model 3 it will take only 1.47 years to remove disequilibrium. In the case of model 4, ECM(−1) is positive. Positivity indicates that the divergence hypothesis holds in the case of infrastructure vulnerability. In exploring country-specific short-term estimates, few countries have shown negative ECM(−1).

5. Conclusions and Policy Recommendations

The intensity and frequency of climatic extremes are increasing day by day. Abrupt climate changes are disturbing ecosystems, causing health issues and creating an increased risk of droughts. Key sectors of the economy, i.e., energy, agriculture, fishing, water supply and tourism, have to adopt their approaches and solutions to mitigate climate change.
This study was conducted to investigate the impact of energy preferences on the vulnerability of G7 countries to climate change. For this purpose, four life-supporting sectors of vulnerability to climate change were used in the study. The panel ARDL approach was used to examine the relationship between energy mix and the vulnerability of countries to climate change. This study has used the quadratic energy mix transformation to account for the costs and benefits of transitioning towards renewable energy. This study indicates that a high proportion of renewable energy in the energy mix will increase the ecosystem’s vulnerability to climate change, while it will decrease food, health, and infrastructure vulnerability. This study fulfilled the objective by providing the quadratic function that can be used to find the optimal percentage of renewable energy, and how much adjustment each G7 country requires to minimize its vulnerability.
Other results indicate that trade openness and development expenditures reduce health vulnerability to climate change. Development expenditures also decrease ecosystem vulnerability, while trade openness increases it. However, both of these variables increase infrastructure’s vulnerability.
The significance of this study is that it is the first to empirically investigate the role of energy mix in determining the vulnerability of G7 countries to climate change. Countries that have higher GDP per capita are the major producers of CO2 emissions. Although these countries are paying attention to protecting the environment by limiting the use of fossil fuels responsible for greenhouse gas emissions which cause climate change, the number of incidences of climate change effects in Europe and many other countries demand solutions. Achieving zero-emission goals requires heavy investment, so energy mix provides a solution to the current problem. As the proportion of renewable energy to non-renewable energy increases, the vulnerability of a country to climate change will reduce.
To avoid severe food and water crises requires investment toward tackling climate change, conserving energy and water resources, reforming global trade and food markets, and adapting and adopting climate-resilient responses. To curb the disastrous impact of climate change and loss of oxygen from the oceans, there is a need to take immediate steps to reduce emissions into the atmosphere. World leaders should pay attention to substantially cutting emissions, and they should adopt a more holistic approach that includes other aspects of vulnerability and sustainability.
This study has pointed out another dilemma: increased renewable energy reduces several forms of vulnerability but increases ecosystem vulnerability. Future studies could explore the reasons behind these findings, and further expand the scope of the study to other more vulnerable countries.

Author Contributions

Conceptualization, H.D. and Y.A.K.; methodology, N.A. and A.J.; software, S.S.; validation, N.A. and S.S.; formal analysis, N.A.; investigation, A.J.; resources, J.M.; data curation, A.J.; writing—original draft preparation, N.A.; writing—review and editing, J.M.; funding acquisition, J.M. All authors have read and agreed to the published version of the manuscript.

Funding

This research was partially funded by U.S. National Science Foundation award #OIA-1757207.

Institutional Review Board Statement

Not applicable.

Informed Consent Statement

Not applicable.

Data Availability Statement

Data used in this research and the sources of data are mentioned in Table 3 of this manuscript. All results reported in this research were carried out with the R statistical computing tool.

Acknowledgments

This research was partially funded by U.S. National Science Foundation award #OIA-1757207 received by Jamal Mamkhezri. The results and interpretations are those of the authors and do not reflect the position or policies of the National Science Foundation. We also acknowledge the Zeelamo Academy for providing a scientific platform to connect some of the researchers involved in this study.

Conflicts of Interest

The authors declare that they have no known competing financial interests or personal relationships that could have appeared to influence the research work presented in this article.

Abbreviations

ARDLAutoregressive distributed lag model
G7The Group of Seven (G7) is an inter-governmental political forum consisting of Canada, France, Germany, Italy, Japan, the United Kingdom and the United States
GDPGross domestic product
WDIWorld Development Indicator
CO2Carbon dioxide

References

  1. Sheridan, S.C.; Allen, M.J. Temporal trends in human vulnerability to excessive heat. Environ. Res. Lett. 2018, 13, 043001. [Google Scholar] [CrossRef]
  2. Vulnerability to Climate Change and Reasons for Concern: A Synthesis. Available online: https://archive.ipcc.ch/ipccreports/tar/wg2/pdf/wg2TARchap19.pdf (accessed on 10 January 2022).
  3. Stocker, T.F.; Qin, D.; Plattner, G.-K.; Tignor, M.; Allen, S.K.; Boschung, J.; Nauels, A.; Xia, Y.; Bex, V.; Midgley, P.M. Climate Change 2013: The Physical Science Basis: Working Group I Contribution to the Fifth Assessment Report of the Intergovernmental Panel on Climate Change. Available online: https://www.ipcc.ch/site/assets/uploads/2017/09/WG1AR5_Frontmatter_FINAL.pdf (accessed on 10 January 2022).
  4. Pörtner, H.-O.; Roberts, D.C.; Masson-Delmotte, V.; Zhai, P. The Ocean and Cryosphere in a Changing Climate: A Special Report by the Intergovernmental Panel on Climate Change. Available online: https://www.ipcc.ch/srocc/ (accessed on 10 January 2022).
  5. Foidart, F.; Oliver-Solá, J.; Gasol, C.; Gabarrell, X.; Rieradevall, J. How important are current energy mix choices on future sustainability? Case study: Belgium and Spain—projections towards 2020–2030. Energy Policy 2010, 38, 5028–5037. [Google Scholar] [CrossRef]
  6. Mamkhezri, J.; Malczynski, L.; Chermak, J. Assessing the Economic and Environmental Impacts of Alternative Renewable Portfolio Standards: Winners and Losers. Energies 2021, 14, 3319. [Google Scholar] [CrossRef]
  7. Tobin, I.; Greuell, W.; Jerez, S.; Ludwig, F.; Vautard, R.; van Vliet, M.T.; Bréon, F.-M. Vulnerabilities and resilience of European power generation to 1.5 °C, 2 °C and 3 °C warming. Environ. Res. Lett. 2018, 13, 044024. [Google Scholar] [CrossRef]
  8. Abbasi, K.R.; Shahbaz, M.; Zhang, J.; Irfan, M.; Alvarado, R. Analyze the environmental sustainability factors of China: The role of fossil fuel energy and renewable energy. Renew. Energy 2022, 187, 390–402. [Google Scholar] [CrossRef]
  9. IEA Net Zero by 2050–Analysis. Available online: https://www.iea.org/reports/net-zero-by-2050 (accessed on 10 January 2022).
  10. IUCN Marine Life, Fisheries Increasingly Threatened as the Ocean Loses Oxygen–IUCN Report. Available online: https://www.iucn.org/news/marine-and-polar/201912/marine-life-fisheries-increasingly-threatened-ocean-loses-oxygen-iucn-report (accessed on 10 January 2022).
  11. Mamkhezri, J. Market and Non-Market Valuation of Renewable Energy. Available online: https://digitalrepository.unm.edu/econ_etds/106 (accessed on 10 January 2022).
  12. Mamkhezri, J.; Bohara, A.K.; Camargo, A.I. Air pollution and daily mortality in the Mexico City Metropolitan Area. 2020. Available online: http://www.scielo.org.mx/scielo.php?script=sci_arttext&pid=S0187-62362020000300249 (accessed on 10 January 2022).
  13. Perera, F. Pollution from fossil-fuel combustion is the leading environmental threat to global pediatric health and equity: Solutions exist. Int. J. Environ. Res. Public Health 2018, 15, 16. [Google Scholar] [CrossRef] [PubMed] [Green Version]
  14. Hardinge, P.; Kiddle, G.; Tisi, L.; Murray, J.A.H. Optimised LAMP allows single copy detection of 35Sp and NOSt in transgenic maize using Bioluminescent Assay in Real Time (BART). Sci. Rep. 2018, 8, 17590. [Google Scholar] [CrossRef]
  15. Cambridge University Press. IPCC, 2014: Climate Change 2014: Mitigation of Climate Change. Contribution of Working Group III to the Fifth Assessment Report of the Intergovernmental Panel on Climate Change; Edenhofer, R., Pichs-Madruga, Y., Sokona, E., Farahani, S., Kadner, K., Seyboth, A., Adler, I., Baum, S., Brunner, P., Eickemeier, B., Eds.; Cambridge University Press: Cambridge, UK; New York, NY, USA, 2015; ISBN 9781107058217. [Google Scholar]
  16. Kim, S.E.; Bell, M.L.; Hashizume, M.; Honda, Y.; Kan, H.; Kim, H. Associations between mortality and prolonged exposure to elevated particulate matter concentrations in East Asia. Environ. Int. 2017, 110, 88–94. [Google Scholar] [CrossRef]
  17. Grémillet, D.; Fort, J.; Amélineau, F.; Zakharova, E.; Le Bot, T.; Sala, E.; Gavrilo, M. Arctic warming: Nonlinear impacts of sea-ice and glacier melt on seabird foraging. Glob. Chang. Biol. 2015, 21, 1116–1123. [Google Scholar] [CrossRef] [Green Version]
  18. Hallegatte, S. Strategies to Adapt to an Uncertain Future. Glob. Environ. Chang. 2009, 19, 240–247. [Google Scholar] [CrossRef]
  19. Wang, J.; Hassan, M.S.; Alharthi, M.; Arshed, N.; Hanif, I.; Saeed, M.I. Inspecting non-linear behavior of aggregated and disaggregated renewable and non-renewable energy consumption on GDP per capita in Pakistan. Energy Strat. Rev. 2021, 39, 100772. [Google Scholar] [CrossRef]
  20. Towards an International Certificate System—The Stimulating Example of Belgium. Available online: https://www.researchgate.net/profile/Leonardo-Meeus/publication/228887691_Towards_an_international_certificate_system-the_stimulating_example_of_Belgium/links/00b7d52fe7e8bbb2de000000/Towards-an-international-certificate-system-the-stimulating-example-of-Belgium.pdf (accessed on 10 January 2022).
  21. Khan, I.; Hou, F.; Irfan, M.; Zakari, A.; Le, H.P. Does energy trilemma a driver of economic growth? The roles of energy use, population growth, and financial development. Renew. Sustain. Energy Rev. 2021, 146, 111157. [Google Scholar] [CrossRef]
  22. Zahid, T.; Arshed, N.; Munir, M.; Hameed, K. Role of energy consumption preferences on human development: A study of SAARC region. Econ. Plan. 2020, 54, 121–144. [Google Scholar] [CrossRef]
  23. Mamkhezri, J.; Thacher, A.J.; Chermak, M.J. Renewable Energy Projects: A Socioeconomic and Environmental Case Study for New Mexico.; Riding the Energy Cycles. In Proceedings of the 35th USAEE/IAEE North American Conference , Houston, TX, USA, 12–15 November 2017. [Google Scholar]
  24. Bloyd, D.I.; Bloyd, C.N. Renewable Energy and Sustainable Development: Lessons Learned from APEC for the Preparation of Rio+10. Asian Perspect. 2001, 25, 85–111. [Google Scholar] [CrossRef]
  25. Twerefou, D.K.; Danso-Mensah, K.; Bokpin, G.A. The environmental effects of economic growth and globalization in Sub-Saharan Africa: A panel general method of moments approach. Res. Int. Bus. Financ. 2017, 42, 939–949. [Google Scholar] [CrossRef]
  26. Abdelzaher, D.M.; Martynov, A.; Zaher, A.M.A. Vulnerability to climate change: Are innovative countries in a better position? Res. Int. Bus. Financ. 2019, 51, 101098. [Google Scholar] [CrossRef]
  27. Birkmann, J.; Jamshed, A.; McMillan, J.M.; Feldmeyer, D.; Totin, E.; Solecki, W.; Ibrahim, Z.Z.; Roberts, D.; Kerr, R.B.; Poertner, H.-O.; et al. Understanding human vulnerability to climate change: A global perspective on index validation for adaptation planning. Sci. Total Environ. 2021, 803, 150065. [Google Scholar] [CrossRef] [PubMed]
  28. International Trade and the Adaptation to Climate Change and Variability. Available online: http://www.vwl.unibe.ch/wp-content/uploads/papers/dp/dp1201.pdf (accessed on 10 January 2022).
  29. Holický, M.; Sýkora, M. Assessment of Flooding Risk to Cultural Heritage in Historic Sites. J. Perform. Constr. Facil. 2010, 24, 432–438. [Google Scholar] [CrossRef]
  30. Assessment of Cost of Sea-Level Rise in the Republic of Croatia Including Cost and Benefits of Adaptation. Available online: https://iczmplatform.org/storage/documents/7VBljfSyuHsN5HBfNuYgPUlBj3D2TIyZclgoJUMK.pdf (accessed on 10 January 2022).
  31. The G7 Climate Mandate and the Tregedy of Horizons. Available online: https://carnegieendowment.org/2016/02/04/g7-climate-mandate-and-tragedy-of-horizons-pub-62665 (accessed on 10 January 2022).
  32. Li, Y.; Yang, X.; Ran, Q.; Wu, H.; Irfan, M.; Ahmad, M. Energy structure, digital economy, and carbon emissions: Evidence from China. Environ. Sci. Pollut. Res. 2021, 28, 64606–64629. [Google Scholar] [CrossRef]
  33. BBC Climate Change: Ban New Gas Boilers from 2025 to Reach Net-Zero–BBC News. Available online: https://www.bbc.com/news/science-environment-57149059 (accessed on 10 January 2022).
  34. Gutermuth, P.-G. Financial measures by the state for the enhanced deployment of renewable energies. Sol. Energy 1998, 64, 67–78. [Google Scholar] [CrossRef]
  35. Irfan, M.; Ahmad, M. Relating consumers′ information and willingness to buy electric vehicles: Does personality matter? Transp. Res. Part D Transp. Environ. 2021, 100, 103049. [Google Scholar] [CrossRef]
  36. Razzaq, A.; Ajaz, T.; Li, J.C.; Irfan, M.; Suksatan, W. Investigating the asymmetric linkages between infrastructure development, green innovation, and consumption-based material footprint: Novel empirical estimations from highly resource-consuming economies. Resour. Policy 2021, 74, 102302. [Google Scholar] [CrossRef]
  37. Chen, C.; Noble, I.; Hellmann, J.; Coffee, J.; Murillo, M.; Chawla, N. University of Notre Dame Global Adaptation Index. Available online: https://gain.nd.edu/our-work/country-index/ (accessed on 10 January 2022).
  38. Gritti, E.S.; Smith, B.; Sykes, M.T. Vulnerability of Mediterranean Basin ecosystems to climate change and invasion by exotic plant species. J. Biogeogr. 2005, 33, 145–157. [Google Scholar] [CrossRef]
  39. Vázquez-Rowe, I.; Reyna, J.L.; García-Torres, S.; Kahhat, R. Is climate change-centrism an optimal policy making strategy to set national electricity mixes? Appl. Energy 2015, 159, 108–116. [Google Scholar] [CrossRef]
  40. Wen, C.; Akram, R.; Irfan, M.; Iqbal, W.; Dagar, V.; Acevedo-Duqued; Saydaliev, H.B. The asymmetric nexus between air pollution and COVID-19: Evidence from a non-linear panel autoregressive distributed lag model. Environ. Res. 2022, 209, 112848. [Google Scholar] [CrossRef]
  41. Yildiz, I. Review of climate change issues: A forcing function perspective in agricultural and energy innovation. Int. J. Energy Res. 2019, 43, 2200–2215. [Google Scholar] [CrossRef]
  42. Elum, Z.; Momodu, A.S. Climate change mitigation and renewable energy for sustainable development in Nigeria: A discourse approach. Renew. Sustain. Energy Rev. 2017, 76, 72–80. [Google Scholar] [CrossRef]
  43. Mamkhezri, J.; Thacher, J.A.; Chermak, J.M. Consumer Preferences for Solar Energy: A Choice Experiment Study. Energy J. 2020, 41. [Google Scholar] [CrossRef]
  44. .Mamkhezri, J.; Thacher, J.A.; Chermak, J.M.; Berrens, R.P. Does the solemn oath lower WTP responses in a discrete choice experiment application to solar energy? J. Environ. Econ. Policy 2020, 9, 447–473. [Google Scholar] [CrossRef]
  45. Fang, Z.; Razzaq, A.; Mohsin, M.; Irfan, M. Spatial spillovers and threshold effects of internet development and entrepreneurship on green innovation efficiency in China. Technol. Soc. 2021, 68, 101844. [Google Scholar] [CrossRef]
  46. Tanveer, A.; Zeng, S.; Irfan, M.; Peng, R. Do Perceived Risk, Perception of Self-Efficacy, and Openness to Technology Matter for Solar PV Adoption? An Application of the Extended Theory of Planned Behavior. Energies 2021, 14, 5008. [Google Scholar] [CrossRef]
  47. Javaid, A.; Arshed, N.; Munir, M.; Zakaria, Z.A.; Alamri, F.S.; Khalifa, H.A.E.-W.; Hanif, U. Econometric Assessment of Institutional Quality in Mitigating Global Climate-Change Risk. Sustainability 2022, 14, 669. [Google Scholar] [CrossRef]
  48. Salem, S.; Arshed, N.; Anwar, A.; Iqbal, M.; Sattar, N. Renewable Energy Consumption and Carbon Emissions—Testing Nonlinearity for Highly Carbon Emitting Countries. Sustainability 2021, 13, 11930. [Google Scholar] [CrossRef]
  49. Muhammad, A.A.; Arshed, N.; Kousar, N. Renewable Energy Consumption and Economic Growth in Member of OIC Countries. Eur. Online J. Nat. Soc. 2017, 6, 111–129. [Google Scholar]
  50. Walther, G.-R.; Post, E.; Convey, P.; Menzel, A.; Parmesan, C.; Beebee, T.J.C.; Fromentin, J.-M.; Hoegh-Guldberg, O.; Bairlein, F. Ecological responses to recent climate change. Nature 2002, 416, 389–395. [Google Scholar] [CrossRef] [PubMed]
  51. Kopp, R.E.; Horton, R.M.; Little, C.M.; Mitrovica, J.X.; Oppenheimer, M.; Rasmussen, D.J.; Strauss, B.H.; Tebaldi, C. Probabilistic 21st and 22nd century sea-level projections at a global network of tide-gauge sites. Earth Future 2014, 2, 383–406. [Google Scholar] [CrossRef]
  52. Watts, N.; Adger, W.N.; Agnolucci, P.; Blackstock, J.; Byass, P.; Cai, W.; Chaytor, S.; Colbourn, T.; Collins, M.; Cooper, A. Health and Climate Change: Policy Responses to Protect Public Health. Lancet 2015, 386, 1861–1914. [Google Scholar] [CrossRef]
  53. Mamkhezri, J.; Torell, G.L. Assessing the Impact of Exceptional Drought on Emissions and Electricity Generation: The Case of Texas. Energy J. 2022, 43. [Google Scholar] [CrossRef]
  54. Swart, R.; Raes, F. Making integration of adaptation and mitigation work: Mainstreaming into sustainable development policies? Clim. Policy 2007, 7, 288–303. [Google Scholar] [CrossRef]
  55. Tol, R.S.J.; Klein, R.J.T.; Nicholls, R.J. Towards Successful Adaptation to Sea-Level Rise along Europe′s Coasts. J. Coast. Res. 2008, 242, 432–442. [Google Scholar] [CrossRef] [Green Version]
  56. Lemmen, D.S.; Warren, F.J. Climate Change Impacts and Adaptation: A Canadian Perspective. 2004. Available online: https://d1ied5g1xfgpx8.cloudfront.net/pdfs/27428.pdf (accessed on 10 January 2022).
  57. Pao, H.-T.; Tsai, C.-M. CO2 emissions, energy consumption and economic growth in BRIC countries. Energy Policy 2010, 38, 7850–7860. [Google Scholar] [CrossRef]
  58. Arshed, N.; Anwar, A.; Kousar, N.; Bukhari, S. Education Enrollment Level and Income Inequality: A Case of SAARC Economies. Soc. Indic. Res. 2017, 140, 1211–1224. [Google Scholar] [CrossRef]
  59. Hassan, M.S.; Meo, M.S.; Karim, M.Z.A.; Arshed, N. Prospects of Environmental Kuznets Curve and Green Growth in Developed and Developing Economies. Stud. Appl. Econ. 2020, 38. [Google Scholar] [CrossRef]
  60. Pesaran, M.H.; Shin, Y.; Smith, R.P. Pooled Mean Group Estimation of Dynamic Heterogeneous Panels. J. Am. Stat. Assoc. 1999, 94, 621–634. [Google Scholar] [CrossRef]
  61. Karimi, M.S.; Khezri, M.; Khan, Y.A.; Razzaghi, S. Exploring the influence of economic freedom index on fishing grounds footprint in environmental Kuznets curve framework through spatial econometrics technique: Evidence from Asia-Pacific countries. Environ. Sci. Pollut. Res. 2021, 29, 6251–6266. [Google Scholar] [CrossRef]
Figure 1. Role of energy mix in reducing vulnerability to climate change.
Sustainability 14 02161 g001
Figure 2. Relationship between energy mix and ecosystem vulnerability to climate change.
Sustainability 14 02161 g002
Figure 3. Relationship between energy mix and vulnerability of food to climate change.
Sustainability 14 02161 g003
Figure 4. Relationship between energy mix and vulnerability of health to climate change.
Sustainability 14 02161 g004
Figure 5. Relationship between energy mix and vulnerability of infrastructure to climate change.
Sustainability 14 02161 g005
Table 1. Fundamental equations of the model.
NoModel
1Ecosystem VulnerabilityESVit = α0 + β1 EMit + β2 EM2it + β3 logTOit + β4 logEXPit + β5 logINDit + µit
2Food VulnerabilityFDVit = α0 + β1 EMit + β2 EM2it + β3 logTOit + β4 logEXPit + β5 logINDit + µit
3Health VulnerabilityHEVit = α0 + β1 EMit + β2 EM2it + β3 logTOit + β4 logEXPit + β5 logINDit + µit
4Infrastructure VulnerabilityINVit = α0 + β1 EMit + β2 EM2it + β3 logTOit + β4 logEXPit + β5 logINDit + µit
Table 2. Variable representations and their composition.
VariablesEcosystem VulnerabilityFood VulnerabilityHealth VulnerabilityInfrastructure VulnerabilityEnergy MixTrade OpennessDevelopment ExpendituresIndustrialization
RepresentationESVitFDVitHEVitINVitEMitlogTOitlogEXPitlogINDit
Data transformationIndexIndexIndexIndexRenewable to non-renewable energy ratioLn (Trade Openness % of GDP)Ln (Development expenditures % of GDP)Ln (Industrial sector value added % of GDP)
Data sourceND-GAIN (Notre Dame Global Adaptation Initiative) [37], World Development Indicator (WDI)
Data range 1995–2019
Where t represents time and i represents a G7 country.
Table 3. Descriptive statistics.
StatsNMeanStd. Dev.RangeSkewnessKurtosis
ESV1750.3560.0710.1990.36361.598
FDV1750.2670.0530.1660.1871.554
HEV1750.1630.0530.1801.1432.809
INV1750.3310.0610.2060.1981.965
EM1710.0370.0370.1581.1453.366
LogIND1593.1610.1860.713−0.0181.841
LogTO1663.8480.4161.653−0.7282.481
LogEXP1492.2320.4141.670−0.9302.615
Table 4. Correlation matrix.
ESVFDVHEVINVEMlogINDlogTOlogEXP
ESV1
FDV0.25411
HEV0.05690.36951
INV0.2415−0.0431−0.29851
EM−0.02390.2116−0.0198−0.04471
logIND0.4741−0.4093−0.05510.3528−0.33341
logTO−0.7172−0.4155−0.1438−0.40080.0346−0.13861
logEXP−0.1733−0.0627−0.5292−0.07880.3277−0.35040.36861
Table 5. Long-run panel ARDL results.
D.ESVD.FDVD.HEVD.INV
Model1234
EM−0.412 ***0.562 **1.509 **1.390 ***
−0.103−0.188−0.567−0.234
EM25.105 **−5.046 **−14.468 *−13.764 ***
−1.622−1.456−5.623−1.994
LogTO0.019 ***0.026 ***−0.074 *0.053 ***
−0.003−0.006−0.036−0.014
LogEXP−0.005 ***0.004 **−0.104 ***0.023 ***
−0.001−0.001−0.01−0.005
LogIND−0.002−0.018−0.0120.027
−0.009−0.011−0.066−0.029
Observations138138138138
Number of id7777
Threshold0.040.050.050.05
Standard errors in parentheses. Author’s own calculations. *** p < 0.01, ** p < 0.05, * p < 0.1.
Table 6. Short-run Results.
Ecosystem VulnerabilityFood VulnerabilityHealth VulnerabilityInfrastructure Vulnerability
Model1234
ECM (−1)−0.2005 *−0.203 ***−0.683 ***0.049
(0.077)(0.056)(0.177)(0.057)
EM
D1.
0.073−0.442−5.939−0.076
(0.235)(0.294)(6.076)(0.273)
EM2
D1.
−1.3067.19828.5784.342
(3.306)(8.195)(49.553)(5.529)
LogTO
D1.
−0.006−0.126 *−0.092−0.006
(0.0069)(0.006)(0.0738)(0.009)
LogEXP
D1.
0.0014−0.002 *0.0110.001
(0.0009)(0.001)(0.025)(0.001)
LogIND
D1.
0.0032−0.0370.377 **0.002
(0.020)(0.0251)(0.116)(0.0128)
_constant0.0549 *−0.0388 ***0.493 ***0.005
(0.0236)(0.008)(0.128)(0.0052)
Standard errors in parentheses. Authors’ own calculations. *** p < 0.01, ** p < 0.05, * p < 0.1.
Publisher’s Note: MDPI stays neutral with regard to jurisdictional claims in published maps and institutional affiliations.

