Article

Trends in Renewable Electricity Generation in the G20 Countries: An Analysis of the 1990–2020 Period

by
Carla Cristiane Sokulski
1,*,
Murillo Vetroni Barros
1,
Rodrigo Salvador
2,
Evandro Eduardo Broday
3 and
Antonio Carlos de Francisco
1
1
Sustainable Production Systems Laboratory (LESP), Graduate Program in Industrial Engineering, Universidade Tecnológica Federal do Paraná (UTFPR), Ponta Grossa 84017-220, PR, Brazil
2
Technical University of Denmark (DTU), Department of Engineering Technology and Didactics, Lautrupvang 15, Building Ballerup/Room E2.12, DK-2750 Ballerup, Denmark
3
Graduate Program in Industrial Engineering, Universidade Tecnológica Federal do Paraná (UTFPR), Ponta Grossa 84017-220, PR, Brazil
*
Author to whom correspondence should be addressed.
Sustainability 2022, 14(4), 2084; https://doi.org/10.3390/su14042084
Submission received: 30 December 2021 / Revised: 19 January 2022 / Accepted: 7 February 2022 / Published: 11 February 2022
(This article belongs to the Special Issue Feature Papers in Energy Sustainability)

Abstract

:
The use of electricity from non-renewable sources increases environmental impacts. Therefore, several countries have committed to increase the use of renewable sources. Considering the importance of the Group of Twenty (G20), this article aims to identify trends in renewable electricity supply in these countries. The data collected are from the International Energy Agency (IEA) between 1990 and 2020. The methods measured the production of each type of electricity in the G20 matrices and identified the influence of the population, Gross Domestic Product (GDP), and CO2 emissions in renewable electricity production using multiple linear regression. In terms of results, Brazil and Canada have the most renewable electricity matrices and higher per capita renewable production than non-renewable. Saudi Arabia presented the smallest renewable matrix throughout the analyzed period. All 20 countries have varied electrical production, with different amounts of solar, wind, hydro, biomass, geothermal, and tidal energy. Countries with the highest GDP are not necessarily the largest producers of renewable electricity. Hydroelectric energy, the biggest highlight in renewable production, is making room for other sources such as wind and solar, which grew the most in terms of participation in the electrical matrices. The waste, geothermal, and tidal energy participation have shown a timid but constant growth.

1. Introduction

Electricity plays an extremely important role in the productive sector and in the life of society. It is crucial for a constant development to ensure the supply of the necessary energy for society to maintain wellbeing and productivity [1]. To date, electricity represents a large part of the energy used by society, and its importance and use continues to rise along with the trend of increasing population and urbanization [2]. Electricity has been flagged as the most important commodity traveling across the boundaries of local energy systems in the future [3]. The global demand for electricity is expected to double by 2050 [4], and much of this growth is expected to come from developing countries [5]. Thus, the increasing demand for electricity, and the depletion of fossil fuels, call for actions in an attempt to decarbonize electricity systems. This matter has led to ongoing debates between industries and governments due to pressures imposed by society and environmentalists to reduce GHG emissions [6].
On top of not being environmentally preferable, fossil sources, such as coal, are likely to be extinguished by excessive use, therefore governments in several countries are already implementing new policies in order to not provide support/financing for coal power generation. In 2021, the UN’s Climate Action Summit brought together several countries, where many of them made new commitments to cease using coal power, and major international banks committed to effectively end all international public financing of new coal power initiatives by the end of 2021 [7]. However, since 2015, the Paris Agreement, adopted by 196 Parties at COP 21 in Paris, has been part of an international treaty on climate change aimed at limiting global warming to well below 2 degrees Celsius, preferably to 1.5 [8]. As a response to that, some renewable energy sources have grown considerably in recent years.
Environmental impacts associated with the generation of electricity have been a subject of concern and have pushed debates on clean practices [9]. Due to the highly intermittent nature of wind and solar power, a certain quantity of dispatchable capacity will likely also be required in the future [10]. In the context of the energy transition, a few challenges have been preventing the uptake of grid-integrated renewable electricity-generation technologies, such as costs of electricity supply and upgrading transmission infrastructure to accommodate energy generators [11].
It is well-established in the literature that renewable energy sources contribute to decarbonization and consequently are drivers for the transition to a cleaner world in terms of GHG emissions. Nonetheless, an analysis not yet addressed in the scientific literature is the generation of renewable energy in The Group of Twenty (G20). This appears to be an important research gap. Therefore, this study seeks to answer the following research question: What are the trends in electricity generation from renewable sources in the G20 countries? To that end, this paper aims to identify trends in electricity generation from renewable energies in the G20 countries.
The G20 countries have a great impact on both the world’s economic development and the global greenhouse effect [12]. The countries included in the Group are: Argentina, Australia, Brazil, Canada, China, France, Germany, Japan, India, Indonesia, Italy, Mexico, Russia, South Africa, Saudi Arabia, South Korea, Turkey, the United Kingdom, the United States, and the European Union. In this sense, an analysis of electricity generation from renewable sources in these territories seems to be important to assess their history and trends.
Studies with the same perspective as this one have also been published in recent literature. [13] assessed the influences of renewable electricity generation in ASEAN-5 countries, i.e., in the Southeast Asian nations (Indonesia, Malaysia, the Philippines, Thailand, and Vietnam) during the period 1985–2016. In addition, [14] documented the historical growth of the wind energy industry and articulated projections for increased installed capacity from different agencies in China, the US, and the European Union. However, no studies were found covering the investigation of the trends for renewable electricity generation in the G20 countries. Therefore, this can be considered the novelty and significance of this study.
This study is structured as follows: this first section presents the initial considerations of renewable electricity sources and the G20 countries, and shows the motivations to conduct this research. Section 2 provides a literature review on the theories underlying this research. Section 3 depicts the methods and data used to build this study. Section 4 shows the analysis conducted for the G20 countries in terms of renewable energy generation and presents the main trends in clean energy generation per country, and presents the influence of population, GDP, and CO2 emission indicators. Finally, Section 5 outlines the main conclusions, limitations of the present study, and suggestions for further research.

2. Literature Review
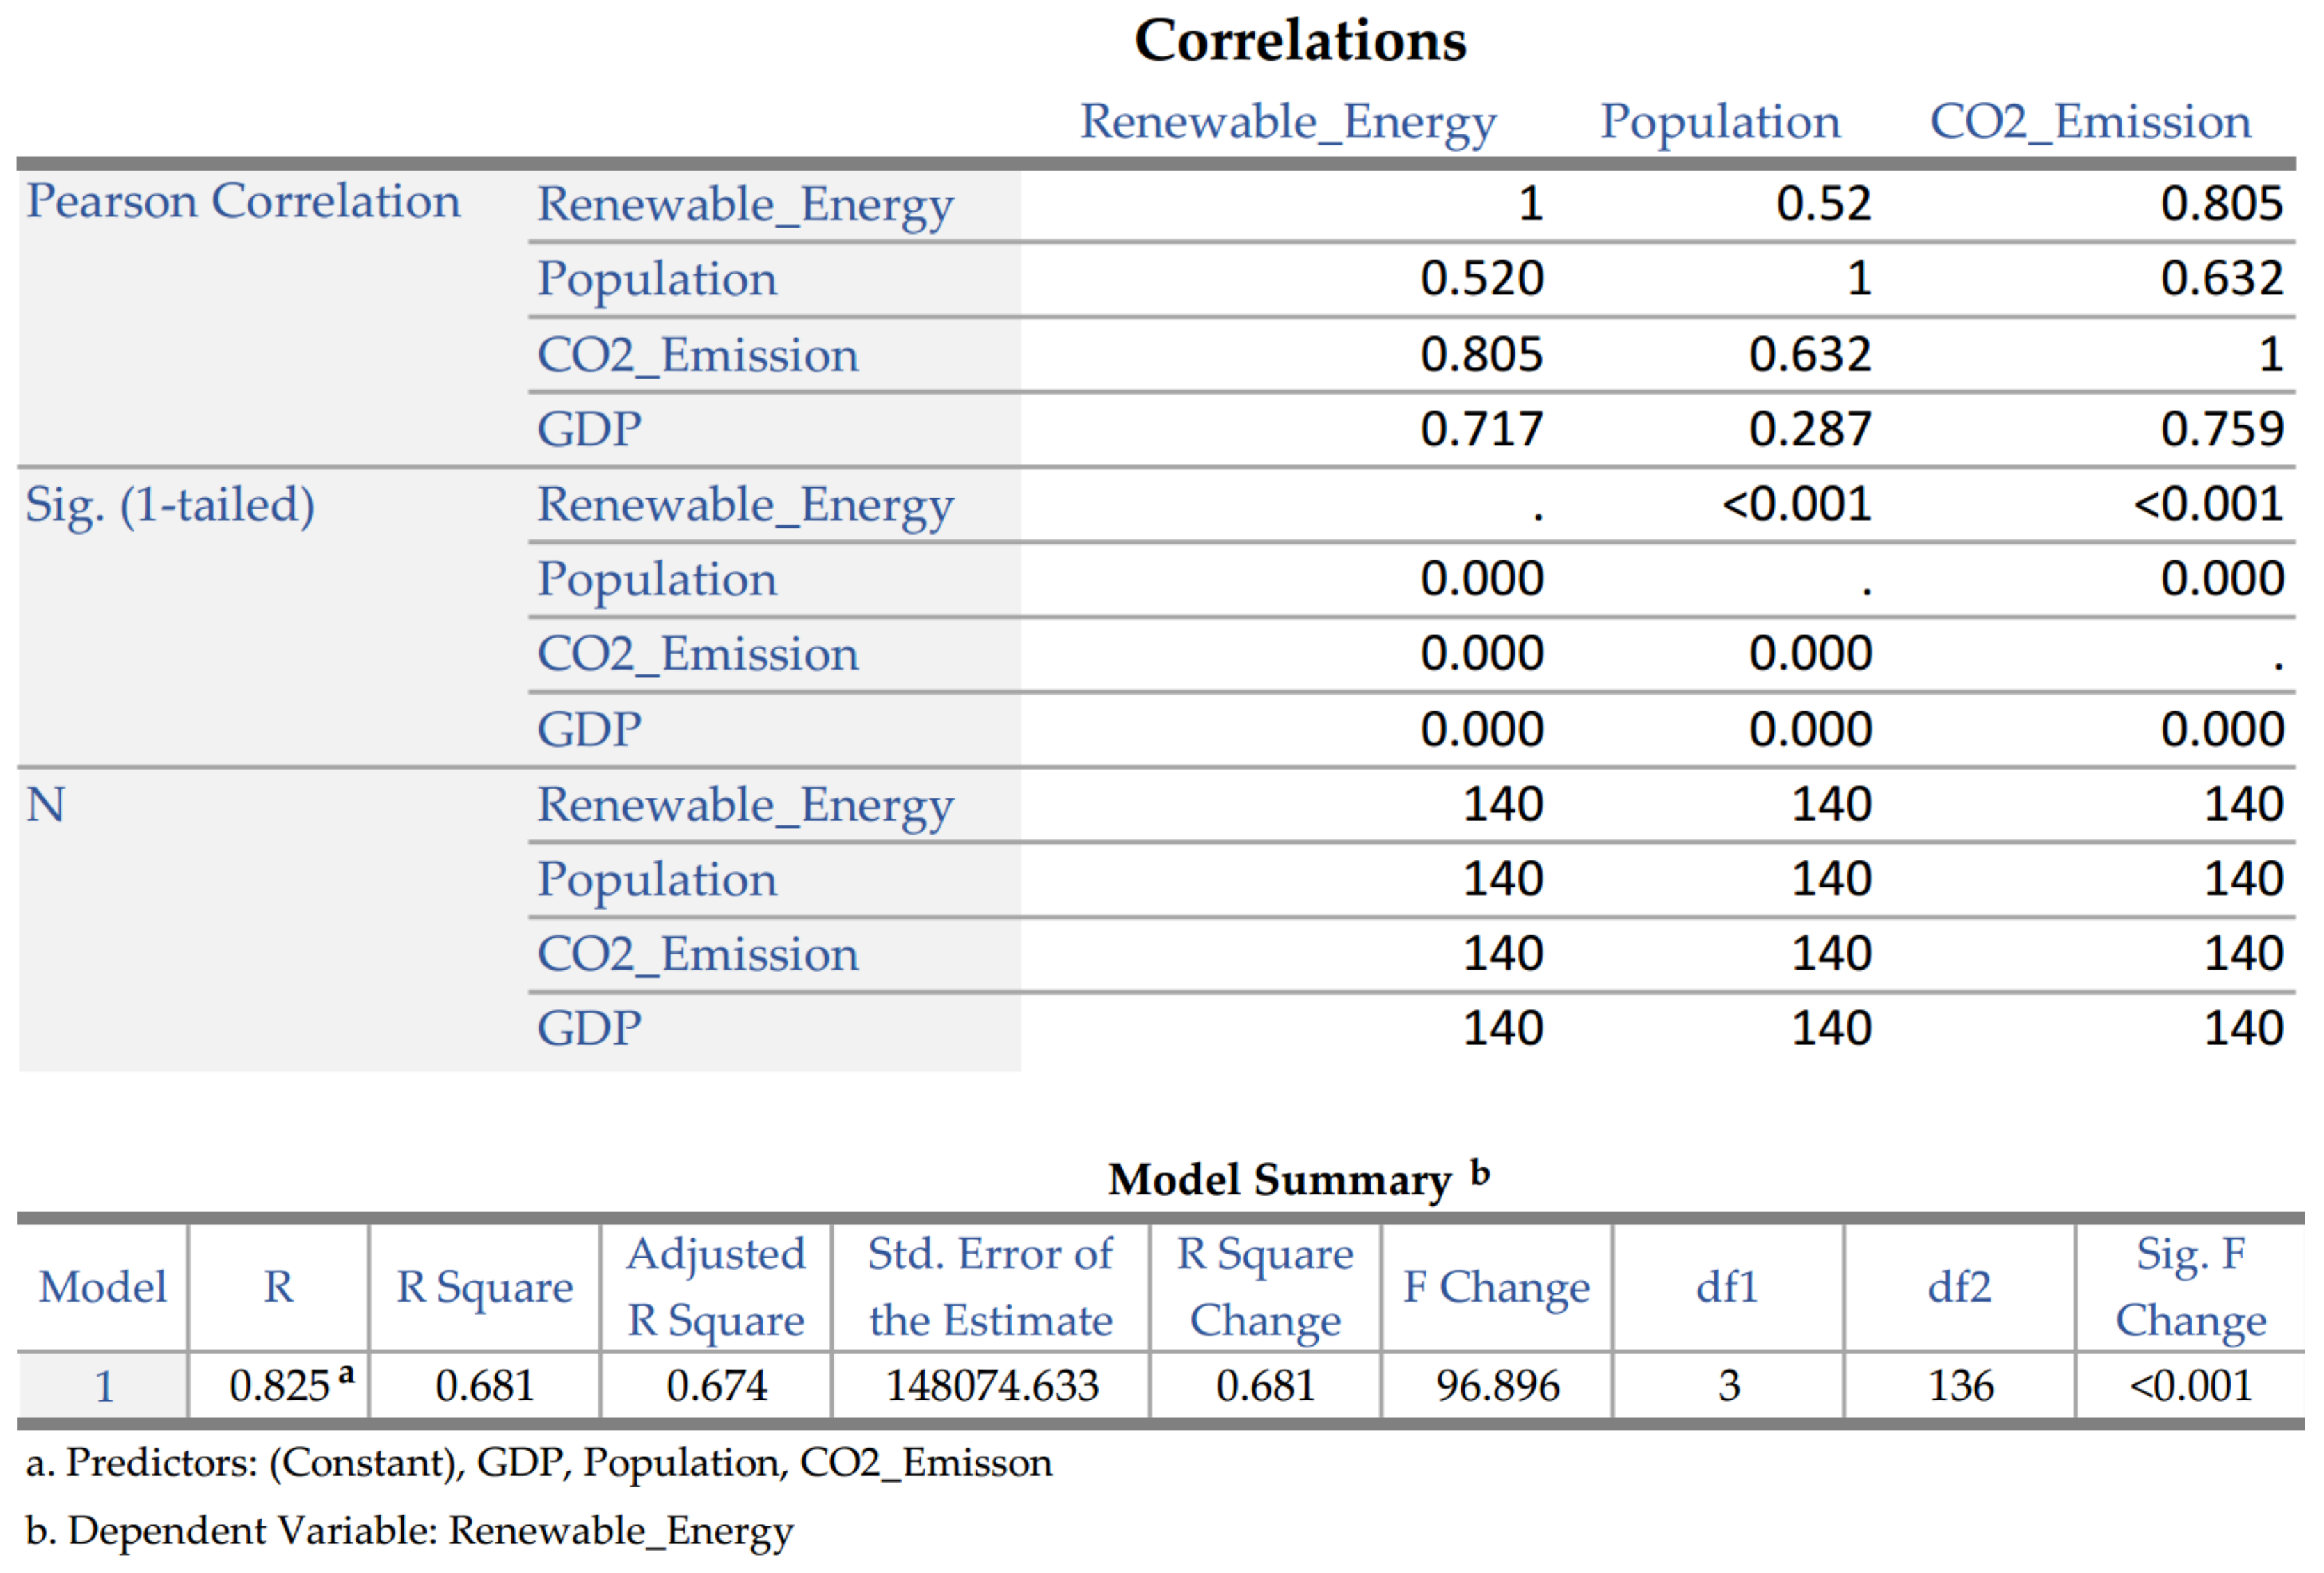
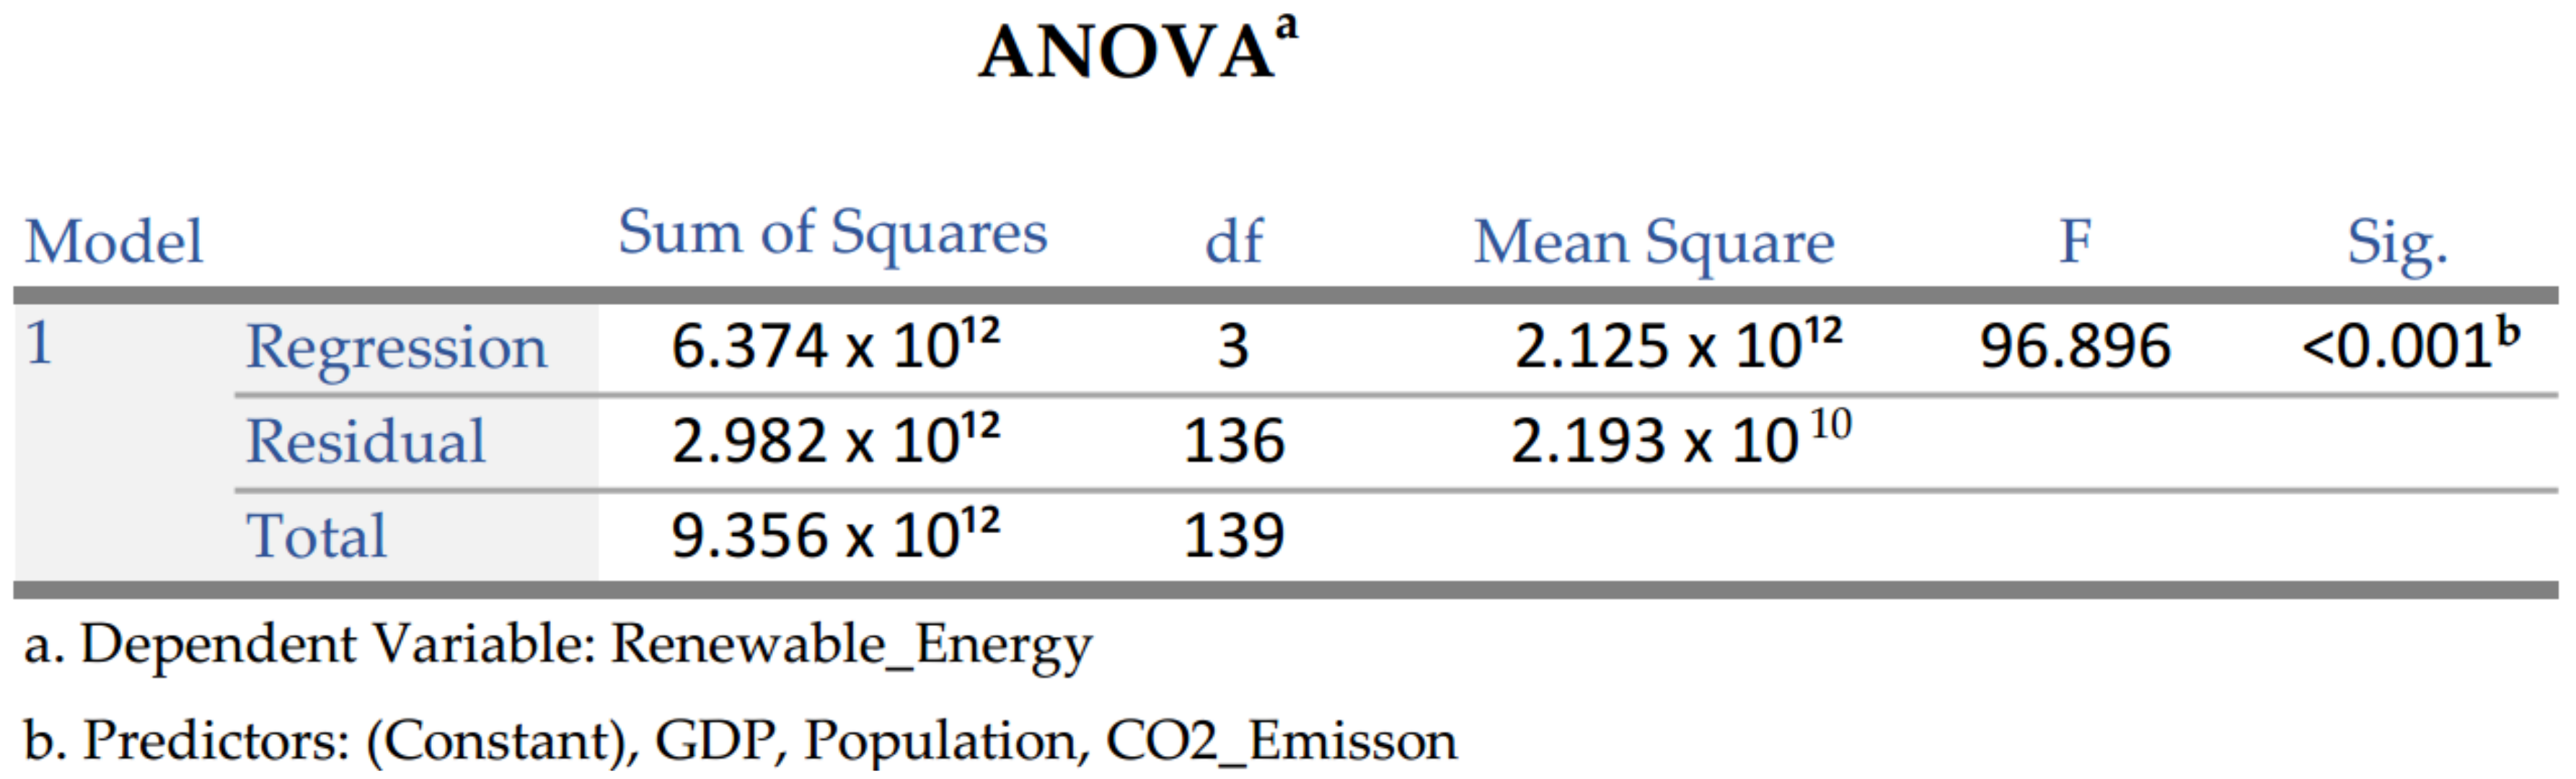
The increase in energy demand has resulted in a large exploration of energy alternatives, as non-renewable sources have reigned for a long time. Climate change and other environmental impacts, to which the emissions from fossil fuels are widely recognized as key contributors [15], make for a great concern in the 21st century. The exploration of non-renewable sources, such as fossil fuels, has contributed to a range of environmental impacts, and also to foreign dependency at times [16]. On that note, on the one hand, increasing energy efficiency of equipment and processes can help reduce impacts [17]. However, on the other hand, it can be argued that this might lead to greater consumption as a rebound effect. Switching to renewable sources has been signaled as a better alternative, as the emissions resulting from electricity generation can be brought down when transitioning to them [3], and this type of energy is considered to be an opportunity for such changes [18].
The transition to a climate-neutral economy by 2050 is an urgent necessity [19], therefore, agreements within the international community seeking to reduce GHG emissions [20] have forced governments to begin initiatives to produce electricity from renewable sources [21] and also several locations in the European Union [22], although differences, geographical location, country size, political circumstances, and a number of other factors need to be considered to migrate from non-renewable sources to renewable ones [23].
Ambitious goals aiming to increase the share of renewables in the energy mix have been set by a range of nations [24], both in the search for greater energy security and to ensure energy supply [25]. The European Union, for instance, in its 2050 roadmap, signaled a sustainable future achieved by means of energy from renewable sources and progressive service electrification [26], which challenges the current system of power grids that only work if under balanced demand and supply [25]. Moreover, it has been noted that renewable electricity generation positively impacts economic growth [16], however, financial incentive policies as well as democratic governance are needed for effective renewable energy aids [27].
Each type of renewable source is distinguished by its uniqueness of the physical specificity and differences in technological solutions [28]. The potential of renewable energy is greater than that of non-renewable energy [29], but currently renewable energy sources provide only approximately 15–20% of the energy demand worldwide, even though all renewable energy sources (including solar energy, eolian, hydropower, biomass, geothermal energy, and wave-tidal energy) provide 3078 times the current global energy needs [16]. The renewable sources (i.e., the feedstock) that can be used to produce electricity range from solar (through thermal, photo-chemical, and photo-electric means) to hydropower, wind, geothermal, tidal power, and biomass. The installed capacity of renewable electricity has been showing an increasing worldwide trend since 1990, because it is permanent and reduce or even eliminate the dependency on foreign supply [30], and the installed capacity to take advantage of all of these potential sources (solar, hydro, biomass, geothermal, and wave-tidal) will increase by 2050 [16]. While electricity from hydropower has been reckoned as the most efficient among the renewable sources and registering negligible GHG emissions, solar and wind are becoming increasingly significant contributors but are still dependent on (and limited by) the level of technology readiness (i.e., efficiency of the existing technology) and the intermittent nature of these sources [21].
In that regard, investing in only one or a couple of sources might not be enough or even wise both for the environment and for the economy. Diversifying the renewable sources for generating electricity is an adaptation mechanism driven by climate change conditions, and it can help minimize fluctuations in energy supply [31]. Nevertheless, the volume of energy to be produced in a given area depends on (and is limited to) the capacity of the transmission network of that respective area [32], and therefore adequate transmission/distribution networks also need to be accounted for. On that account, much research has been conducted worldwide, seeking to assess the potential of different sources for generating renewable electricity.
[33] show that even waste can become a renewable source of electricity, under a circular economy concept. The authors report that in the water and wastewater treatment industry, in Australia, the use of waste in the wastewater to be treated can be used to produce biogas and subsequently, electricity. However, the potential for such use is still untapped. In 2018, 18% (279 GWh/y) of the electricity demand of the Australian water industry was generated from on-site renewable sources, where the most representative were biogas from anaerobic digestion of wastewater and sewage sludge (67%) and hydropower (30%). Furthermore, [34] show that there are waste-to-energy pathways that can contribute to reducing the amount of waste to be disposed of while helping meet energy needs.
Reference [35] presented an assessment of the potential of solar rooftop photovoltaics using big data machine learning and geospatial analysis. Their results showed that the cost of attaining the potential is lowest in India (66$MWh−1) and China (68$MWh−1), with the USA (238$MWh−1) and UK (251$MWh−1) representing some of the costliest countries. Moreover, [36] investigated the spatial–temporal heterogeneity and dynamic evolution mechanism of renewable electricity penetration using the data of the European Union (EU) during 2001–2017.
Rooftop solar photovoltaics currently account for 40% of the global solar photovoltaics installed capacity [35], and the remainder represents solar thermal heating and water heating, off-grid solar energy system, hybrid solar energy system, and others. In the case of wind turbines, currently they provide approximately 6–7% of the global electricity supply [37]. Denmark, for instance, has achieved remarkable success in renewable energy development over the last several decades, since the country mostly depends on wind energy [38], with 48% of its energy mix being from wind, [39]. Moreover, in the US, California is a state recognized for its innovative energy policy, mainly for the adoption of large amounts of solar panels in recent years [40]. Also in the US, [41] used life cycle assessment and revealed that deployment of renewable electricity generation devices to off-grid remote locations for electricity generation can have the same, or less, environmental impact as urban grid systems.
In fact, many studies and many researchers have followed a unique path in energy generation—to be clean and/or renewable. Although many sources are considered renewable, it might vary depending on the control of use and renewability of their generation and availability. Therefore, the transition to a cleaner world seeking carbon neutrality is urgent.

3. Methods and Data

To meet the proposed research objective, the procedures of the present research were divided into 4 phases, as shown in Figure 1.
PHASE 1—Review of the literature
The first phase comprised a literature review in order to identify previous studies on the topic. Searches were conducted in the Scopus and Web of Science databases on November 22, 2021, using the following keywords: Energy Supply; Generation of Renewable Electricity, and Renewable Electricity. Results were sorted by document type (article) and language (English). Duplicate articles were then eliminated, resulting in 91 documents. These were assessed by reading titles and abstracts, resulting in 27 articles that contributed to the elaboration of the theoretical foundation and complemented the discussion of results. As not all G20 countries featured in the studies from the literature search, the authors used cross-referencing from a snowballing approach based on the articles in the final portfolio. Nonetheless, when no study on renewable electricity was identified in a given G20 country, complementary searches were conducted on the Google Scholar database, considering the keywords “renewable electricity” and the name of the country under analysis.
PHASE 2—Data collection and processing
The main analysis of this study focused on the renewable electricity production of the G20 countries. Therefore, data were collected from the electric energy matrices of the G20 members: Argentina, Australia, Brazil, Canada, China, France, Germany, Japan, India, Indonesia, Italy, Mexico, Russia, South Africa, Saudi Arabia, South Korea, Turkey, the United Kingdom, the United States, and the European Union [42].
The data were collected on the website of the International Energy Agency—IEA [43], presenting solid information on electricity, as it is composed of 30 member countries and other associates who help in this compilation of available information. Furthermore, using data from the same source generates value and robustness, enabling comparisons between countries and years, in addition to greater reliability, given the standardization of data.
The IEA presents data in GWh of electricity for all countries in the world, as well as for continents and economic groups. Thus, the data of each member of the G20 was individually accessed, seeking the composition of the electrical matrix in the indicators called “Energy Supply and Electricity Generation by Source”. Data covering the years between 1990 and 2020 were collected, aiming at a temporal comparison and making it possible to identify the existence of trends in this period.
The electricity production of a country is directly related to its demand, therefore, the population indicator can be considered an influencing factor in the production of electricity. Furthermore, the use of electricity from renewable energy sources contributes to the reduction of CO2 emissions, which is one of the biggest factors responsible for the aggravation of the greenhouse effect. Thus, it is in the interest of both private organizations and especially governments to invest and encourage investments in renewable energy sources [28]. Thus, another influential indicator in the generation of renewable electricity is the GDP, based on the premise that richer and more developed countries, compared to poorer countries, are more concerned with the environment and can invest more heavily in sustainable energy sources [28]. Thus, to deepen the analysis, the variables Population, Gross Domestic Product, and CO2 emissions were included.
The population value of each country was determined according to the United Nations [44]. Regarding the population of the European Union, a survey was carried out of all its member countries according to the date of entry and exit of each one in the group, according to information from the European Union [45].
The World Bank website was used to collect the values (in current US$) referring to the Gross Domestic Product (GDP) [46]. The values corresponding to CO2 emissions (in Mt) were collected from the IEA. It is worth mentioning that the analysis related to CO2 emissions was considered until the year 2019, since in 2020 data from all G20 countries were not available.
PHASE 3—Analysis and discussion of results
The data were compiled using Excel and the main analysis focused on the share of each renewable electricity source in gross electricity production, which can be written as follows:
X t = E S t × 100 % / G E S t
where:
  • Xt—percent participation of the type of electricity in the total production of the electricity matrix of the country for the period t;
  • ESt (Electricity Supply)—amount of production of each type of electricity in the country in period t, (GWh);
and
  • GESt (General Electricity Supply)—total amount of electricity produced in the country for the period t (GWh).
The analysis was performed for each type of electricity in relation to the total production of the matrix in each country in the years analyzed. The total percentage of the electricity matrix that comes from renewable sources was also identified. The total amount produced from each source of electricity in each country was also considered in relation to the total produced by the G20. In the analysis considering the G20 data, the values corresponding to Italy, France, and Germany were subtracted, as they were already included in the European Union data, thus avoiding double counting.
Finally, IBM SPSS Statistics 28.0 was used to identify the influence that the variables population, CO2 emission, and GDP have on the production of renewable electricity, and for this purpose, a multiple regression was performed. The main goal was to check which of the independent variables had greater influence on the dependent variable. The assumptions of linearity between variables, homogeneity of variances, and absence of multicollinearity were verified in order to perform the regression. After performing the regression, it was possible to identify how variables influence the production of renewable electricity and which one was the most relevant.
As CO2 emissions data for all G20 countries in the year 2020 were not available in the IEA, the period from 1990 to 2019 was considered in the CO2 emissions analysis and in the statistical analysis.
PHASE 4—Final conclusions
From the analysis of the results, it was possible to determine the final conclusions of the article, identifying the highlights and, consequently, responding to the proposed research objective.

4. Analysis and Discussion

This section presents, in addition to the analysis of the individual renewable electricity production of each G20 country, the population, GDP, and CO2 emission indicators, in order to identify which ones have an influence on the production of renewable electricity in the G20.

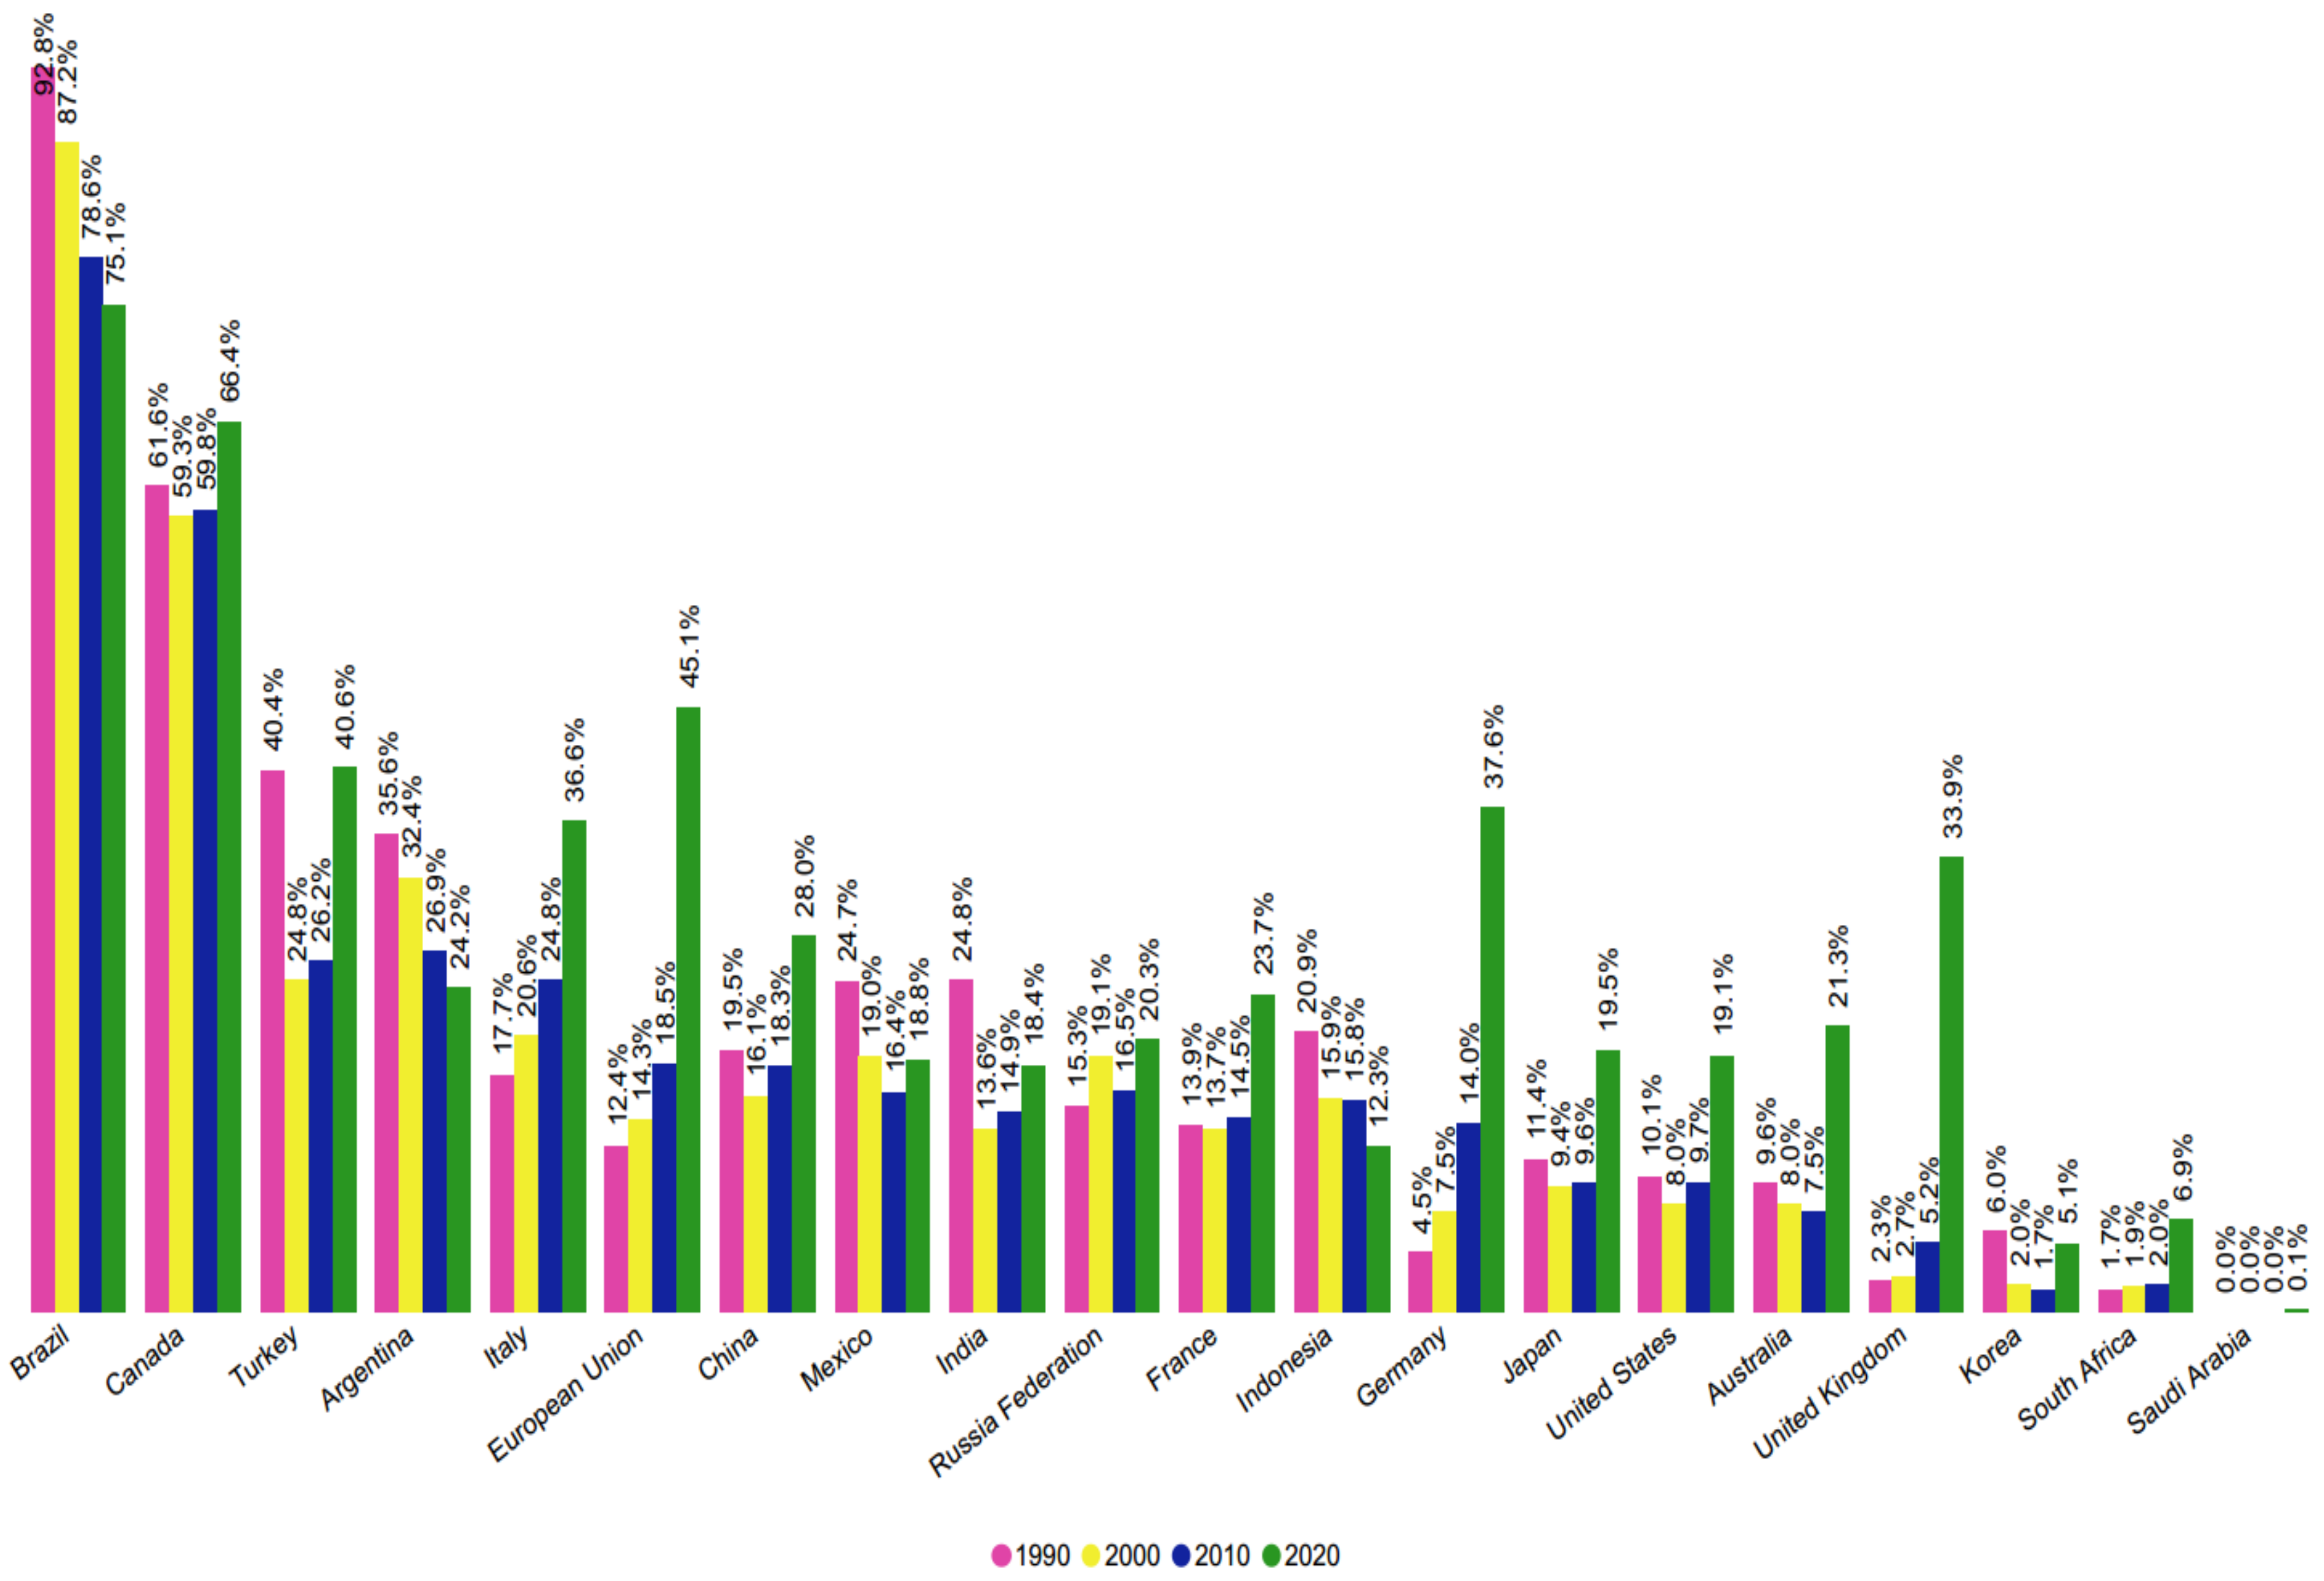
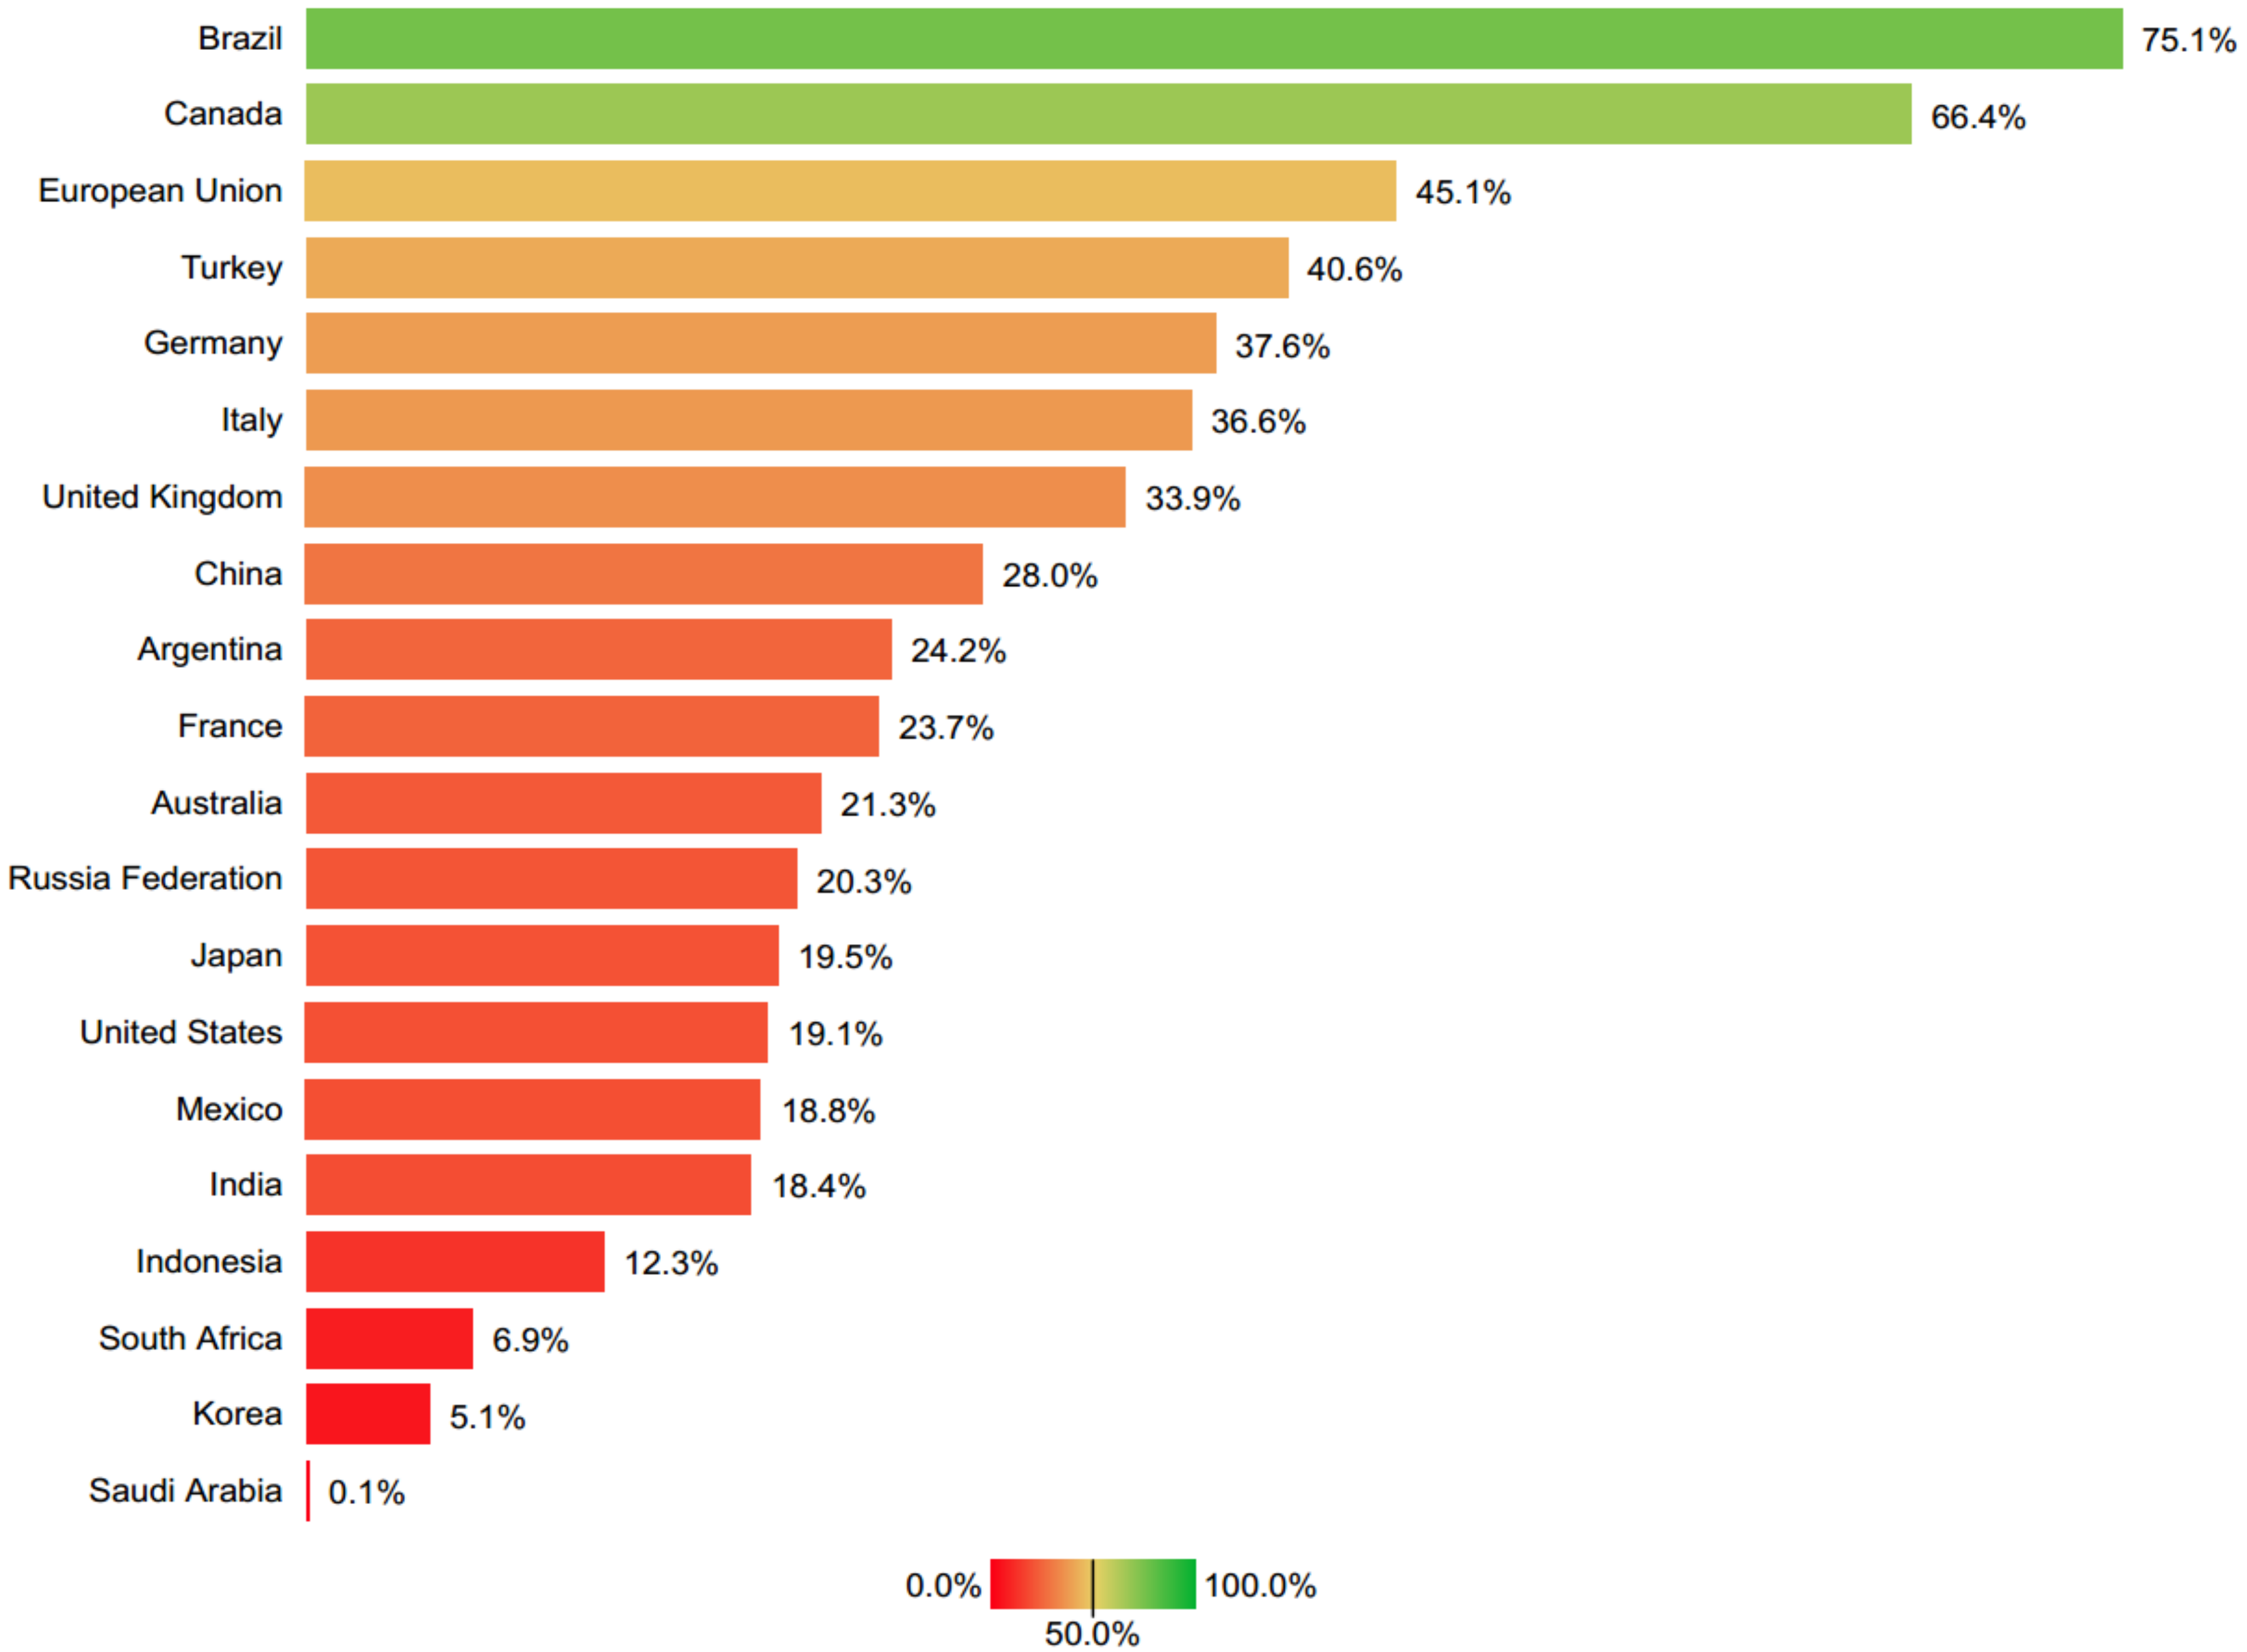
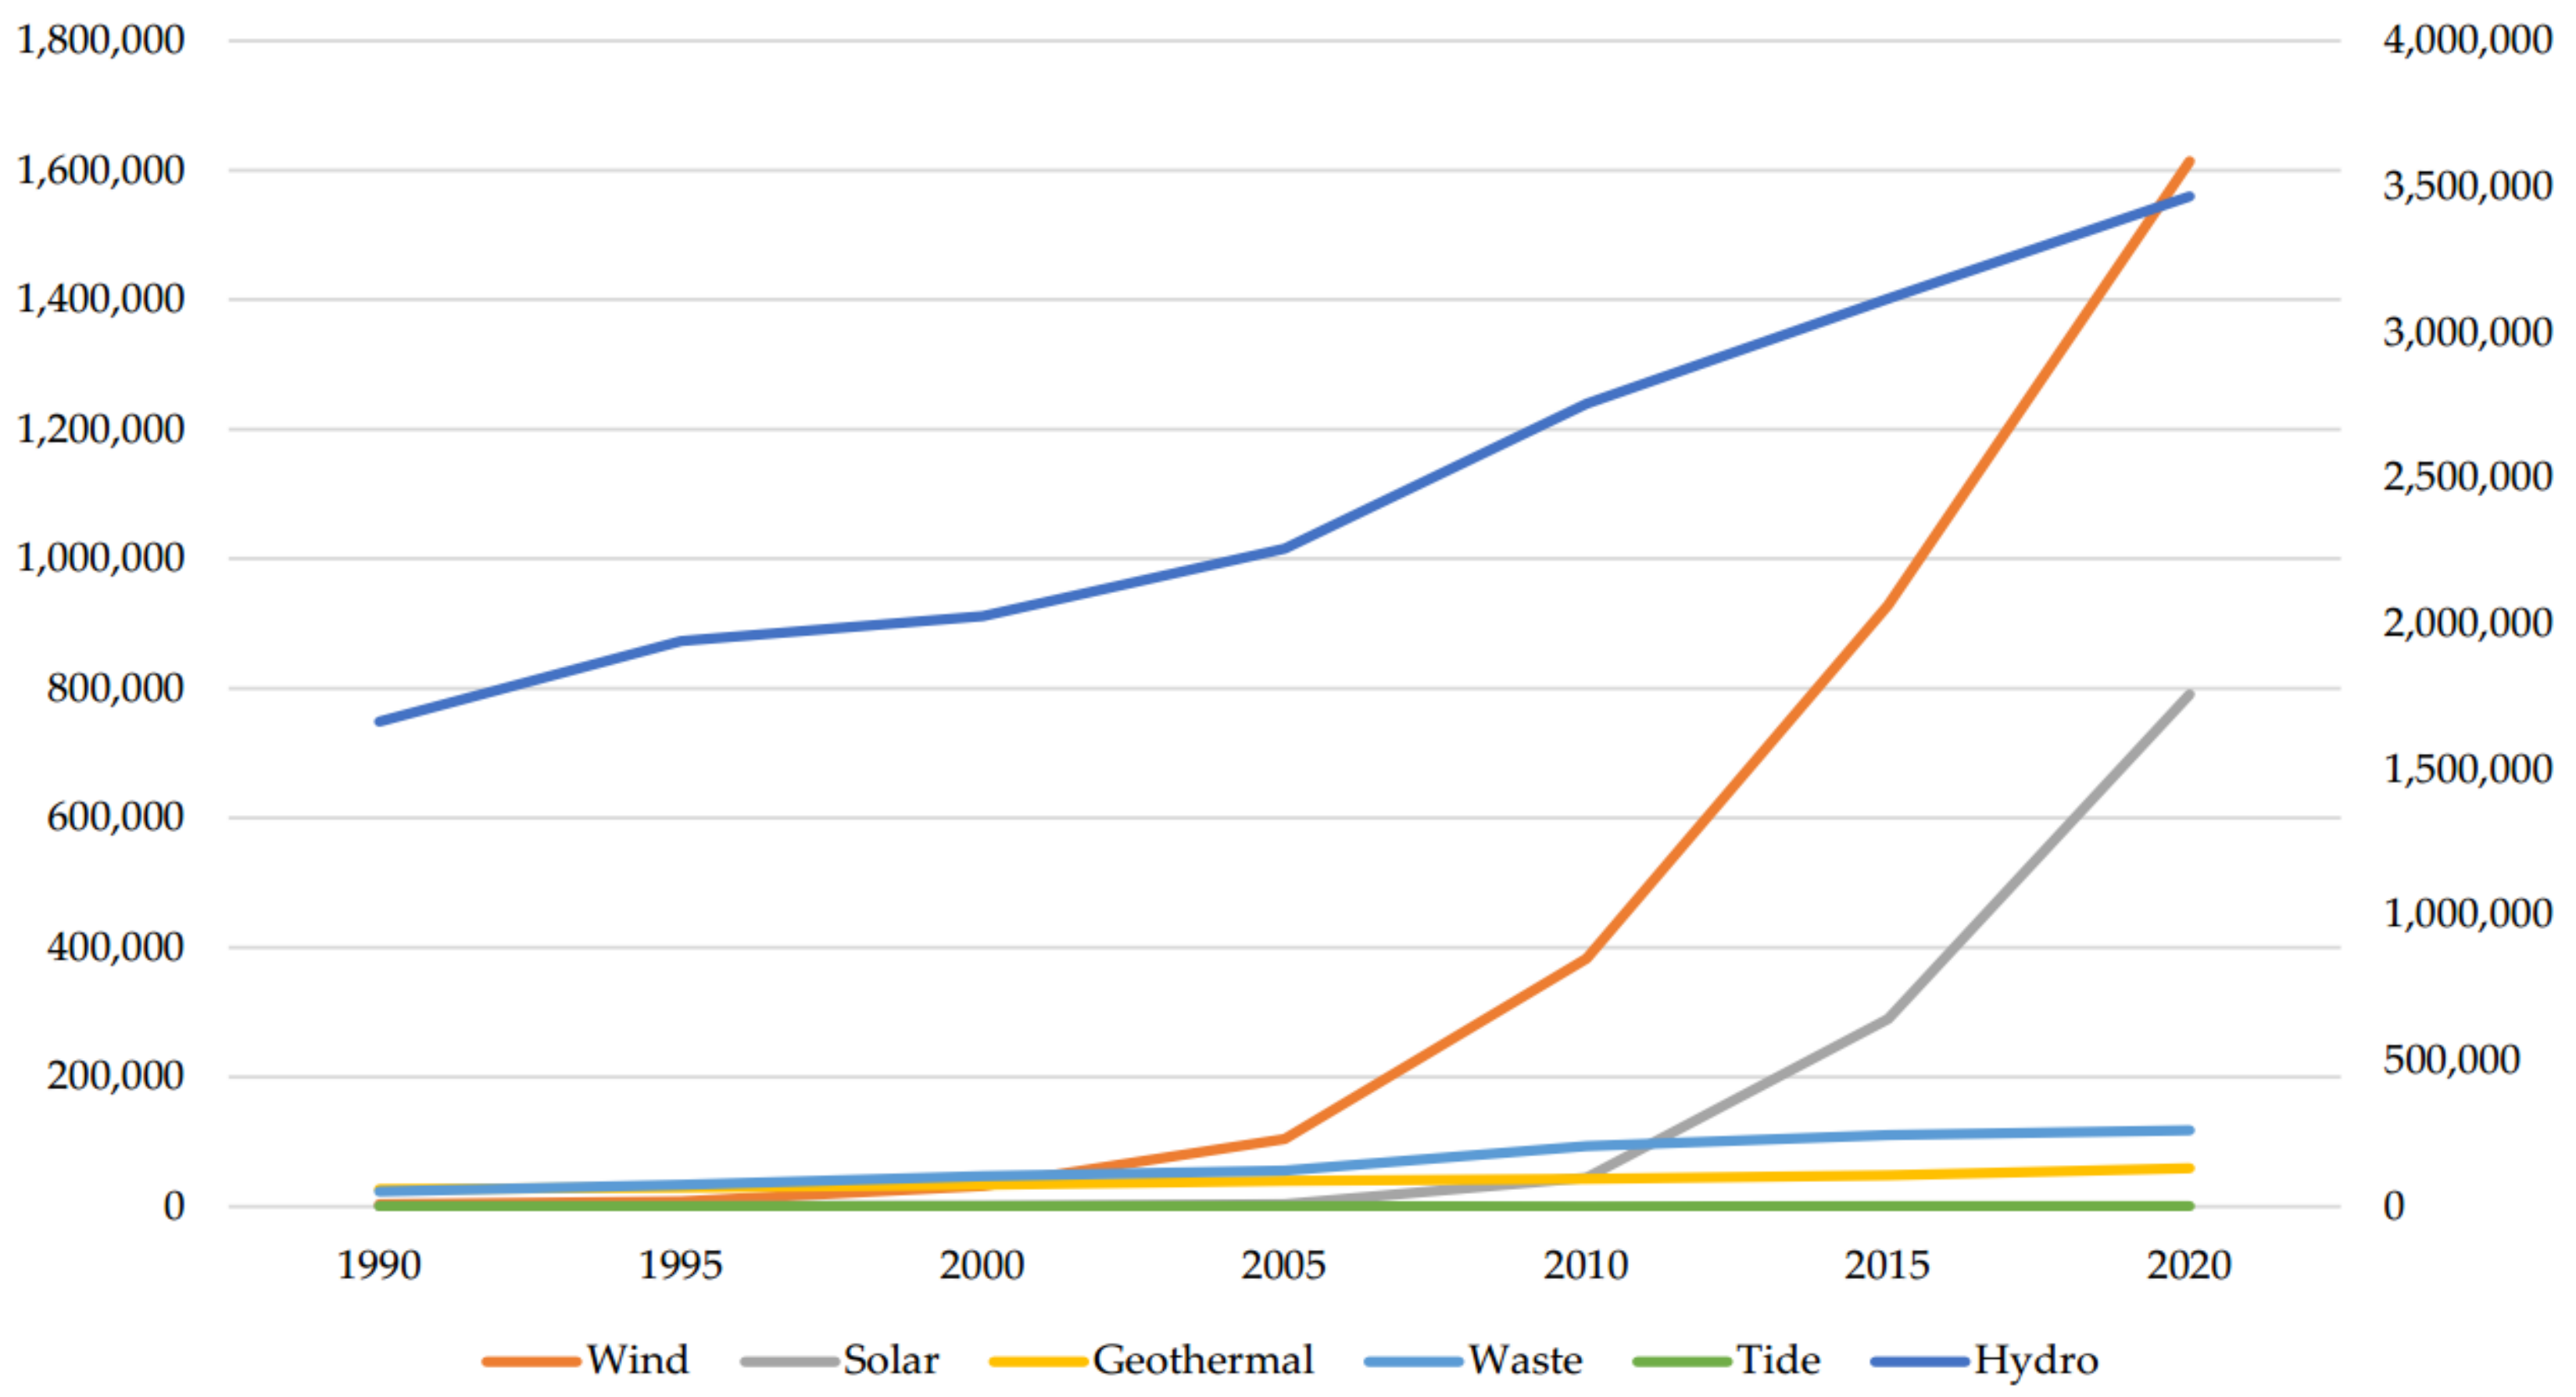
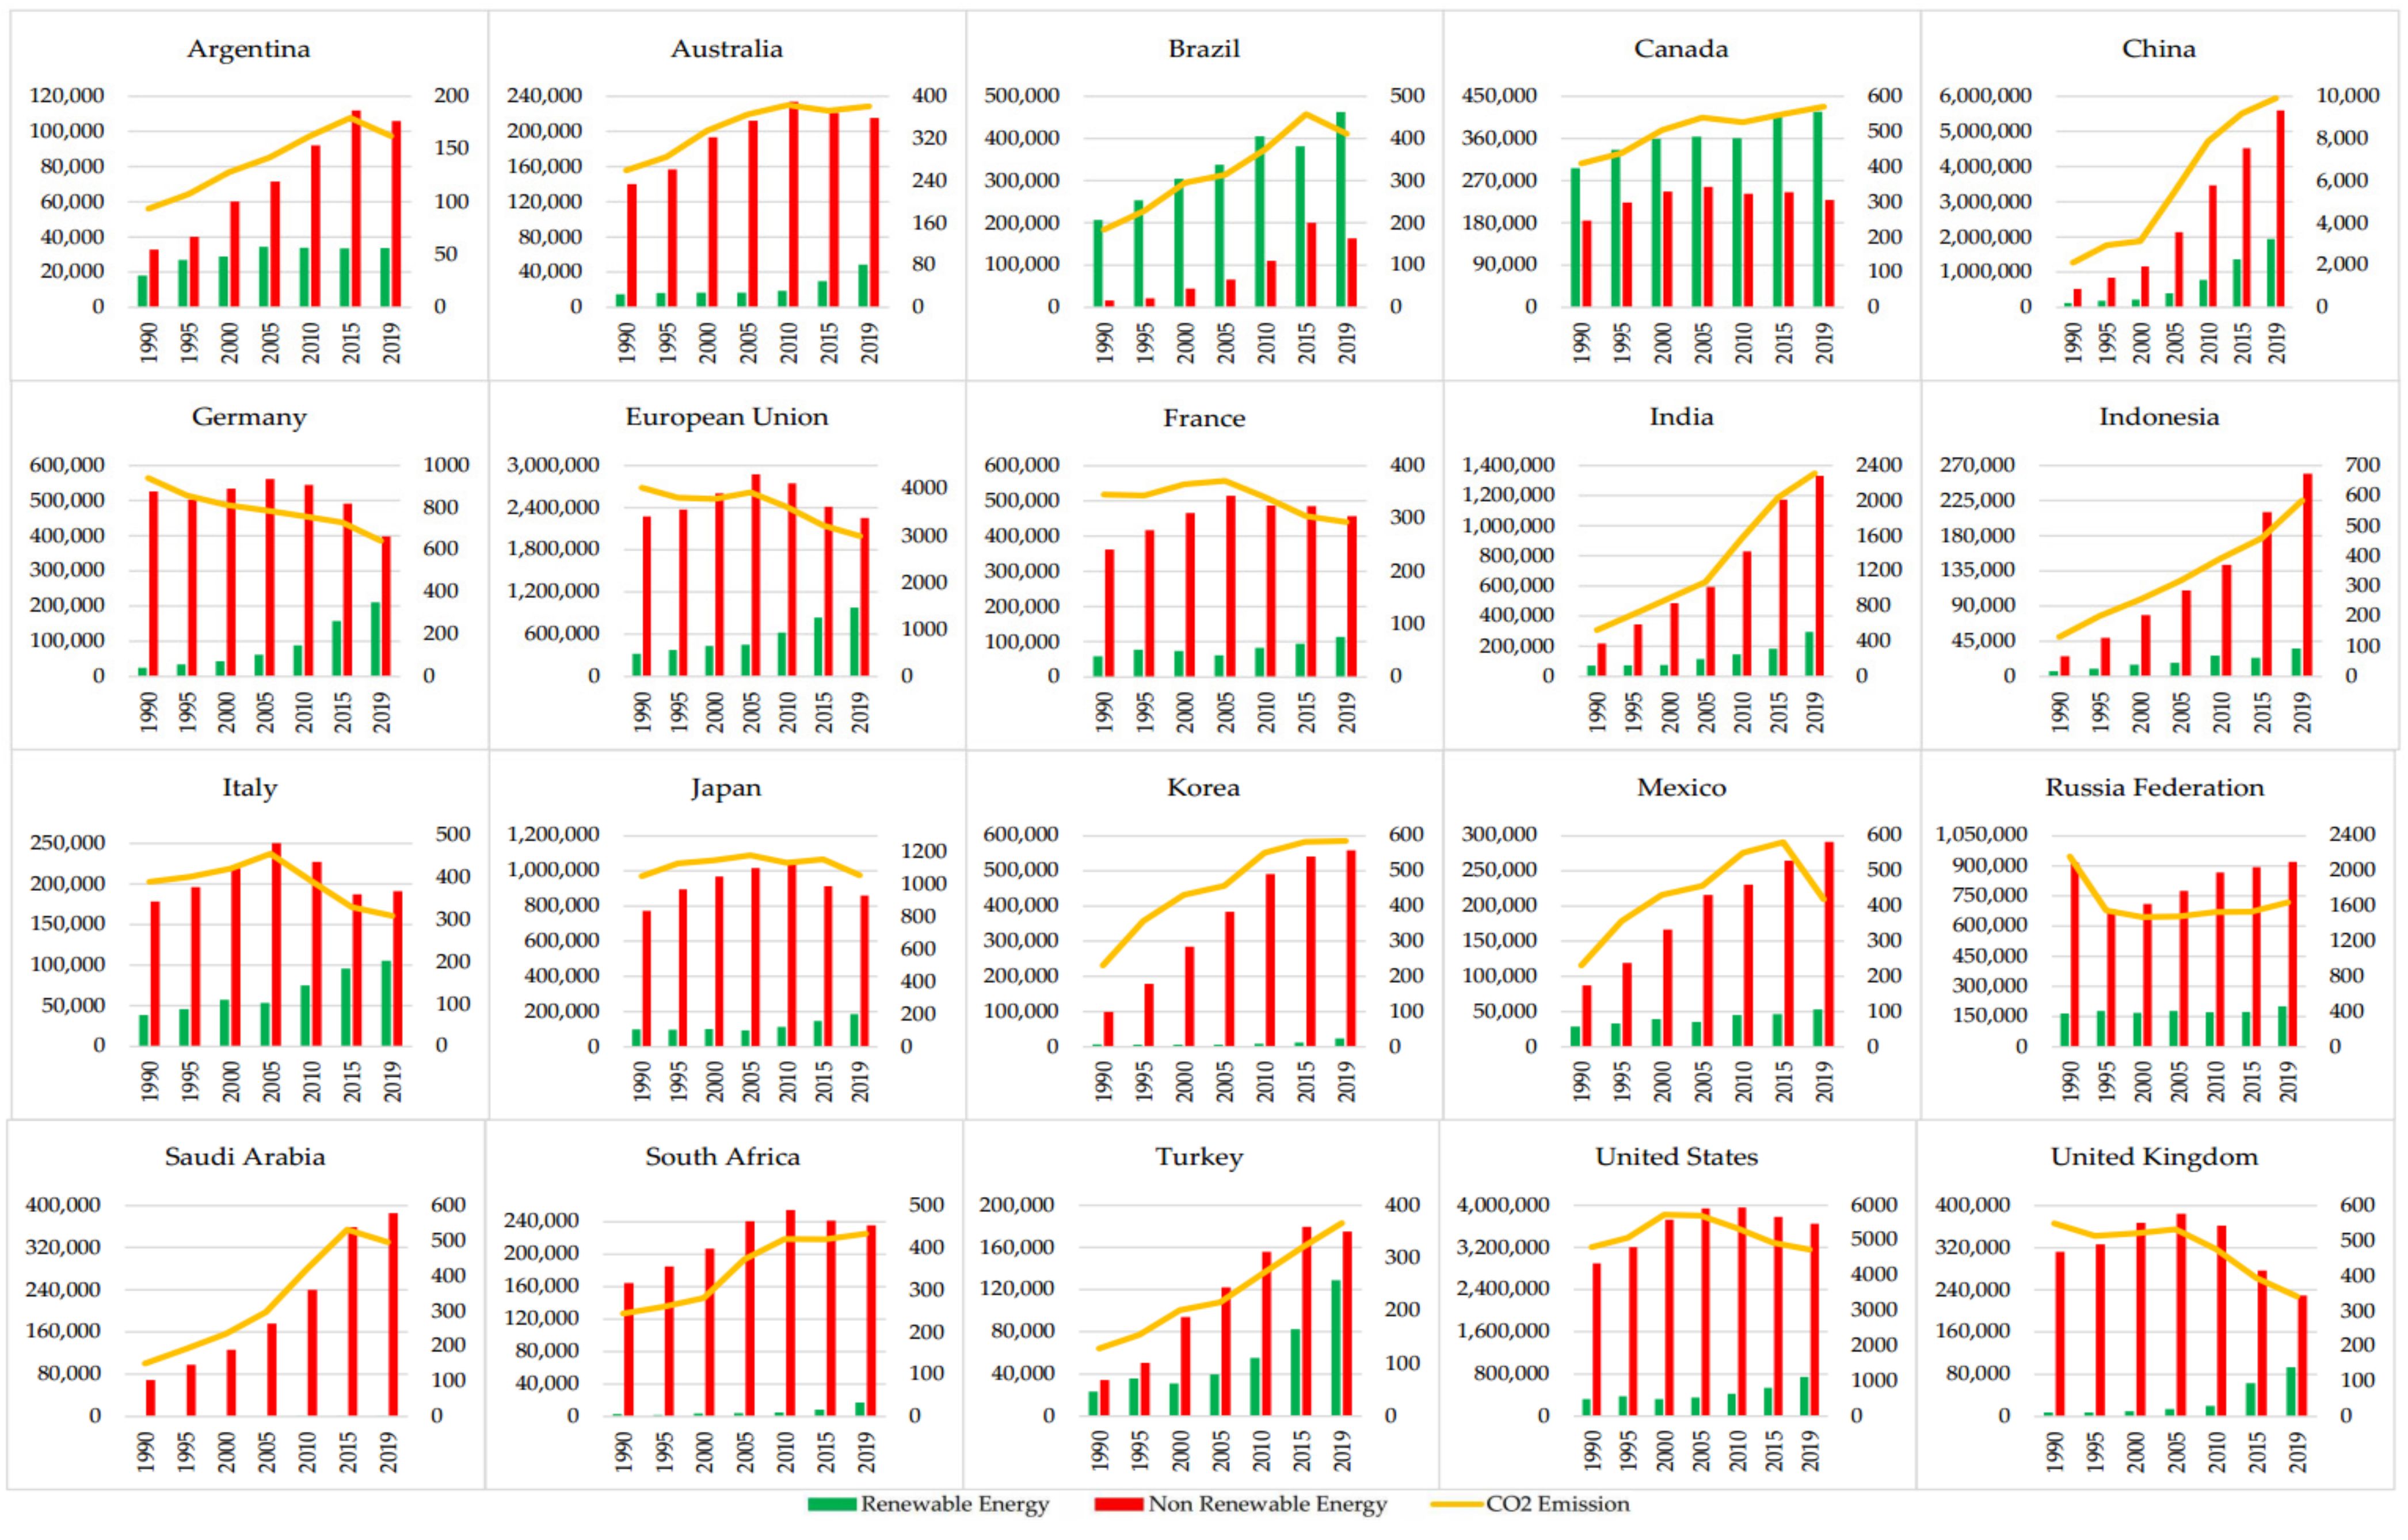
4.1. Analysis and Discussion of G20 Contributions to Renewable Electricity Generation

As a result of this analysis, according to the IEAs and data described in the methodology of this paper, this section presents the percentages of renewable electricity generation in the G20 countries, a ranking of countries from greatest to smallest contribution of renewable sources in the country’s electricity generation, and a description of each individual nation.
In 2020, only six countries had a renewable percentage in their electricity matrix lower than in 1990, namely Brazil, Argentina, Mexico, India, Indonesia, and Korea (see Figure 2). Brazil, despite showing the greatest reduction (17.7%), remained in first place in the composition of renewable electricity generation among all G20 countries. One of the smallest efforts to generate renewable electricity is in Saudi Arabia. The country did not have any source of renewable electricity in 1990, with a participation of only 0.1% of renewable sources in 2020. In addition, Mexico, India, and Korea, even with lower production of renewable electricity, compared to 1990, showed growth when compared to 2010. In this sense, Figure 2 shows the amount (in percentage) of renewable electricity generation in the G20 countries between 1990 and 2020.
The countries that stood out in terms of percentage increase in the participation of renewable sources in their electricity matrix between 1990 and 2020 were Italy (18.9%) and Germany (33.1%), both belonging to the European Union, which increased electricity generation renewable by 32.7%. In addition to these, the United Kingdom showed a considerable growth of 31.6%.
From the data in Figure 1, it is possible to obtain the ranking of countries regarding the renewable percentage in their electricity matrix in 2020 (Figure 3). Thereafter, a description of each individual nation presenting the main sources and historical data is presented.
Among the G20 countries in 2020, Brazil was the one with the most renewable electricity matrix, with 75.1%; of this, 63.8% came from hydroelectric plants, 9.18% from wind, 1.73% from solar, and 0.37% from waste electricity. Thus, this follows a trend that has been observed for a very long time, since the electricity mix in Brazil is heavily influenced by renewable sources, especially hydropower [31]. Although the renewable percentage is considerable and prominent among the G20 countries, this value has decreased in relation to 1990, when renewable production corresponded to 92.8% of the matrix—this value comes entirely from hydroelectric plants. Even though the country has reduced the proportion of renewable electricity within its matrix over the years, there was the inclusion of new renewable types, such as wind, solar, and energy generation from waste. Even though discrete, there are data on the start of wind electricity production from 2005 with 93 GWh, increasing to 57,051 GWh in 2020.
Electricity from solar sources presented a mild 59 GWh in 2015, increasing to 10,750 GWh in 2020. As the predominance of electricity comes from hydroelectric plants, periods of drought can justify possible fluctuations in its production, which reinforces the country’s need to diversify its production by investing in other renewable sources. Besides that, as the climate in the region is dependent on a series of conditions such as atmospheric pressure, air temperature, and humidity [47], solar power, for instance, can be affected by cloudiness and other factors [31,32,33,34,35,36,37,38,39,40,41,42,43,44,45,46,47,48]. Nonetheless, despite the concern with climate change issues, there have been efforts towards diversifying the sources of renewable energy [49]. Moreover, the study of [31], focusing on the northeastern region of the country, points to a decrease in the annual amount of energy from small hydropower plants due to prioritizing the supply of water to the population and for irrigation purposes, whereas an opportunity has been noted for the exploration of solar power. Furthermore, the same potential for electricity generation from solar power has been observed in the southern region of the country [50].
Canada, in 1990, had 61.6% of renewable composition in the electrical matrix, having an increase of only 4.8% in 3 decades. Of the 66.4% of renewable electricity in 2020, the predominance is hydroelectric (60.03%), in addition to modest wind (5.63%), solar (0.67%), and waste (0.05%) production. A certain stability in renewable production between 1990 and 2010 is remarkable, with a more notable increase in 2020. The increase is justified by the reduction in production from coal (17.1% in 1990 to 4.9% in 2020) and oil (3.4% in 1990 to 0.8% in 2020), in addition to the inclusion and growth of new renewable sources such as wind and solar. Despite this, it is worth mentioning the increase in the use of natural gas (2% in 1990 to 11.1% in 2020). Despite being constant over the last 3 decades, another point of relevance is production from nuclear power plants, representing 15.3% in 2020. [51] show that the 1% increase in renewable energy consumption in Canada reduces CO2 emission by 0.061%. In addition, the use of renewable sources combined with nuclear increases this proportion, because even the nuclear source is not considered renewable; it is classified as clean energy due to the non-emission of greenhouse gases, thus making it another option for reducing other polluting sources.
The European Union ranks third among the G20 members, with 45.1% of renewable composition in the electricity matrix in 2020. This share increased considerably compared to 1990, when it was 12.4%, coming mainly from hydroelectric plants (11, 9%). Other renewable sources, even with lower production, were already present, e.g., waste (0.3%), geothermal (0.12%), wind (0.03%), and tide (0.02%). In 2020, these percentages increased: hydroelectric plants were responsible for 16.08% of electricity generation; wind stood out as the main renewable source with 19.94%, while solar accounted for 6.67% of the matrix. Residues increased to 2.11%, but geothermal and tides remained below 1% each, at 0.28% and 0.02% respectively. The European Union is a group made up of 27 countries, of which Italy, Germany, and France also participate individually in the G20. Thus, the data analyzed from the European Union correspond to the sum of the production of renewable electricity in the 27 countries. Although the renewable energy sources in the EU have essential meaning in the position of innovations [52], the Group is not at the top of the ranking of members of the G20 for renewable sources.
Turkey ranks fourth in the composition of renewable electricity in its matrix, according to Figure 3. In 1990, the participation of renewable sources was 40.4%, mainly from hydroelectric plants (40.23%) and a small share of geothermal (0.14%). In 2020, renewable production remained practically the same (40.6%), but other renewable sources were included. In addition to hydroelectric (25.58%) and geothermal (3.25%), the country produced electricity from wind (8.09%), solar (3.69%), and waste (0.01%) sources. However, the study of [53] predicted that the share of hydropower in the electricity mix will decrease until 2030 due to Turkey facing extreme water stress in the coming years [54], and thus it is recommended that the Turkish government incentivize the increase of other renewable sources. Even with a considerable renewable production and diversification of production over the years, Turkey produces a relevant percentage of electricity from coal, corresponding to 34.79% in 2020. This reinforces the need to improve renewable production in order to reduce the consumption of coal, which, in addition to being non-renewable, is highly polluting due to the high emission of methane.
Next, Germany has an electrical matrix with a non-renewable predominance (62.4%). Data indicate that in 1990, only 4.5% of electricity production was from renewable sources (hydro, wind, and waste), thus showing the country’s investments in renewable diversification over the last 3 decades. In 2020, electricity from wind sources stands out with 22.5%, followed by solar 8.69%, hydroelectric 4.27%, waste 2.13%, and geothermal, with 0.04%. However, the German government has set climate policies and ambitious energy targets; by 2050, the country must reduce GHG emissions by 80% (compared to 1990 levels), and 80% of electricity must be supplied by renewable sources [55]. Nevertheless, currently the predominance of electricity production is similar to Turkey, as coal is the biggest contributor in the matrix with 25.46%, which is a negative factor when it comes to renewable diversification.
Also part of the European Union, Italy occupies the sixth position in the ranking of the most renewable countries of the G20, with a total of 36.6% of the renewable electricity matrix, divided into 17.25% hydroelectric, 8.86% solar, 6.64% wind, 2.14% geothermal, and 1.72% waste. A considerable renewable diversity compared to 1990 when production was 17.7% generated only by hydroelectric and geothermal. Furthermore, compared to non-renewable, renewable production grew 2.68 times in this period, which practically maintained the number of GWh produced. It also reduced coal production by approximately half: 35,762 GWh in 1990 to 13,064 GWh in 2020. Oil-derived production had an even more significant reduction, from 102,719 GWh in 1990 to 9771 GWh in 2020. However, the country comprises its largest production from natural gas, which was 48.9% in 2020 and only 18.33% in 1990; it is a necessary for reflection as this is not a source of renewable electricity. [56] estimate, based on the optimization of capacity expansion, that by 2050, it will be possible to generate more than 80% of electricity from renewable sources, without considering CO2 reduction incentives. If there are incentives aimed at reducing CO2, the estimate reaches 90%. This is mainly because the cost of renewable technologies tends to reduce over the years, favoring the estimated expansions.
The United Kingdom is in 7th position with 33.9% of renewable production in its electricity matrix. In 1990, the matrix was predominantly non-renewable (97.7%, as there was only a small presence of hydroelectric plants (2.25%) and waste (0.07%). Even with the proportion coming from hydroelectric plants remaining stable, the renewable scenario presents positive changes over 3 decades. The eolic participation has been gaining prominence [57], representing 24.18% of the electricity mix in 2020, followed by solar energy (4.09%), waste (3.15%), and hydroelectric (2.52%). In addition, coal was the predominant source in the territory’s electricity matrix until 2019; in 2020, it represented only 1.98%, with natural gas being the largest generator with 36.49%. This demonstrates that investment in new, less-polluting sources raises positive expectations for the country in terms of reducing the use of non-renewable resources in the future.
In 8th place, China stands out in the increase of renewable production, with about 126,788 Gwh in 1990 and 2,087,603 GWh in 2020, with a considerable 1546.53% increase. However, non-renewable production also increased from 536,418 GWh to 5,379,240 GWh, growing 927.71%. Thus, in 2020, electricity from renewable sources accounted for 28% of the matrix coming from hydroelectric plants (18%), wind (6.3%), solar (3.6%), and waste (0.1%), with the predominant amount of electricity coming from a non-renewable source, coal (67.16%). In 2018, China produced 366 TWh from wind energy, 177.5 TWh from solar energy, and 90.7 TWh from other renewable sources [58].
The other G20 countries had a renewable composition in the electricity matrix below 25% in 2020. Argentina, in 9th position, had 24.2%, with hydropower being the main source (16.74%), followed by wind (6.49%) and solar (0.93%). This shows the need for investments to diversify renewable sources and increase the production of those already used, because in terms of GWh produced in the last 3 decades, renewable production grew by 93.05% while production from non-renewable sources had a growth of 234.32%. The energy sector of Argentina is predominantly reliant on fossil fuels, therewith, it has aggravated the environmental quality by amplifying the nation’s energy production-based carbon emission levels [59].
The French electricity mix, which is represented by low carbon intensity owing to the dominance of nuclear energy and hydroelectricity, is also unique in the EU [60]. In 2020, France produced 23.7% of its electricity from renewable sources. The largest production comes from hydroelectric plants (12.53%), with wind (7.64%), solar (2.55%), waste (0.84%) and, to a lesser extent, tidal sources (0.09%) and geothermal (0.02%). However, the country predominantly generates energy from a nuclear source (66.46%).
In 11th position is Australia, which increased its renewable production from 9.6% in 1990 to 21.3% in 2020. In 1990, the source was predominantly hydroelectric, but in 2020 the highest contribution was from solar power (7.9%), followed by wind (7.7%) and hydroelectric (5.7%). However, the predominance is non-renewable, coming from coal (54.88%) and natural gas (20.82%). Nevertheless, it is noteworthy that renewable production had an increase of 280.2% when compared to non-renewable (48.85%) in the last 3 decades. Historically, electricity markets were designed to transport electricity from large, decentralized power stations to the cities and centers of energy demand [11], and solar PV has been the main new source of renewable electricity since 2013 [61]. Thus, the country has targeted efforts, but still has other unexplored sources that can help reduce the use of non-renewable electricity, such as investing in energy from waste.
Next in the ranking is Russia, which presents 20.3% of electricity generation from renewable sources, mainly from hydroelectric plants (19.74%), with the presence of other sources, such as waste (0.27%), solar (0.17%), wind (0.1%), and geothermal (0.04%) being incipient. Despite this, the generation in GWh from non-renewable sources had a reduction of 5.6% between 1990 and 2020, while renewable sources went from 165,945 GWh in 1990 to 220,605 GWh in 2020, an increase of 32.9%. To help increase the participation of renewable energy in their national mix, the Russian government has introduced an auction system (by Decree No. 449) [62], where projects with an installed capacity greater than 5 MW can enter the tender annually and aims to secure 5.9 GW of additional capacity by renewables by 2024 [63].
Japan occupies the 13th position in the production of renewable electricity in the G20, with 19.5%, an increase of 8.1% compared to 1990. The main renewable productions are from hydroelectric sources (8.6%) and solar (7.6%). However, the country still produces electricity mainly from coal (30.39%) and natural gas (37.73%). Considered one of the largest energy importers in the world, approximately 96% of the primary energy supply at the national level, the need for Japan to invest in renewable energies is reinforced, in order to reduce the use of polluting sources. In addition, after the Fukushima accident in 2011, the country has a goal of reducing the use of nuclear energy by 2030, which is possible given the variety of renewable resources that the country has, and it depends on the Japanese government to stimulate the development of available renewable sources [64].
With similar proportions in renewable energy production, Japan, the United States, and Mexico occupy the 13th, 14th, and 15th positions, with shares of 19.5%, 19.1%, and 18.8%, respectively. Renewable production is given mainly by hydroelectric, solar, and wind sources, but the predominance is non-renewable from natural gas. In addition, coal is still used considerably in Japan (30.39%) and the United States (20.03%), and the latter also has significant production from a nuclear source (19.36%). Innovation has played a key role in solar and wind expansion in the US [65] and in Japan [64].
Though a majority of the Indian population does not have access to convenient energy services [66], the country has made significant progress in renewable energy in the last few years [67]. In this sense, India has a predominantly non-renewable electricity matrix, with coal being the prominent source, reaching 72.46% in 2020. From a renewable perspective, the matrix presents 18.4% of electricity produced by hydroelectric plants (10.4%), wind (4.11%), solar (3.81%), and waste (0.1%).
Countries such as Indonesia, South Africa, Korea, and Saudi Arabia have the smallest participation of renewable sources in their electricity matrix. In 2020, Indonesia produced 35,511 GWh of renewable electricity, generated mainly from hydro and geothermal sources, compared to 252,472 GWh of non-renewable energy. Thus, only 12.3% of production comes from renewable sources, against 87.7% from non-renewable sources and mainly from coal (62.81%). However, given the potential for producing energy from renewable sources in the country, it is predicted that renewable energy will replace conventional energy in the future, as non-renewables continue being depleted year-by-year [68]. On top of hydro and geothermal power, other sources have also been subject of investigation and testing in the country, such as biogas from landfill waste [69] and solar power [70].
South Africa, which has long been dependent on fossil fuels, mainly because of the coal reserves in the country that aided cheap electricity generation [21], reached a mark of 87.7% of its electricity production in 2020 coming from this source. Renewable sources represent only 6.9% of the matrix, composed of hydroelectric (2.3%), wind (2.5%), and solar (2.1%). There has been an increase in the contribution of solar and wind to the total energy produced in South Africa, whereas geothermal energy has been left out altogether, despite its potential in the region [21]. Considering the renewable production in GWh, in 1990, the production was 2851 GWh, increasing by a considerable 477.3% in 2020, when the production was 16,458 GWh. Meanwhile, in the same period, the growth in GWh of non-renewable production was 36.7%.
In penultimate place in the ranking of the G20 countries in 2020, South Korea produced 5.1% or 30,180 GWh of renewable electricity, predominantly from solar sources (3.11%), against a substantial 556,150 GWh from non-renewable sources, mainly derived from coal (38.66%), nuclear (27.32%), and natural gas (25.82%) [71] highlight that incentive policies, as well as the value of oil, are influencing factors in the dissemination of renewable energy in South Korea. Despite the predominant solar source, South Korea is a country of four seasons and thus the generation fluctuates throughout the year [72], which reiterates the need to diversify the renewable matrix by also investing in the development of other sources.
Finally, Saudi Arabia has a high availability of fossil resources, and this has increased their energy generation from such sources and their GHG emissions [73]. Currently, there are no specific regulations or policies on renewable energy technologies [74]. The country had 0.1% of renewable electricity production in 2020, coming from solar sources. The predominant production in the country is from natural gas (56.4%) and oil (43.49%).
In fact, the G20 countries strongly contribute to renewable electricity generation in the world. However, this can still be improved, mainly in terms of reducing the use of fossil sources, such as coal, nuclear, and natural gas.
Initially, a positive highlight between 1990 and 2020 is the 251.58% increase in renewable electricity production against an 81.44% increase in non-renewable electricity. With emphasis mainly on solar and wind production, in 1990, 752 GWh of solar electricity was produced predominantly in the US and 3993 GWh of electricity from wind power was produced predominantly in the US in addition to the European Union. These numbers increased considerably for a production of 790,727 GWh from solar sources and 1,613,733 GWh from wind sources in 2020, as with the exception of Saudi Arabia, the other 19 members of the G20 started to produce or increased their production from these types of energies. In this sense, Figure 4 shows the production of renewable electricity between 1990 and 2020 in the G20 countries. The primary axis represents wind, solar, geothermal, waste, and tide sources. The secondary axis represents hydro.
Another considerable increase is the production of electricity from waste, at 403.78%. This source, in 1990, represented most of the production (98.6%) in the USA (65.3%) and in the European Union (33.2%), and within this group, especially Germany (20.5%). In 2020, only Saudi Arabia and Africa did not seem to produce energy from this source, all other countries have already made efforts in this direction. The production of energy from hydroelectric power plants had an increase of 108.2% in the same period of 1990–2020. Less prominently are geothermal and tidal energy, each representing, in 2020, 59,406 GWh and 972 GWh, respectively. For each country analyzed, the European Union (32.7%), Germany (33.1%), the United Kingdom (31.6%), and Italy stand out with more than a 15% increase in the renewable electrical composition of the respective matrices (18.9%). The biggest reductions were in the electricity matrices of Brazil (17.7%) and Argentina (11.4%).

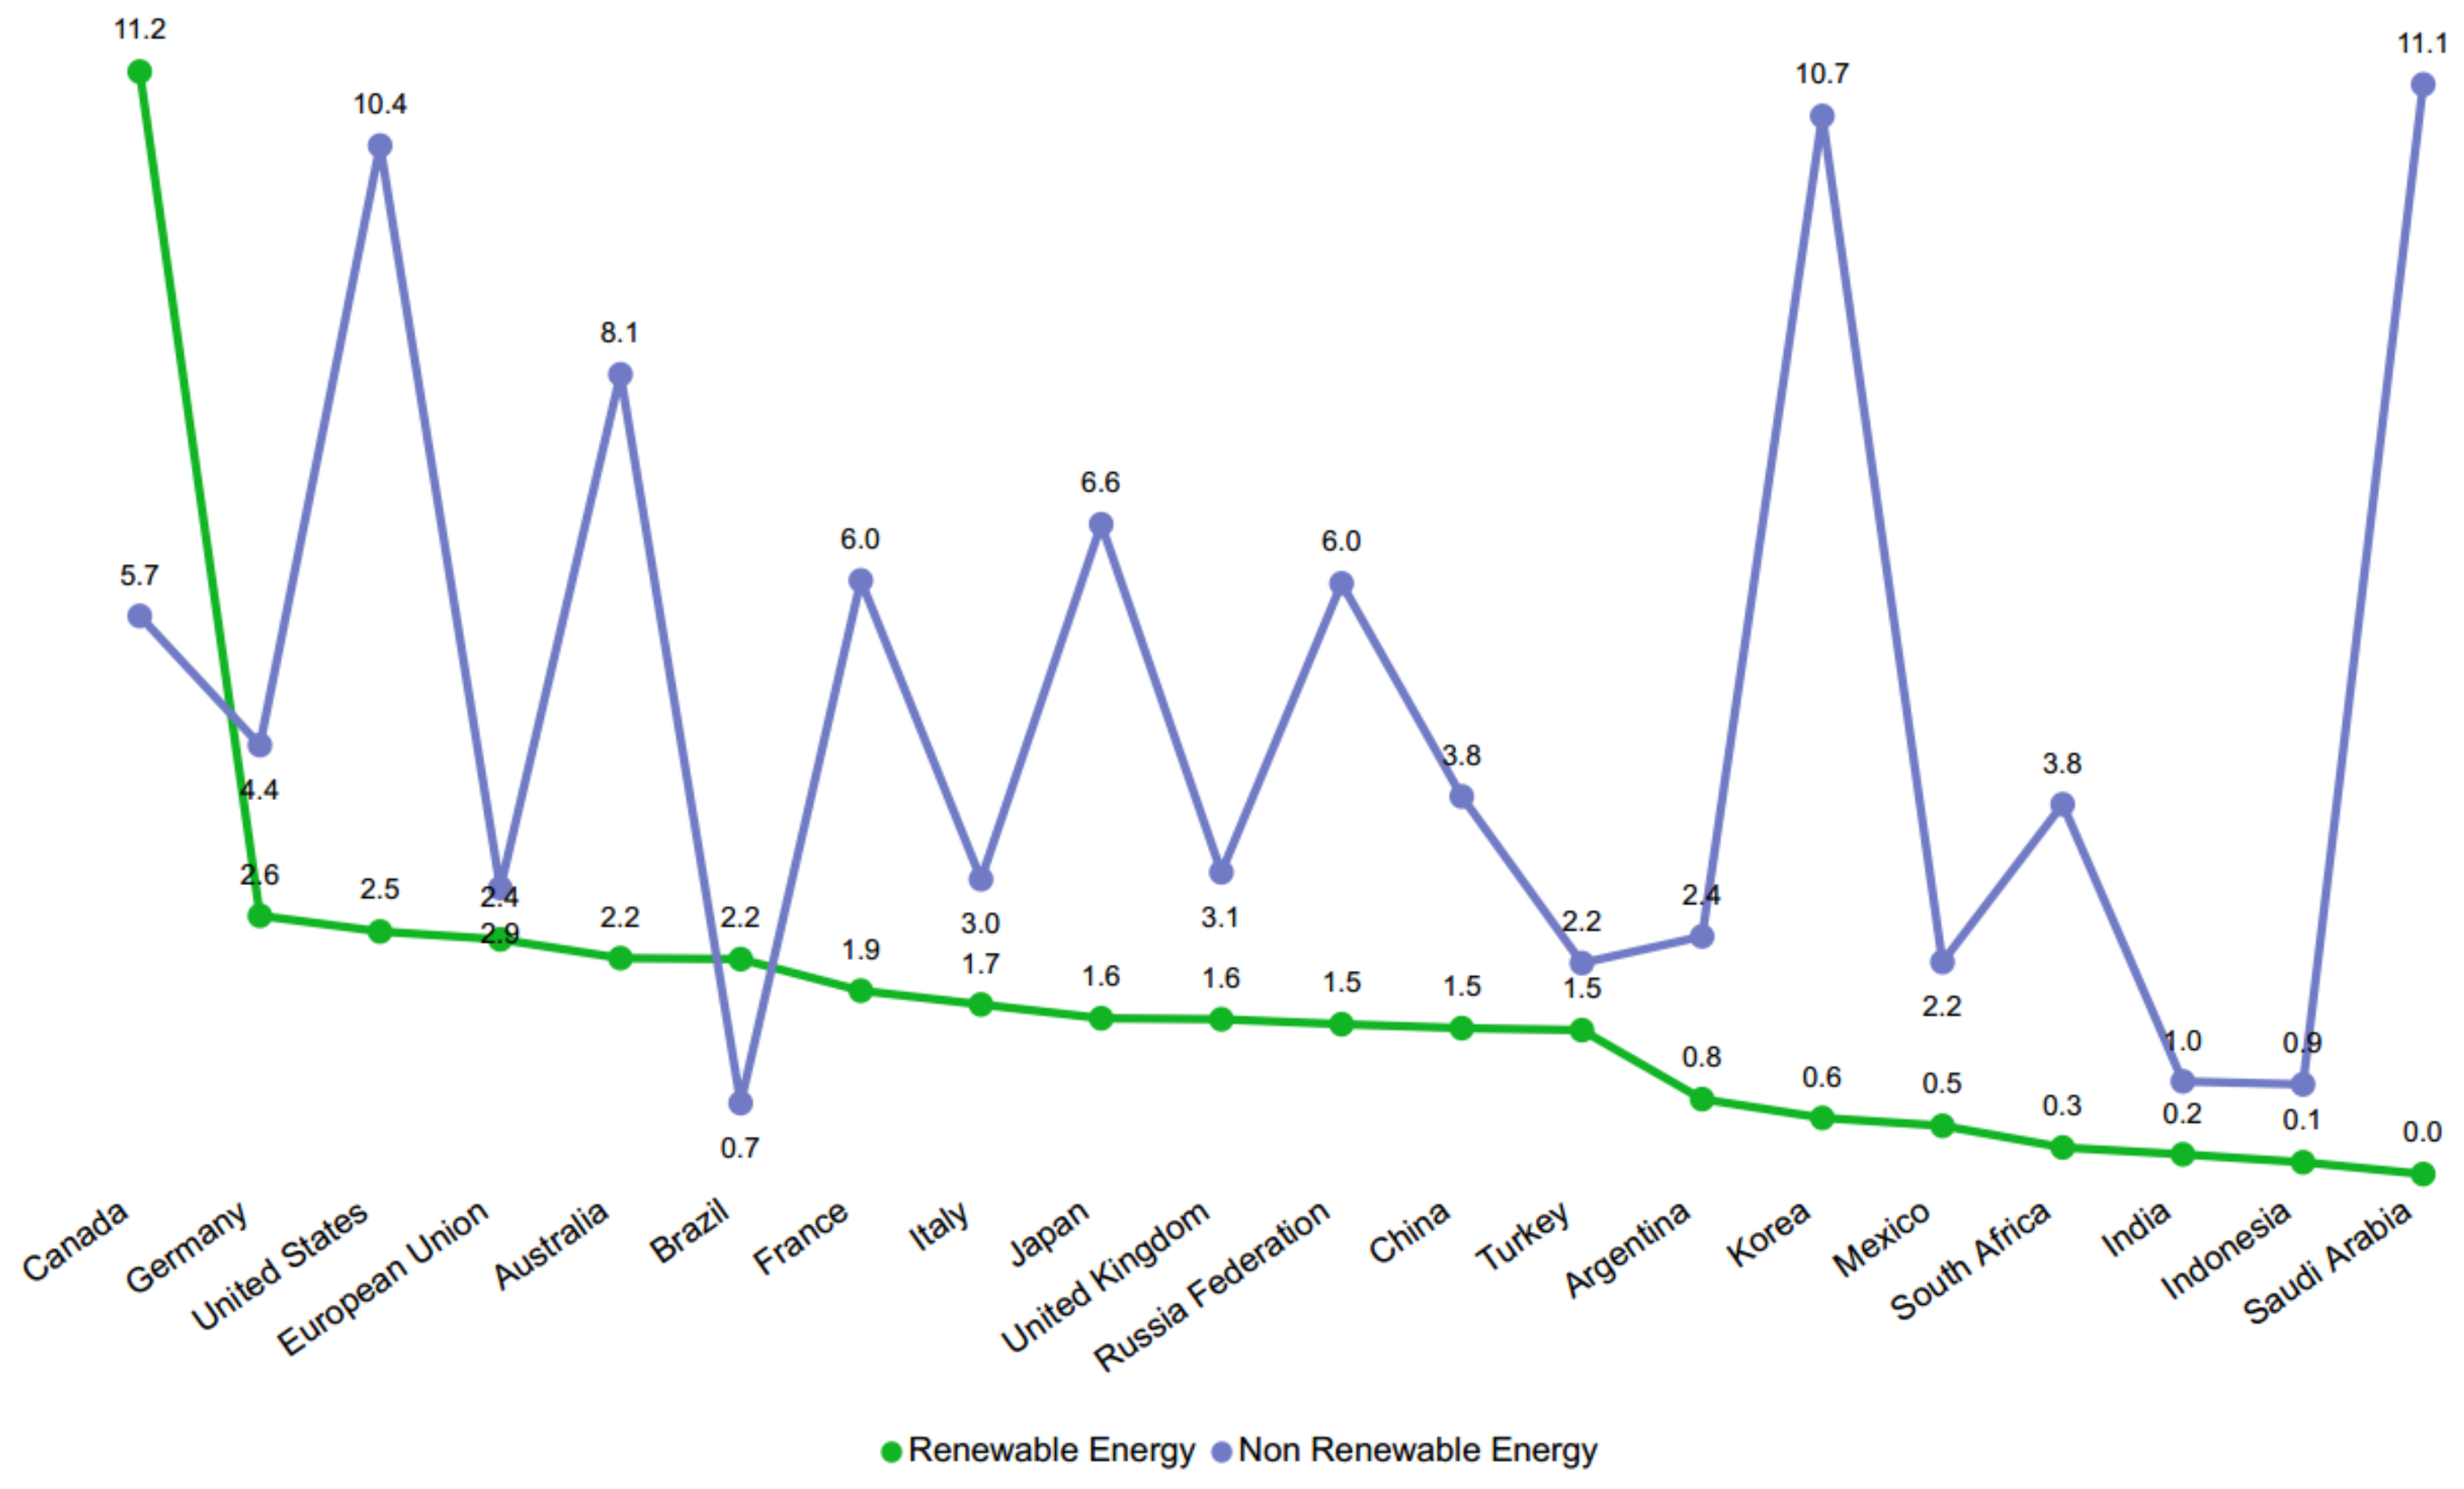
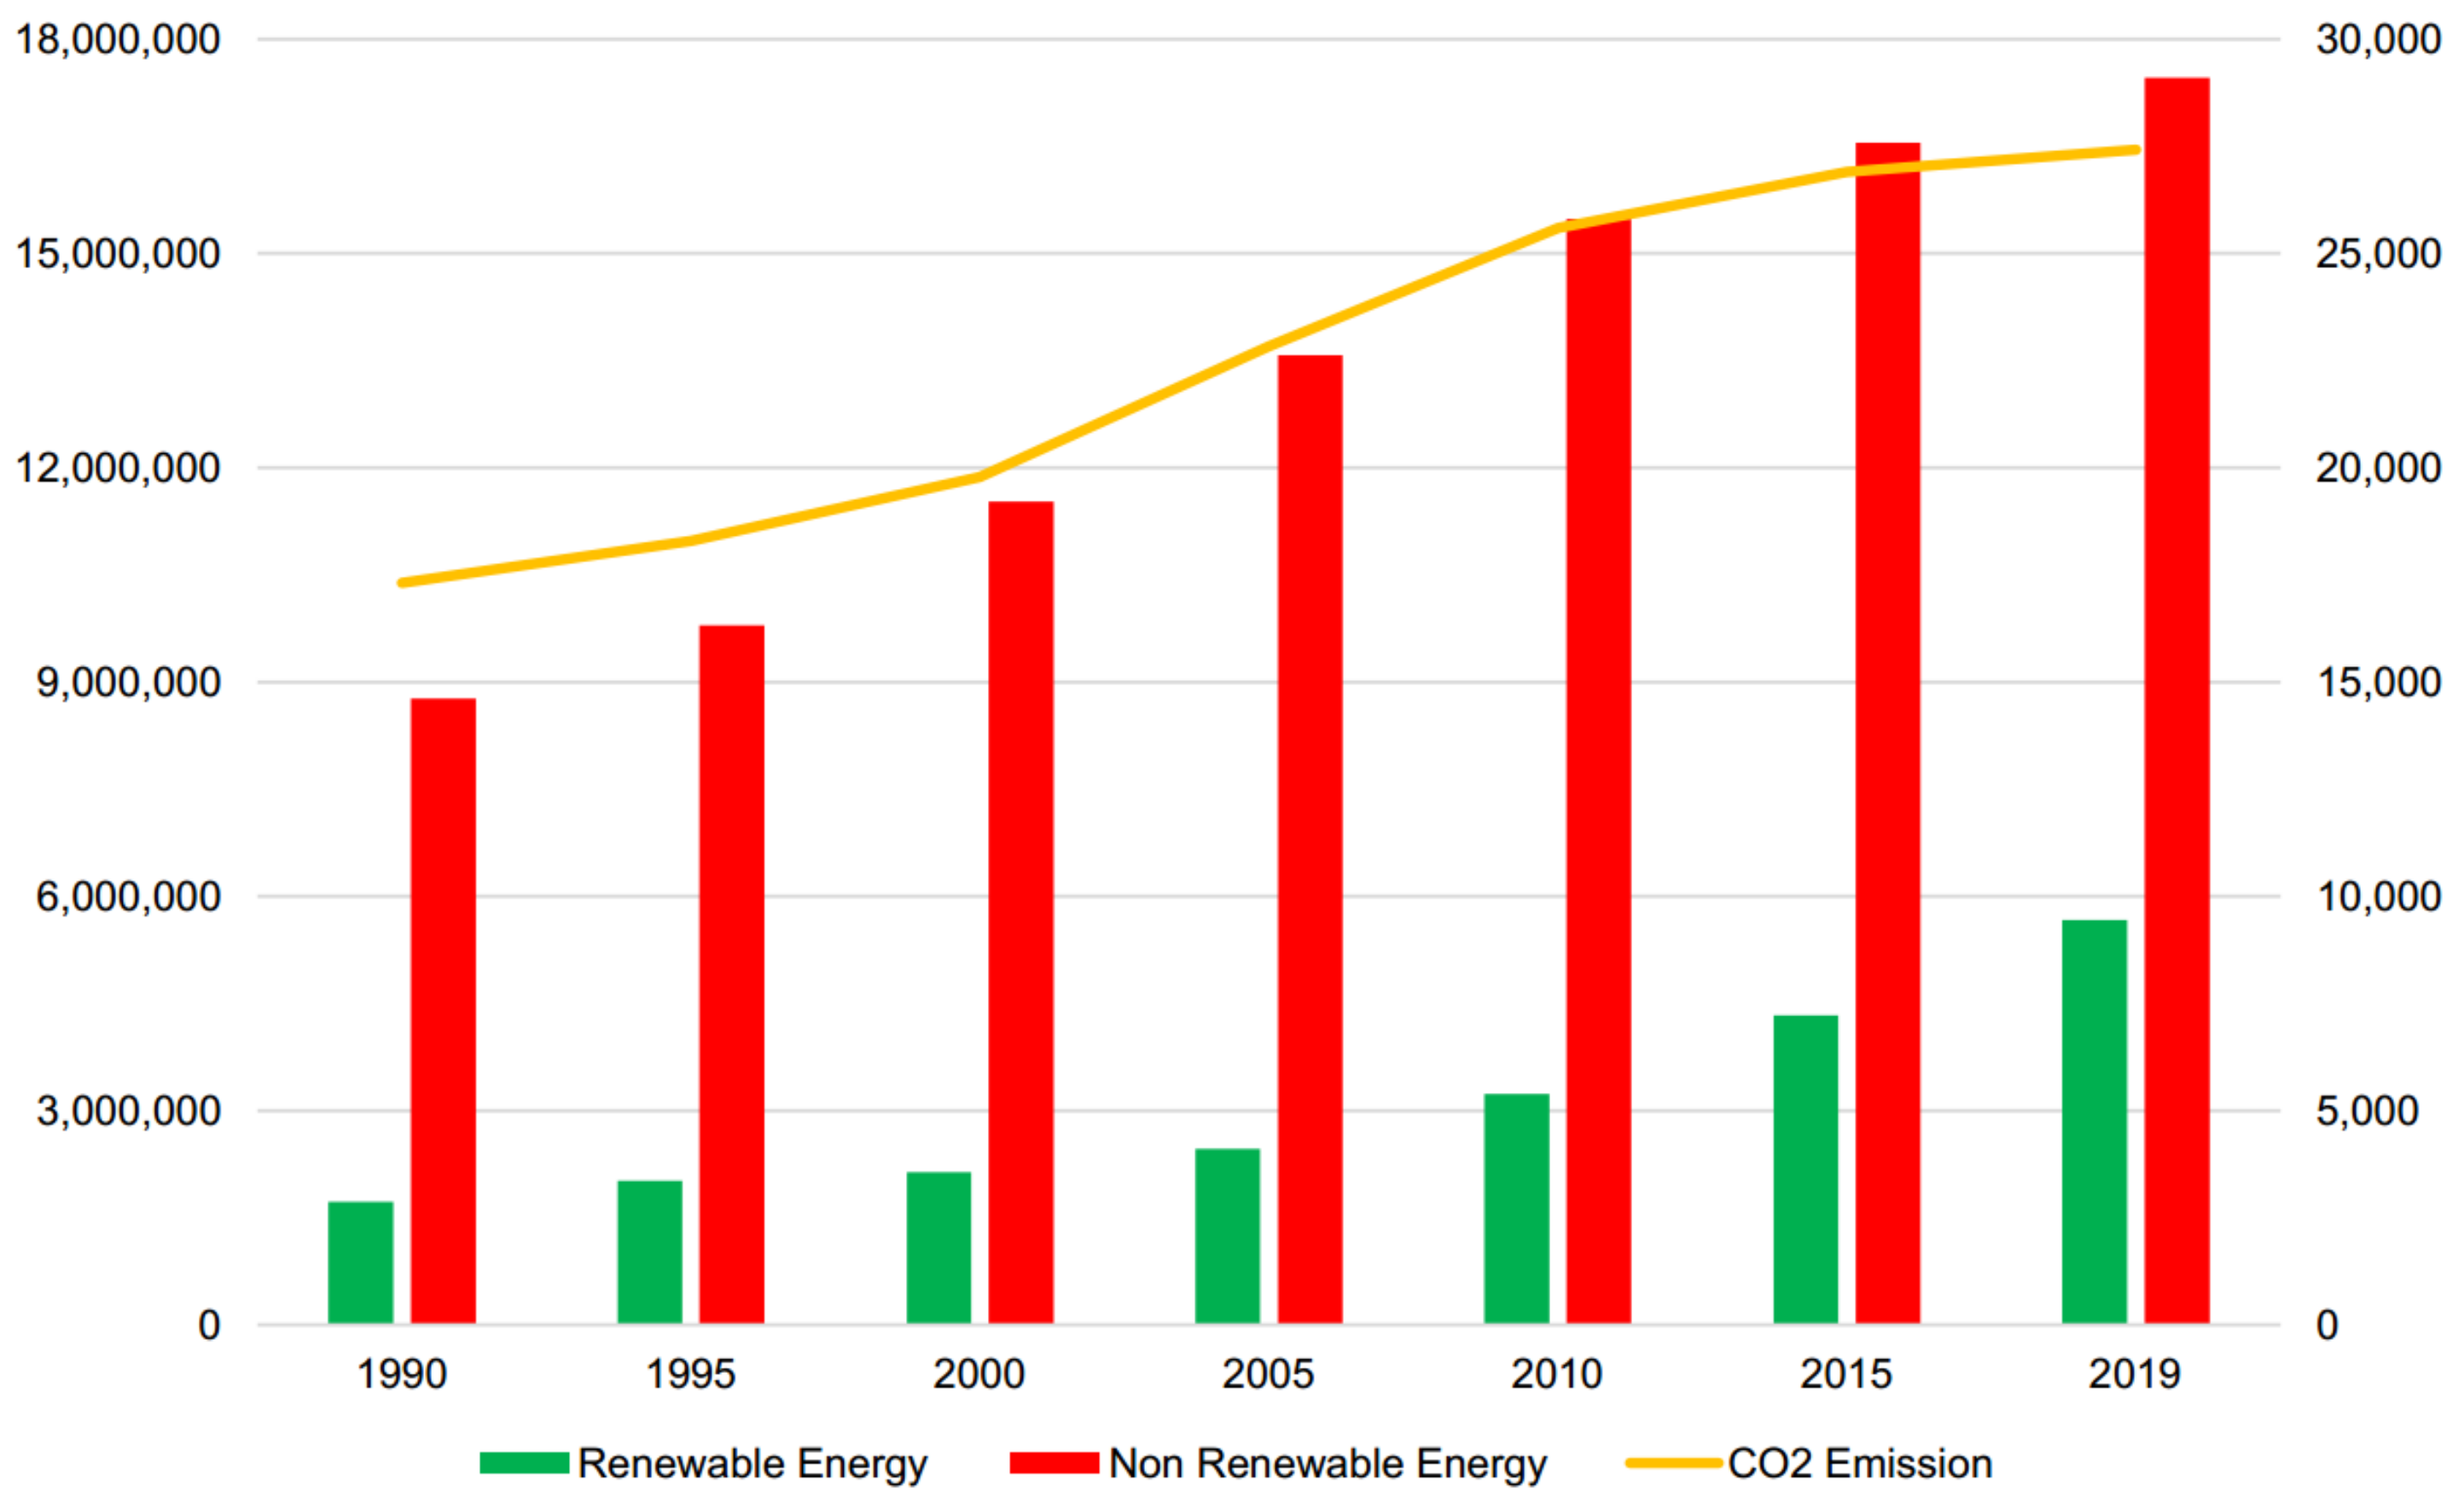
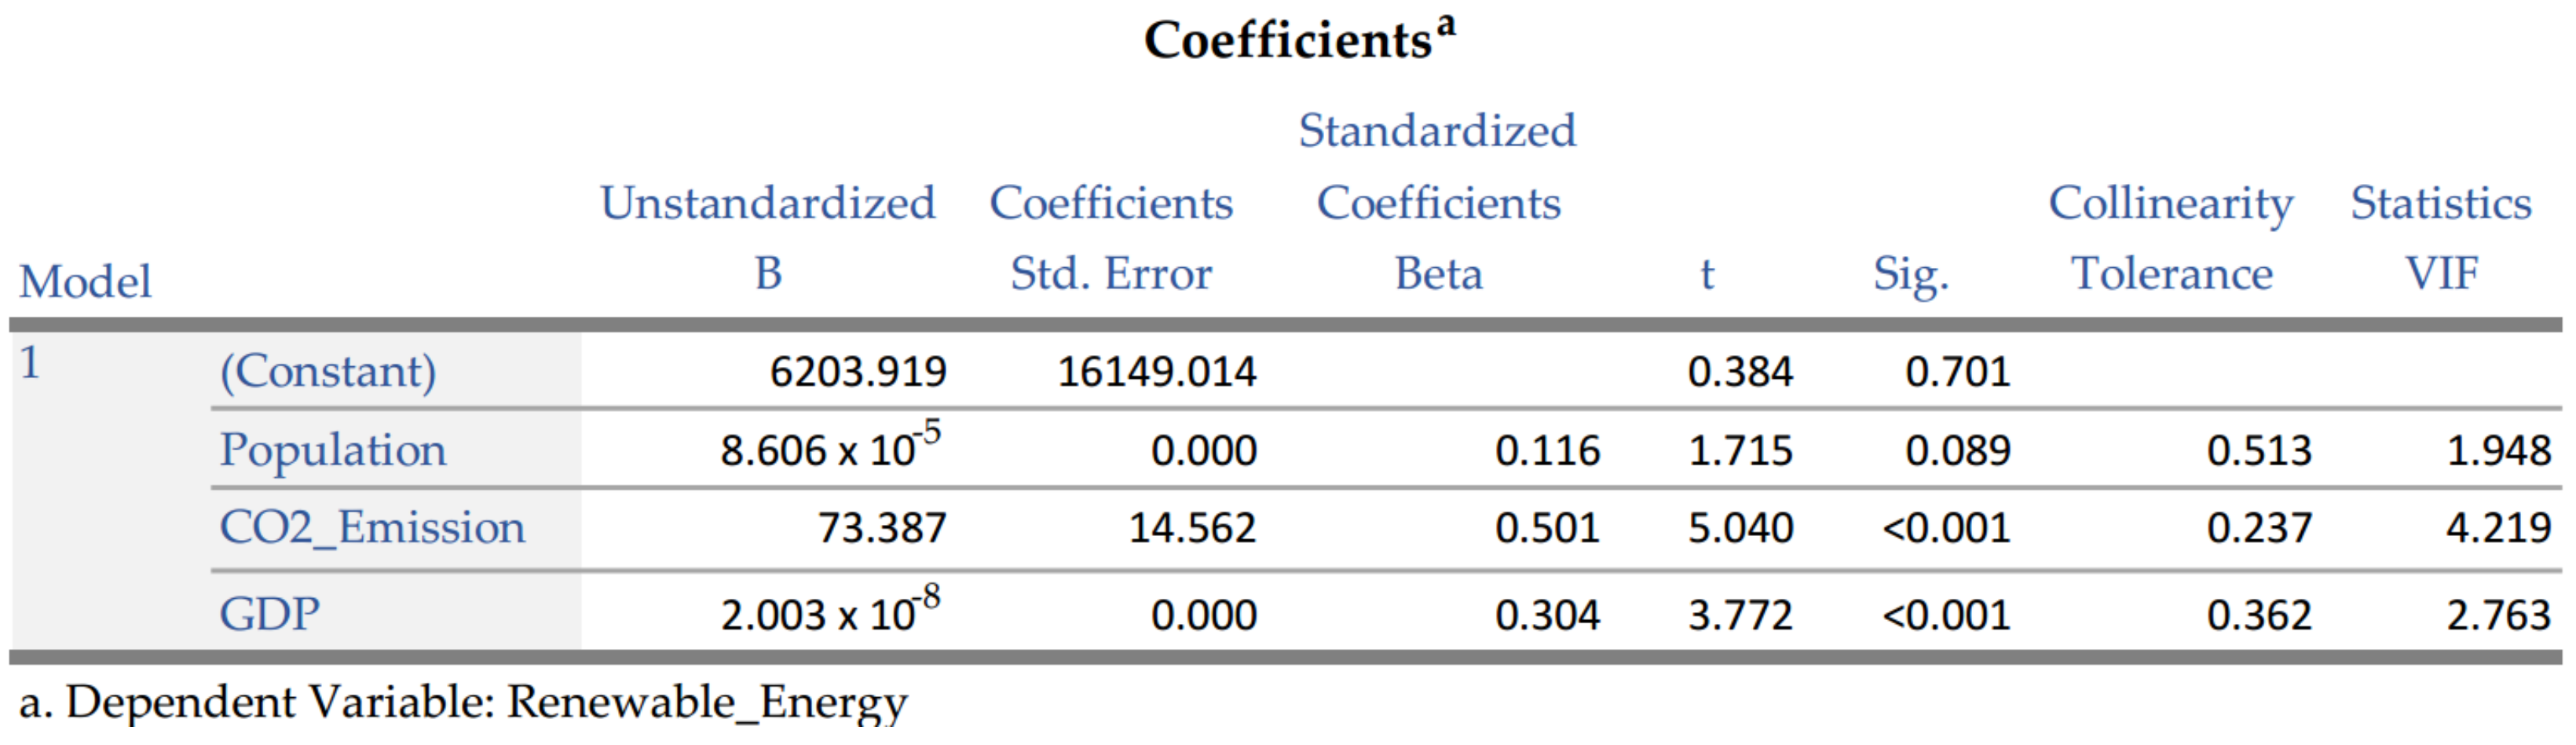
4.2. Population, GPD, and CO2 Emissions

Also analyzed was the relationship between the amount produced in GWh of each member of the G20 in relation to the total produced by the group. The largest producers of renewable electricity in GWh in 2020 were: China (34.5%), the European Union (17.7%), and the United States (13.45%), totaling 65.7% Thus, even though they are not the countries with the most renewable electricity matrices in the G20, they are the largest producers in terms of quantity of renewable GWh. A variable directly related to the amount of electricity produced is the population number of each country. Therefore, Figure 5 shows the amount of renewable and non-renewable electricity production, in MWh, per inhabitant, in the G20 countries in the 1990s and 2020s.
In 2020, the highlight is Canada, and even though it is in the second position of renewable composition in the electricity matrix, the country is the largest producer of renewable electricity per capita, approximately 11.19 MWh. Next, but with a big difference, are Germany and the United States, with 2.63 and 2.47 MWh per capita, respectively. Brazil, despite being the country with the most renewable electricity matrix, ranks 6th in terms of per capita electricity production. Korea, even occupying the penultimate position in the renewable portion of its matrix, occupies the 15th position with 0.58 MWh per capita. Consequently, Saudi Arabia is the most incipient country in renewable electricity production per inhabitant (0.01 MWh). However, the positive highlights are Canada and Brazil, as they are the only countries where renewable production per capita is greater than non-renewable production.
The increase in the production of renewable electricity and, consequently, its use, favor the reduction in CO2 emissions. Thus, Figure 6 presents a comparison between electricity production in relation to CO2 emission in the G20, between 1990 and 2019.
The growth in CO2 emissions over the last decades is notable, being more pronounced between 2000 and 2010 and starting to reduce with more emphasis from 2015, a period that also increased the production of renewable electricity. The reduction in CO2 emissions, as well as the greater generation of renewable electricity from 2015 onwards, may be a consequence of the Paris agreement, signed in 2015, also by the members of the G20. In order to identify the countries that have the most impact on CO2 emissions in the G20, Figure 7 presents the individual comparison between electricity production and CO2 emissions.
Canada, despite being the second country that generated the most renewable electricity, does not show a reduction in CO2 emission. In fact, it is the country with the highest CO2 emission per capita in 2019, with a total of 0.0000152 Mt. The other countries that stand out in terms of emission growth between 1990 and 2019 are China, India, Indonesia, and Turkey. Russia showed a reduction only from 1990 to 1995, remaining practically constant since then. Countries such as Australia, Korea, and South Africa showed greater growth in emissions until 2010, and from then on, they practically maintained the amount of metric tons of CO2 emitted into the atmosphere. The highlights in reducing CO2 emissions since 1995 are concentrated in the United States, United Kingdom, Italy, European Union and France. Even so, in 2019, the United States emitted 0.0000145 Mt per capita, being the 3rd country with the most emissions per capita in the G20. In addition to these, as of 2015, Argentina, Brazil, Japan, Mexico, and Saudi Arabia have substantially reduced their emissions. The biggest highlight, in terms of reduction, is Germany, which is the only country that has been reducing its CO2 emissions since the beginning of this analysis (1990).
Considering absolute numbers, China was the largest emitter of CO2 in 2019, with a total of 9919.1 Mt, and Argentina was the country with the lowest emission (162.2 Mt). However, the population difference between countries influences not only the demand for electricity, but also the amount of CO2 emitted. Thus, Table 1 presents the total and per capita CO2 emission of the G20 countries in 2019.
The countries with the lowest emissions per capita are Indonesia, Brazil, and India, with India emitting approximately 88.82% less CO2 per capita compared to Canada. Another relevant comparison is between Brazil and Canada, even though the two are the largest producers of renewable electricity, Brazil emits 87.5% less CO2 per capita. Thus, countries with higher emissions should, in addition to investing in more renewable energy sources as a whole, review the most polluting sectors.
Therefore, to reduce greenhouse gas emissions, mainly CO2, investment in more sustainable means of energy generation is necessary. In view of this, it was analyzed whether the countries that have the most renewable electricity matrix are also those with the highest gross domestic product. Table 2 presents the GDP and the percentage of renewable sources in the electricity matrix of G20 countries in 2020.
Brazil and Canada, despite being the countries with the most renewable electricity matrix in 2020, do not have the highest GDP, occupying the 14th and 11th positions, respectively. The European Union, in addition to having the second highest GDP of the group, also has one of the matrices with the highest renewable composition in 2020. The United States and China, despite having the 1st and 3rd highest GDP among the members of the G20, occupy respectively the 14th and 8th positions among the most renewable matrices. Thus, the countries with the highest GDP are not necessarily the ones with the highest percentage of renewables in their matrices.
To provide greater robustness to the analyses presented and to identify whether the population, GDP, and CO2 emission have an influence on the production of renewable electricity in the G20 countries, a multiple linear regression was performed (Figure 8).
One of the requirements of multiple linear regression is the absence of multicollinearity. This means that there cannot be a high correlation between the independent variables. Analyzing the table, it can be seen that the correlations are moderate. While there is a 0.805 correlation between renewable energy and CO2 emissions, this is not a perfect correlation.
The value of R (0.825) shows a strong correlation between the independent variables and the dependent variable.
The value of R squared (0.681) indicates the percentage of variation in the dependent variable that is explained by the independent variables. Model 1 explains 68.1% of the data variation.
The Durbin–Watson test checks for residuals, i.e., a difference between the predicted value and the observed value. To consider independent residuals, the value must be close to 2 and the acceptable value is between 1.5 and 2.5. Thus, in this analysis, the value of 1.661 is in agreement.
Based on the ANOVA results (Figure 9), the analysis must be complemented by two different hypotheses:
H0: current model fit = model fit without predictor;
H1: current model fit ≠ model fit without predictor.
As p is less than 0.05, it appears that including the predictors improves the quality of the model.
Since multiple linear regression was used to verify whether CO2 emission, GDP, and population are able to predict the generation of renewable energy, the analysis resulted in a statistically significant model [F (3.136) = 96.896; p < 0.001; R2 = 0.681]
From the identification of the weight of each variable in the analyzed model (Figure 10), non-standardized coefficients were identified, i.e., coefficients that are in the variable’s unit of measure. From the weight that each independent variable has in the model, non-standardized coefficients are identified, i.e., coefficients that are in the variable’s unit of measure. The beta is the standardized coefficient, so you can compare it with the different coefficients.
CO2 emission and GDP have a p less than 0.05, which indicates that they have non-zero coefficients, so they are relevant to the model. The population and constant do not have a p less than 0.05. The value given as a coefficient is not statistically different from zero. Looking at the standardized coefficient (Beta), CO2 emission has a coefficient of 0.501, which means it is a stronger predictor. The regression beta is the value that determines the angle of the regression line. The beta value determines how much the predictor variable impacts the outcome variable. The higher the value of the beta modulus (ignoring the sign), the more influential it is on the values of the outcome variable.
There is no multicollinearity because the ‘tolerance’ values in the table are all greater than 0.1. Also, if the value of VIF is less than 10, there is no multicollinearity.

5. Conclusions

As countries and governments determine and support decarbonization in the electricity sector, it will be increasingly necessary to perform research and encourage the use of electricity from renewable sources. In this sense, this study sought to identify trends in electricity generation from renewable energies in G20 countries.
It was identified that use of renewable sources has been growing, thus presenting a positive trend. The main sources of rising participation in the electricity mix within the G20 countries are wind and solar, whereas hydropower continues to grow in absolute terms (i.e., the quantity of electricity produced from such source) but seems to be decreasing in proportion in the mix. Electricity from waste has been explored, but it is still incipient. Geothermal and tidal power are timidly rising but depend on location and climatic conditions, thus their uptake might remain low compared to other sources that are more easily available. Nonetheless, the concerns with the depletion and exhaustion of reserves of non-renewable sources have also always been in the background.
The main factor for the use of renewable electricity sources has been pointed out as the need to reduce greenhouse gas emissions, mainly CO2, thus seeking to decarbonize the electricity matrix.
It was also identified that CO2, as well as the population and GDP indicators, is one of the influencing factors in the production of renewable electricity. From the increase in production and consequently the use of renewable electricity by the population, the amount of CO2 emitted into the atmosphere is consequently reduced.
Although GDP influences the increase in the participation of renewable sources in a country’s electricity production, the results present that the countries with the highest GDP are not necessarily those with the highest percentage of renewable electricity in the electricity matrix. Therefore, new studies can expand this analysis, considering other factors that may impact production such as geographic location, climate, and technological development, among others.
Among the limitations that this study presents, the survey was carried out only on the production of the electricity and the composition of the electricity matrix. Future studies can complement this analysis by evaluating the consumption of renewable electricity, whether countries consume everything that is produced, and imports and exports, in order to identify other opportunities. Also, further research can analyze the CO2 emission of each type of energy and thus identify which sectors and countries contribute with the greatest emissions.
This study’s results can be used to encourage public policies towards greater sustainability of electricity systems by: (i) fomenting further research via universities that also focuses on the development and improvement of cleaner energy production technologies; (ii) serving as basis for further investigations towards the development of regulations in the energy sector, and; (iii) supporting concrete action to reduce the non-renewable sources and facilitate financing for renewable sources.

Author Contributions

Conceptualization, C.C.S.; R.S. and M.V.B.; methodology, C.C.S.; writing—original draft preparation, C.C.S., M.V.B. and R.S.; data curation, C.C.S. and E.E.B.; writing—review and editing, C.C.S.; visualization, C.C.S.; supervision, A.C.d.F. All authors have read and agreed to the published version of the manuscript.

Funding

This research was funded by Conselho Nacional de Desenvolvimento Científico e Tecnológico (CNPq)—Brazil [grant number 157556/2019-0 and 310259/2020-7], and Coordenação de Aperfeiçoamento de Pessoal de Nível Superior (CAPES)—Brazil [grant number 001].

Institutional Review Board Statement

Not applicable.

Informed Consent Statement

Not applicable.

Data Availability Statement

The data that support the findings of this study are openly available in https://www.iea.org/data-and-statistics/data-browser?country=WORLD&fuel=Energy%20supply&indicator=TESbySource (accessed on 10 January 2022).

Conflicts of Interest

The authors declare no conflict of interest.

References

  1. Raugei, M.; Peluso, A.; Leccisi, E.; Fthenakis, V. Life-Cycle Carbon Emissions and Energy Return on Investment for 80% Domestic Renewable Electricity with Battery Storage in California (USA). Energies 2020, 13, 3934. [Google Scholar] [CrossRef]
  2. Bilgili, F.; Lorente, D.B.; Kuşkaya, S.; Ünlü, F.; Gençoğlu, P.; Rosha, P. The role of hydropower energy in the level of CO2 emissions: An application of continuous wavelet transform. Renew. Energy 2021, 178, 283–294. [Google Scholar] [CrossRef]
  3. Röder, J.; Beier, D.; Meyer, B.; Nettelstroth, J.; Stührmann, T.; Zondervan, E. Design of Renewable and System-Beneficial District Heating Systems Using a Dynamic Emission Factor for Grid-Sourced Electricity. Energies 2020, 13, 619. [Google Scholar] [CrossRef] [Green Version]
  4. Acaravci, A.; Ozturk, I. Electricity consumption-growth nexus: Evidence from panel data for transition countries. Energy Econ. 2010, 32, 604–608. [Google Scholar] [CrossRef]
  5. IEA. International Energy Agency. In International Energy Outlook 2017; OECD Publishing: Paris, France, 2017. [Google Scholar]
  6. Barros, M.V.; da Silva, B.P.A.; Piekarski, C.M.; da Luz, L.M.; Yoshino, R.T.; Tesser, D.P. Carbon footprint of transportation habits in a Brazilian university. Environ. Qual. Manag. 2018, 28, 139–148. [Google Scholar] [CrossRef]
  7. UNFCCC (United Nations Framework Convention on Climate Change). End of Coal in Sight at COP26. Available online: https://unfccc.int/news/end-of-coal-in-sight-at-cop26 (accessed on 27 November 2021).
  8. UNFCCC (United Nations Framework Convention on Climate Change). The Paris Agreement. 2021. Available online: https://unfccc.int/process-and-meetings/the-paris-agreement/the-paris-agreement (accessed on 27 November 2021).
  9. Salvador, R.; Barros, M.V.; Rosário, J.G.D.P.D.; Piekarski, C.M.; da Luz, L.M.; de Francisco, A.C. Life cycle assessment of electricity from biogas: A systematic literature review. Environ. Prog. Sustain. Energy 2019, 38, 13133. [Google Scholar] [CrossRef]
  10. Fraunholz, C.; Keles, D.; Fichtner, W. On the role of electricity storage in capacity remuneration mechanisms. Energy Policy 2021, 149, 112014. [Google Scholar] [CrossRef]
  11. Middelhoff, E.; Madden, B.; Ximenes, F.; Carney, C.; Florin, N. Assessing electricity generation potential and identifying possible locations for siting hybrid concentrated solar biomass (HCSB) plants in New South Wales (NSW), Australia. Appl. Energy 2022, 305, 117942. [Google Scholar] [CrossRef]
  12. Qiao, H.; Zheng, F.; Jiang, H.; Dong, K. The greenhouse effect of the agriculture-economic growth-renewable energy nexus: Evidence from G20 countries. Sci. Total Environ. 2019, 671, 722–731. [Google Scholar] [CrossRef]
  13. Zeraibi, A.; Balsalobre-Lorente, D.; Murshed, M. The influences of renewable electricity generation, technological innovation, financial development, and economic growth on ecological footprints in ASEAN-5 countries. Environ. Sci. Pollut. Res. 2021, 28, 51003–51021. [Google Scholar] [CrossRef]
  14. Barthelmie, R.J.; Pryor, S.C. Climate Change Mitigation Potential of Wind Energy. Climate 2021, 9, 136. [Google Scholar] [CrossRef]
  15. Cui, Y.; Zhu, J.; Zoras, S.; Qiao, Y.; Zhang, X. Energy performance and life cycle cost assessments of a photovoltaic/thermal assisted heat pump system. Energy 2020, 206, 118108. [Google Scholar] [CrossRef]
  16. Azam, A.; Rafiq, M.; Shafique, M.; Yuan, J. Renewable electricity generation and economic growth nexus in developing countries: An ARDL approach. Econ. Res. Ekon. Istraživanja 2021, 34, 2423–2446. [Google Scholar] [CrossRef]
  17. Herrando, M.; Markides, C.N.; Hellgardt, K. A UK-based assessment of hybrid PV and solar-thermal systems for domestic heating and power: System performance. Appl. Energy 2014, 122, 288–309. [Google Scholar] [CrossRef] [Green Version]
  18. Brodny, J.; Tutak, M.; Bindzár, P. Assessing the Level of Renewable Energy Development in the European Union Member States. A 10-Year Perspective. Energies 2021, 14, 3765. [Google Scholar] [CrossRef]
  19. Langsdorf, S. EU Energy Policy: From the ECSC to the Energy Roadmap 2050. Brussels: Green European Foundation. Available online: http://archive.gef.eu/uploads/uploads/media/History_of_EU_energy_policy.pdf (accessed on 25 November 2021).
  20. UNFCCC, U.N. Kyoto Protocol Reference Manual on Accounting of Emissions and Assigned Amount. 2008. Available online: https://unfccc.int/sites/default/files/08_unfccc_kp_ref_manual.pdf (accessed on 27 November 2021).
  21. Martin, J.W.; Croukamp, L. Exploration into the potential for a low-enthalpy geothermal power plant in Cape fold belt. Geothermics 2021, 89, 101934. [Google Scholar] [CrossRef]
  22. Matuszewska-Janica, A.; Żebrowska-Suchodolska, D.; Ala-Karvia, U.; Hozer-Koćmiel, M. Changes in Electricity Production from Renewable Energy Sources in the European Union Countries in 2005–2019. Energies 2021, 14, 6276. [Google Scholar] [CrossRef]
  23. Brodny, J.; Tutak, M. Analysis of the efficiency and structure of energy consumption in the industrial sector in the European Union countries between 1995 and 2019. Sci. Total Environ. 2022, 808, 152052. [Google Scholar] [CrossRef]
  24. European Union. Directive 2009/28/EC of the European Parliament and of the Council of 23 April 2009 on the Promotion of the Use of Energy from Renewable Sources and Amending and Subsequently Repealing Directives 2001/77/EC and 2003/30/EC. Available online: https://eur-lex.europa.eu/LexUriServ/LexUriServ.do?uri=OJ:L:2009:140:0016:0062:en:PDF (accessed on 25 November 2021).
  25. Bartolini, A.; Carducci, F.; Muñoz, C.B.; Comodi, G. Energy storage and multi energy systems in local energy communities with high renewable energy penetration. Renew. Energy 2020, 159, 595–609. [Google Scholar] [CrossRef]
  26. European Commission. Energy Roadmap 2050. Available online: https://ec.europa.eu/energy/sites/ener/files/documents/2012_energy_roadmap_2050_en_0.pdf (accessed on 25 November 2021).
  27. Yang, S.; Park, S. The effects of renewable energy financial incentive policy and democratic governance on renewable energy aid effectiveness. Energy Policy 2020, 145, 111682. [Google Scholar] [CrossRef]
  28. Huterski, R.; Huterska, A.; Zdunek-Rosa, E.; Voss, G. Evaluation of the Level of Electricity Generation from Renewable Energy Sources in European Union Countries. Energies 2021, 14, 8150. [Google Scholar] [CrossRef]
  29. IEA (International Energy Agency). Energy Technology Perspectives 2015: Mobilising Innovation to Accelerate Climate Action. Available online: https://doi.org/10.1787/energy_tech-2015-en (accessed on 25 November 2021).
  30. Bilgili, M.; Yildirim, A.; Ozbek, A.; Celebi, K.; Ekinci, F. Long short-term memory (LSTM) neural network and adaptive neuro-fuzzy inference system (ANFIS) approach in modeling renewable electricity generation forecasting. Int. J. Green Energy 2021, 18, 578–594. [Google Scholar] [CrossRef]
  31. Medeiros, S.E.L.; Nilo, P.F.; Silva, L.P.; Santos, C.A.C.; Carvalho, M.; Abrahao, R. Influence of climatic variability on the electricity generation potential by renewable sources in the Brazilian semi-arid region. J. Arid Environ. 2021, 184, 104331. [Google Scholar] [CrossRef]
  32. Okada, M.; Onishi, T.; Obara, S.Y. A design algorithm for an electric power system using wide-area interconnection of renewable energy. Energy 2020, 193, 116638. [Google Scholar] [CrossRef]
  33. Strazzabosco, A.; Kenway, S.J.; Lant, P.A. Quantification of renewable electricity generation in the Australian water industry. J. Clean. Prod. 2020, 254, 120119. [Google Scholar] [CrossRef] [Green Version]
  34. Khan, I.; Kabir, Z. Waste-to-energy generation technologies and the developing economies: A multi-criteria analysis for sustainability assessment. Renew. Energy 2020, 150, 320–333. [Google Scholar] [CrossRef]
  35. Joshi, S.; Mittal, S.; Holloway, P.; Shukla, P.R.; Ó Gallachóir, B.; Glynn, J. High resolution global spatiotemporal assessment of rooftop solar photovoltaics potential for renewable electricity generation. Nat. Commun. 2021, 12, 1–15. [Google Scholar] [CrossRef] [PubMed]
  36. Yu, B.; Fang, D.; Yu, H.; Zhao, C. Temporal-spatial determinants of renewable energy penetration in electricity production: Evidence from EU countries. Renew. Energy 2021, 180, 438–451. [Google Scholar] [CrossRef]
  37. GWEC (Global Wind Energy Council). Global Wind Report 2021. Available online: https://gwec.net/global-wind-report-2021/ (accessed on 29 November 2021).
  38. Shah, M.I.; Kirikkaleli, D.; Adedoyin, F.F. Regime switching effect of COVID-19 pandemic on renewable electricity generation in Denmark. Renew. Energy 2021, 175, 797–806. [Google Scholar] [CrossRef]
  39. Koecklin, M.T.; Longoria, G.; Fitiwi, D.Z.; DeCarolis, J.F.; Curtis, J. Public acceptance of renewable electricity generation and transmission network developments: Insights from Ireland. Energy Policy 2021, 151, 112185. [Google Scholar] [CrossRef]
  40. Boudet, H.; Zanocco, C.; Stelmach, G.; Muttaqee, M.; Flora, J. Public preferences for five electricity grid decarbonization policies in California. Rev. Policy Res. 2021, 38, 510–528. [Google Scholar] [CrossRef]
  41. McCallum, C.S.; Kumar, N.; Curry, R.; McBride, K.; Doran, J. Renewable electricity generation for off grid remote communities; Life Cycle Assessment Study in Alaska, USA. Appl. Energy 2021, 299, 117325. [Google Scholar] [CrossRef]
  42. G20. About the G20. 2021. Available online: https://g20.org/about-the-g20/ (accessed on 27 November 2021).
  43. IEA (International Energy Agency). Data and Statistics. 2021. Available online: https://www.iea.org/data-and-statistics/data-browser?country=WORLD&fuel=Energy%20supply&indicator=TESbySource (accessed on 27 November 2021).
  44. UN (United Nations). Department of Economic and Social Affairs: Population Dynamics. 2021. Available online: https://population.un.org/wpp/Download/Standard/Population/ (accessed on 27 November 2021).
  45. EU—European Union. Country Profiles. 2021. Available online: https://europa.eu/european-union/about-eu/countries_pt#tab-0-1 (accessed on 5 December 2021).
  46. The World Bank. Data. 2022. Available online: https://data.worldbank.org/indicator/NY.GDP.MKTP.CD?view=chart (accessed on 11 January 2022).
  47. IPCC (Intergovernmental Panel on Climate Change). Impacts 2021, Adaptation, and Vulnerability. In Contribution of Working Group II to the Fifth Assessment Report of the Intergovernmental Panel on Climate Change; Cambridge University Press: Cambridge, UK, 2014. [Google Scholar]
  48. Abrahao, R.; Peixoto, I.M.B.M.; Carvalho, M. Solar or wind energy for the Brazilian semiarid? Climatic characterization and future trends. In Proceedings of the 30th International Conference on Efficiency 2017, Cost, Optimization, Simulation and Environmental Impact of Energy Systems, San Diego, CA, USA, 2–6 July 2017. [Google Scholar]
  49. Melo, F.M.; Silvestre, A.; Carvalho, M. Carbon footprints associated with electricity generation from biomass syngas and diesel. Environ. Eng. Manag. J. (EEMJ) 2019, 18, 1391–1397. [Google Scholar]
  50. Rosa, C.B.; Wendt, J.F.M.; Chaves, D.M.; Thomasi, V.; Michels, L.; Siluk, J.C.M. Mathematical modeling for the measurement of the competitiveness index of Brazil south urban sectors for installation of photovoltaic systems. Energy Policy 2020, 136, 111048. [Google Scholar] [CrossRef]
  51. Saidi, K.; Omri, A. Reducing CO2 emissions in OECD countries: Do renewable and nuclear energy matter? Prog. Nucl. Energy 2020, 126, 103425. [Google Scholar] [CrossRef]
  52. Bórawski, P.; Bełdycka-Bórawska, A.; Szymańska, E.J.; Jankowski, K.J.; Dubis, B.; Dunn, J.W. Development of renewable energy sources market and biofuels in The European Union. J. Clean. Prod. 2019, 228, 467–484. [Google Scholar] [CrossRef]
  53. Sahin, U. Projections of Turkey’s electricity generation and installed capacity from total renewable and hydro energy using fractional nonlinear grey Bernoulli model and its reduced forms. Sustain. Prod. Consum. 2020, 23, 52–62. [Google Scholar] [CrossRef]
  54. Luo, T.; Young, R.; Reig, P. Aqueduct Projected Water Stress Country Rankings. Tech. Note 2015, 16. Available online: https://www.wri.org/research/aqueduct-projected-water-stress-country-rankings (accessed on 29 November 2021).
  55. Kumar, S.; Loosen, M.; Madlener, R. Assessing the potential of low-carbon technologies in the German energy system. J. Environ. Manag. 2020, 262, 110345. [Google Scholar] [CrossRef]
  56. Jafari, M.; Bompard, E.; Delmastro, C.; Botterud, A.; Grosso, D. Electrify Italy: The role of renewable energy. Gas 2022, 2030, 2050. [Google Scholar]
  57. Villamor, L.V.; Avagyan, V.; Chalmers, H. Opportunities for reducing curtailment of wind energy in the future electricity systems: Insights from modelling analysis of Great Britain. Energy 2020, 195, 116777. [Google Scholar] [CrossRef]
  58. Xiaosan, Z.; Qingquan, J.; Iqbal, K.S.; Manzoor, A.; Ur, R.Z. Achieving sustainability and energy efficiency goals: Assessing the impact of hydroelectric and renewable electricity generation on carbon dioxide emission in China. Energy Policy 2021, 155, 112332. [Google Scholar] [CrossRef]
  59. Murshed, M.; Rashid, S.; Ulucak, R.; Dagar, V.; Rehman, A.; Alvarado, R.; Nathaniel, S.P. Mitigating energy production-based carbon dioxide emissions in Argentina: The roles of renewable energy and economic globalization. Environ. Sci. Pollut. Res. 2021, 1–20. [Google Scholar] [CrossRef] [PubMed]
  60. Sebi, C.; Vernay, A.L. Community renewable energy in France: The state of development and the way forward. Energy Policy 2020, 147, 111874. [Google Scholar] [CrossRef]
  61. Strazzabosco, A.; Kenway, S.J.; Conrad, S.A.; Lant, P.A. Renewable electricity generation in the Australian water industry: Lessons learned and challenges for the future. Renew. Sustain. Energy Rev. 2021, 147, 111236. [Google Scholar] [CrossRef]
  62. Russian Federation. Decree No. 449 on the Mechanism for the Promotion of Renewable Energy on the Wholesale Electricity and Market; Ministry of Energy of the Russian Federation: Moscow, Russia, 2013. [Google Scholar]
  63. Pablo-Romero, M.P.; Sánchez-Braza, A.; Galyan, A. Renewable energy use for electricity generation in transition economies: Evolution, targets and promotion policies. Renew. Sustain. Energy Rev. 2021, 138, 110481. [Google Scholar] [CrossRef]
  64. Zhu, D.; Mortazavi, S.M.; Maleki, A.; Aslani, A.; Yousefi, H. Analysis of the robustness of energy supply in Japan: Role of renewable energy. Energy Rep. 2020, 6, 378–391. [Google Scholar] [CrossRef]
  65. Lee, J.M.; Howard, G. The impact of technical efficiency, innovation, and climate policy on the economic viability of renewable electricity generation. Energy Econ. 2021, 100, 105357. [Google Scholar] [CrossRef]
  66. Ramesh, M.; Saini, R.P. Dispatch strategies based performance analysis of a hybrid renewable energy system for a remote rural area in India. J. Clean. Prod. 2020, 259, 120697. [Google Scholar] [CrossRef]
  67. Pillai, I.R.; Banerjee, R. Renewable energy in India: Status and potential. Energy 2009, 34, 970–980. [Google Scholar] [CrossRef]
  68. Erdiwansyah, E.; Mahidin, M.; Husin, H.; Nasaruddin, N.; Khairil, K.; Zaki, M.; Jalaluddin, J. Investigation of availability, demand, targets, and development of renewable energy in 2017–2050: A case study in Indonesia. Int. J. Coal Sci. Technol. 2021, 8, 483–499. [Google Scholar] [CrossRef]
  69. Kurniawan, T.A.; Liang, X.; Singh, D.; Othman, M.H.D.; Goh, H.H.; Gikas, P.; Shoqeir, J.A. Harnessing landfill gas (LFG) for electricity: A strategy to mitigate greenhouse gas (GHG) emissions in Jakarta (Indonesia). J. Environ. Manag. 2022, 301, 113882. [Google Scholar] [CrossRef] [PubMed]
  70. Dhina, N.; Permana, T. Natural Gas Transportation Business Contribution to Indonesia’s National Energy Policy and Carbon Emission Offset by on-Grid Solar PV Utilization: Surabaya, East Java, Indonesia. IOP Conf. Ser. Earth Environ. Sci. 2021, 753, 012022. [Google Scholar] [CrossRef]
  71. Lee, C.Y.; Huh, S.Y. Forecasting the diffusion of renewable electricity considering the impact of policy and oil prices: The case of South Korea. Appl. Energy 2017, 197, 29–39. [Google Scholar] [CrossRef]
  72. Nam, H. Impact of nuclear phase-out policy and energy balance in 2029 based on the 8th Basic Plan for long-term electricity supply and demand in South Korea. Renew. Sustain. Energy Rev. 2020, 122, 109723. [Google Scholar] [CrossRef]
  73. Alshehry, A.S.; Belloumi, M. Energy consumption, carbon dioxide emissions and economic growth: The case of Saudi Arabia. Renew. Sustain. Energy Rev. 2015, 41, 237–247. [Google Scholar] [CrossRef]
  74. Mosly, I.; Makki, A.A. Current status and willingness to adopt renewable energy technologies in Saudi Arabia. Sustainability 2018, 10, 4269. [Google Scholar] [CrossRef] [Green Version]
Figure 1. Research phases.
Sustainability 14 02084 g001
Figure 2. Percentage of renewable electricity generation in G20 countries (1990–2020).
Sustainability 14 02084 g002
Figure 3. Ranking of G20 countries according to the participation of renewable sources in the country’s electricity generation (in 2020).
Sustainability 14 02084 g003
Figure 4. Quantity of renewable electricity production (GWh) in the G20 countries (1990–2020).
Sustainability 14 02084 g004
Figure 5. Electricity production (MWh) per habitant in the G20 countries in 2020.
Sustainability 14 02084 g005
Figure 6. Electricity production and CO2 emission in G20.
Sustainability 14 02084 g006
Figure 7. Individual Electricity production and CO2 emission in countries of G20.
Sustainability 14 02084 g007
Figure 8. Multiple linear regression.
Sustainability 14 02084 g008
Figure 9. ANOVA results.
Sustainability 14 02084 g009
Figure 10. Weight of variables in the analyzed model.
Sustainability 14 02084 g010
Table 1. Total and per capita CO2 emission of the G20 countries in 2019.
CountryCO2 Emission (Mt)CO2 Per Capita (Mt)
Canada5710.0000152
Australia380.70.000015
United States4744.50.0000145
Saudi Arabia495.20.0000144
Russia Federation1640.30.0000114
Korea585.70.0000113
Japan1056.20.0000084
Germany644.10.0000078
South Africa433.60.0000074
China9919.10.0000071
European Union2993.50.0000067
Italy309.30.0000052
United Kingdom342.20.0000051
Turkey366.40.0000044
France293.90.0000044
Argentina162.20.0000036
Mexico419.40.0000033
Indonesia583.40.0000022
Brazil4110.0000019
India23100.0000017
Table 2. GDP and renewable percentage of the electricity matrix in the G20 in 2020.
CountryGDP
(Current US$)
% Renewable Sources in the Electrical Matrix
United States2.09 × 10¹³19.10%
European Union1.53 × 10¹³45.10%
China1.47 × 10¹³28.00%
Japan5.06 × 10¹²19.50%
Germany3.85 × 10¹²37.60%
United Kingdom2.76 × 10¹²33.90%
India2.66 × 10¹²18.40%
France2.63 × 10¹²23.70%
Italy1.89 × 10¹²36.60%
Canada1.64 × 10¹²66.40%
Korea1.64 × 10¹²5.10%
Russia Federation1.48 × 10¹²20.30%
Brazil1.44 × 10¹²75.10%
Australia1.33 × 10¹²21.30%
Mexico1.07 × 10¹²18.80%
Indonesia1.06 × 10¹²12.30%
Turkey7.20 × 10¹¹40.60%
Saudi Arabia7.00 × 10¹¹0.10%
Argentina3.89 × 10¹¹24.20%
South Africa3.35 × 10¹¹6.90%
Publisher’s Note: MDPI stays neutral with regard to jurisdictional claims in published maps and institutional affiliations.

