Article

Impact of Land Use Changes on the Surface Runoff and Nutrient Load in the Three Gorges Reservoir Area, China

1
Department of Environmental Science &Engineering, School of Resource and Environmental Sciences, Wuhan University, Wuhan 430079, China
2
Changjiang Survey Planning Design and Research Co., Ltd., Wuhan 430010, China
3
State Key Laboratory of Water Resources and Hydropower Engineering Science, Wuhan University, Wuhan 430072, China
4
China Institute of Development Strategy and Planning, Wuhan University, Wuhan 430079, China
5
Department of Hydrology and Water Resources Engineering, School of Water Resources and Hydropower, Wuhan University, Wuhan 430072, China
6
Bureau of Hydrology, Changjiang Water Resources Commission, Wuhan 430010, China
7
Water Environment Institute, Chinese Academy for Environmental Planning, Beijing 100012, China
*
Author to whom correspondence should be addressed.
Sustainability 2022, 14(4), 2023; https://doi.org/10.3390/su14042023
Submission received: 14 January 2022 / Revised: 27 January 2022 / Accepted: 31 January 2022 / Published: 10 February 2022

Abstract

:
Dramatic changes in land use/cover (LULC) patterns have taken place in the Three Gorges Reservoir Area (TGRA) after the construction of the Three Gorges Dam, which have led to hydrological and environment alterations. In this study, eight land use scenarios from 1980 to 2018 were used to evaluate the impact of LULC changes on runoff and nutrient load in the TGRA, using a validated version of the Soil & Water Assessment Tool (SWAT) model. Firstly, we analyzed the LULC characteristic. During the 38-year period, the LULC pattern showed an increase in forestland and a decrease in cropland. The cropland mainly changed into forestland. Construction land realized growth by encroaching mainly on cropland and forestland. Secondly, the temporal–spatial characteristics of runoff and nutrient load were analyzed. In the TGRA, surface runoff and nutrient load exhibited significant tempo-spatial heterogeneity. The runoff depth and the total nitrogen (TN) and total phosphorus (TP) loads increased through 1980 to 2018, and 2005 was a turning point. After 2005, the annual average change rate was larger than before 2005. The area with a larger runoff depth was mainly distributed in the head and middle region as well as on the left bank of the TGRA. The middle and tail region of the TGRA generated relatively higher TN and TP loads. Lastly, the contributions of LULC types on runoff and nutrient load were explored. Forestland had the highest contribution rate to surface runoff, followed by cropland. Cropland had the highest contribution rate to TN and TP, follow by forestland. This study can provide a better understanding of the hydrological consequences of LULC changes and help watershed management in the TGRA.

1. Introduction

Land use/cover (LULC) has vital potential in maintaining ecological and environmental processes, providing ecosystem services and ecosystem resilience at multi-spatial scales [1,2,3,4]. The LULC change at the watershed scale would lead to regional hydrological and environmental alterations [5,6], which would affect ecosystem services and disturb regional ecosystem structures. A good understanding of LULC changes and their hydrological and environmental effects is important for refined watershed management [7,8,9,10]. Therefore, a good understanding of LULC dynamics and the resulting hydrological and environmental effects is crucial and vital for managing the watershed eco-environment and regulating human activities.
The causes of LULC changes such as urbanization, deforestation and agricultural practices have different pathways for affecting watershed hydrological processes and the water environment [7,10]. The significant impact of LULC changes on hydrology and nitrate load at the watershed scale over time and space has been widely documented [10,11,12,13,14,15]. For example, Yang et al. [15] found that LULC change reduced runoff divergently over different regions in the North American east coast and that its impacts were more significant at local and watershed spatial scales than at regional scales. Xia et al. [16] found that impervious surfaces were the most important LULC types driving nutrient concentrations by linking nutrient concentrations with land-use types and rainfall runoff. In order to reduce nitrate load with runoff into water body, it is of great importance to accurately quantify runoff generation and nutrient load under different LULC types and to identify the critical time and areas of the nutrient load from the watershed [17,18]. This information would enable targeted environmental protection policies for watershed management. However, regarding the landscape heterogeneity and multiple transport pathways involved, it can be challenging to quantify runoff and nutrient load from various LULC types.
As computer science developed, hydrological models began to provide a framework for studying the relationships among the LULC changes and related water cycle response at the watershed scale [5,19]. Current studies of the physical-based watershed hydrological models have received much attention, such as the HBV model [20,21,22], HSPF [23,24], L-THIA [3,25], VIC [26,27], MIKE-SHE [28,29] and SWAT [5,30]. Among these models, SWAT is one of the most popular models for investigating hydrological and environmental responses to driving force changes in watersheds [31,32,33], and it has been widely used in assessing land use change [5,30], climate change [34,35] and management optimization [36,37].
The Three Gorges Reservoir Area (TGRA), one of the most ecologically vulnerable areas in China, faces problems of non-point source pollution [38,39] and soil erosion [40,41] due to intensive anthropogenic activities and its complex topography. The land use structure and reconstituted landscape pattern changed after the construction of the TGD [42,43,44]. Many papers have evaluated LULC change issues in the TGRA [45,46,47]. For example, Huang et al. [47] analyzed the spatio-temporal variations in LULC types and quantified the LULC–environment relationships in the TGRA. Previous studies mostly concentrated LULC changes on administrative divisions. However, the hydrological response of LULC changes is more related to watershed division [48]. Few studies have investigated the long-term LULC changes for the whole watershed of the TGRA.
Regarding hydrological and environmental impacts, many papers have evaluated issues of LULC change, which provide a prerequisite for understanding the eco-environment change in the TGRA. However, this research mainly focuses on sub-watershed scales [44,49,50,51], which result in a difficulty of revealing regional impact–response processes. A few research perspectives take the entire Three Gorges basin as their research object to explore the impact of possible LULC changes on water environmental issues in the TGRA. Shen et al. [52] and Shen et al. [39] explored nutrient loads and causal factors from different LULC and soil types. Chen et al. [53] identified the influence of the landscape pattern on the spatial distribution difference of hydrologic processes and water quality in the TGRA. Nevertheless, these studies only focused on single temporal scales. The regional economy was boosted by the Three Gorges Project and regional population growth, both of which exacerbated land use conflicts [54]. To better understand the hydrological process during the last few decades, it is of great significance to clarify the long-term relationships between the LULC changes and the hydrological and environmental responses to ensure water environment security in the TGRA.
In this study, remote satellite images were used to explore the spatio-temporal variations of LULC types in the period from 1980 to 2018 in the TGRA. The Soil and Water Assessment Tool (SWAT) was introduced to explore the hydrological process and nutrient load response to LULC changes. The objective of this study was: (1) to investigate the LULC changes from 1980 to 2018; (2) to estimate the impact of the LULC changes on surface runoff and nutrient load in the TGRA; (3) to quantify the contribution of LULC types on surface runoff and nutrient load. This study was implemented to provide a scientific basis for improving land use management policy, to reconcile the land use conflicts and to support sustainable land use planning and management of water resources in the TGRA.

2. Materials and Methods
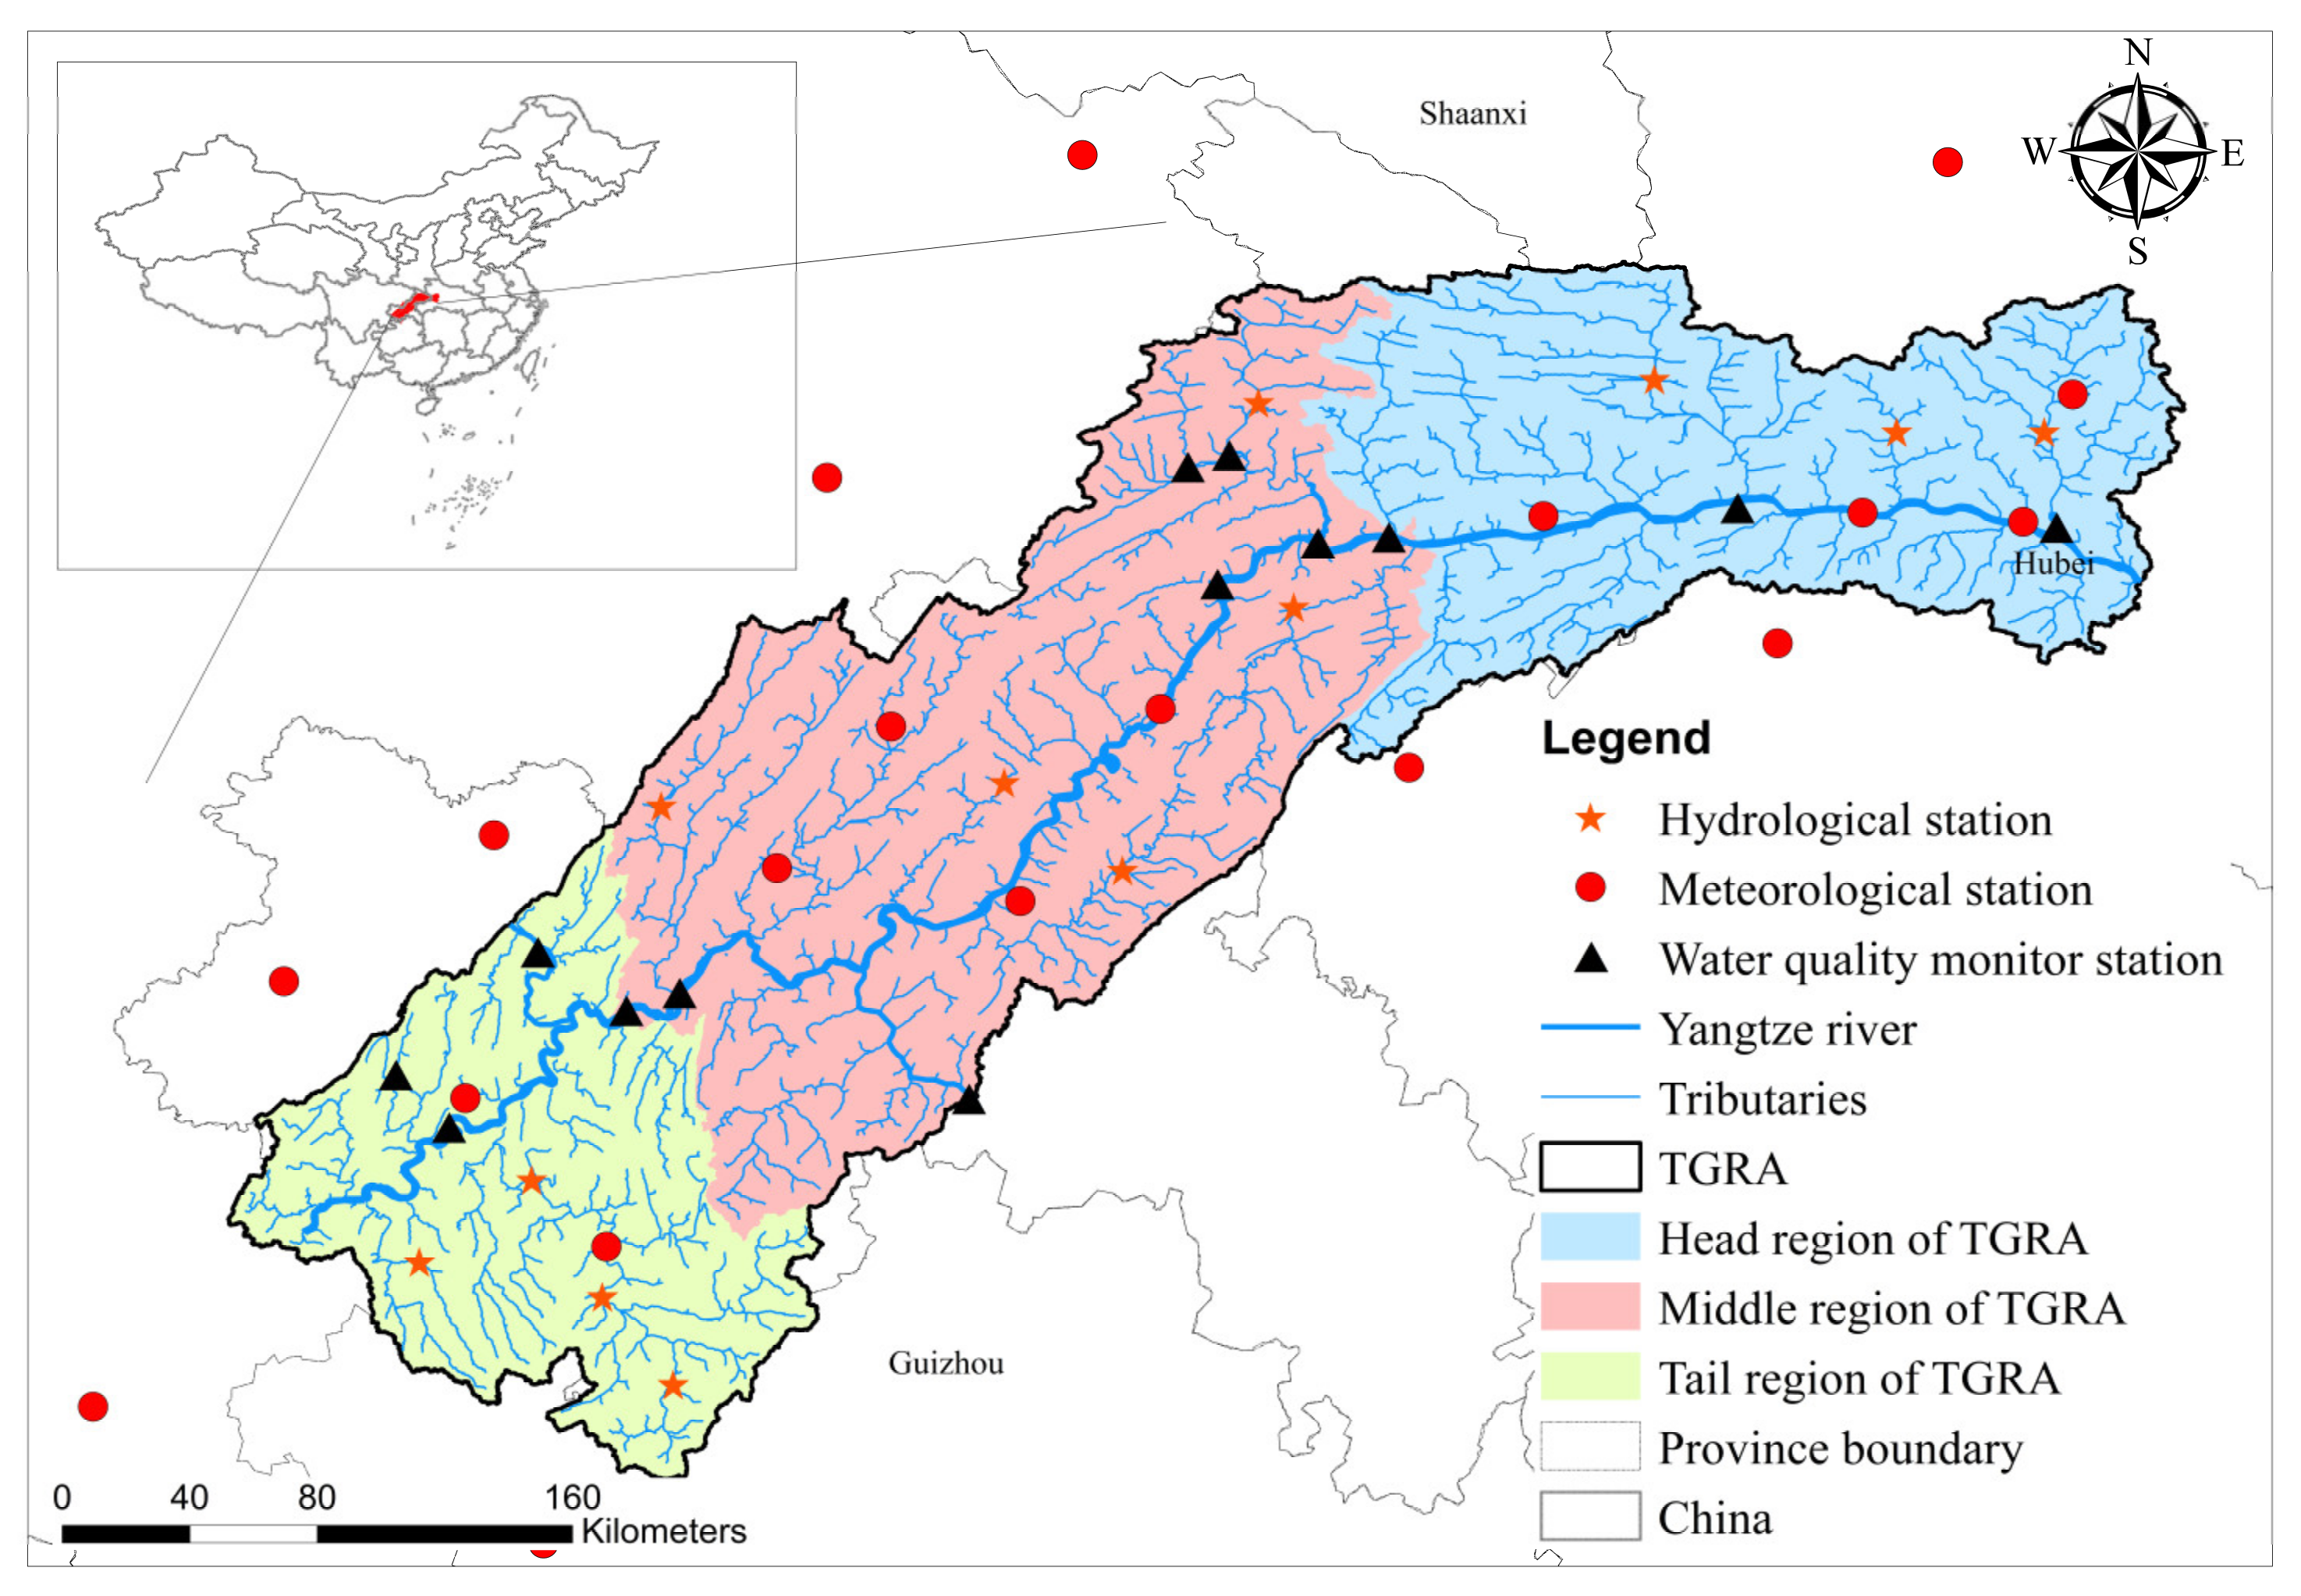
2.1. Study Area

The catchment area of the TGRA covers 64,000 km2 and stretches at a river length of about 660 km long starting from the TGD. The terrain of the TGRA is characterized by gently undulating hills and plains (Figure 1). The watershed lies between 28°10′ and 32°13′ N latitude and from 105°17′ to 110°11′ E longitude with an altitude variation from 73 m to 3105 m. The dominant soil types of the TGRA are purple, limestone and yellow earths. The TGRA is predominantly under a cropland and forestland landscape. The TGRA experiences a subtropical monsoon climate in which the mean annual temperature is around 18 °C. The average annual precipitation is approximately 1400 mm, with about 80% occurring from April to October. Annual water surface evaporation in this region ranges from 900 mm to 1530 mm.

2.2. Analysis of LULC Change

2.2.1. The LULC Change Rate Model

The dynamic degree of a certain LULC type refers to the rate of change of this type of LULC area over a period, expressed by the following formula:
S i = L b L a L a × T × 100 %
where S i is the change rate of LULC type i , and L a   a n d   L b are the area of LULC type i at the beginning and the end of the research, respectively. T is the duration of the research. The dynamic change of six LULC types in the TGRA from 1980 to 2018 is analyzed in Section 3.1.

2.2.2. Regression Analysis Model

The ArcGIS software was employed to calculate the area percentages. To describe the changing trend of LULC, a least-squares linear regression model was applied:
y = a x + b
where x is the time (yr), y is the area percentage of a LULC type (%), a is the modelled slope (%·yr−1), and b is the intercept of the regression model. A negative slope means a decreasing trend, whereas a positive value means the opposite. The t-test was used to test the significance of the model slope, and the p-value was used to record the significance of the model slope.

2.2.3. LULC Transfer Matrix

Based on the spatial analysis method, the LULC maps of different periods were superimposed and the patch change information of each LULC type was extracted. The LULC type information transmission results in each study period were combined to obtain the LULC change situation, to determine the main conversion direction of LULC change and to highlight the main dynamic events.
A i j = A 11 A 12 A 21 A 22 A 1 n A 2 n A n 1 A n 2 A n n
where A i j is the area percentage of LULC type i converting from type j (%) during a time period. n is the total number of LULC types and was equal to six in this study.

2.3. SWAT Model

2.3.1. Model Input

The SWAT model is a physical-process-based river basin model [55] with the ability to predict the impact of land use and management on water, sediment and nutrients in ungauged watersheds [56].
The basic model input data in this study are presented in Table 1. The LULC maps of the TGRA in 1980, 1990, 1995, 2000, 2005, 2010, 2015 and 2018 were provided by the Resource and Environment Science and Data Center. The dataset was derived from Landsat imageries using visual interpretation [57] with a resolution of 100 m. The LULC data was classified into six types (Table 2).
The Digital Elevation Model (DEM) data was 30 × 30 m and derived from the Chinese Academy of Sciences Data Mirror to extract the topographic information needed for hydrological modeling (Figure S1A). The soil types were interpreted from the Chinese national soil map with a scale of 1:500,000, obtained from the Institute of Soil Science, Chinese Academy of Sciences. The soil map was categorized into 29 types (Figure S1B).
The river network and hydrological monitoring data of the TGRA were obtained from the Hydrological Bureau, Yangtze River Water Conservancy Commission. The daily meteorological data from 1980 to 2018 of 22 meteorological stations were obtained from the National Meteorological Information Center. Industrial point sources from 2015 in the TGRA were provided by the Hubei Environmental Monitoring Center Station and Chongqing Academy of Environmental Science. Daily streamflow data from 2010 to 2013 and monthly water quality monitoring data from 2010 to 2013 were used to calibrate and validate the SWAT model. These observed data were collected from the Hydrological Bureau, Yangtze River Water Conservancy Commission and Hydrological Statistical Yearbooks, including the locations of meteorological stations, hydrological stations and water quality monitoring stations (Figure 1). Sewage from rural and urban areas was estimated as the input to the model based on investigation and statistics yearbooks.

2.3.2. Model Setup

The TGRA is partitioned into 26 sub-basins, as described in our previous study [53]. In order to better recognize the critical area, the whole research area was divided into left bank and right, head, middle and tail regions (as shown in Figure 1); details were given in [53]. Meteorological observation data from 1980 to 2018 were used as the input of the model to drive the land use scenarios in 1980, 1990, 1995, 2000, 2005, 2010, 2015 and 2018. The model warm-up period was set to 2 years, and the simulation period was from 1982 to 2018. The point source emission data of different LULC conditions (1980, 1990, 1995, 2000, 2005, 2010, 2015 and 2018) were scaled through the proportion of the GDP between the scenario year and 2015. The workflow of this study is presented in Figure 2.

2.3.3. Model Calibration and Verification

The SWAT model in the TGRA was calibrated and validated by the SWAT-CUP with the GLUE method. The details of sensitive analysis and model calibration and validation were acquired in our previous study [53,58] and the results showed a promising model performance for further analysis. The calibrated SWAT model was used to run the simulation under different land use conditions from 1980 to 2018. The detailed methodology of the calibration is described in Figure 2.

2.4. Contribution Model

We used the following equation to quantify the contribution of each LULC type:
η i , j = W i , j W i 100 %
where η i , j is the contribution rate of the j type of LULC on the i index; i could be runoff or nutrient load; W i , j is the i index amount of the j LULC type; W i is the total amount of the i index.

3. Results

3.1. LULC Change Characteristics

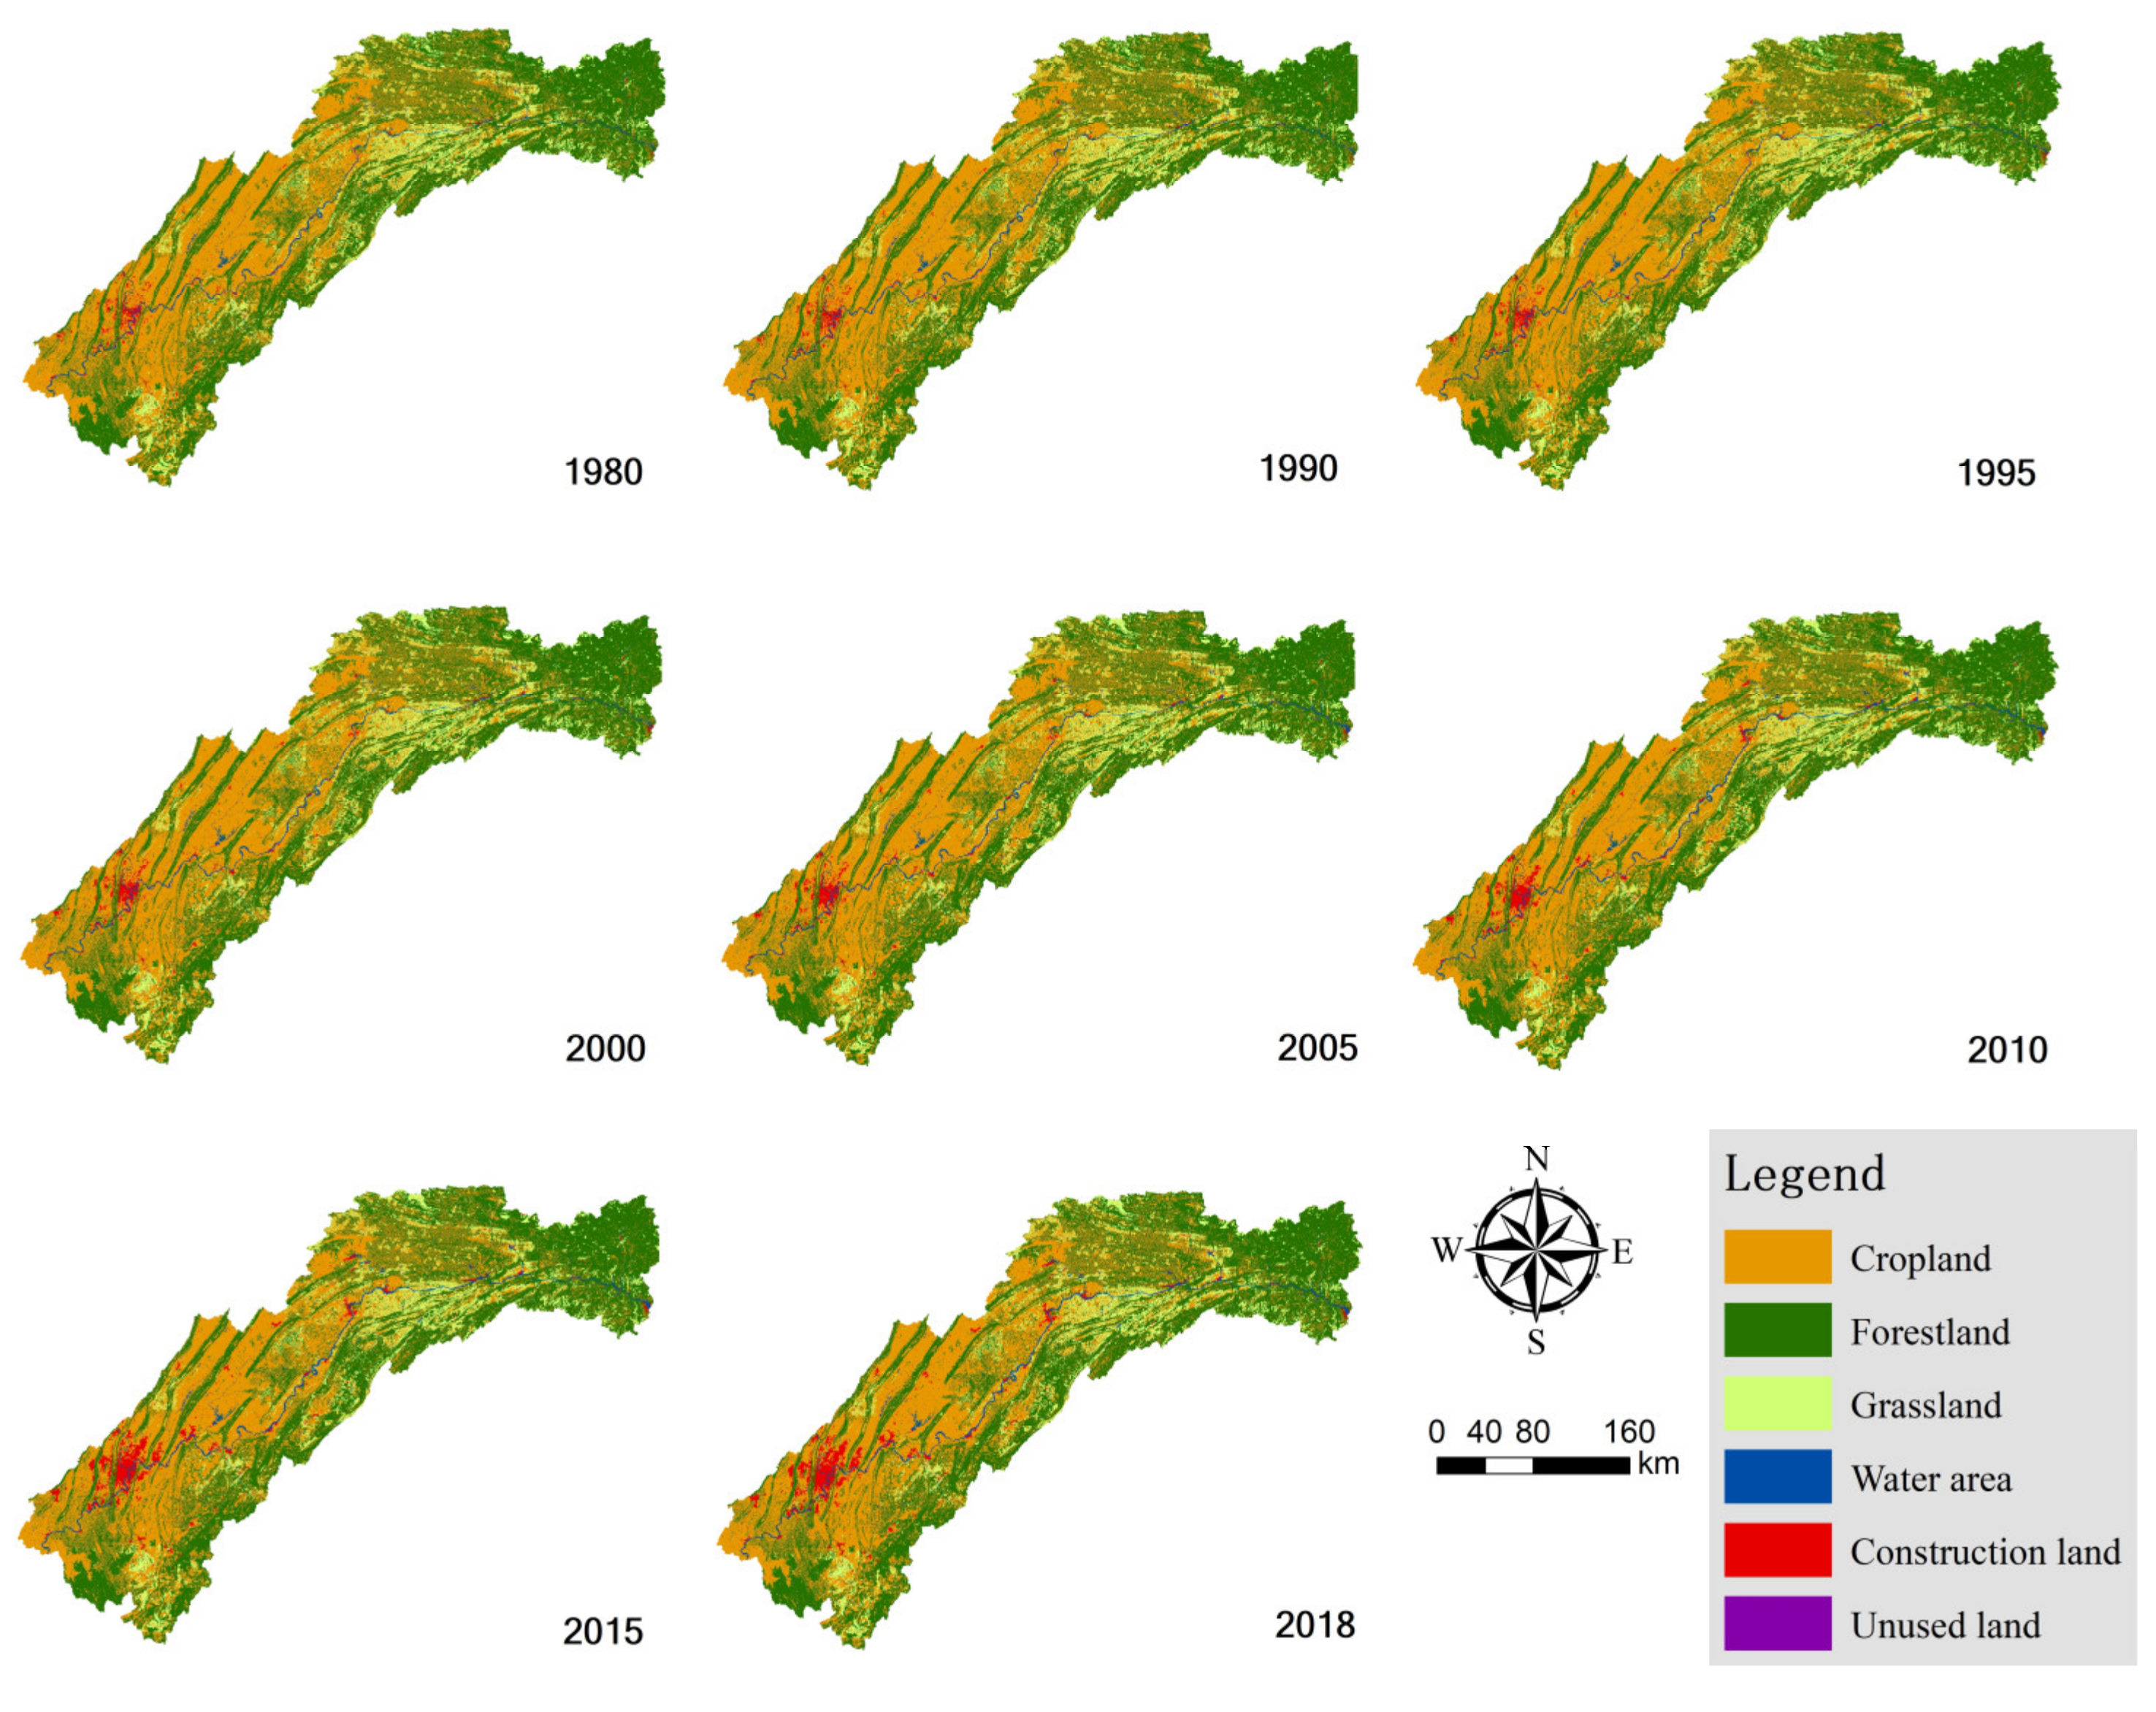
3.1.1. Spatial Characteristics

The LULC distribution of the TGRA exhibited a distinct spatial heterogeneity during the past 40 years from 1980 to 2018 (Figure 3). Cropland and forestland were the most widely distributed types of landscape in the TGRA. Cropland was concentrated in the west and north of the TGRA, whereas forestland was mainly distributed in the east and southwest. The distribution of grassland was relatively scattered, mostly in the southwest and north-central regions of the TGRA. Construction land was mainly distributed along the rivers in large central urban areas. The Chongqing downtown, located west of the TGRA, had the largest urban area, which expended dramatically during previous years. The water area was mainly distributed along the main stream and tributaries of the Yangtze River. The proportion of unused land in the TGRA was very small, which could have been neglected in the analysis.
The annual average proportions of LULC types in banks and regions were calculated (Figure S2). The annual average percentages of the landscape on the left bank of the TGRA were cropland (48.42%) > forestland (40.75%) > grassland (7.57%) > construction land (2.02%) > water area (1.22%) > unused land (0.02%), whereas on the right bank the percentages were forestland (47.10%) > cropland land (37.45%) > grassland (12.53%) > water area (1.85%) > construction land (1.06%) > unused land (0.01%). Cropland had a larger proportion in the middle and the tail of the TGRA. Forestland and grassland were concentrated at the head of the TGRA.

3.1.2. Temporal Tendency

As the two dominant landscapes in the TGRA, cropland and forestland showed significantly different tendencies from 1980 to 2018 (Figures S3 and S4 and Table 3). Cropland decreased from 44.32% to 42.22%, while forestland increased from 43.43% to 43.74%. Grassland fluctuated slightly, declining from 9.88% in 1980 to 9.74% in 2018. The area proportion of the water area and construction land showed a slight increase, from 1.38% to 1.62%, and 0.98% to 2.67%, respectively. The landscape structure of the TGRA changed significantly from 1980 to 2018. The cropland was the main landscape before 2000, followed by forestland and grassland. After 2005, forestland became the dominate landscape, followed by cropland and grassland. Meanwhile, the water area ranked fourth between 2005 and 2010, and the construction land ranked fourth after 2015.
In order to quantify the trend of each LULC type in the TGRA, the area proportion was fitted by the least-squares linear regression model. The slope represents the change trend (%/yr), namely α in Figure S4. The significance of the slope was examined by a t-test (the p-value in Figure S4). Cropland in the TGRA showed a significant yearly decline, with a rate of −0.12. Forestland presented an overall yearly increase, with a rate of 0.02. Grassland had a declining trend, with an average change rate of −0.04. The average change rate of construction land and water area were 4.50 and 0.47, respectively. The LULC change in the TGRA displayed two transition stages. The change trends of the landscape in the TGRA before and after the impoundment of the TGD were distinct. Cropland, forestland and water area were most affected by the operation of the TGD. Before 2000, the area of these three landscape types in the TGRA changed slowly, while it changed significantly after 2000.

3.1.3. Relationships between LULC Change and Topographic Factor

From the perspective of altitude and slope, the distribution of the landscape showed a distinct variation among the vertical spatial zones (Figures S5 and S6). The cropland and construction land were mainly distributed under 500 m and 15 degrees, and there was a linear change from 1980 to 2018 in each zone (Figures S7 and S8). The p-values suggested that altitude and slope were a significant feature of these zones with defined altitudes and slopes.
Among the four altitude zones, the maximum change of cropland and construction land occurred under 500 m, with rates of −0.118 and 0.112, respectively (Figure S7). Among the four slope categories, the maximum change of cropland and construction land occurred under 15 degrees, with rates of −0.086 and 0.075, respectively (Figure S8). The proportion of cropland and construction land decreased with the elevation and slope, while the proportion of forestland showed the opposite trend. Grassland was distributed mostly on slopes between 15 and 30 degrees.

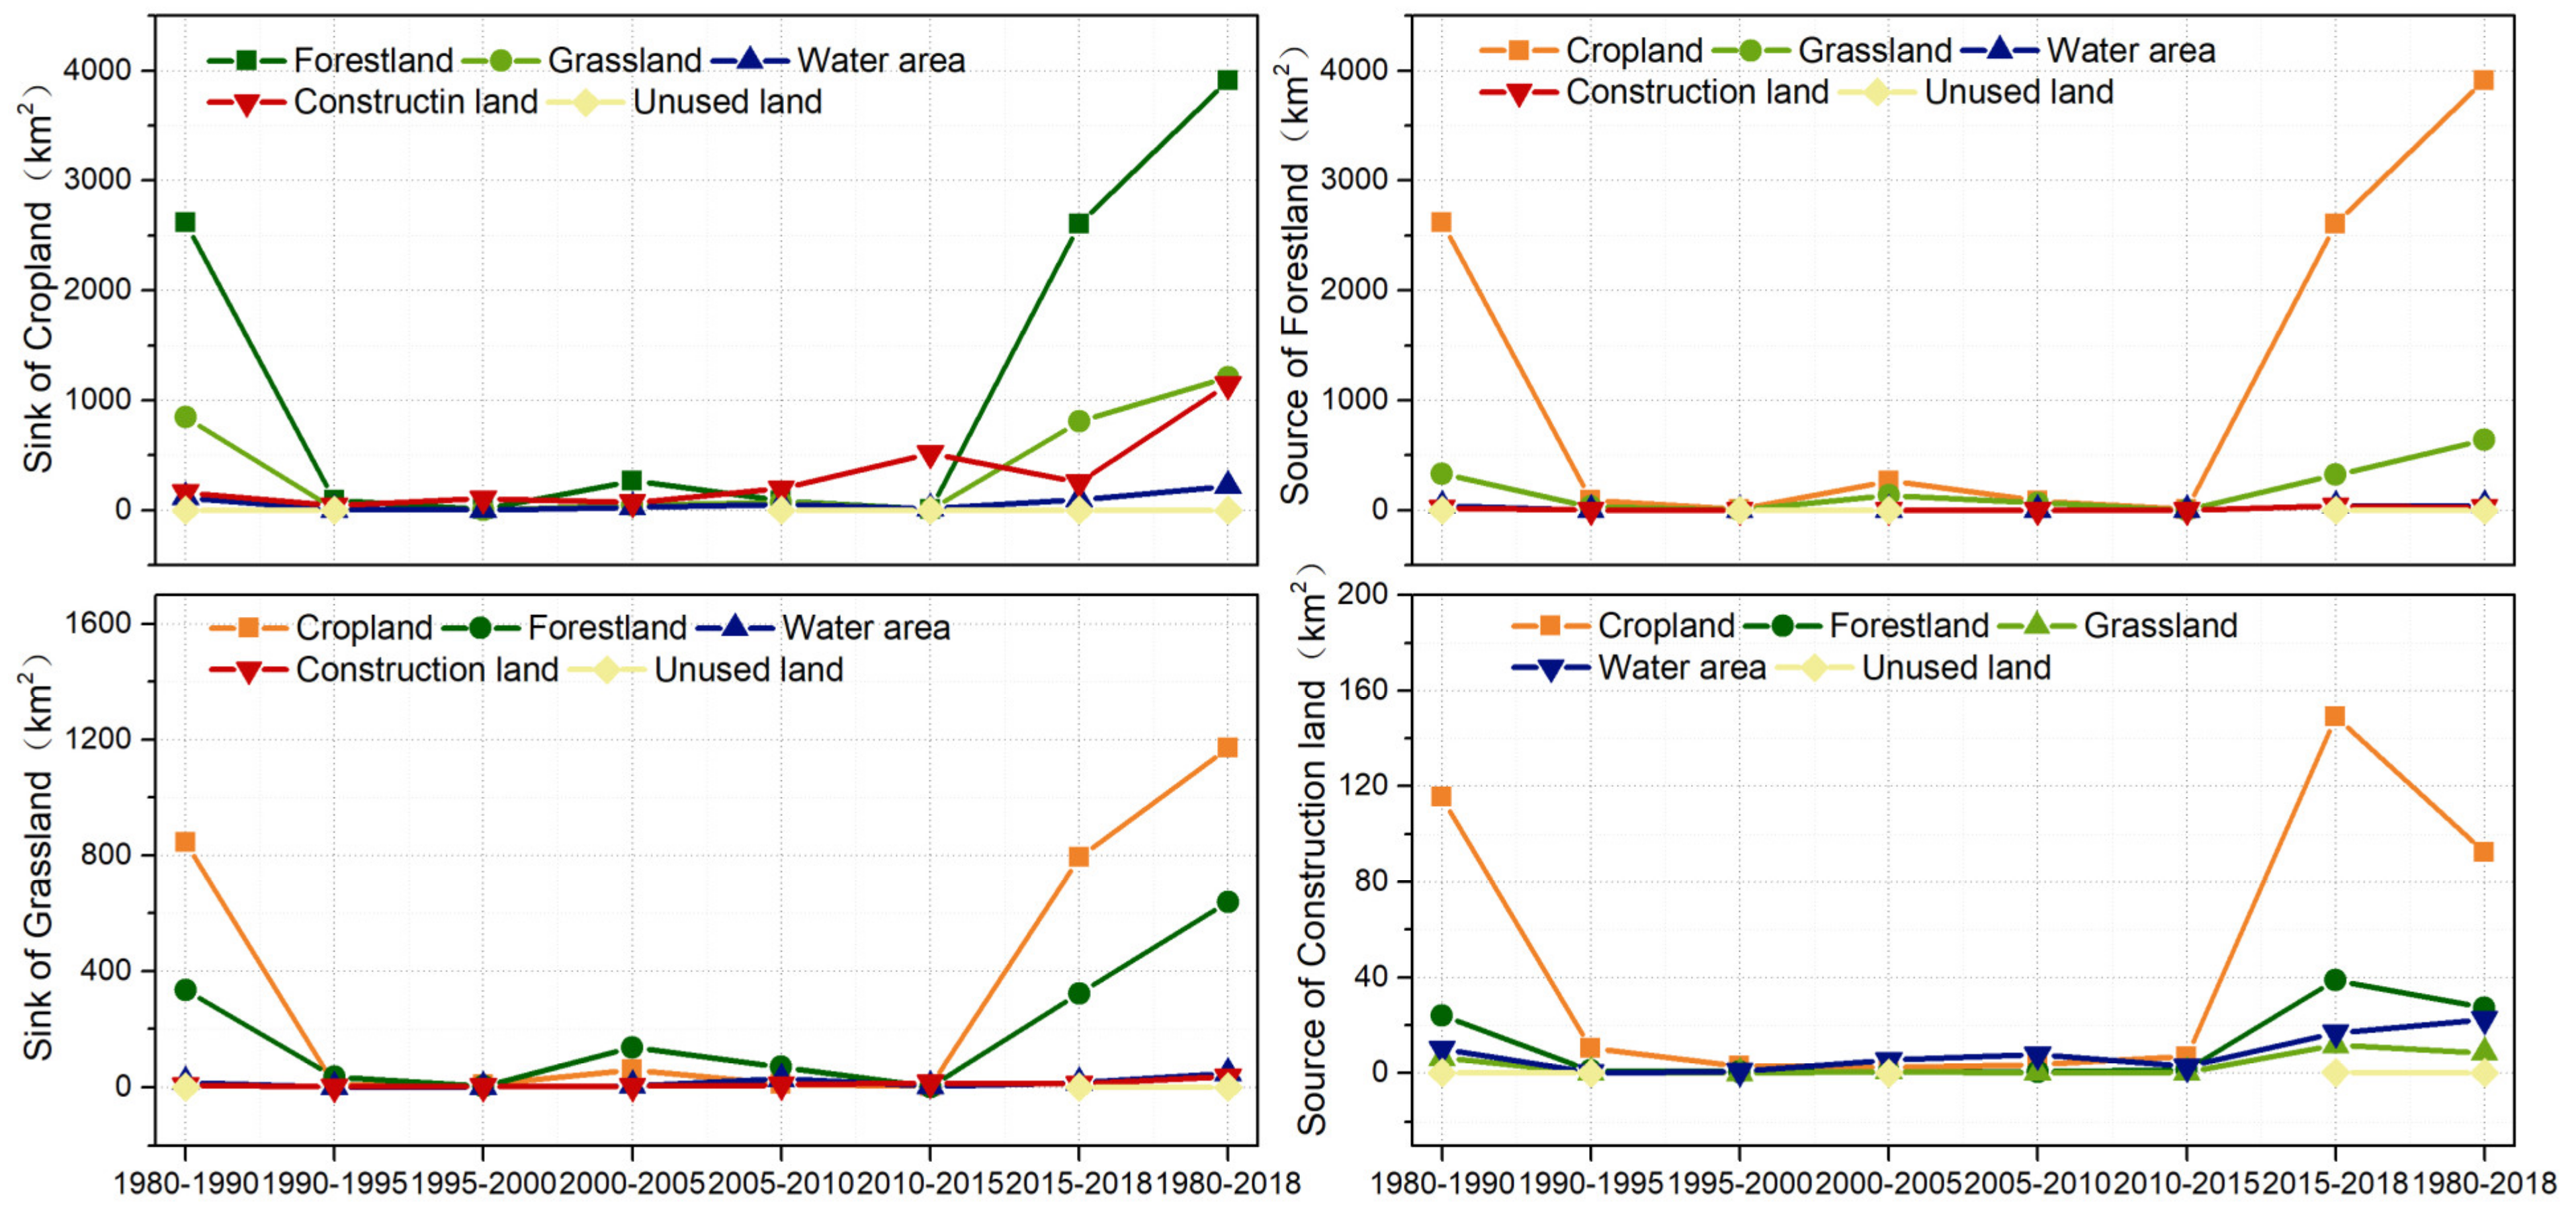
3.1.4. LULC Transfer Analysis

The LULC change in the TGRA displayed distinct transformation phases (Figure 4). These transformations among cropland, forestland, grassland, construction land and water area mainly occurred during 1980–1990 and 2015–2018.
Cropland was mainly changed into forestland, grassland and construction land; this accounts for 60.34%, 18.84% and 17.62% of the total transfer volume, respectively. The transformation of cropland into forestland in 1980 to 1990 and after 2015 reached 5223.87 square kilometers, accounting for 69.56% of the total transformation. The forestland in the TGRA mainly derived from cropland and grassland, accounting for 84.54% and 13.83%, respectively. Similar to the changing trend of cropland, 89.36% of the transformation occurred in 1980–1990 and after 2015. Grassland in the TGRA was mainly converted to cropland and forestland, accounting for 61.84% and 33.77% of the total grassland conversion, respectively. The drastic transformation was also concentrated in 1980–1990 and after 2015. During this period, the amount of grassland transfer accounted for 85.38% of the total transfer amount. In the TGRA, the expansion of construction land occurred mainly through the encroachment of cropland, forestland and water area, accounting for 61.30%, 18.02% and 14.9% of the total expansion, respectively. The peak periods of construction land encroachment on cropland and forestland were concentrated in 1980–1990 and 2015–2018, accounting for 62.83% and 14.96%, respectively. The peak periods of construction land encroachment on water area occurred in 1980–1990, 2015–2018 and 2005–2010, accounting for 23.19%, 38.48% and 17.81% of the water area encroachment, respectively.

3.2. Temporal Tendency and Spatial Variation of Runoff and Nutrient Load

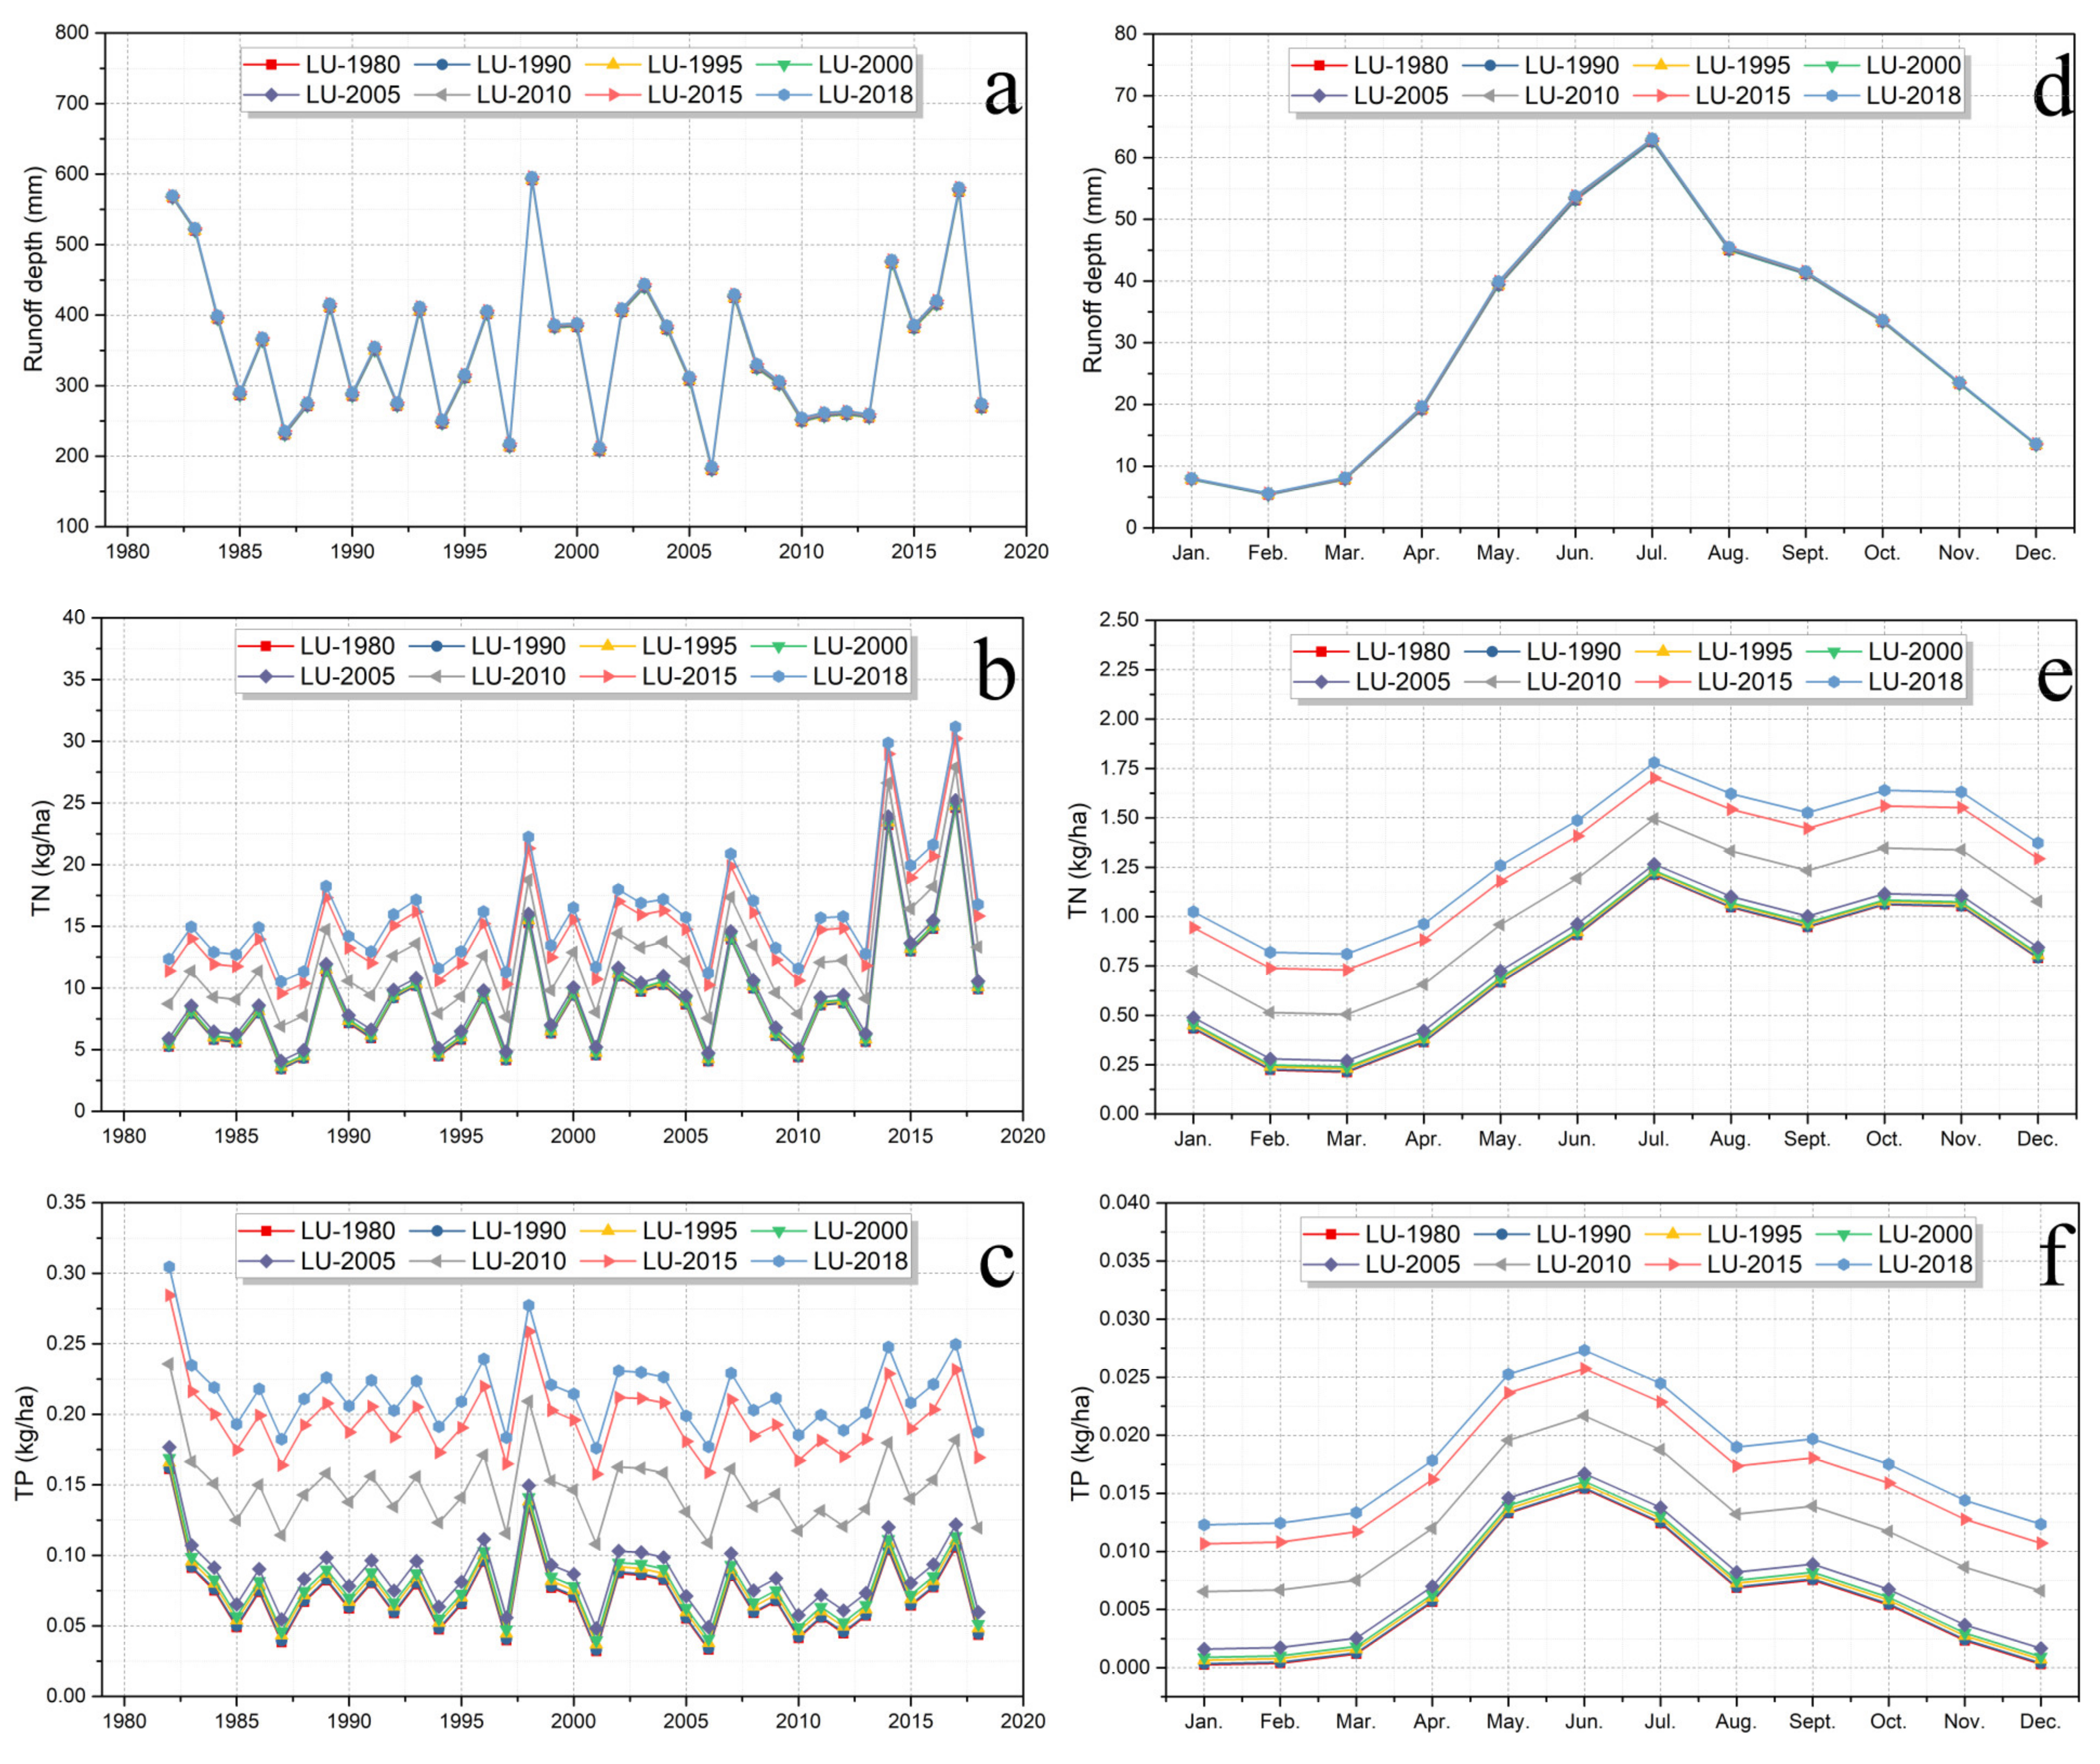
3.2.1. Temporal Tendency

The impact of LULC changes on surface runoff in the TGRA are shown Figure 5a and Figure S9a. The runoff depth in the TGRA showed an increasing trend during 1980 to 2018, but the magnitude of the change was small. Under the conditions of LULC in 1980, the annual average runoff depth of the TGRA was 350.98 mm. The annual average runoff depth of the TGRA was 356.17 mm while using LULC in 2018. The average change rate of runoff depth brought about by LULC changes was 0.156. The annual average change rate of runoff depth was the highest around 2005, which was a turning point.
The TN load in the TGRA presented an increasing trend (Figure 5b and Figure S9b). Under 2018′s LULC condition, the TN load was the highest (15.93 kg/ha). The average changing rate of TN load was 0.191 and the year 2005 was the turning point. Before 2005, the increasing rate of TN load was slow (0.015). After 2005, the TN load showed a trend of rapid growth, with a significantly increasing rate, which was 0.497. Similar to the change trend of TN, the TP load in the TGRA also showed an increasing trend (Figure 5c and Figure S9c), with an average change rate of 0.004. The TP load was the highest under LULC conditions in 2018 (0.215 kg/ha). The change rate of TP was 0.0004 before 2005, while it was 0.0010 after 2005.
The monthly runoff depth, monthly TN load and monthly TP load in the TGRA all showed the trend of LU-2018 > LU-2015 > LU2010 > LU-2005 > LU-2000 > LU-1995 > LU-1990 > LU-1980 (Figure 5d). The changing rate of TN load and TP load was significant, whereas that of runoff depth under different LULC conditions was not (Figure 5e,f). The average runoff depth was the lowest in February, and then gradually increased before reaching its peak in July and decreasing in later months. This was mainly due to precipitation in the TGRA, which was mostly distributed from May to September. The TN load reached a peak in July, while it was lowest in February and March. The TP load reached a peak in June and was lowest in January, February and December.

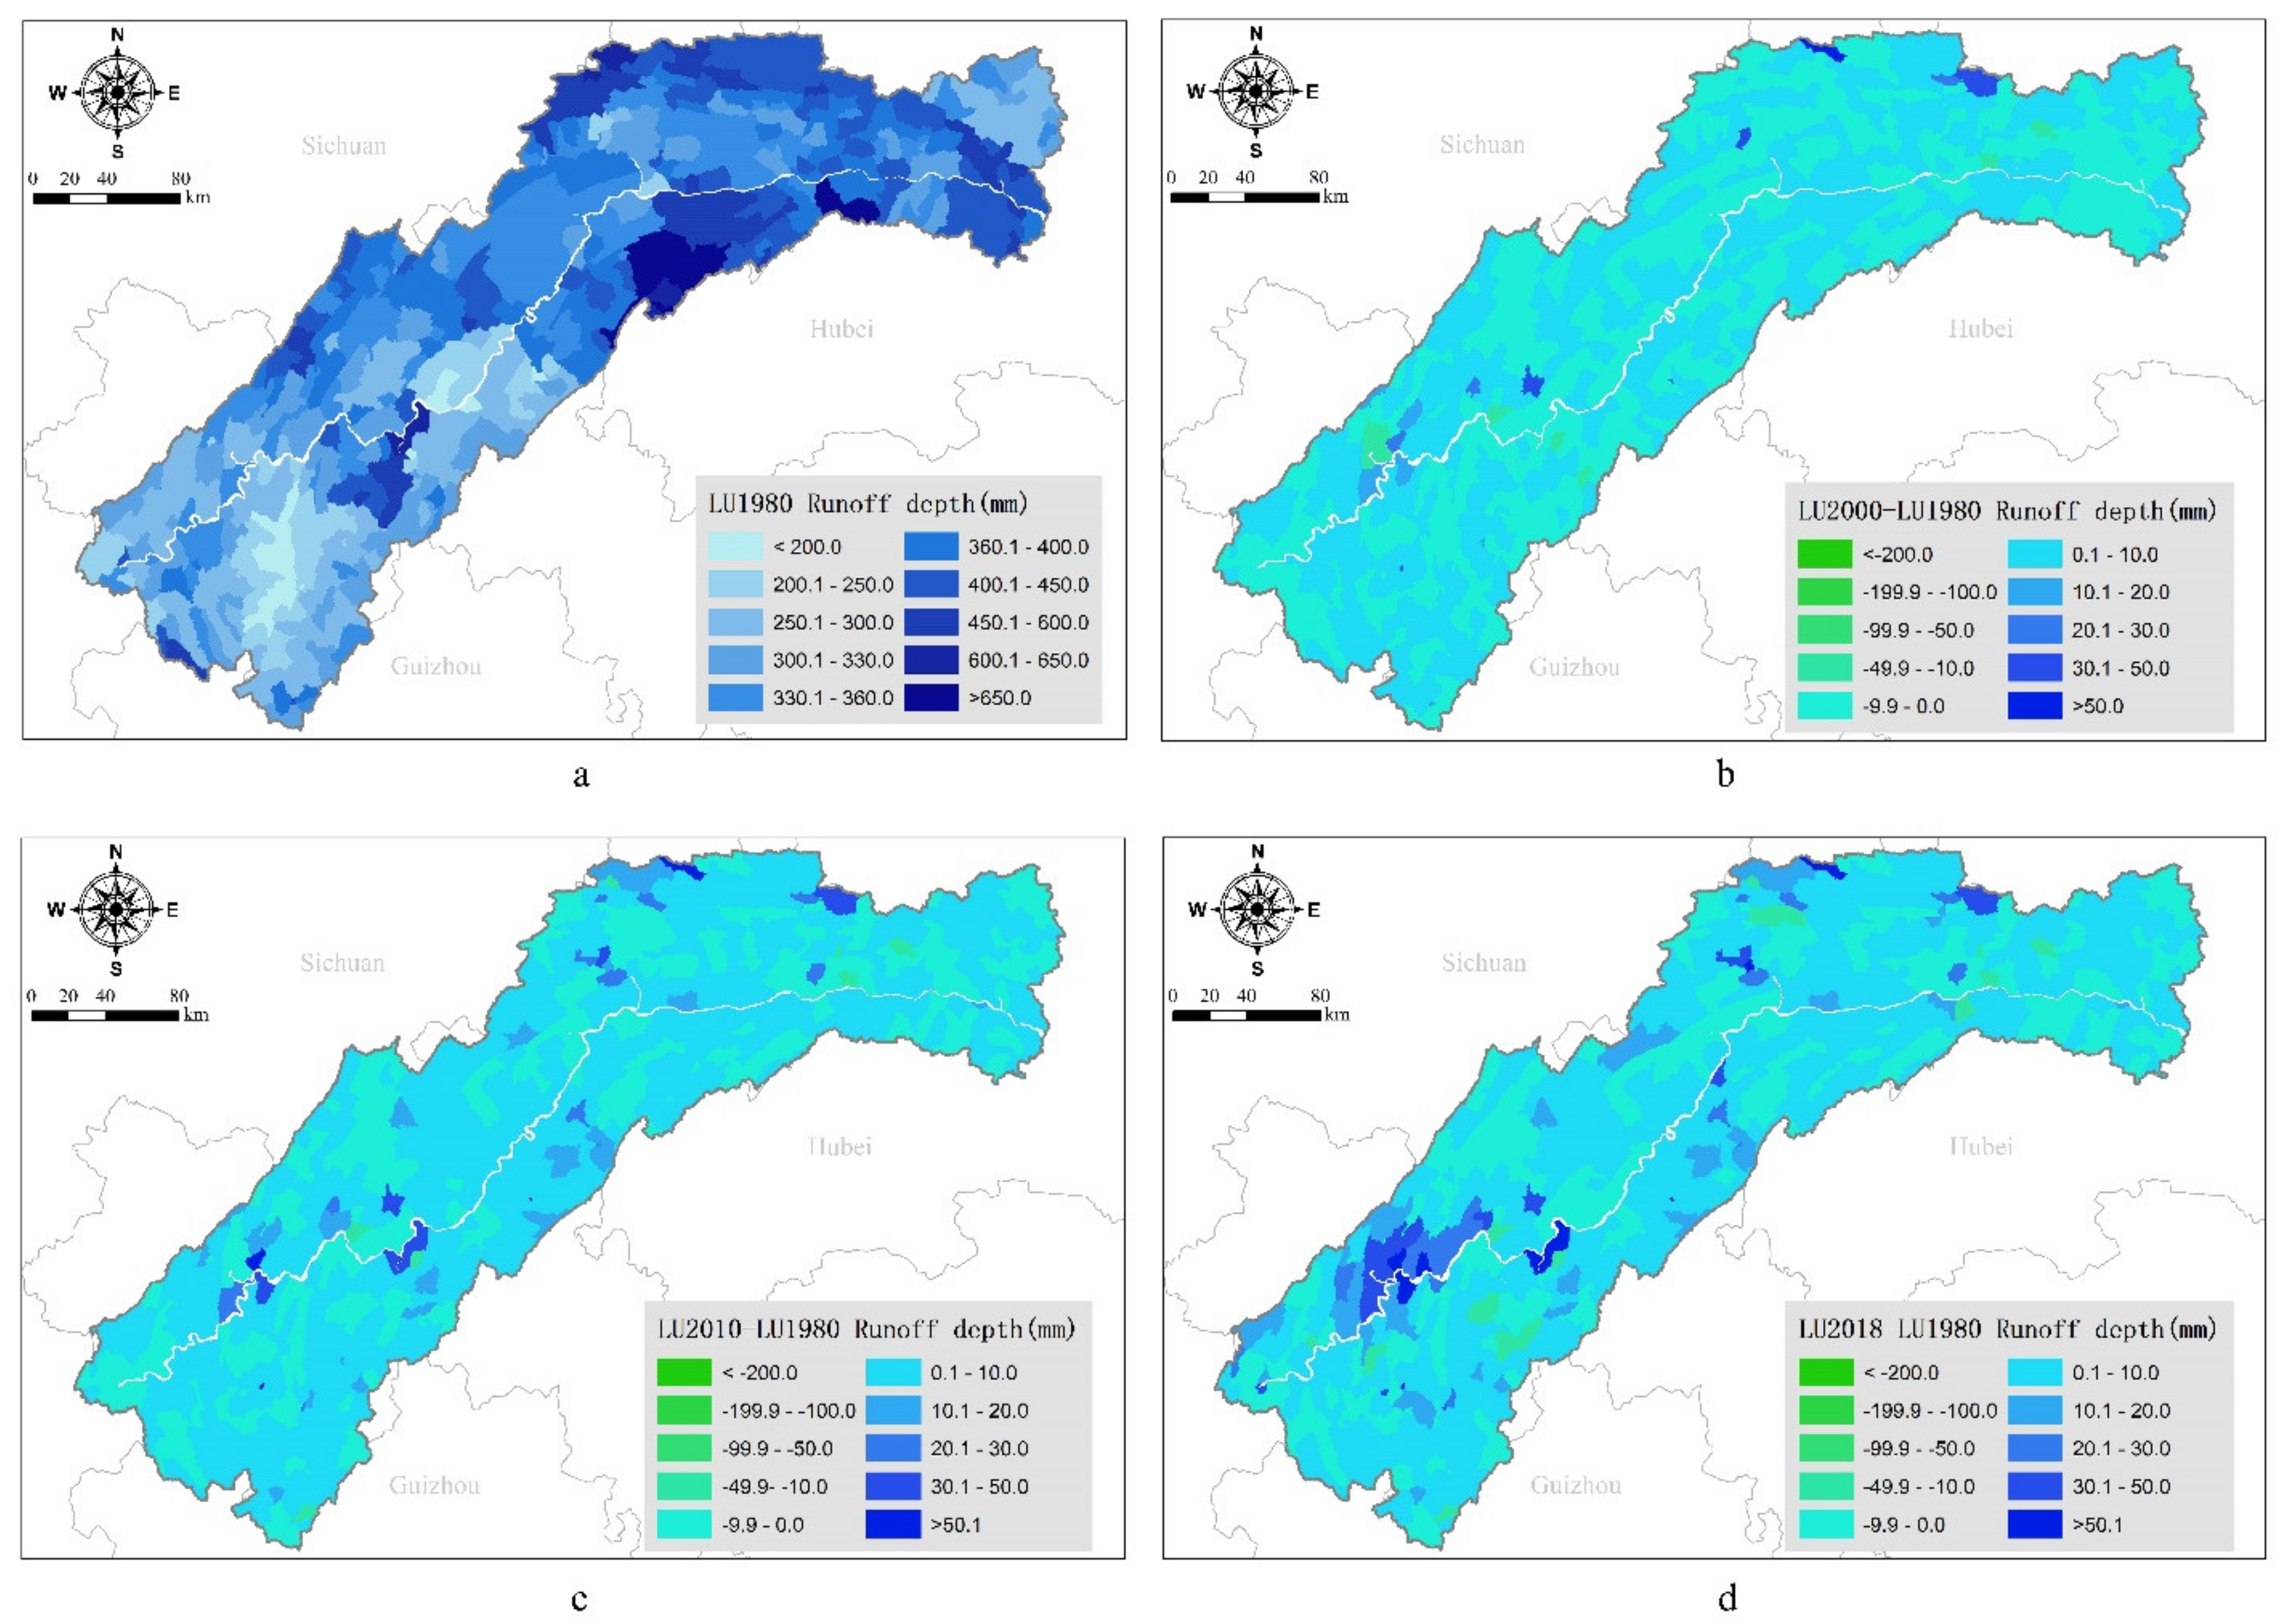
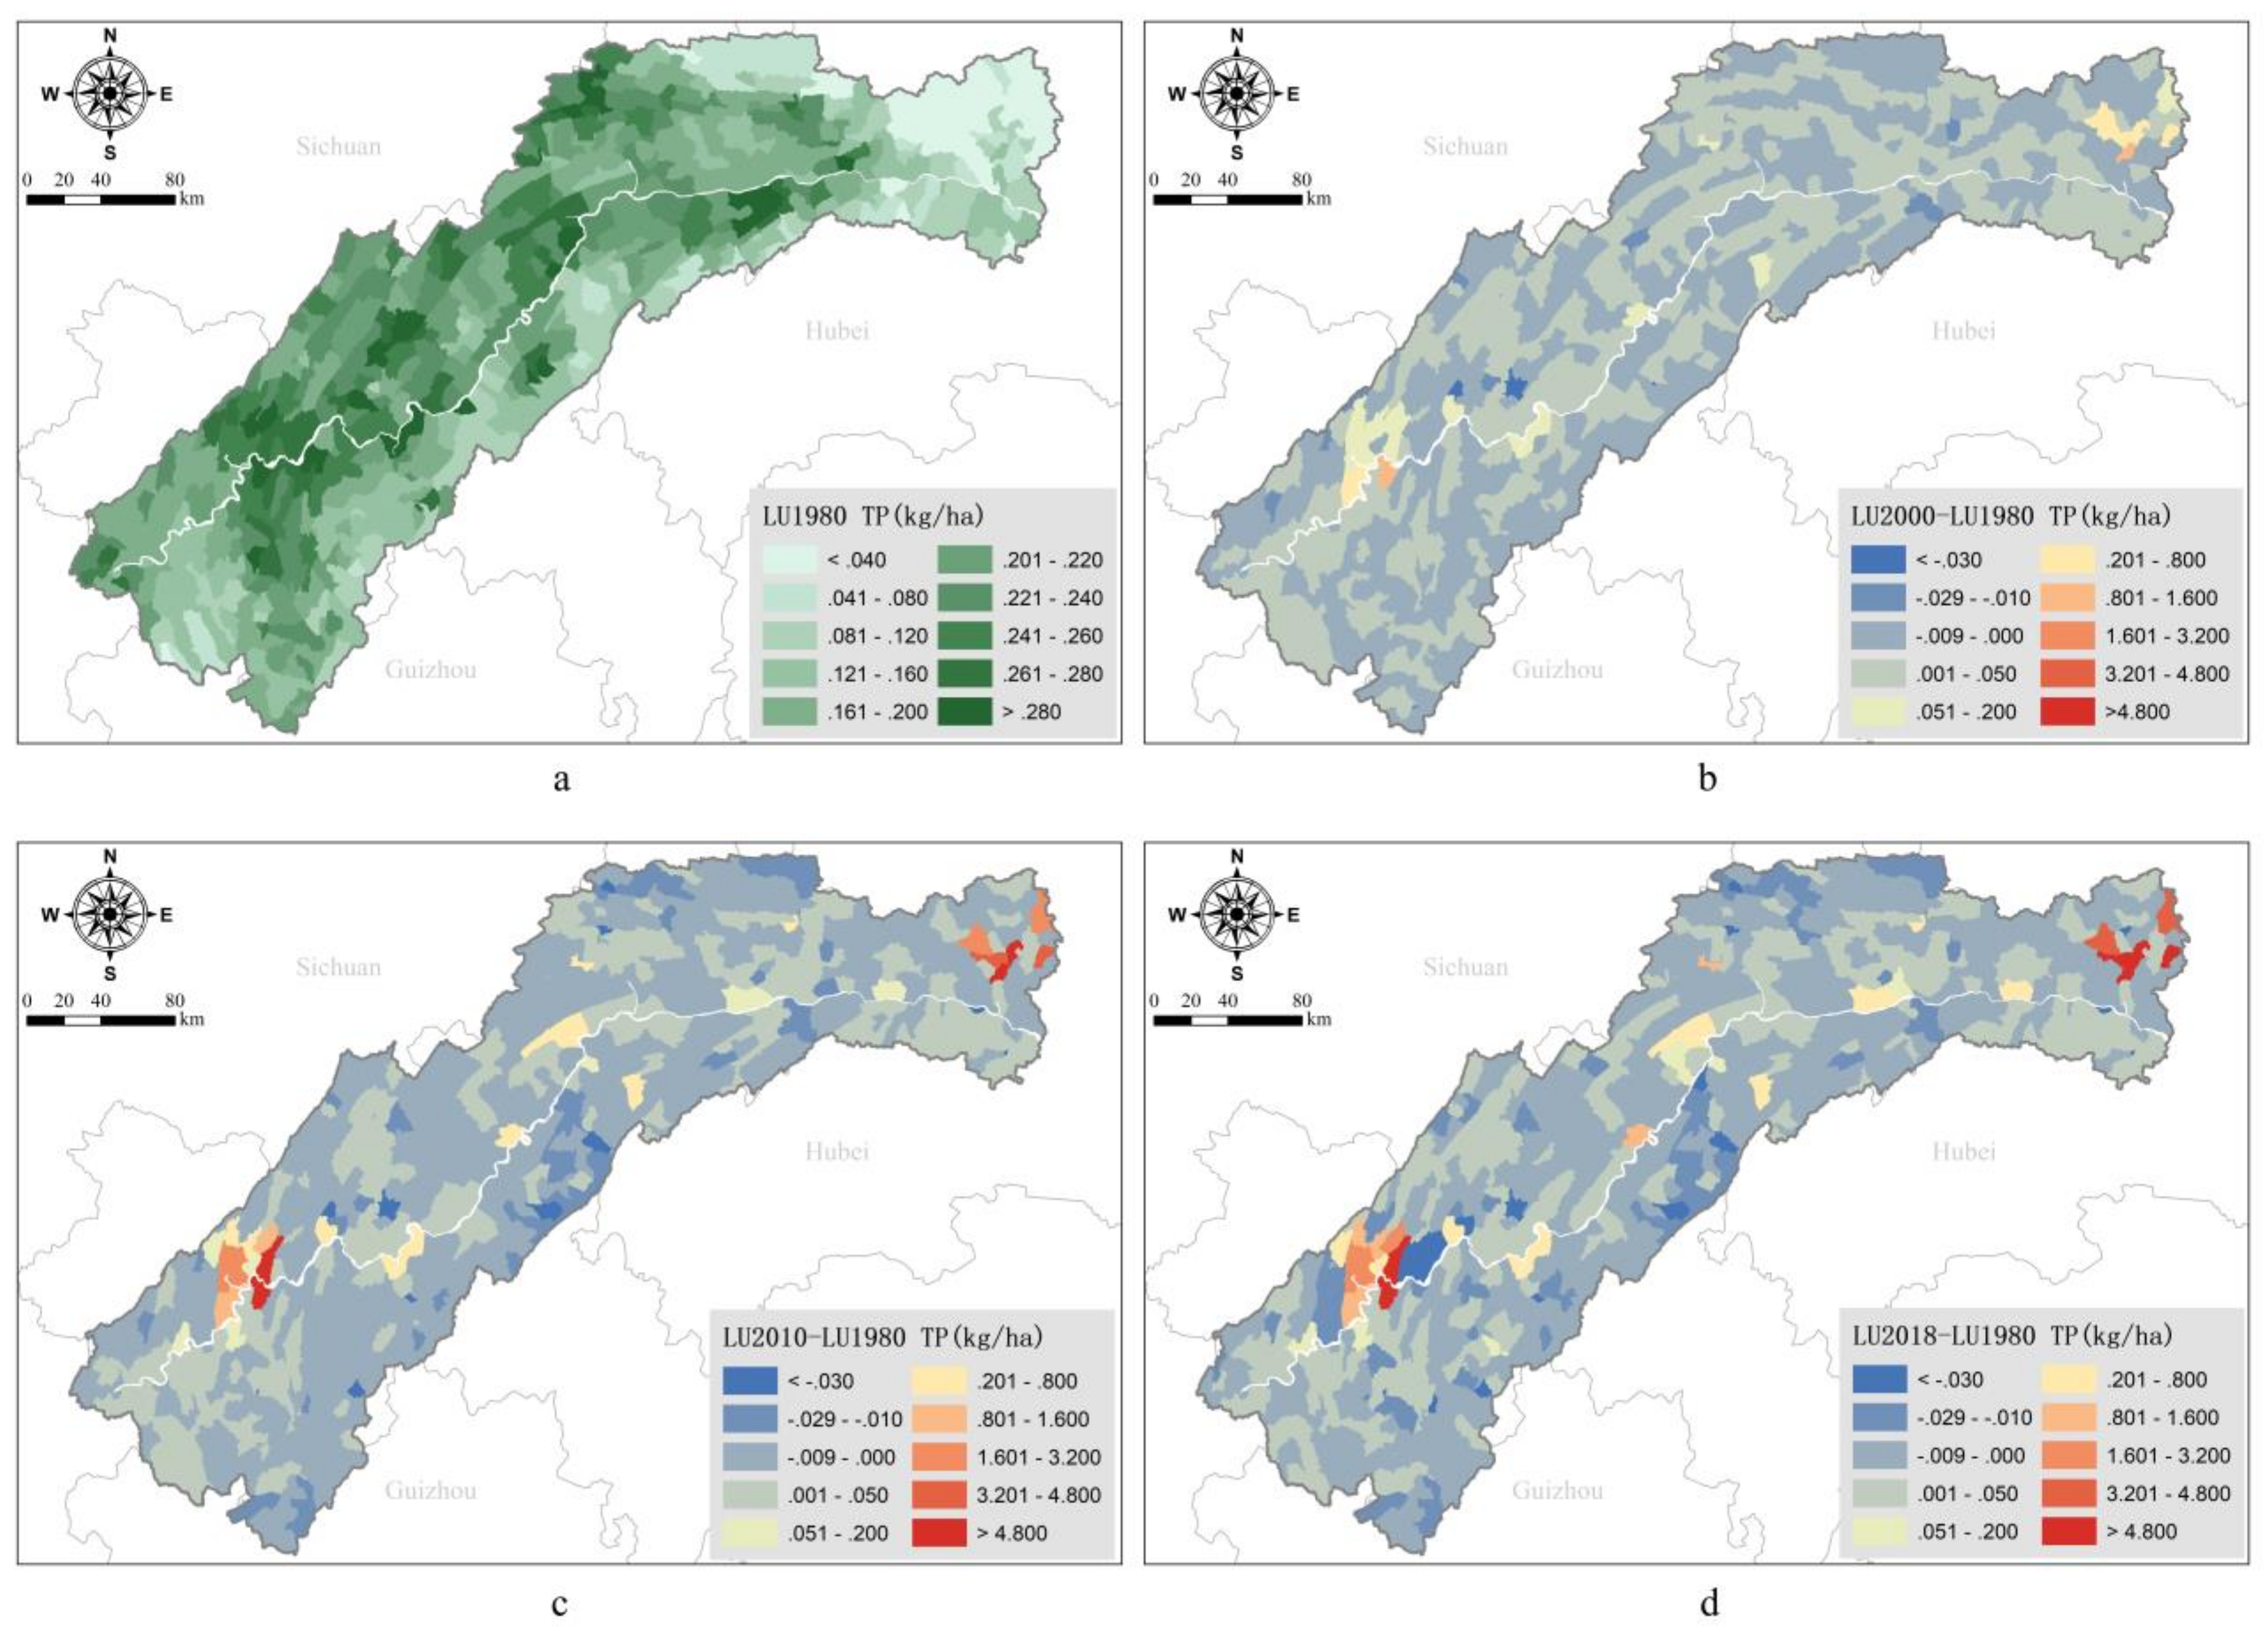
3.2.2. Spatial Variation Characteristic

Figure 6 presents the impact of LULC changes on the runoff depth distribution in the TGRA. Figure 6a shows the average runoff depth distribution under LULC conditions in 1980. Figure 6b–d displays the average runoff depth of the LULC conditions in 2000, 2010 and 2018, respectively, minus the LULC conditions in 1980. The average runoff depth under different LULC changes demonstrates that the TGRA’s water balance and distribution have changed at the basin and sub-basin levels over the past 40 years. Under the conditions of LULC in 1980, most areas of the TGRA had runoff depths between 200 mm and 650 mm. The areas with higher runoff depths were mainly concentrated in the head and middle of the TGRA, and the average runoff depths were up to 407.2 mm and 359.3 mm, respectively.
Figure S10a,d shows the multi-year average runoff depths in different regions of the TGRA under the LULC conditions of 2000, 2010 and 2018, compared to 1980. The growth of runoff depth in the 2000s was head > tail > middle of the TGRA compared to the LULC condition during the 1980s. Under the conditions of LULC in 2010, the runoff depth growth was middle > tail > head of the TGRA, whereas it was tail > middle > head with the LULC condition in 2018. The runoff depth growth in the left bank was larger than in the right bank in all three LULC conditions from 2000, 2010 and 2018.
The impact of the LULC changes on the TN load distribution in the TGRA is shown in Figure 7, where Figure 7a shows the average TN load distribution under the conditions of LULC in 1980. Figure 7b,d shows the LULC conditions of the TGRA in 2000, 2010 and 2018, respectively, compared with the LULC conditions in 1980. Under the conditions of LULC in 1980, the TN load in most areas of the TGRA was between 2.56 kg/ha and 42.51 kg/ha. The areas with higher TN loads were mainly concentrated in the tail and middle areas of the TGRA, where the TN load reached 11.75 kg/ha and 11.23 kg/ha, respectively. The TN load in the TGRA head area was relatively low, at 8.01 kg/ha.
Figure S10b,e shows the multi-year average simulated value of TN load in different areas of the TGRA under the conditions of LULC in 2000, 2010 and 2018, compared to the conditions of LULC in 1980. The instances growth of the TN load all presented the characteristic of head > tail > middle, and left bank > right bank of the TGRA under the conditions of LULC in 2000, 2010 and 2018 compared to 1980.
The impact of the LULC changes on the TP load distribution in the TGRA is shown in Figure 8, where Figure 8a shows the spatial distribution of average TP load under LULC in 1980. Figure 8b,d shows the LULC conditions of the TGRA in 2000, 2010 and 2018, respectively, compared with the LULC conditions in 1980. Under the conditions of LULC in 1980, the TP load in most areas of the TGRA was between 0.16 to 0.26 kg/ha. The areas with higher TP loads were similar to those with higher TN loads. The TP load at the middle and tail of the TGRA reached 0.198 kg/ha and 0.189 kg/ha, respectively. At the head of the TGRA, the TP load was only 0.128 kg/ha.
Figure S10c,f shows the multi-year average simulated value of TP load in the TGRA under LULC conditions in 2000, 2010 and 2018, compared with 1980. The TP load growth showed the distribution pattern of head > tail > middle, and left bank > right bank of the TGRA.

3.3. Impact and Contribution of Different Type LULC

3.3.1. Runoff Depth

The runoff contribution rate of different LULC types in the TGRA is presented in Table 4 and Figure S11. Forestland had the highest contribution rate to runoff, with an average contribution rate of 55.82%, followed by cropland, with an average contribution rate of 32.60%. The changing trend of the contribution rate for each LULC type to runoff was highly consistent with that for different LULC types. The contribution rate of cropland to runoff depth showed a decreasing trend, while forestland and construction land presented an increasing trend. The runoff generation capacity was (in Figure S12a) grassland (487.9 mm) > woodland (425.3 mm) > construction land (385.0 mm) > cultivated land (262.7 mm).

3.3.2. Total Nitrogen

The contribution rate of each LULC type in the TGRA to the TN load is shown in Table 5 and Figure S13. Cropland had the highest contribution rate to the TN load, with an average contribution rate of 56.02%, followed by forestland, with an average contribution rate of 42.23%.
The contribution rate of cropland to TN load showed a decreasing trend, whereas there was an increasing trend for forestland and construction land to TN load. The TN load per unit area per year of each LULC type in the TGRA (Figure S12b) was cropland (31.3 kg/ha) > forestland (22.3 kg/ha) > construction land (5.8 kg/ha) > grassland (5.1 kg/ha).

3.3.3. Total Phosphorus

The contribution rate of each LULC type in the TGRA to the TP load is shown in Table 6 and Figure S14. The contribution rate of cropland to TP load was the highest, with an average contribution rate of 81.55%, followed by forestland, with an average contribution rate of 9.70%. The contribution rate trends of cropland, forestland and construction land to TP load were similar to those to TN load. The pollution production capacity of TP load for each LULC type in the TGRA (Figure S12c) was cropland (0.312 kg/ha) > grassland (0.176 kg/ha) > construction land (0.124 kg/ha) > woodland (0.035 kg/ha) ha).

4. Discussion

4.1. Spatial Pattern and Temporal Trends of LULC Change

Significant changes in LULC have occurred in the TGRA. The main dramatic change is the continuous social-economic development in this area, followed by the environmental protection policies after 2003 due to the construction of the TGD [49,59,60]. The trend for cropland and forestland is the opposite: the proportion of cropland decreased while that of forestland increased. The inter-annual change of LULC presents different characteristics for different periods. Before 2000, the change was relatively slow, whereas significant change occurred after 2010, especially for construction land. This could largely be explained by the growing population and urbanization in this area. The population in the TGRA has grown rapidly, which has led to a large demand for food, house and factories. The construction of the TGD has boosted the regional economy through shipping, tourism and so on, which normally accelerate the rise of built-up areas [54].
The largest changes were the conversion of cropland to forestland; the significant transfers occurred from 1980 to 1990 and from 2015 to 2018. With the operation of the Three Gorges Reservoir, more attention has been paid to eco-environment protection in the basin. A series of policies for returning farmland to forests and grasses have been published. One such policy enabled a large amount of cropland to be converted into forest and grassland after 2010. During 2000–2010, with the implementation of policies such as “basic cultivated land protection” and the advance of occupation and compensation balance, the encroachment of forestland and construction land on cropland slowed down [61]. These changes contributed to the reduction in soil erosion risk, which highlights the urgent need of prioritizing policies across many sectors to balance the trade-off between natural resource management and urban development [62].
The area of cropland had an increasing trend in elevation from 500 to 1500 and in slope from 15 to 45 degrees, where there is cropland functional transformation and rural settlement [63]. This is mainly caused by the resettlement of rural areas due to increases in water level. The functional transformation can bring positive economic benefits to rural areas by helping to diversify man–land relationship trends [63].
Construction land was mainly distributed in low-altitude and gentle-slope areas, where the ecological status such as the soil conservation service decreased from 1995 to 2015 even though the whole TGRA was generally stable, with this decrease being especially significant for Chongqing city and its surrounding regions [64]. This merits more attention for future protection policies.
In spite of the encroachment of construction land, the water area kept increasing through the years. The changes at the head of the TGRA were more intensive and closer to the river. With population resettlement and reservoir impoundment, the water area expansion moved from lower elevations to higher elevations after 2005 [65].

4.2. Hydrological and Environmental Response to LULC Changes

The increasing trend of runoff depth mainly derived from the increase in construction land and forestland in the TGRA. Although the area of grassland with the strongest runoff generating capacity is decreasing, the decrease in average annual runoff depth caused by this is smaller than the increase, due to the increase in forestland and construction land. The expansion of construction land, namely through urbanization, affects the surface runoff by reducing soil infiltration and surface evaporation. The runoff depth in the left bank is larger than in the right bank of the TGRA, which is consistent with the distribution of construction land. The left bank contains the main central city and most of the population, and human activities have a greater degree of interference on the left bank. Before the construction of the TGD, significant changes in runoff depth caused by LULC changes were concentrated at the head of the TGRA. After the construction of the TGD, the areas with significant changes in runoff depth gradually shifted from the head to the middle and tail regions of the TGRA, which is consistent with the trend of LULC changes brought about by socioeconomic development and human agglomeration trends in the TGRA.
Although there is currently no consensus on whether the increase in forestland will increase the runoff of the watershed, it is generally agreed that the forestland has strange runoff-generating ability. Due to the abundant precipitation and humid climate in the TGRA, the water loss caused by evaporation of forestland is low; the strong water conservation and infiltration thus lead to stronger runoff-generating ability. The cropland, by contrast, has a weak runoff-generating ability, which could be explained from two aspects. On the one hand, cropland returns soil water and groundwater to the atmosphere through crop evapotranspiration. On the other hand, agricultural activities intercept and deplete surface runoff.
The temporal changes of TN and TP load are close to the monthly variation of runoff depth, which showed a significant upward trend after 2005. The pollution source strength increased in the TGRA because economic development was largely responsible for the fast-growing trend in TN and TP loads [39]. The runoff depth, TN load and TP load have similar monthly tendencies, but the TP load reached the highest level in June, whereas the runoff depth and TN load reached their highest levels in July. TN and TP load are positively related to surface runoff [39,66,67]: the number of heavy rain (more than 30 mm) in June is higher than in July, and the soil erosion caused by heavy rain is higher than that of moderate and light rain.
The results show that the TN load was much higher in the TGRA than the TP load, which was consistent with results from a previous study on the TGRA [68]. Different LULC types have a significant impact on TN and TP load distributions in the TGRA [67]. Cropland is the main source of TN and TP load in the TGRA, and it has the strongest pollution-producing capacity. This was also indicated in Wang et al. [69]. Agricultural activities are accompanied by fertilization, harvesting and periodic decay of crops in the field [70]. The TGRA is mostly sloping farmland where water and soil conservation capacity is weak, and soil erosion is prone to occur under extreme rainfall conditions [68,69,71]. Soil particles enter the water body during rainfall and runoff, resulting in a very high non-point source pollution risk. Forestland had significantly lower TP load compared to TN load, and this could be relevant for the lower accumulated phosphorus aboveground in forestland [72].

4.3. Future Perspective

Measures for controlling non-point source TN and TP are urgent in the TGRA. One of the crucial ways is to intercept rainfall runoff, especially storm runoff, from the different landscapes. As sloping croplands are a common pattern in the TGRA, paddy fields could be crucial for reducing TN and TP load, since they serve as a sink for TN and TP load by intercepting and storing runoff and sediment [73]. According to Shen et al. [52], non-irrigated cropland, namely dry land, makes up a large amount of non-point source loads. For dry land management, it is important to explicitly account for proper land covers and conservation practices. Reducing fertilizer application is a direct measure to decrease non-point source load, but a reduction in fertilizer amounts cannot guarantee considerable phosphorus load reduction without inhibiting crop yield in the TGRA [74]. This implies that more efficient fertilization schemes for cropland should be explored as well as measures such as intercropping on cornfields [75] to reduce non-point source pollution while maintaining food production in the near future. Soil conservation measures are beneficial for nutrient reduction; measures of hedgerows, stone dike terraces and soil dike terraces could be selected according to soil types, topographical conditions, landscape and management practices [76].

5. Conclusions

In the TGRA, cropland decreased from 1980 to 2018, whereas forestland, construction land and water area increased in the same period. The cropland was mainly changed into forestland, followed by grassland and construction land. Through the encroachment of cropland, forestland and water area, construction land realized growth by expansion. Distant transformations among landscapes mainly occurred during 1980–1990 and 2015–2018.
The SWAT model could serve as an effective tool for surface runoff and nutrient estimations in large-scale watersheds or regions. In the TGRA, the surface runoff and nutrient load exhibited significant tempo-spatial heterogeneity. The runoff depth, TN load and TP load increased through 1980 to 2018, and the year 2005 was a turning point. After 2005, the annual average change rate was greater than before 2005, which demonstrated the impact of the impoundment of the TGD. The area with the larger runoff depth was mainly concentrated in the middle and head region as well as the left bank of the TGRA. The middle and tail region of the TGRA generated relatively higher TN and TP loads. Forestland had the highest contribution rate to surface runoff, followed by cropland. Cropland had the highest contribution rate to TN and TP, followed by forestland. The annual contribution rate of each LULC type was consistent with the annual area proportion of each LULC type.
This study provides a better understanding of LULC change, hydrologic processes and nutrient load distribution at a large watershed scale for the TGRA, which can support appropriate management planning to regulate the ecosystem in the TGRA.

Supplementary Materials

The following supporting information can be downloaded at: https://www.mdpi.com/article/10.3390/su14042023/s1. Figure S1: Elevation (A) and soil types (B) of the TGRA; Figure S2: The annual average proportion of LULC types in banks and regions of the TGRA; Figure S3: The proportion of LULC types in the TGRA from 1980 to 2018; Figure S4: Analysis on the linear trend of land use transformation in the TGRA from 1980 to 2018; Figure S5: Spatial distribution map of altitude zone in the TGRA; Figure S6: Spatial distribution map of slope category in the TGRA; Figure S7: Different LULC types changes in the altitude zones of the TGRA; Figure S8: Different LULC types changes in the slope category of the TGRA; Figure S9: The change trend under LULC change in the TGRA; Figure S10: Spatial distribution difference of runoff and nutrient load in the TGRA under LULC change; Figure S11: The variation trend of runoff contribution rate of different utilization/cover types in the TGRA; Figure S12: Runoff, TN load and TP load per unit area of different LULC types in the TGRA; Figure S13: The variation trend of TN load contribution rate of different utilization/cover types in the TGRA; Figure S14: The variation trend of TP load contribution rate of different utilization/cover types in the TGRA.

Author Contributions

X.Z.: data curation, investigation, visualization and writing–original draft. X.C.: data curation, formal analysis, writing—review and editing. W.Z.: supervision, methodology, funding acquisition, conceptualization, writing—review and editing. H.P.: supervision, writing—review and editing. G.X.: resources and supervision. Y.Z.: writing–review and editing. Z.S.: data curation and visualization. All authors have read and agreed to the published version of the manuscript.

Funding

This work was funded by the National Natural Science Foundation of China (Grant No. 41877531) and the National Key Research and Development Program of China (No. 2017YFC1502500 and No. 2016YFC0402201).

Institutional Review Board Statement

Not applicable.

Informed Consent Statement

Not applicable.

Data Availability Statement

Not applicable.

Acknowledgments

The authors would like to thank the Chongqing Academy of Environmental Science and the Bureau of Hydrology, Changjiang Water Resources Commission, for sharing the necessary data in this study. The authors also gratefully acknowledge the anonymous reviewers for their kindly suggestions and comments on this research and manuscript.

Conflicts of Interest

The authors declare no conflict of interest.

References

  1. Bateman, I.J.; Harwood, A.R.; Mace, G.M.; Watson, R.T.; Abson, D.J.; Andrews, B.; Binner, A.; Crowe, A.; Day, B.H.; Dugdale, S.; et al. Bringing ecosystem services into economic decision-making: Land use in the United Kingdom. Science 2013, 341, 45–50. [Google Scholar] [CrossRef] [PubMed]
  2. Lawler, J.J.; Lewis, D.J.; Nelson, E.; Plantinga, A.J.; Polasky, S.; Withey, J.C.; Helmers, D.P.; Martinuzzi, S.; Pennington, D.; Radeloff, V.C. Projected land-use change impacts on ecosystem services in the United States. Proc. Natl. Acad. Sci. USA 2014, 111, 7492–7497. [Google Scholar] [CrossRef] [Green Version]
  3. Zare, M.; Samani, A.A.N.; Mohammady, M. The impact of land use change on runoff generation in an urbanizing watershed in the north of Iran. Environ. Earth Sci. 2016, 75, 1–20. [Google Scholar] [CrossRef]
  4. Hasan, S.S.; Zhen, L.; Miah, M.G.; Ahamed, T.; Samie, A. Impact of land use change on ecosystem services: A review. Environ. Dev. 2020, 34, 1002527. [Google Scholar] [CrossRef]
  5. Zhang, H.; Wang, B.; Liu, D.L.; Zhang, M.X.; Leslie, L.M.; Yu, Q. Using an improved SWAT model to simulate hydrological responses to land use change: A case study of a catchment in tropical Australia. J. Hydrol. 2020, 585, 124822. [Google Scholar] [CrossRef]
  6. Napoli, M.; Massetti, L.; Orlandini, S. Hydrological response to land use and climate changes in a rural hilly basin in Italy. Catena 2017, 157, 1–11. [Google Scholar] [CrossRef]
  7. Mishra, A.; Alnahit, A.; Campbell, B. Impact of land uses, drought, flood, wildfire, and cascading events on water quality and microbial communities: A review and analysis. J. Hydrol. 2021, 596, 125707. [Google Scholar] [CrossRef]
  8. Camara, M.; Jamil, N.R.; Bin Abdullah, A.F. Impact of land uses on water quality in Malaysia: A review. Ecol. Process. 2019, 8, 1–10. [Google Scholar] [CrossRef]
  9. Da Silva, V.D.P.R.; Silva, M.T.; Singh, V.P.; de Souza, E.P.; Braga, C.C.; de Holanda, R.M.; Almeida, R.S.R.; de Sousa, F.D.A.S.; Braga, A.C.R. Simulation of stream flow and hydrological response to land-cover changes in a tropical river basin. Catena 2018, 162, 166–176. [Google Scholar] [CrossRef]
  10. Delkash, M.; Al-Faraj, F.A.M.; Scholz, M. Impacts of anthropogenic land use changes on nutrient concentrations in surface waterbodies: A review. Clean-Soil Air Water 2018, 46, 1800051. [Google Scholar] [CrossRef] [Green Version]
  11. Liang, K.; Jiang, Y.; Qi, J.; Fuller, K.; Nyiraneza, J.; Meng, F.R. Characterizing the impacts of land use on nitrate load and water yield in an agricultural watershed in Atlantic Canada. Sci. Total Environ. 2020, 729, 138793. [Google Scholar] [CrossRef] [PubMed]
  12. Risal, A.; Parajuli, P.B.; Dash, P.; Ouyang, Y.; Linhoss, A. Sensitivity of hydrology and water quality to variation in land use and land cover data. Agric. Water Manag. 2020, 241, 106366. [Google Scholar] [CrossRef]
  13. Me, W.; Hamilton, D.P.; McBride, C.G.; Abell, J.M.; Hicks, B.J. Modelling hydrology and water quality in a mixed land use catchment and eutrophic lake: Effects of nutrient load reductions and climate change. Environ. Model. Softw. 2018, 109, 114–133. [Google Scholar] [CrossRef]
  14. Sajikumar, N.; Remya, R. Impact of land cover and land use change on runoff characteristics. J. Environ. Manag. 2015, 161, 460–468. [Google Scholar] [CrossRef] [PubMed]
  15. Yang, Q.C.; Tian, H.Q.; Friedrichs, M.A.M.; Liu, M.L.; Li, X.; Yang, J. Hydrological responses to climate and land-use changes along the North American east coast: A 110-year historical reconstruction. J. Am. Water Resour. Assoc. 2015, 51, 47–67. [Google Scholar] [CrossRef]
  16. Xia, Y.; Ti, C.; She, D.; Yan, X. Linking river nutrient concentrations to land use and rainfall in a paddy agriculture-urban area gradient watershed in southeast China. Sci. Total Environ. 2016, 566, 1094–1105. [Google Scholar] [CrossRef]
  17. Li, W.; Zhai, L.; Lei, Q.; Wollheim, W.M.; Liu, J.; Liu, H.; Hu, W.; Ren, T.; Wang, H.; Liu, S. Influences of agricultural land use composition and distribution on nitrogen export from a subtropical watershed in China. Sci. Total Environ. 2018, 642, 21–32. [Google Scholar] [CrossRef]
  18. Álvarez, X.; Valero, E.; Santos, R.M.; Varandas, S.; Fernandes, L.S.; Pacheco, F.A.L. Anthropogenic nutrients and eutrophication in multiple land use watersheds: Best management practices and policies for the protection of water resources. Land Use Policy 2017, 69, 1–11. [Google Scholar] [CrossRef]
  19. Gao, H.K.; Sabo, J.L.; Chen, X.H.; Liu, Z.Y.; Yang, Z.J.; Ren, Z.; Liu, M. Landscape heterogeneity and hydrological processes: A review of landscape-based hydrological models. Landsc. Ecol. 2018, 33, 1461–1480. [Google Scholar] [CrossRef]
  20. Erlandsen, H.B.; Beldring, S.; Eisner, S.; Hisdal, H.; Huang, S.C.; Tallaksen, L.M. Constraining the HBV model for robust water balance assessments in a cold climate. Hydrol. Res. 2021, 52, 356–372. [Google Scholar] [CrossRef]
  21. Birhanu, A.; Masih, I.; van der Zaag, P.; Nyssen, J.; Cai, X. Impacts of land use and land cover changes on hydrology of the Gumara catchment, Ethiopia. Phys. Chem. Earth Parts A/B/C 2019, 112, 165–174. [Google Scholar] [CrossRef]
  22. Graham, L.; Bergström, S. Water balance modelling in the Baltic Sea drainage basin—Analysis of meteorological and hydrological approaches. Meteorol. Atmos. Phys. 2001, 77, 45–60. [Google Scholar] [CrossRef]
  23. Bai, X.Y.; Shen, W.; Wang, P.; Chen, X.H.; He, Y.H. Response of non-point source pollution loads to land use change under different precipitation scenarios from a future perspective. Water Resour. Manag. 2020, 34, 3987–4002. [Google Scholar] [CrossRef]
  24. Yazdi, M.N.; Ketabchy, M.; Sample, D.J.; Scott, D.; Liao, H. An evaluation of HSPF and SWMM for simulating streamflow regimes in an urban watershed. Environ. Model. Softw. 2019, 118, 211–225. [Google Scholar] [CrossRef]
  25. Liu, Y.; Theller, L.O.; Pijanowski, B.C.; Engel, B.A. Optimal selection and placement of green infrastructure to reduce impacts of land use change and climate change on hydrology and water quality: An application to the Trail Creek Watershed, Indiana. Sci. Total. Environ. 2016, 553, 149–163. [Google Scholar] [CrossRef] [PubMed]
  26. Garg, V.; Nikam, B.R.; Thakur, P.K.; Aggarwal, S.P.; Gupta, P.K.; Srivastav, S.K. Human-induced land use land cover change and its impact on hydrology. HydroResearch 2019, 1, 48–56. [Google Scholar] [CrossRef]
  27. Chawla, I.; Mujumdar, P.P. Isolating the impacts of land use and climate change on streamflow. Hydrol. Earth Syst. Sci. 2015, 19, 3633–3651. [Google Scholar] [CrossRef] [Green Version]
  28. Wagner, P.D.; Bhallamudi, S.M.; Narasimhan, B.; Kumar, S.; Fohrer, N.; Fiener, P. Comparing the effects of dynamic versus static representations of land use change in hydrologic impact assessments. Environ. Model. Softw. 2019, 122, 103987. [Google Scholar] [CrossRef]
  29. Mancosu, E.; Gago-Silva, A.; Barbosa, A.; De Bono, A.; Ivanov, E.; Lehmann, A.; Fons, J. Future land-use change scenarios for the Black Sea catchment. Environ. Sci. Policy 2015, 46, 26–36. [Google Scholar] [CrossRef]
  30. Anand, J.; Gosain, A.K.; Khosa, R. Prediction of land use changes based on Land Change Modeler and attribution of changes in the water balance of Ganga basin to land use change using the SWAT model. Sci. Total Environ. 2018, 644, 503–519. [Google Scholar] [CrossRef]
  31. Devia, G.K.; Ganasri, B.P.; Dwarakish, G.S. A review on hydrological models. Aquat. Procedia 2015, 4, 1001–1007. [Google Scholar] [CrossRef]
  32. Dwarakish, G.S.; Ganasri, B.P. Impact of land use change on hydrological systems: A review of current modeling approaches. Cogent Geosci. 2015, 1, 1115691. [Google Scholar] [CrossRef]
  33. Krysanova, V.; Arnold, J.G. Advances in ecohydrological modelling with SWAT-a review. Hydrol. Sci. J. 2008, 53, 939–947. [Google Scholar] [CrossRef]
  34. Aawar, T.; Khare, D. Assessment of climate change impacts on streamflow through hydrological model using SWAT model: A case study of Afghanistan. Modeling Earth Syst. Environ. 2020, 6, 1427–1437. [Google Scholar] [CrossRef]
  35. Jeon, D.J.; Ligaray, M.; Kim, M.; Kim, G.; Lee, G.; Pachepsky, Y.A.; Cha, D.H.; Cho, K.H. Evaluating the influence of climate change on the fate and transport of fecal coliform bacteria using the modified SWAT model. Sci. Total Environ. 2019, 658, 753–762. [Google Scholar] [CrossRef] [PubMed]
  36. Himanshu, S.K.; Pandey, A.; Yadav, B.; Gupta, A. Evaluation of best management practices for sediment and nutrient loss control using SWAT model. Soil Tillage Res. 2019, 192, 42–58. [Google Scholar] [CrossRef]
  37. Halecki, W.; Kruk, E.; Ryczek, M. Loss of topsoil and soil erosion by water in agricultural areas: A multi-criteria approach for various land use scenarios in the Western Carpathians using a SWAT model. Land Use Policy 2018, 73, 363–372. [Google Scholar] [CrossRef]
  38. Zhang, T.; Ni, J.; Xie, D. Assessment of the relationship between rural non-point source pollution and economic development in the Three Gorges Reservoir Area. Environ. Sci. Pollut. Res. Int. 2016, 23, 8125–8132. [Google Scholar] [CrossRef]
  39. Shen, Z.; Qiu, J.; Hong, Q.; Chen, L. Simulation of spatial and temporal distributions of non-point source pollution load in the Three Gorges Reservoir Region. Sci. Total Environ. 2014, 493, 138–146. [Google Scholar] [CrossRef]
  40. Teng, M.; Huang, C.; Wang, P.; Zeng, L.; Zhou, Z.; Xiao, W.; Huang, Z.; Liu, C. Impacts of forest restoration on soil erosion in the Three Gorges Reservoir area, China. Sci. Total Environ. 2019, 697, 134164. [Google Scholar] [CrossRef]
  41. Bao, Y.H.; He, X.B.; Wen, A.B.; Gao, P.; Tang, Q.; Yan, D.C.; Long, Y. Dynamic changes of soil erosion in a typical disturbance zone of China’s Three Gorges Reservoir. Catena 2018, 169, 128–139. [Google Scholar] [CrossRef]
  42. Guan, D.; Zhao, Z.; Tan, J. Dynamic simulation of land use change based on logistic-CA-Markov and WLC-CA-Markov models: A case study in three gorges reservoir area of Chongqing, China. Environ. Sci. Pollut. Res. Int. 2019, 26, 20669–20688. [Google Scholar] [CrossRef]
  43. Zhang, Y.; Zhong, P.A.; Chen, J.; Bing, J.P.; Xu, D.H.; Wang, M.L. Impacts of climate change and human activities on the Three Gorges Reservoir inflow. Water 2017, 9, 957. [Google Scholar] [CrossRef] [Green Version]
  44. Yang, H.; Wang, G.; Wang, L.; Zheng, B. Impact of land use changes on water quality in headwaters of the Three Gorges Reservoir. Environ. Sci. Pollut. Res. Int. 2016, 23, 11448–11460. [Google Scholar] [CrossRef] [PubMed]
  45. Xiong, Y.; Zhou, J.Z.; Chen, L.; Jia, B.J.; Sun, N.; Tian, M.Q.; Hu, G.H. Land use pattern and vegetation cover dynamics in the Three Gorges Reservoir (TGR) intervening basin. Water 2020, 12, 2036. [Google Scholar] [CrossRef]
  46. Hao, B.; Ma, M.; Li, S.; Li, Q.; Hao, D.; Huang, J.; Ge, Z.; Yang, H.; Han, X. Land use change and climate variation in the Three Gorges Reservoir catchment from 2000 to 2015 based on the Google Earth Engine. Sensors 2019, 19, 2118. [Google Scholar] [CrossRef] [Green Version]
  47. Huang, C.B.; Huang, X.; Peng, C.H.; Zhou, Z.X.; Teng, M.J.; Wang, P.C. Land use/cover change in the Three Gorges Reservoir area, China: Reconciling the land use conflicts between development and protection. Catena 2019, 175, 388–399. [Google Scholar] [CrossRef]
  48. Chen, D.C.; Elhadj, A.; Xu, H.L.; Xu, X.L.; Qiao, Z. A study on the relationship between land use change and water quality of the Mitidja Watershed in Algeria based on GIS and RS. Sustainability 2020, 12, 3510. [Google Scholar] [CrossRef]
  49. Zhang, J.; Li, S.Y.; Dong, R.Z.; Jiang, C.S.; Ni, M.F. Influences of land use metrics at multi-spatial scales on seasonal water quality: A case study of river systems in the Three Gorges Reservoir Area, China. J. Clean. Prod. 2019, 206, 76–85. [Google Scholar] [CrossRef]
  50. Huang, Z.; Han, L.; Zeng, L.; Xiao, W.; Tian, Y. Effects of land use patterns on stream water quality: A case study of a small-scale watershed in the Three Gorges Reservoir Area, China. Environ. Sci. Pollut. Res. Int. 2016, 23, 3943–3955. [Google Scholar] [CrossRef]
  51. Ye, L.; Cai, Q.-H.; Liu, R.-Q.; Cao, M. The influence of topography and land use on water quality of Xiangxi River in Three Gorges Reservoir region. Environ. Geol. 2008, 58, 937–942. [Google Scholar] [CrossRef]
  52. Shen, Z.; Chen, L.; Hong, Q.; Qiu, J.; Xie, H.; Liu, R. Assessment of nitrogen and phosphorus loads and causal factors from different land use and soil types in the Three Gorges Reservoir Area. Sci. Total Environ. 2013, 454, 383–392. [Google Scholar] [CrossRef] [PubMed]
  53. Chen, X.; Xu, G.; Zhang, W.; Peng, H.; Xia, H.; Zhang, X.; Ke, Q.; Wan, J. Spatial variation pattern analysis of hydrologic processes and water quality in three gorges reservoir area. Water 2019, 11, 2608. [Google Scholar] [CrossRef] [Green Version]
  54. Zhang, J.X.; Liu, Z.J.; Sun, X.X. Changing landscape in the Three Gorges Reservoir Area of Yangtze River from 1977 to 2005: Land use/land cover, vegetation cover changes estimated using multi-source satellite data. Int. J. Appl. Earth Obs. Geoinf. 2009, 11, 403–412. [Google Scholar] [CrossRef]
  55. Arnold, J.G.; Srinivasan, R.; Muttiah, R.S.; Williams, J.R. Large area hydrologic modeling and assessment part I: Model development 1. J. Am. Water Resour. Assoc. 1998, 34, 73–89. [Google Scholar] [CrossRef]
  56. Arnold, J.G.; Moriasi, D.N.; Gassman, P.W.; Abbaspour, K.C.; White, M.J.; Srinivasan, R.; Santhi, C.; Harmel, R.D.; van Griensven, A.; Van Liew, M.W.; et al. Swat: Model use, calibration, and validation. Trans. ASABE 2012, 55, 1491–1508. [Google Scholar] [CrossRef]
  57. Xin-liang, X.; Jiyuan, L.; Dafang, Z. Remote sensing monitoring methods of land use/cover change in national scale. J. Anhui Agric. Sci. 2012, 4, 2365–2369. [Google Scholar]
  58. Shi, Y.Y.; Xu, G.H.; Wang, Y.G.; Engel, B.A.; Peng, H.; Zhang, W.S.; Cheng, M.L.; Dai, M.L. Modelling hydrology and water quality processes in the Pengxi River basin of the Three Gorges Reservoir using the soil and water assessment tool. Agric. Water Manag. 2017, 182, 24–38. [Google Scholar] [CrossRef]
  59. Wang, H.J.; Xiao, W.H.; Zhao, Y.; Wang, Y.C.; Hou, B.D.; Zhou, Y.Y.; Yang, H.; Zhang, X.L.; Cui, H. The spatiotemporal variability of evapotranspiration and its response to climate change and land use/land cover change in the Three Gorges Reservoir. Water 2019, 11, 1739. [Google Scholar] [CrossRef] [Green Version]
  60. Tan, Y.; Bryan, B.; Hugo, G. Development, land-use change and rural resettlement capacity: A case study of the Three Gorges Project, China. Aust. Geogr. 2005, 36, 201–220. [Google Scholar] [CrossRef]
  61. Long, H.; Wu, X.; Wang, W.; Dong, G. Analysis of urban-rural land-use change during 1995–2006 and its policy dimensional driving forces in Chongqing, China. Sensors 2008, 8, 681–699. [Google Scholar] [CrossRef] [PubMed] [Green Version]
  62. Jiu, J.; Wu, H.; Li, S. The implication of land-use/land-cover change for the declining soil erosion risk in the Three Gorges Reservoir region, China. Int. J. Environ. Res. Public Health 2019, 16, 1856. [Google Scholar] [CrossRef] [Green Version]
  63. Liang, X.Y.; Li, Y.B. Identification of spatial coupling between cultivated land functional transformation and settlements in Three Gorges Reservoir Area, China. Habitat Int. 2020, 104, 102236. [Google Scholar] [CrossRef]
  64. Li, S.C.; Bing, Z.L.; Jin, G. Spatially explicit mapping of soil conservation service in monetary units due to land use/cover change for the Three Gorges Reservoir Area, China. Remote Sens. 2019, 11, 468. [Google Scholar] [CrossRef] [Green Version]
  65. Wang, L.J.; Wu, L.; Hou, X.Y.; Zheng, B.H.; Li, H.; Norra, S. Role of reservoir construction in regional land use change in Pengxi River basin upstream of the Three Gorges Reservoir in China. Environ. Earth Sci. 2016, 75, 1–15. [Google Scholar] [CrossRef] [Green Version]
  66. Wu, L.; Long, T.Y.; Liu, X.; Guo, J.S. Impacts of climate and land-use changes on the migration of non-point source nitrogen and phosphorus during rainfall-runoff in the Jialing River Watershed, China. J. Hydrol. 2012, 475, 26–41. [Google Scholar] [CrossRef]
  67. Wu, L.; Long, T.Y.; Li, C.M. The simulation research of dissolved nitrogen and phosphorus non-point source pollution in Xiao-Jiang watershed of Three Gorges Reservoir area. Water Sci. Technol. 2010, 61, 1601–1616. [Google Scholar] [CrossRef]
  68. Ma, X.; Li, Y.; Zhang, M.; Zheng, F.; Du, S. Assessment and analysis of non-point source nitrogen and phosphorus loads in the Three Gorges Reservoir Area of Hubei Province, China. Sci. Total Environ. 2011, 412, 154–161. [Google Scholar] [CrossRef]
  69. Wang, W.; Wu, X.H.; Yin, C.M.; Xie, X.L. Nutrition loss through surface runoff from slope lands and its implications for agricultural management. Agric. Water Manag. 2019, 212, 226–231. [Google Scholar] [CrossRef]
  70. Meng, Q.H.; Fu, B.J.; Yang, L.Z. Effects of land use on soil erosion and nutrient loss in the Three Gorges Reservoir Area, China. Soil Use Manag. 2001, 17, 288–291. [Google Scholar] [CrossRef]
  71. Tian, Y.W.; Huang, Z.L.; Xiao, W.F. Reductions in non-point source pollution through different management practices for an agricultural watershed in the Three Gorges Reservoir Area. J. Environ. Sci. 2010, 22, 184–191. [Google Scholar] [CrossRef]
  72. Kumwimba, M.N.; Zhu, B.; Dong, Z.; Tang, J.; Wang, T.; Xiao, L.; Muyembe, D.K. Assessing nutrient, biomass, and sediment transport of drainage ditches in the Three Gorges Reservoir Area. Clean-Soil Air Water 2017, 45, 1501012. [Google Scholar] [CrossRef]
  73. Zhu, B.; Wang, Z.H.; Wang, T.; Dong, Z.X. Non-point-source nitrogen and phosphorus loadings from a small watershed in the Three Gorges Reservoir Area. J. Mt. Sci. 2012, 9, 10–15. [Google Scholar] [CrossRef]
  74. Strehmel, A.; Schmalz, B.; Fohrer, N. Evaluation of land use, land management and soil conservation strategies to reduce non-point source pollution loads in the Three Gorges Region, China. Environ. Manag. 2016, 58, 906–921. [Google Scholar] [CrossRef] [PubMed]
  75. Ma, X.; Li, Y.; Li, B.L.; Han, W.Y.; Liu, D.B.; Gan, X.Z. Nitrogen and phosphorus losses by runoff erosion: Field data monitored under natural rainfall in Three Gorges Reservoir Area, China. Catena 2016, 147, 797–808. [Google Scholar] [CrossRef]
  76. Shen, Z.Y.; Gong, Y.W.; Li, Y.H.; Liu, R.M. Analysis and modeling of soil conservation measures in the Three Gorges Reservoir Area in China. Catena 2010, 81, 104–112. [Google Scholar] [CrossRef]
Figure 1. Location of the TGRA.
Sustainability 14 02023 g001
Figure 2. Schematic diagram of workflow and calibration of streamflow and water quality in the TGRA.
Sustainability 14 02023 g002
Figure 3. LULC distribution maps of the TGRA from 1980 to 2018.
Sustainability 14 02023 g003
Figure 4. LULC transformation in the TGRA from 1980 to 2018.
Sustainability 14 02023 g004
Figure 5. Impact of land use/cover change on runoff and nutrient load in the TGRA. (a) annual runoff depth; (b) annual TN load; (c) annual TP load; (d) monthly average runoff depth; (e) monthly average TN load; (f) monthly average TP load.
Sustainability 14 02023 g005
Figure 6. Spatial differences of runoff depth under LULC change in the TGRA. (a) runoff depth under land use of 1980; (b) changes of runoff depth between 1980 and 2000; (c) changes of runoff depth between 1980 and 2010; (d) changes of runoff depth between 1980 and 2018).
Sustainability 14 02023 g006
Figure 7. Spatial distribution differences of total nitrogen load of the TGRA under LULC change. (a) TN load under land use of 1980; (b) changes of TN load between 1980 and 2000; (c) changes of TN load between 1980 and 2010; (d) changes of TN load between 1980 and 2018).
Sustainability 14 02023 g007
Figure 8. Spatial distribution differences of total phosphorus load under LULC change in the TGRA. (a) TP load under land use of 1980; (b) changes of TP load between 1980 and 2000; (c) changes of TP load between 1980 and 2010; (d) changes of TP load between 1980 and 2018.
Sustainability 14 02023 g008
Table 1. The description of available data in the TGR.
Data NameData TypeData ScaleSources
Meteorological dataDBF-National Meteorological Science Data Sharing Center (http://data.cma.cn/ accessed on 15 January 2022)
Hydrological and water quality datatext-Hydrological Bureau, Yangtze River Water Resources Commission
DEMGDEM raster30 mChinese Academy of Sciences Data Mirror (http://www.resdc.cn/ accessed on 15 January 2022)
LULCGDEM raster100 mCNLUCC
Soil SHAPE file1:250,000Institute of Soil Science, Chinese Academy of Science
Point source dataSHAPE file-Chongqing Academy of Environmental Science, Hubei Environmental Monitoring Center Station
Social and economic dataText-Spot investigation; statistics yearbooks
Table 2. Category and definition of LULC in the TGRA, China.
CategoriesDefinition/Description
CroplandPaddy field, dry land and other agricultural lands
ForestlandForest of coniferous, broad-leaved, mixed and shrub trees
GrasslandGrass and meadow
Water areaRivers, lakes and ponds
Construction landResidential land, industrial land, commercial land, transportation land, etc.
Unused landLands unused or difficult to use, such as bare rocks, riparian zones, etc.
Table 3. Land use dynamics in the TGRA from 1980 to 2018.
Time PeriodCroplandForestlandGrasslandConstruction LandWater AreaUnused
1980–1990−0.02%0.01%−0.02%0.65%0.13%−0.11%
1990–1995−0.05%0.04%−0.08%1.29%0.05%0.06%
1995–2000−0.04%−0.10%0.29%2.98%0.07%0.04%
2000–2005−0.21%0.21%−0.38%1.61%1.33%−7.28%
2005–2010−0.26%0.07%−0.09%4.35%2.16%−0.30%
2010–2015−0.35%−0.04%−0.05%9.72%0.51%0.96%
2015–2018−0.02%−0.07%0.11%2.15%−1.54%−1.31%
1980–2018−0.12%0.02%−0.04%0.47%0.47%−0.98%
Table 4. Runoff contribution rates of different LULC types in the TGRA.
LULCRunoff Contribution
CroplandForestlandConstruction LandGrassland
LU198033.2155.610.2010.99
LU199033.1355.660.2310.97
LU199533.0355.780.2610.93
LU200033.0355.410.2911.26
LU200532.6656.040.3310.97
LU201032.2556.130.6111.02
LU201531.7256.011.3010.97
LU201831.7355.911.4610.91
Average32.6055.820.5811.00
Table 5. TN load contribution of different LULC types in the TGRA.
LULCTN Load Contribution (%)
CroplandForestlandConstruction LandGrassland
LU198056.5341.780.061.63
LU199056.5741.740.061.63
LU199556.4841.830.071.62
LU200056.5741.690.071.68
LU200556.0942.210.071.63
LU201055.7342.510.101.65
LU201555.1443.000.201.67
LU201855.0143.110.221.66
Average56.0242.230.111.65
Table 6. TP load contribution of different LULC types in the TGRA.
LULCTP Load Contribution (%)
CroplandForestlandConstruction LandGrassland
LU198082.059.470.138.35
LU199081.939.540.158.38
LU199581.889.580.178.37
LU200081.859.550.208.41
LU200581.769.770.238.25
LU201081.379.870.418.35
LU201580.749.940.928.40
LU201880.819.871.048.29
Average81.559.700.408.35
Publisher’s Note: MDPI stays neutral with regard to jurisdictional claims in published maps and institutional affiliations.

