
Spatial Analysis of the Empirical Behavior of Municipal Institutional Capacity for the Formulation of Sustainable Growth Management Strategies with a Regional Focus: State of Veracruz, Mexico

 ,
,  ,
,  ,
,  and
and
Abstract
:1. Introduction
2. Materials and Methods
3. Results
3.1. First Stage: Review of Theoretical Bases and Antecedents
3.2. Second Stage: Spatial Analysis and Hypothesis Testing
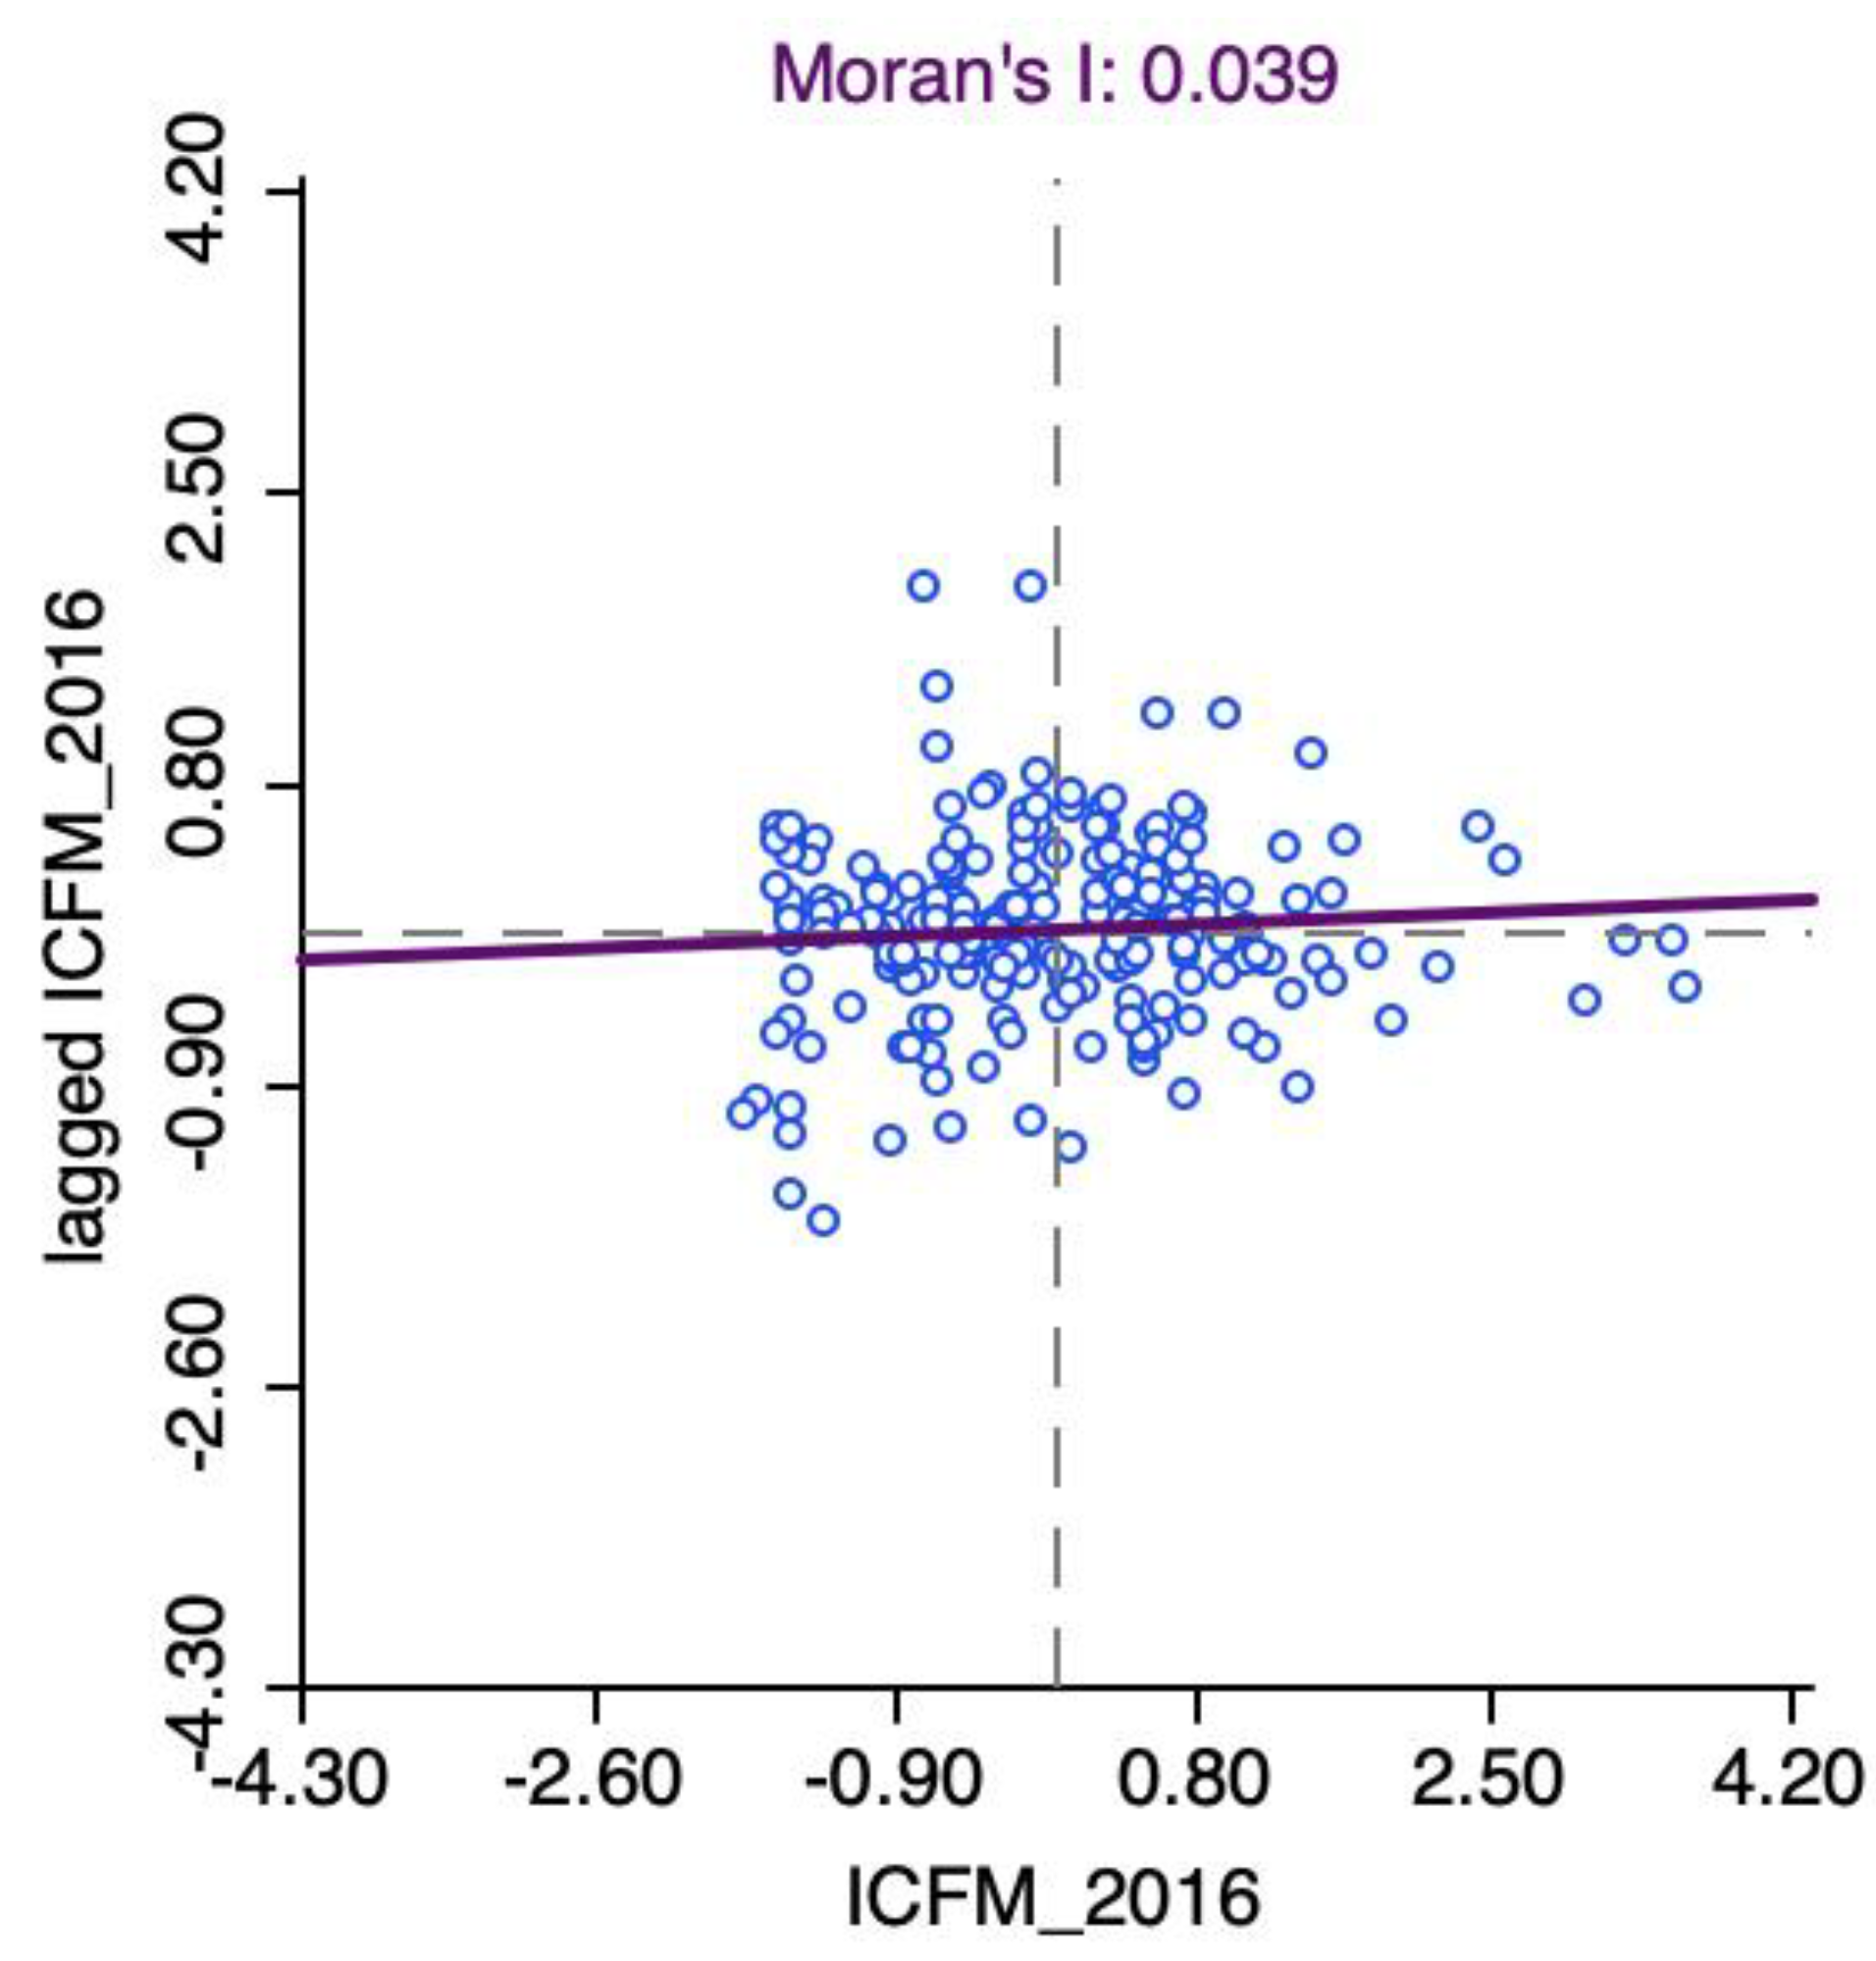
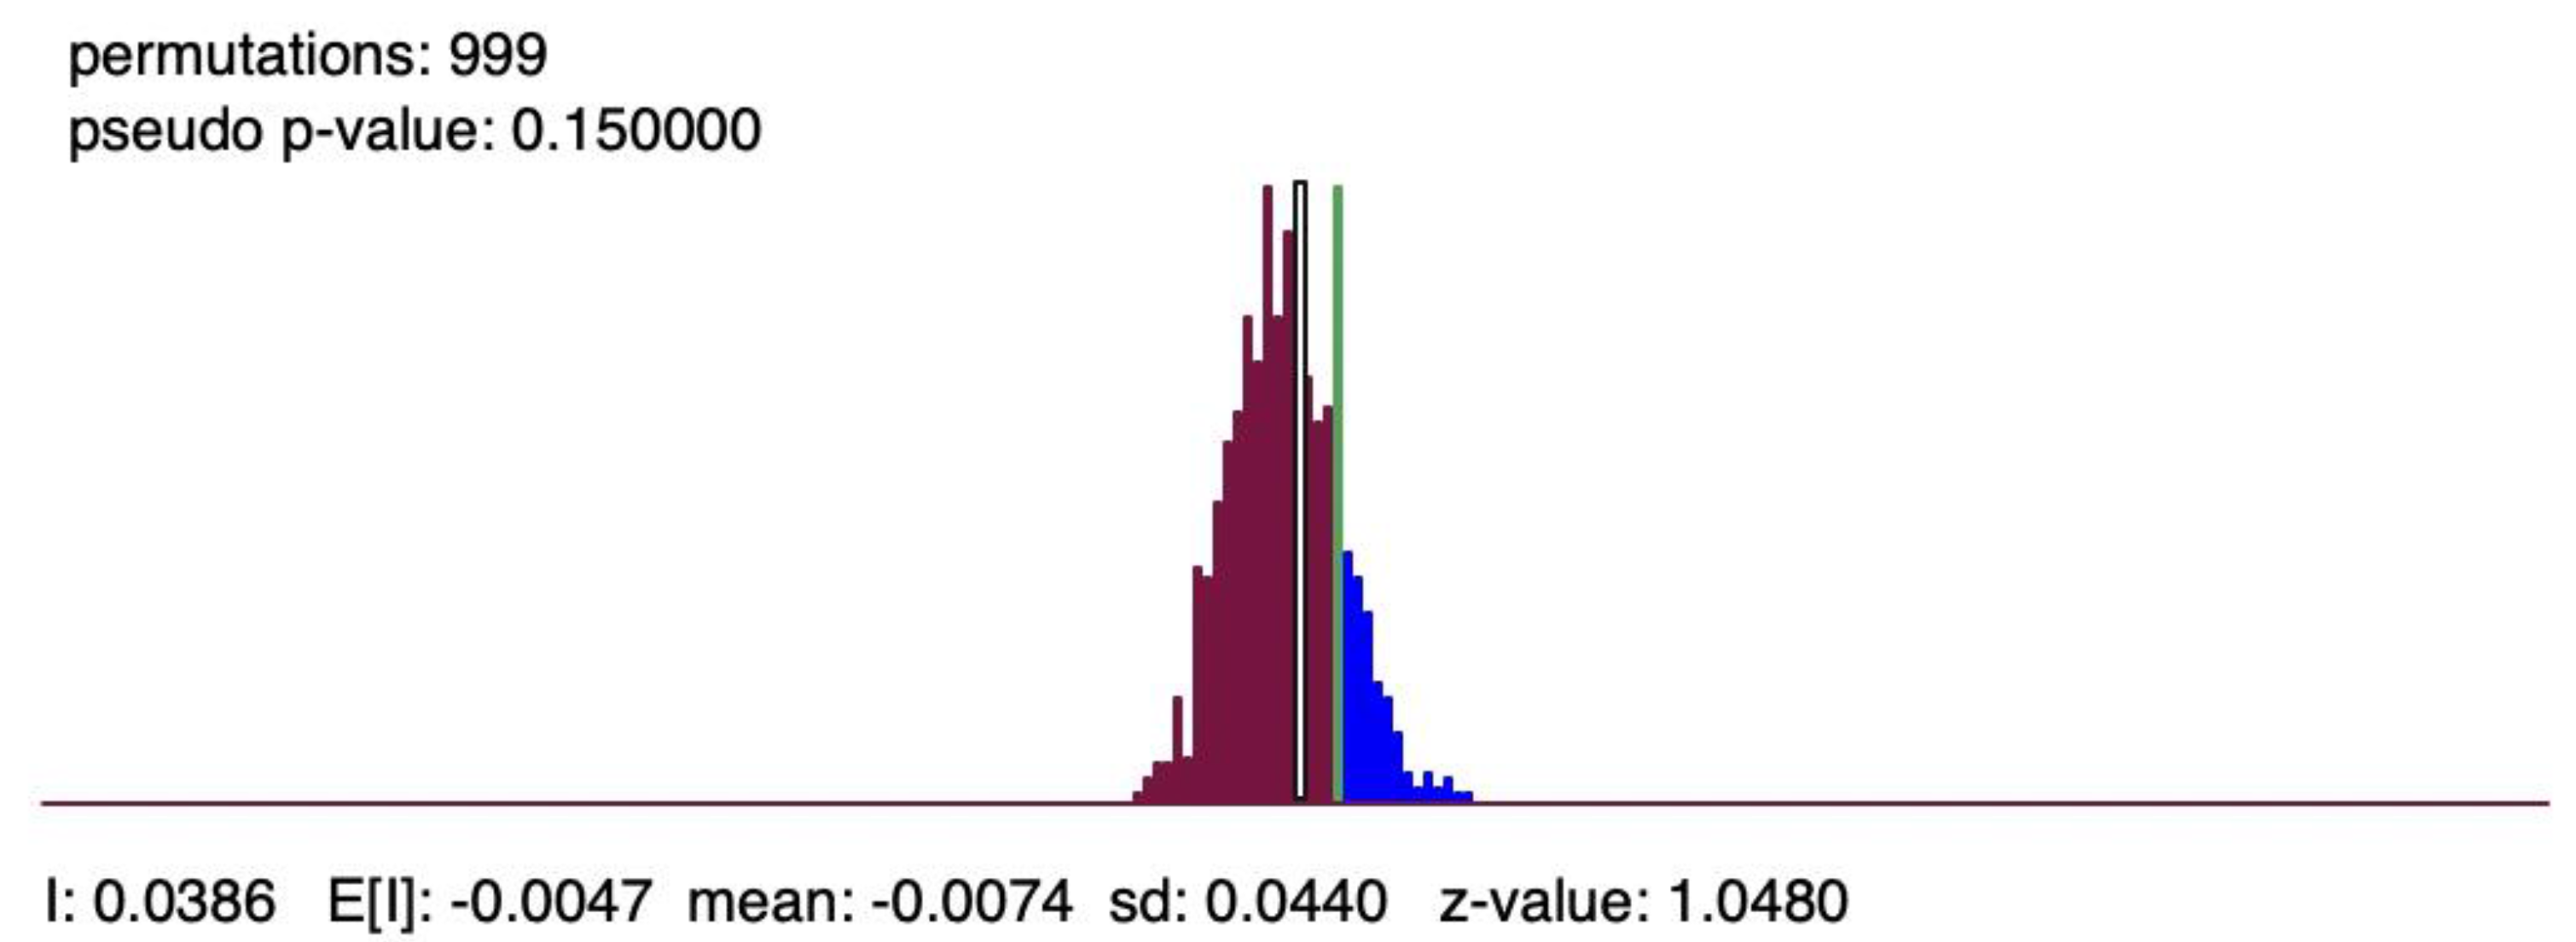
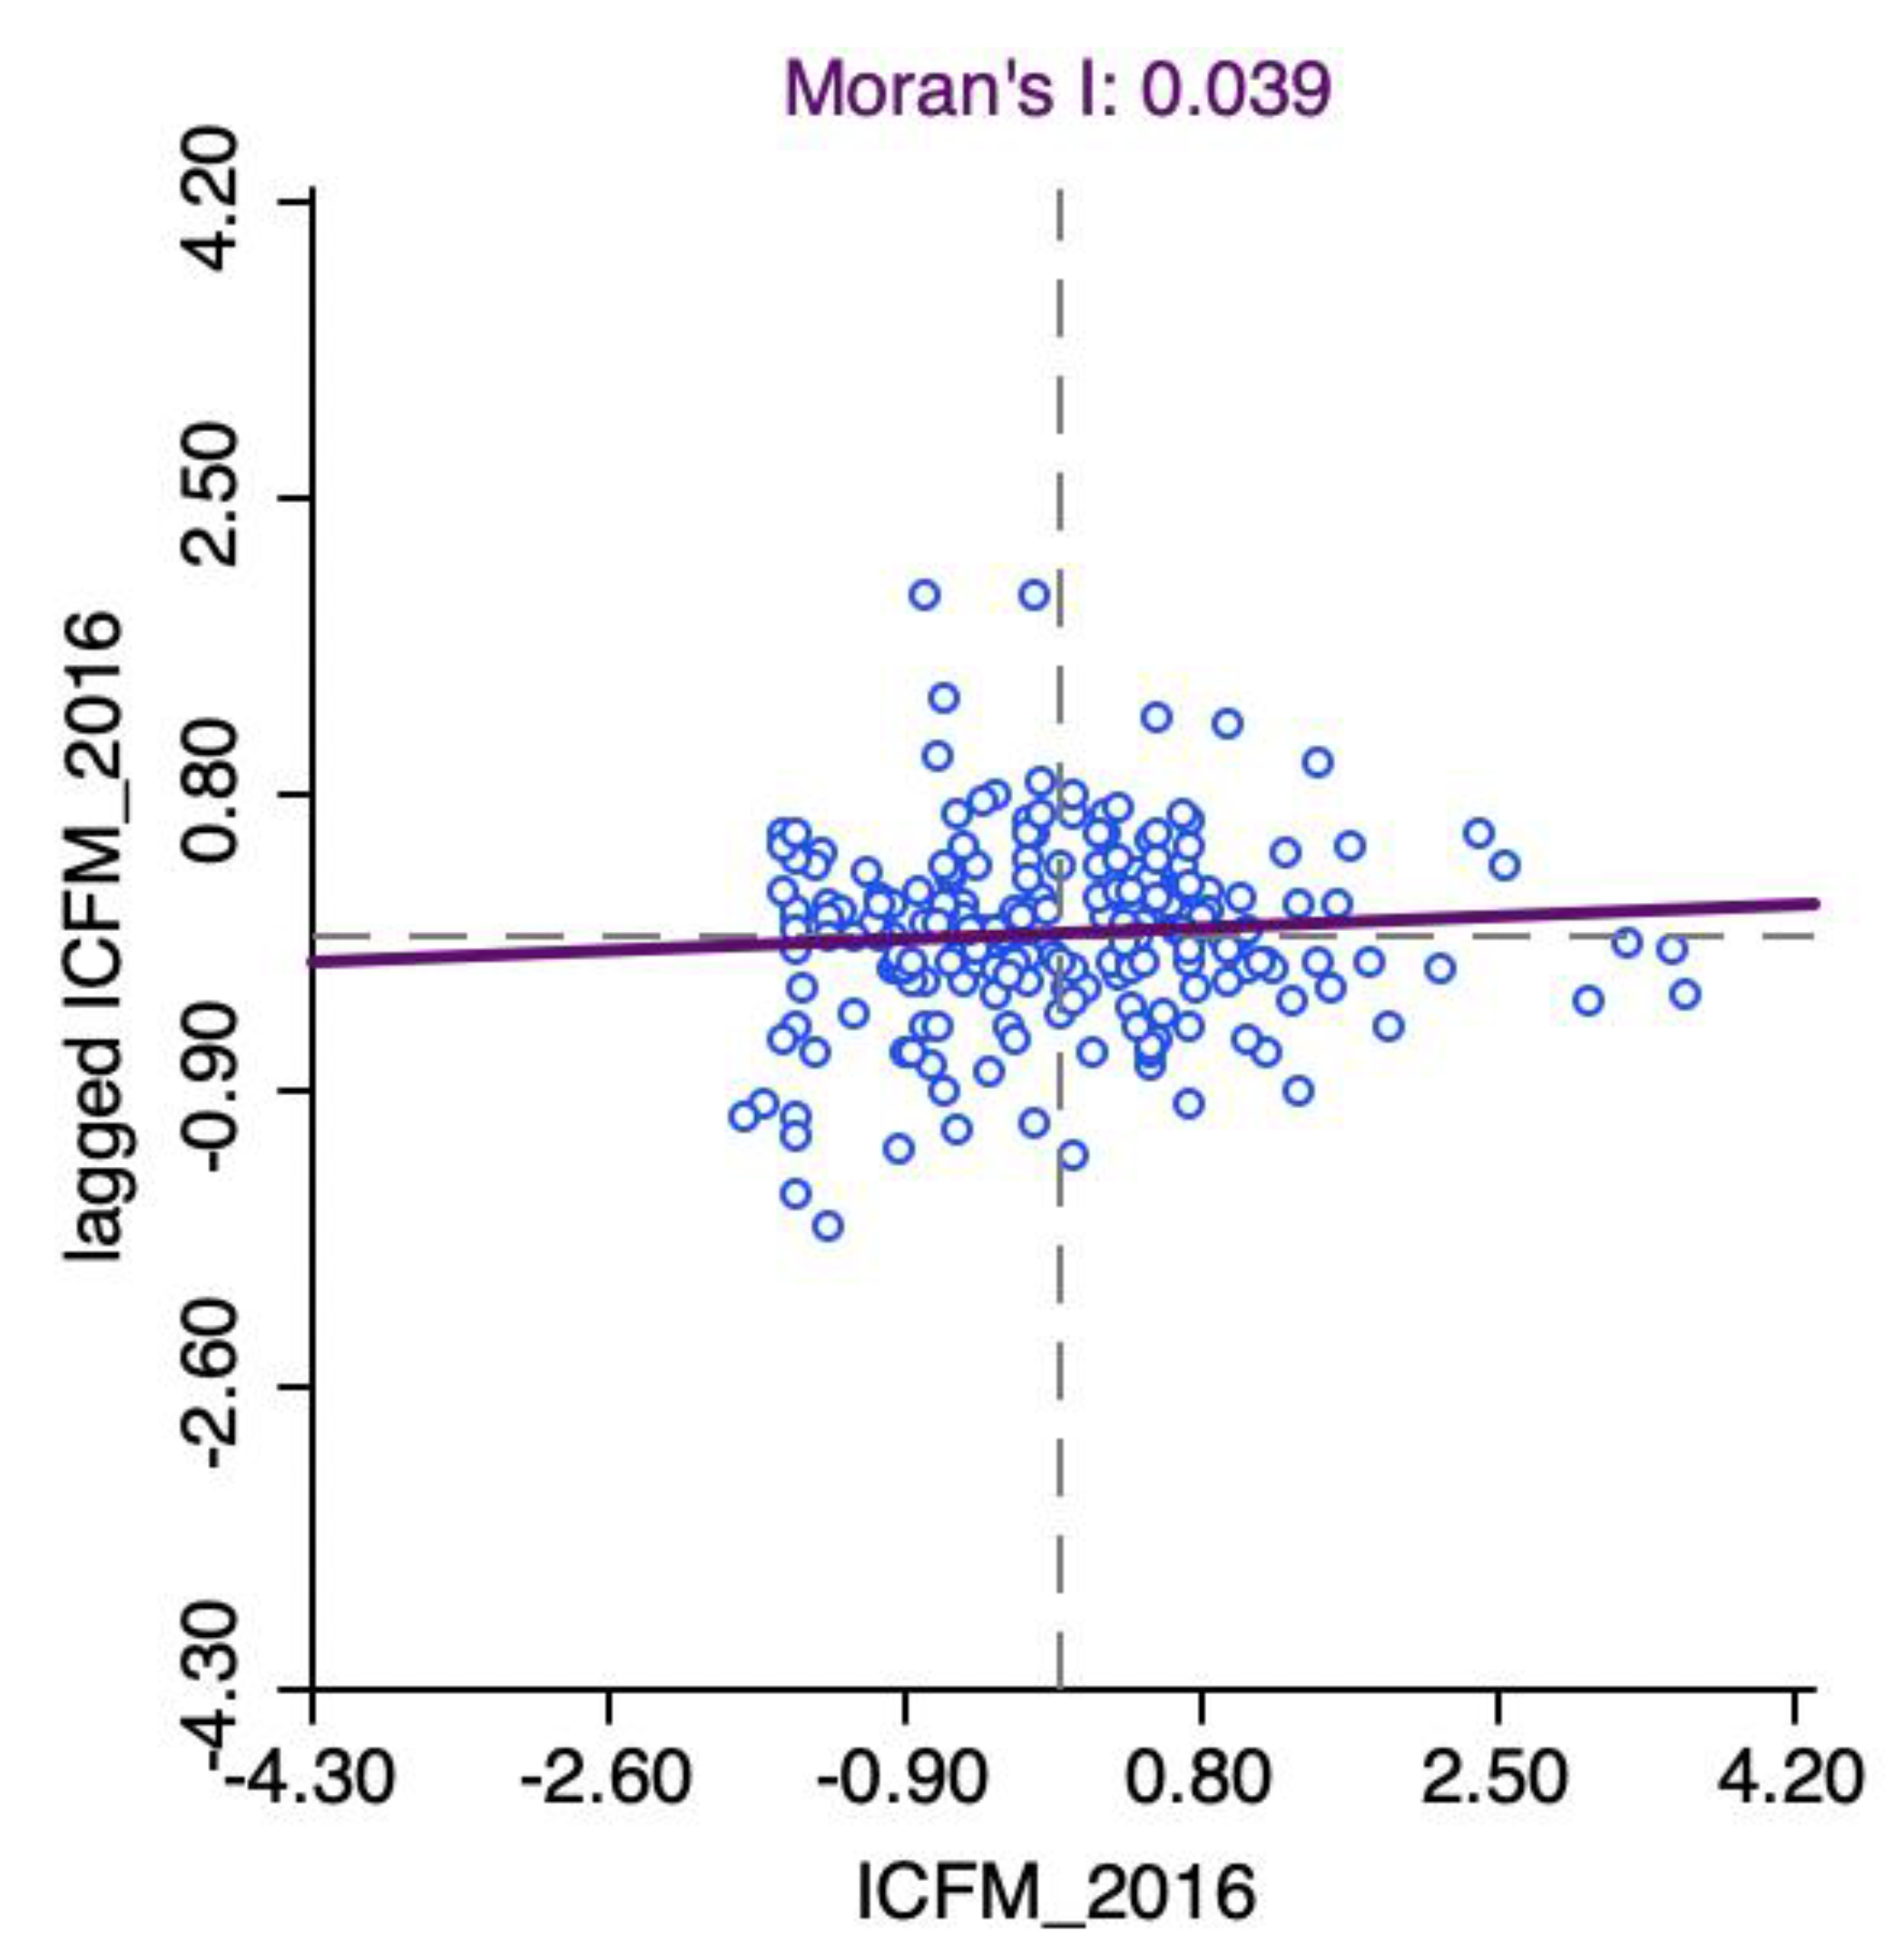
3.2.1. Global Autocorrelation
3.2.2. Hypothesis Testing
3.2.3. Local Autocorrelation
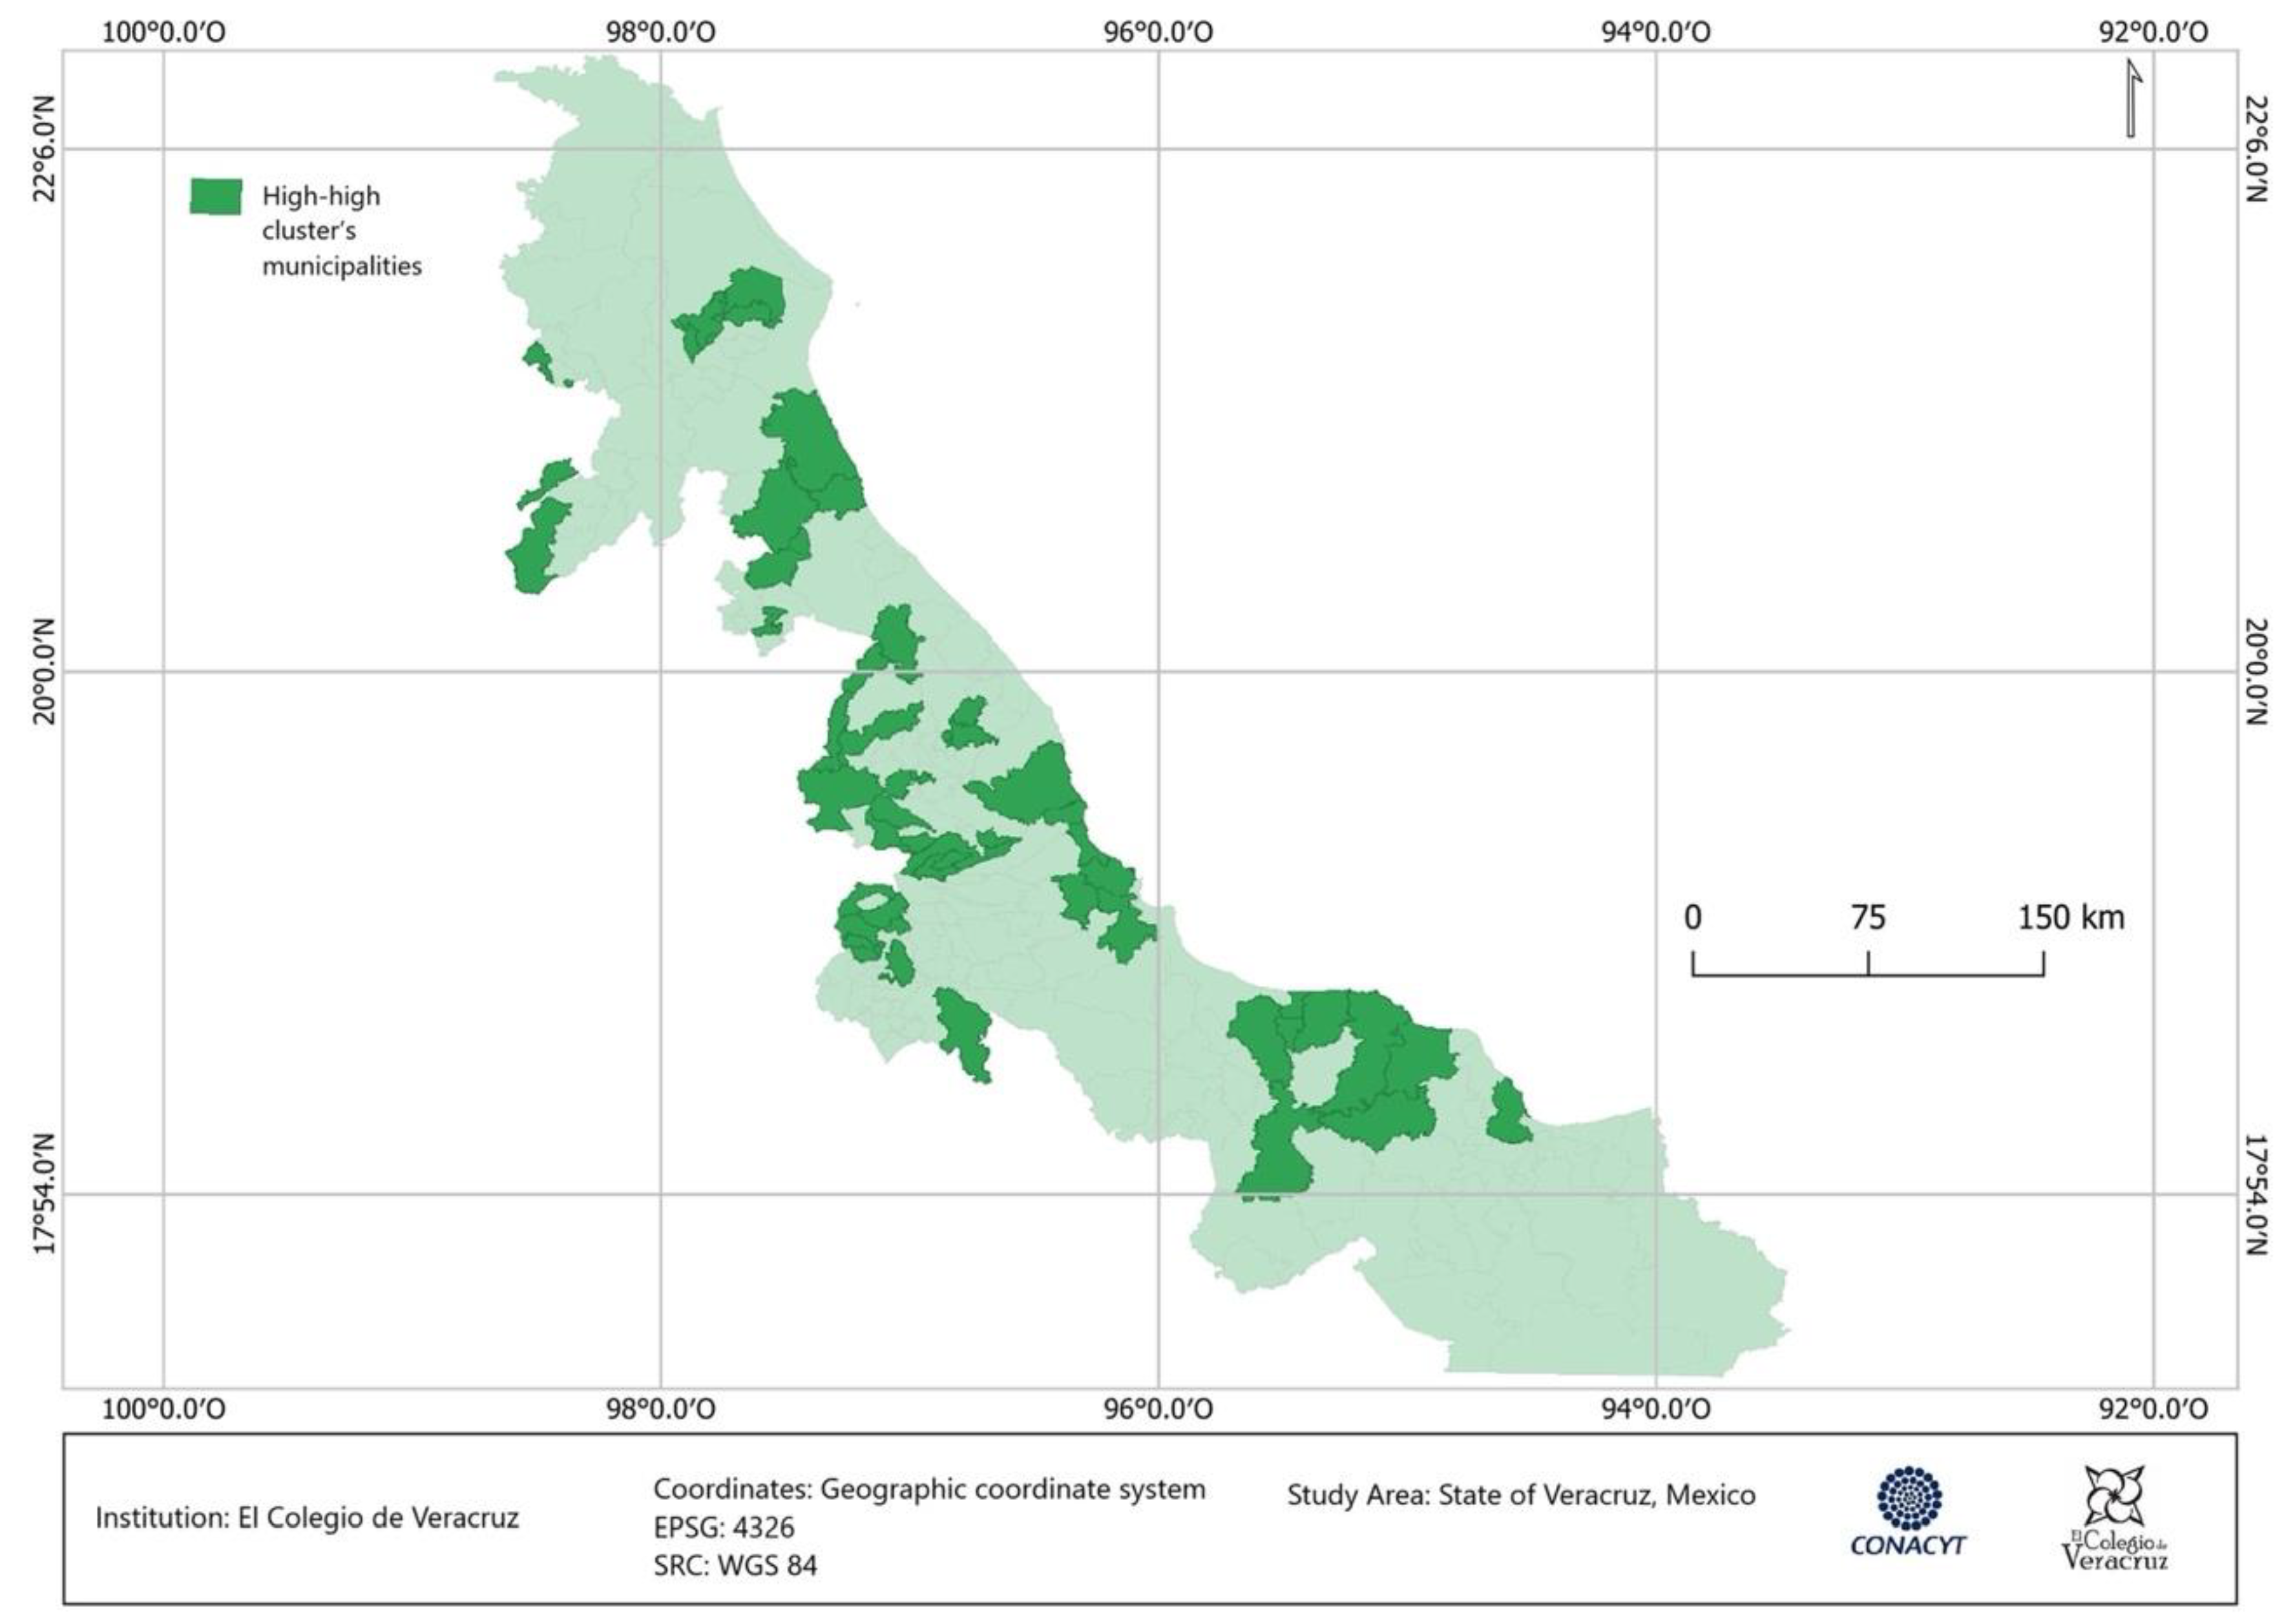
- (a)
- High–high cluster: integrated by the municipalities of Tlaltetela (0.249), Calcahualco (0.432), Coatzintla (0.314), Xico (0.274), and Lerdo de Tejada (0.364);
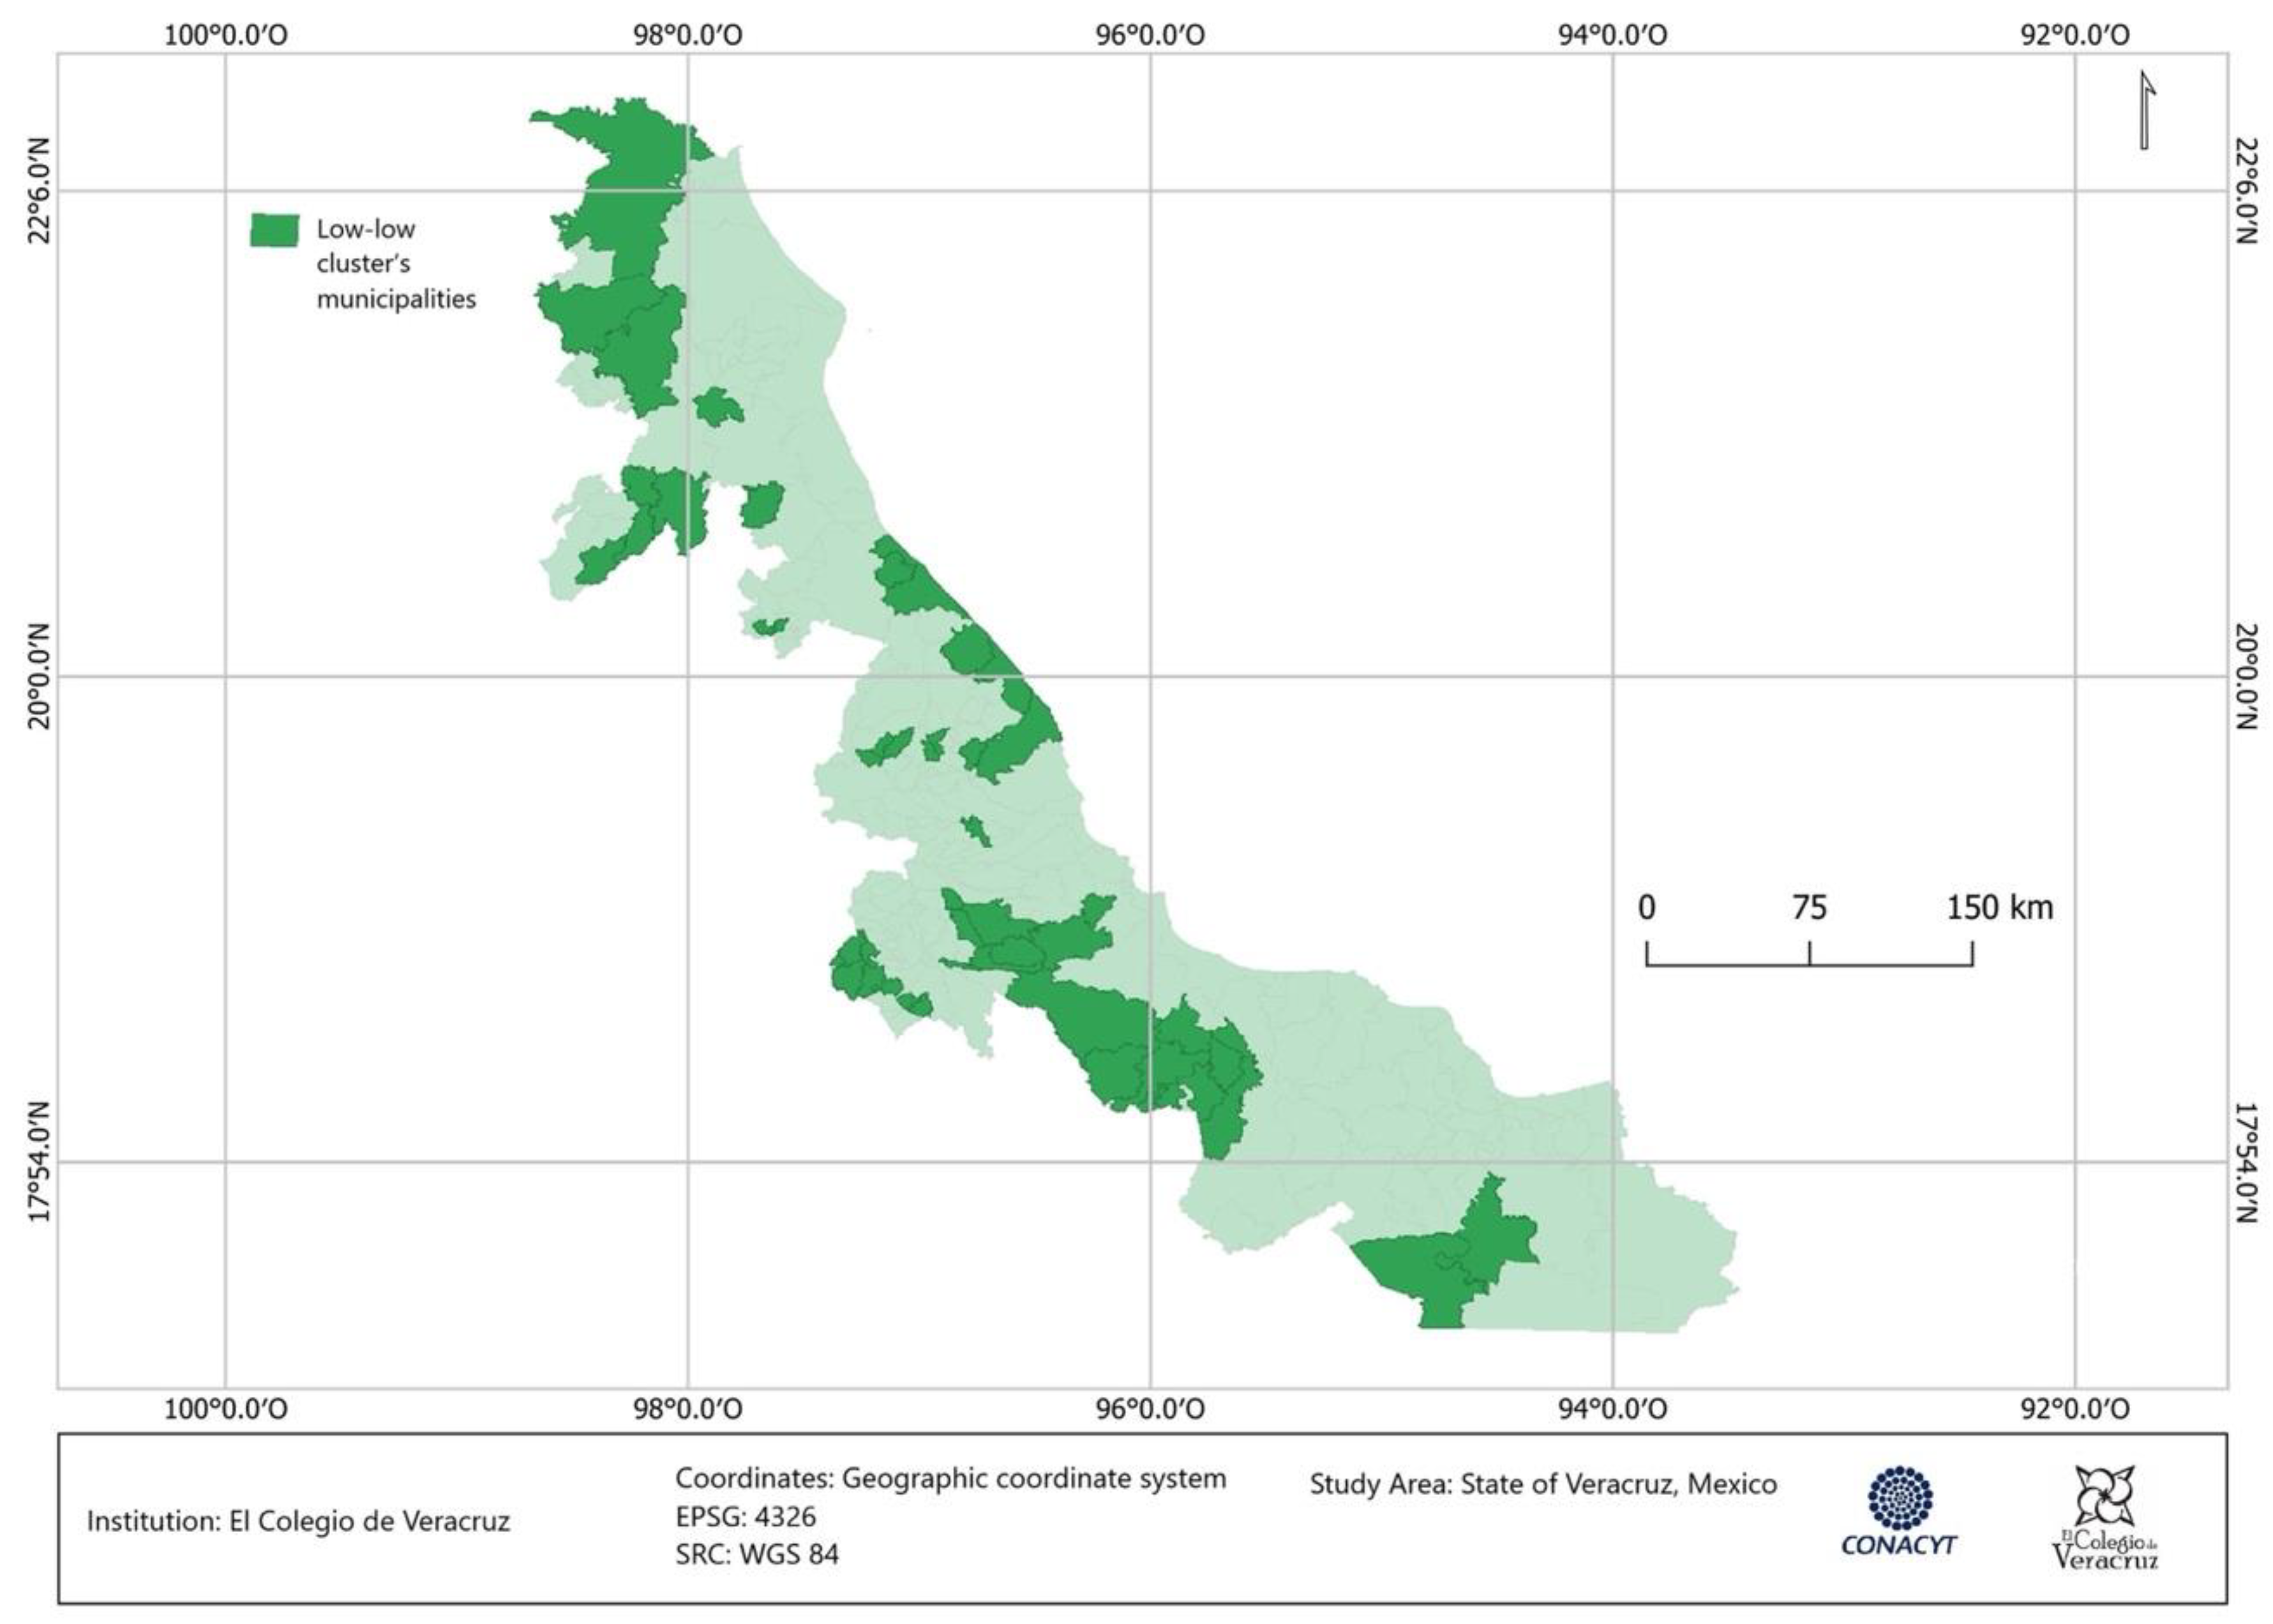
- (b)
- Low–low cluster: integrated by the municipalities of Acultzingo (0.148), Amatitlán (0.013), Aquila (0.217), Atoyac (0.123), Carrillo Puerto (0.114), Cosamaloapan de Carpio (0.000), Cuitláhuac (0.053), Chacaltianguis (0.038), Ixmatlahuacan (0.025), Paso del Macho (0.142), José Azueta (0.127), Tierra Blanca (0.038), Tres Valles (0.064), and Carlos A. Carrillo (0.038).
4. Discussion
5. Conclusions
Author Contributions
Funding
Institutional Review Board Statement
Informed Consent Statement
Data Availability Statement
Conflicts of Interest
Appendix A

| International: | |
| Sustainable Development Goals [63] | Goal 11: Sustainable cities and communities Goal 16: Peace, justice, and strong institutions. |
| National: | |
| National Development Plan 2019–2024 [64] | Cross-curricular axes: Fighting corruption and improving public management Territory and sustainable development General axis: Well-being Goal 2.5: Guarantee the right to a healthy environment with a focus on the sustainability of ecosystems, biodiversity, heritage, and biocultural landscapes Strategy 2.5.5: articulate governmental action to contribute to environmental public management with a focus on territoriality, sustainability, human rights, and gender. |
| Sectoral Programs 2020–2024 [65] | Governance sectoral program Priority goal 6: Strengthen federalism, decentralization, and municipal development. Sectoral program for agrarian, territorial, and urban development Priority goal 1: Establish an integrated, orderly, inclusive, sustainable, and safe territorial system. National Program to Combat Corruption and Impunity and to Improve Public Management 2019–2024 Goal 3: Promote the efficiency and effectiveness of public management. Goal 4: Promote the professionalization and efficient management of the human resources of the Federal Public Administration. |
| National Strategic Program in Socio-ecological Systems and Sustainability. Theme: Design of sustainable territorial socio-ecological planning instruments, adaptation measures to global change (for example, urban development plans, territorial ordinances). Institutional Program 2020–2024 of the National Council of Science and Technology Priority objective 5: Articulate and strengthen the scientific, humanistic and technological capacities of the country by linking with regional actors to influence strategic national problems in favor of social benefit, environmental care, biocultural diversity, and common goods. | |
| State: | |
| Veracruz Development Plan 2019–2024 [47] | Block: Politics and Government Goal: Project the political development of the State of Veracruz. Block: Social welfare Goal: Contribute to the social welfare of subjects of law |
| State Program of Statistics and Geography 2019–2024 [66] | Project I.2: Analysis to determine the demand for statistical and geographic information in the State. Project V.2.7: Establish the Interactive Consultation of Municipal Information (CIIM) Project V.2.9: Carry out analysis documents with relevant information and/or situation of the State. Project V.2.9: Make the Catalog of indicators. |
Appendix B
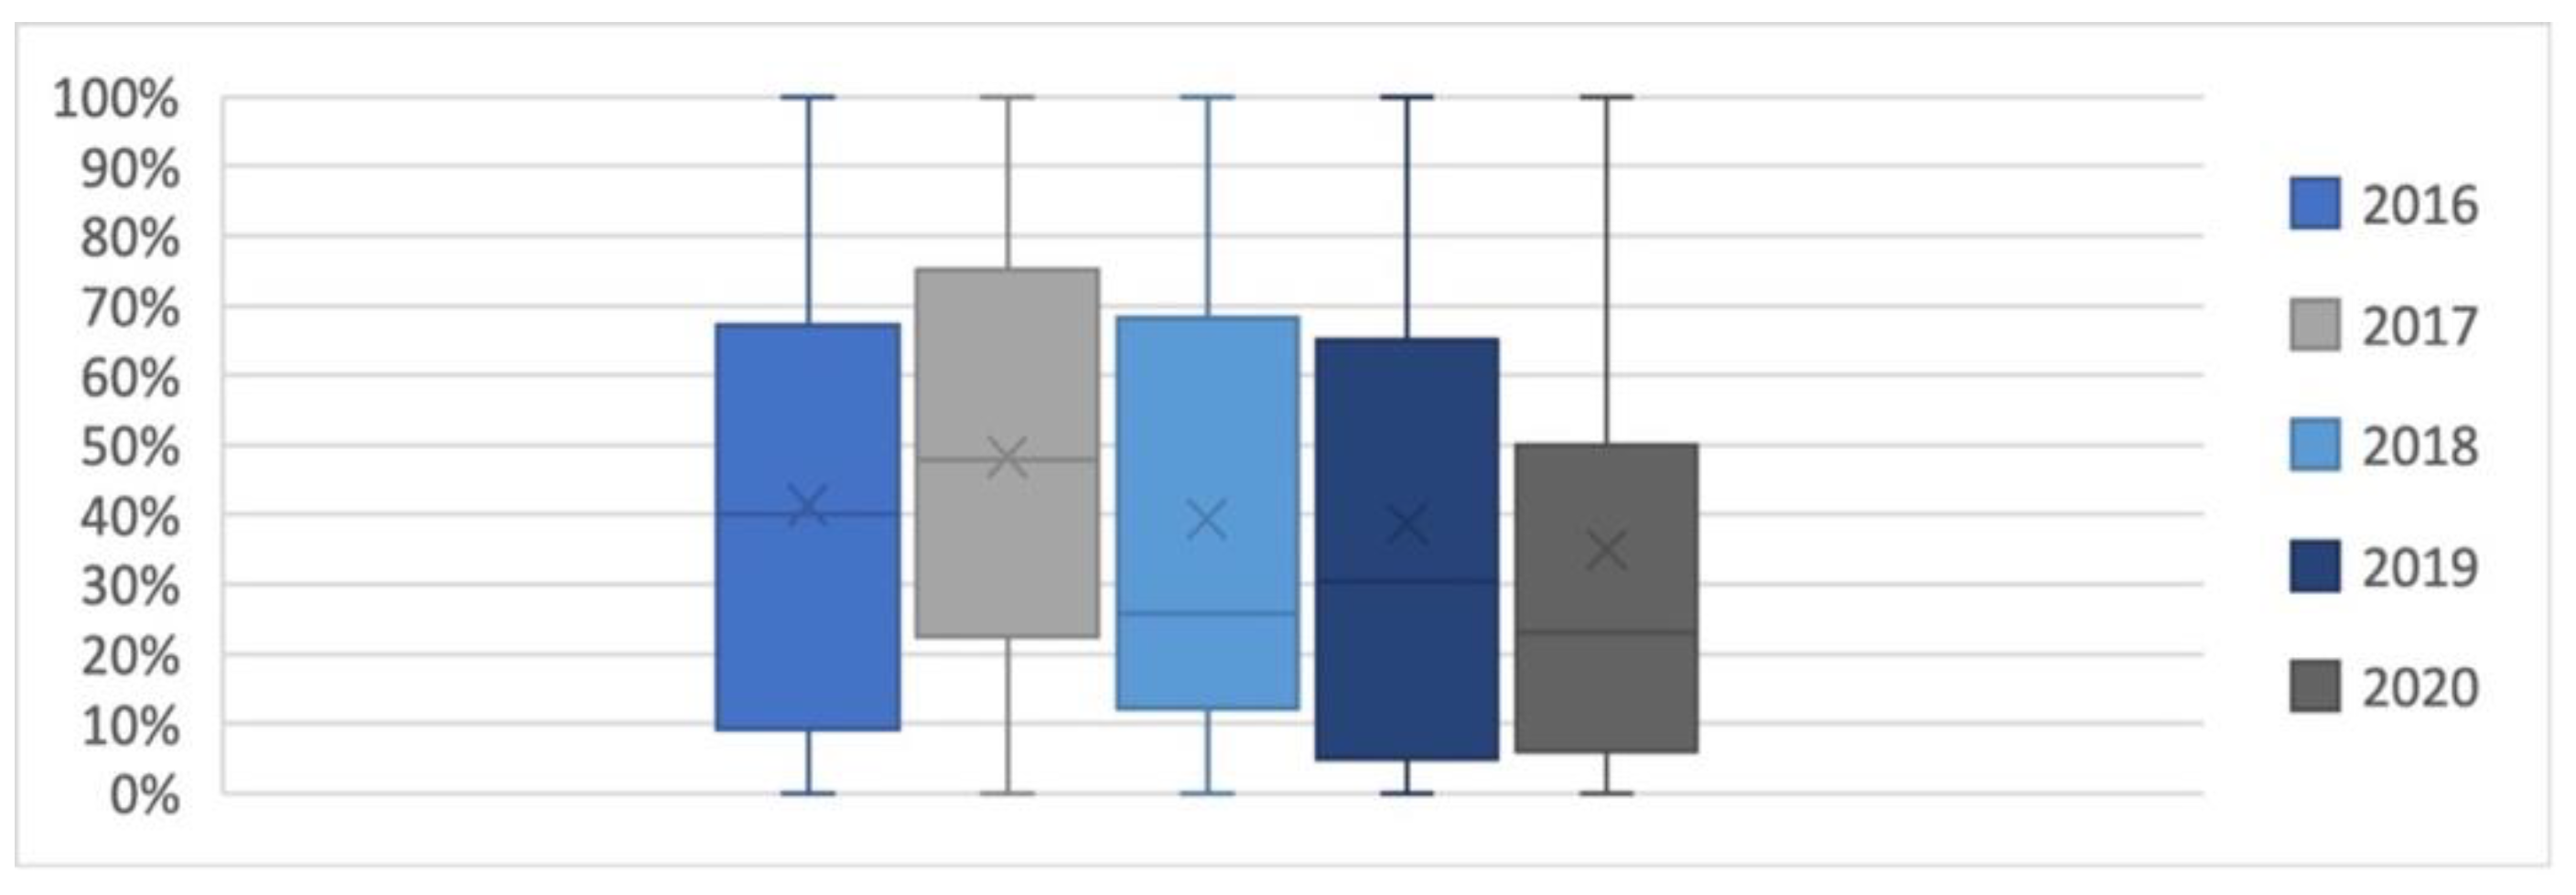

| Year | Place According to Its Participation | % of Municipalities That Participate |
|---|---|---|
| 2020 | 1st lowest place * | 4 |
| 2019 | 1st lowest place ** | 4 |
| 2018 | 1st lowest place *** | 2 |
| 2017 | 2nd lowest place **** | 2 |
| 2016 | 2nd lowest place ***** | 6 |
Appendix C
Appendix D
| Property | Value |
| Type | Rook |
| Symmetry | Symmetric |
| File | ICFM_2016Torre.gal |
| Id variable | CVEGEO |
| Order | 1 |
| # Observations | 212 |
| Min neighbors | 1 |
| Max neighbors | 12 |
| Mean neighbors | 5.10 |
| Median neighbors | 5.00 |
| % Non-zero | 2.41% |


References
- Rosas Huerta, A. Una ruta metodológica para evaluar la capacidad institucional. Política Y Cult. 2008, 30, 119–134. [Google Scholar]
- Pearson, J. Metropolitan Governance:A Framework for Capacity Assessment Guidance Notes and Toolbox; Deutsche Gesellschaft für Internationale Zusammenarbeit (GIZ) GmbH: Eschborn, Germany, 2016. [Google Scholar]
- Aguilar Villanueva, L.F. Gobierno y Desarrollo. Iberoforum. Rev. Cienc. Soc. Univ. Iberoam. 2007, 2, 1–20. [Google Scholar]
- ASF Desarrollo Institucional Municipal; Auditoría Superior de la Federación: Ciudad de México, México 2015. Available online: http://200.23.8.25/ASF/?m=bWVudSww (accessed on 6 June 2021).
- Grindle, M.S. Good Enough Governance Revisited. Dev. Policy Rev. 2007, 25, 533–574. [Google Scholar] [CrossRef]
- OECD. Building Capacity for Evidence-Informed Policy-Making: Lessons from Country Experiences; OECD Public Governance Reviews; OECD: Paris, France, 2020; ISBN 978-92-64-53757-6. [Google Scholar]
- UNDP. Informe de Desarrollo Humano Municipal 2010–2015 Transformando México Desde Lo Local; UNDP: New York, NY, USA, 2019; p. 348. [Google Scholar]
- Pulfer, G. Dilemmas of State Building in a Fragile Context. In Democratic Governance Insights. Issues 1–12; Democratic Governance Practice Network (DGP-NET): New York, NY, USA, 2011. [Google Scholar]
- SEFIPLAN Índice de Desarrollo Humano 2010 y 2015 y Capacidades Funcionales de Los Municipios 2016. Principales Resultados Para El Estado de Veracruz; Secretaría de Finanzas y Planeación. Subsecretaría de Planeación: Veracruz, México, 2019.
- UNDP. Capacity Assessment. Practice Note; UNDP: New York, NY, USA, 2008. [Google Scholar]
- USAID. CITIES Municipal Institutional Capacity Assessment (MICA) Final Report; USAID/Jordan: Washington, DC, USA, 2017. [Google Scholar]
- UNDP. Measuring Capacity; United Nations Development Programme: New York, NY, USA, 2010. [Google Scholar]
- Grindle, M.S.; Hilderbrand, M.E. Building Sustainable Capacity in the Public Sector: What Can Be Done? Public Adm. Dev. 1995, 15, 441–463. [Google Scholar] [CrossRef]
- Montañez Gómez, G.; Delgado Mahecha, O. Espacio, Territorio y Región: Conceptos Básicos Para Un Proyecto Nacional. Cuad. Geogr. Rev. Colomb. Geogr. 1998, 7, 120–134. [Google Scholar]
- Nohlen, D.; Sturm, R. La heterogeneidad estructural como concepto básico de la teoría de desarrollo. Rev. Estud. Políticos 1982, 28, 45–74. [Google Scholar]
- Wallis, J.; Dollery, B. Social Capital and Local Government Capacity. Aust. J. Public Adm. 2002, 61, 76–85. [Google Scholar] [CrossRef]
- Completa, E.R. Capacidad Estatal, Brechas de Capacidad y Fortalecimiento Institucional. Análisis Político 2016, 29, 60–76. [Google Scholar] [CrossRef] [Green Version]
- Cohen, J.M. Capacity Building in the Public Sector: A Focused Framework for Analysis and Action. Int. Rev. Adm. Sci. 1995, 61, 407–422. [Google Scholar] [CrossRef]
- Gargantini, D.M.; Pedrotti, C.I. Capacidades institucionales del gobierno municipal en el diseño y gestión de políticas habitacionales. Econ. Soc. Y Territ. 2018, 18, 319–357. [Google Scholar] [CrossRef] [Green Version]
- Pribble, J. The Politics of Building Municipal Institutional Effectiveness in Chile. Lat. Am. Politics Soc. 2015, 57, 100–121. [Google Scholar] [CrossRef]
- Moreno Jaimes, C. Para entender el desarrollo de las capacidades institucionales en los gobiernos municipales en México. Buen Gob. 2008, 5, 49–61. [Google Scholar] [CrossRef]
- INAFED. Resultados del Programa Agenda para el Desarrollo Municipal 2017; 2017. Available online: http://www.gob.mx/inafed/documentos/resultados-del-programa-agenda-para-el-desarrollo-municipal-2017 (accessed on 6 June 2021).
- INAFED. Resultados del Programa Agenda para el Desarrollo Municipal 2018; 2018. Available online: http://www.gob.mx/inafed/documentos/resultados-del-programa-agenda-para-el-desarrollo-municipal-2018-183273 (accessed on 6 June 2021).
- INAFED Resultados GDM. SiGuía 2020. Available online: http://siglo.inafed.gob.mx/siguia/index.php (accessed on 6 June 2021).
- INAFED. Participación de cada estado en el programa Agenda para el Desarrollo Municipal 2016. Available online: http://www.gob.mx/inafed/documentos/participacion-de-cada-estado-en-adm-2016 (accessed on 6 June 2021).
- Giraudy, A.; Moncada, E.; Snyder, R. El Análisis Subnacional: Aportes Teóricos y Metodológicos a La Política Comparada. Rev. Cienc. Política 2021, 41, 1–34. [Google Scholar] [CrossRef]
- Harbers, I.; Ingram, M.C. Politics in Space: Methodological Considerations for Taking Space Seriously in Subnational Research. In Inside Countries: Subnational Research in Comparative Politics; Giraudy, A., Moncada, E., Snyder, R., Eds.; Cambridge University Press: Cambridge, UK, 2019; pp. 57–91. ISBN 978-1-108-49658-2. [Google Scholar]
- Acevedo Bohórquez, I.; Velásquez Ceballos, E. Algunos Conceptos de La Econometría Espacial y El Análisis Exploratorio de Datos Espaciales. Rev. Ecos Econ. 2008, 12, 9–34. [Google Scholar]
- Hernández Sampieri, R.; Fernández Collado, C.; Baptista Lucio, M.d.P. Metodología de La Investigación, 6th ed.; Mcgraw-Hill/Interamericana Ed.: Mexico City, México, 2014; ISBN 978-1-4562-2396-0. [Google Scholar]
- Mujica, N.; Rincón, S. Bases constitutivas de un modelo de desarrollo alternativo para Venezuela. Telos 2016, 18, 431–453. [Google Scholar]
- Beltrán Saravia, V. Diagnóstico del déficit de capacidad institucional de los procesos para el rediseño organizacional en el sector público. Perf. Ing. 2015, 11, 11. [Google Scholar] [CrossRef]
- Oszlak, O.; Orellana, E. El Análisis de La Capacidad Institucional: Aplicación de La Metodología SADCI. 1993. Available online: http://www.top.org.ar/Documentos/OSZLAK,%20Oscar%20y%20ORELLANA,%20Edgardo%20-%20El%20análisis%20de%20la%20capacidad%20institucional.pdf (accessed on 6 June 2021).
- Jaime, F.; Vaca Avila, P. Las políticas basadas en evidencia como plataformas para la innovación de políticas públicas. Estado Abierto. Rev. Sobre El Estado La Adm. Y Las Políticas Públicas 2017, 2, 51–76. [Google Scholar]
- Siabato, W.; Guzmán-Manrique, J. La Autocorrelación Espacial y El Desarrollo de La Geografía Cuantitativa. Cuad. Geogr. Rev. Colomb. Geogr. 2019, 28, 1–22. [Google Scholar] [CrossRef]
- González Pérez, M.; Pérez Coello, L.; Castro Contreras, E.B. Diagnóstico de las capacidades funcionales en el contexto local (Original). Redel. Rev. Granmense Desarro. Local 2019, 3, 138–151. [Google Scholar]
- Santos Assan, A.H.; Gallardo Milanés, O.A. Desarrollo humano a escala local: Experiencias en el municipio Urbano Noris, Holguín/Cuba. Revista NUPEM 2017, 9, 26–37. [Google Scholar] [CrossRef]
- Valencia Pozo, C.A. Gestión Municipal y Desarrollo Local en el Distrito de Chavín de Huantar, 2017; Tesis de Maestría en Gestión Pública, Universidad Cesar Vallejo: Lima, Perú, 2017. [Google Scholar]
- Vera Lara, E. Innovación Institucional en el Gobierno Municipal de la Provincia de Jaén, Para la Gestión del Desarrollo Económico Local, Jaén—Cajamarca, 2015—2016; Tesis de Doctorado en Gestión Pública y Gobernabilidad, Universidad Cesar Vallejo: Lima, Perú, 2017. [Google Scholar]
- Palacios Rojas, D.M. Gestión municipal y desarrollo local de la Provincia de Chupaca del Departamento de Junín—2016; Tesis de Maestría en Administración Pública y Gobierno, Universidad Nacional del Centro del Perú: Huancayo, Perú, 2018. [Google Scholar]
- Peña Mcguire, J. Factores Que Influyen en la Gestión de las Políticas de Desarrollo Económico Local en la Municipalidad Distrital de Matapalo-Tumbes 2015-2016; Tesis de Maestría en Gestión Pública, Universidad Nacional de Tumbes: Tumbes, Perú, 2018. [Google Scholar]
- Vare Polo, E.R. Gestión Municipal y Desarrollo Local en el distrito de Supe, 2017; Tesis Licenciatura en Sociología, Universidad Nacional José Faustino Sánchez Carrión: Lima, Perú, 2017. [Google Scholar]
- Guzmán Gil, P.D.; Becerril Sánchez, T. El desarrollo de capacidades institucionales ante los retos de la coordinación metropolitana en México: El caso de Toluca. Decumanus 2019, 4, 4. [Google Scholar] [CrossRef]
- International Organization for Standardization ISO 18091:2019(en) Quality Management Systems—Guidelines for the Application of ISO 9001 in Local Government. Available online: https://www.iso.org/obp/ui#iso:std:iso:18091:ed-2:v1:en (accessed on 27 November 2021).
- INAFED Instituto Nacional Para El Federalismo y El Desarrollo Municipal. Available online: https://www.gob.mx/inafed (accessed on 16 June 2021).
- Kientz, D.G. Regionalización geomorfológica del estado de Veracruz. Investig. Geográficas (Mx) 1999, 40, 23–47. [Google Scholar]
- Chiappy Jhones, C.J.; Gama, L.; Soto Esparza, M.; Geissert, D.; Chávez, J. Regionalización Paisajística Del Estado de Veracruz, México. Univ. Y Cienc. 2002, 18, 87–113. [Google Scholar]
- Poder Ejecutivo. Plan Veracruzano de Desarrollo 2019–2024; Gobierno del Estado: Veracruz, México, 2019; Available online: http://repositorio.veracruz.gob.mx/wp-content/uploads/sites/4/files/transp/pvd_2019_2024/Gac2019-224_Miercoles_05_TOMO_II_Ext_(PLAN_VERACRUZANO_2019_2024).pdf (accessed on 27 November 2021).
- Gobierno de Estado de Veracruz. Nueva Normalidad. 2021. Available online: http://coronavirus.veracruz.gob.mx/nueva-normalidad/ (accessed on 27 November 2021).
- CEIEG-SEFIPLAN Documentos de Análisis|Estudios Regionales para la Planeación. Available online: http://ceieg.veracruz.gob.mx/2019/10/07/documentos-de-analisis/ (accessed on 12 January 2021).
- INEGI Marco Geoestadístico. Censo de Población y Vivienda 2020. Available online: https://www.inegi.org.mx/app/biblioteca/ficha.html?upc=889463807469 (accessed on 21 June 2021).
- Getis, A. Spatial Autocorrelation. In Handbook of Applied Spatial Analysis; Fischer, M.M., Getis, A., Eds.; Springer: Berlin/Heidelberg, Germany, 2010; pp. 255–278. ISBN 978-3-642-03646-0. [Google Scholar]
- Mendoza, J.A.H. Taller de Análisis de Datos Espaciales con Geoda. Índice Global y Local de Moran; UNAM-CEDRUS: Ciudad de México, México, 2020; Available online: https://www.youtube.com/watch?v=mp2uPNF5lD4 (accessed on 21 June 2021).
- Anselin, L.; Syabri, I.; Kho, Y. Geoda: An Introduction to Spatial Data Analysis. In Handbook of Applied Spatial Analysis: Software Tools, Methods and Applications; Fischer, M.M., Getis, A., Eds.; Springer: Berlin/Heidelberg, Germany, 2010; pp. 73–89. ISBN 978-3-642-03647-7. [Google Scholar]
- Celemín, J.P. Autocorrelación espacial e indicadores locales de asociación espacial. Importancia, estructura y aplicación. Rev. Univ. Geogr. 2009, 18, 11–31. [Google Scholar]
- Minitab. Entendiendo las Pruebas de Hipótesis: Niveles de Significancia (Alfa) y Valores P en Estadística. 2021. Available online: https://blog.minitab.com/es/entendiendo-las-pruebas-de-hipotesis-niveles-de-significancia-alfa-y-valores-p-en-estadistica (accessed on 21 June 2021).
- Anselin, L. SpaceStat TUTORIAL A Workbook for Using SpaceStat in the Analysis of Spatial Data. 1992. Available online: https://web.worldbank.org/archive/website01407/WEB/IMAGES/ANSELIN_.PDF (accessed on 21 June 2021).
- Cliff, A.D.; Ord, K. Spatial Autocorrelation: A Review of Existing and New Measures with Applications. Econ. Geogr. 1970, 46, 269–292. [Google Scholar] [CrossRef]
- Talen, E.; Anselin, L. Assessing Spatial Equity: An Evaluation of Measures of Accessibility to Public Playgrounds. Environ. Plan. A Econ. Space 1998, 30, 595–613. [Google Scholar] [CrossRef] [Green Version]
- Johnson, R.; Kuby, P. Estadística Elemental: Lo Esencial, 10th ed.; Cengage Learning Editores: Ciudad de México, México, 2008; ISBN 13: 978-607-481-199-5. [Google Scholar]
- Rawls, J. A Theory of Justice; Harvard University Press: Cambridge, MA, USA, 2020; ISBN 0-674-04260-3. [Google Scholar]
- Sen, A. Equality of What. Tann. Lect. Hum. Values 1979, 1, 197–220. [Google Scholar]
- Chou, Y.-H. Spatial Pattern and Spatial Autocorrelation. In Proceedings of the Spatial Information Theory A Theoretical Basis for GIS; Frank, A.U., Kuhn, W., Eds.; Springer: Berlin/Heidelberg, Germany, 1995; pp. 365–376. [Google Scholar]
- UN, D. of E. and S.A. THE 17 GOALS|Sustainable Development. Available online: https://sdgs.un.org/goals (accessed on 16 January 2022).
- Secretaría de Gobernación. Plan Nacional de Desarrollo 2019–2024; Secretaría de Gobernación: Ciudad de México, Mexico, 2019; p. 225. [Google Scholar]
- Gobernación. Programas Sectoriales 2019–2024; Gobierno de México: Ciudad de México, México, 2019; Available online: http://www.ordenjuridico.gob.mx/sectoriales.php#gsc.tab=0 (accessed on 21 June 2021).
- CEIEG. Programa Estatal de Estadística y Geografía Del Estado de Veracruz de Ignacio de La Llave (PEEG) 2019–2024; CEIEG: Xalapa, Mexico, 2019. [Google Scholar]
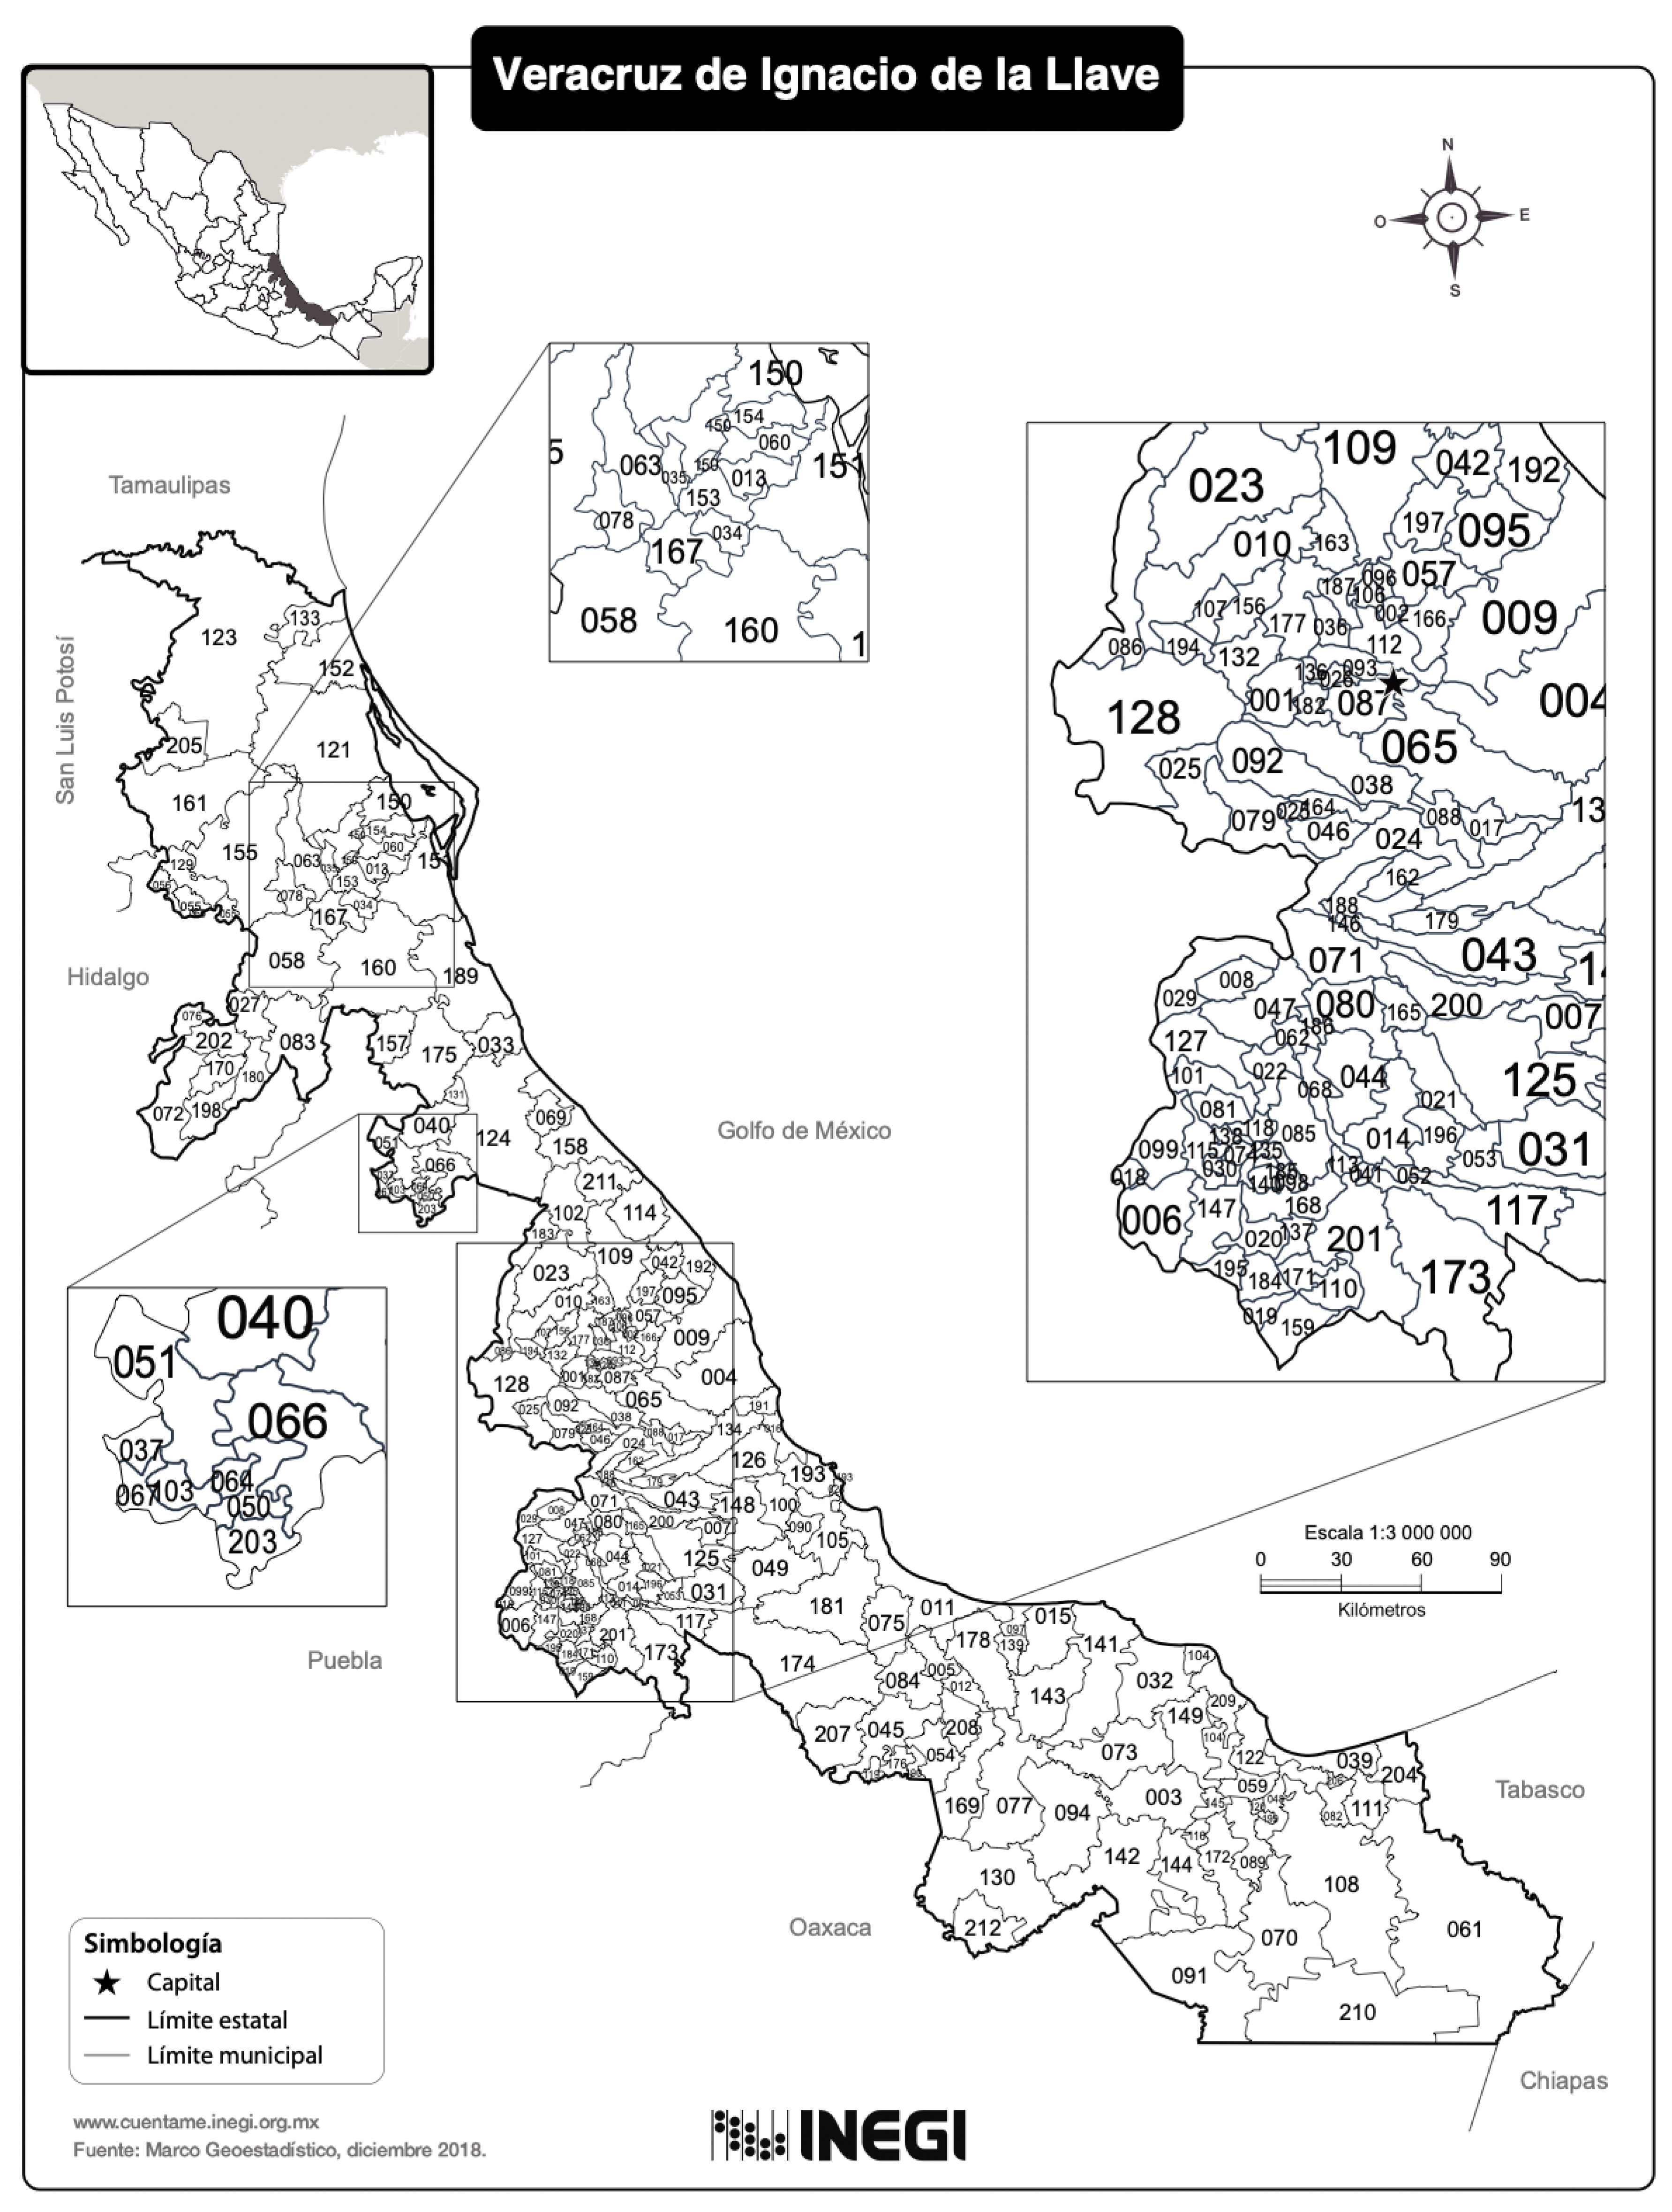
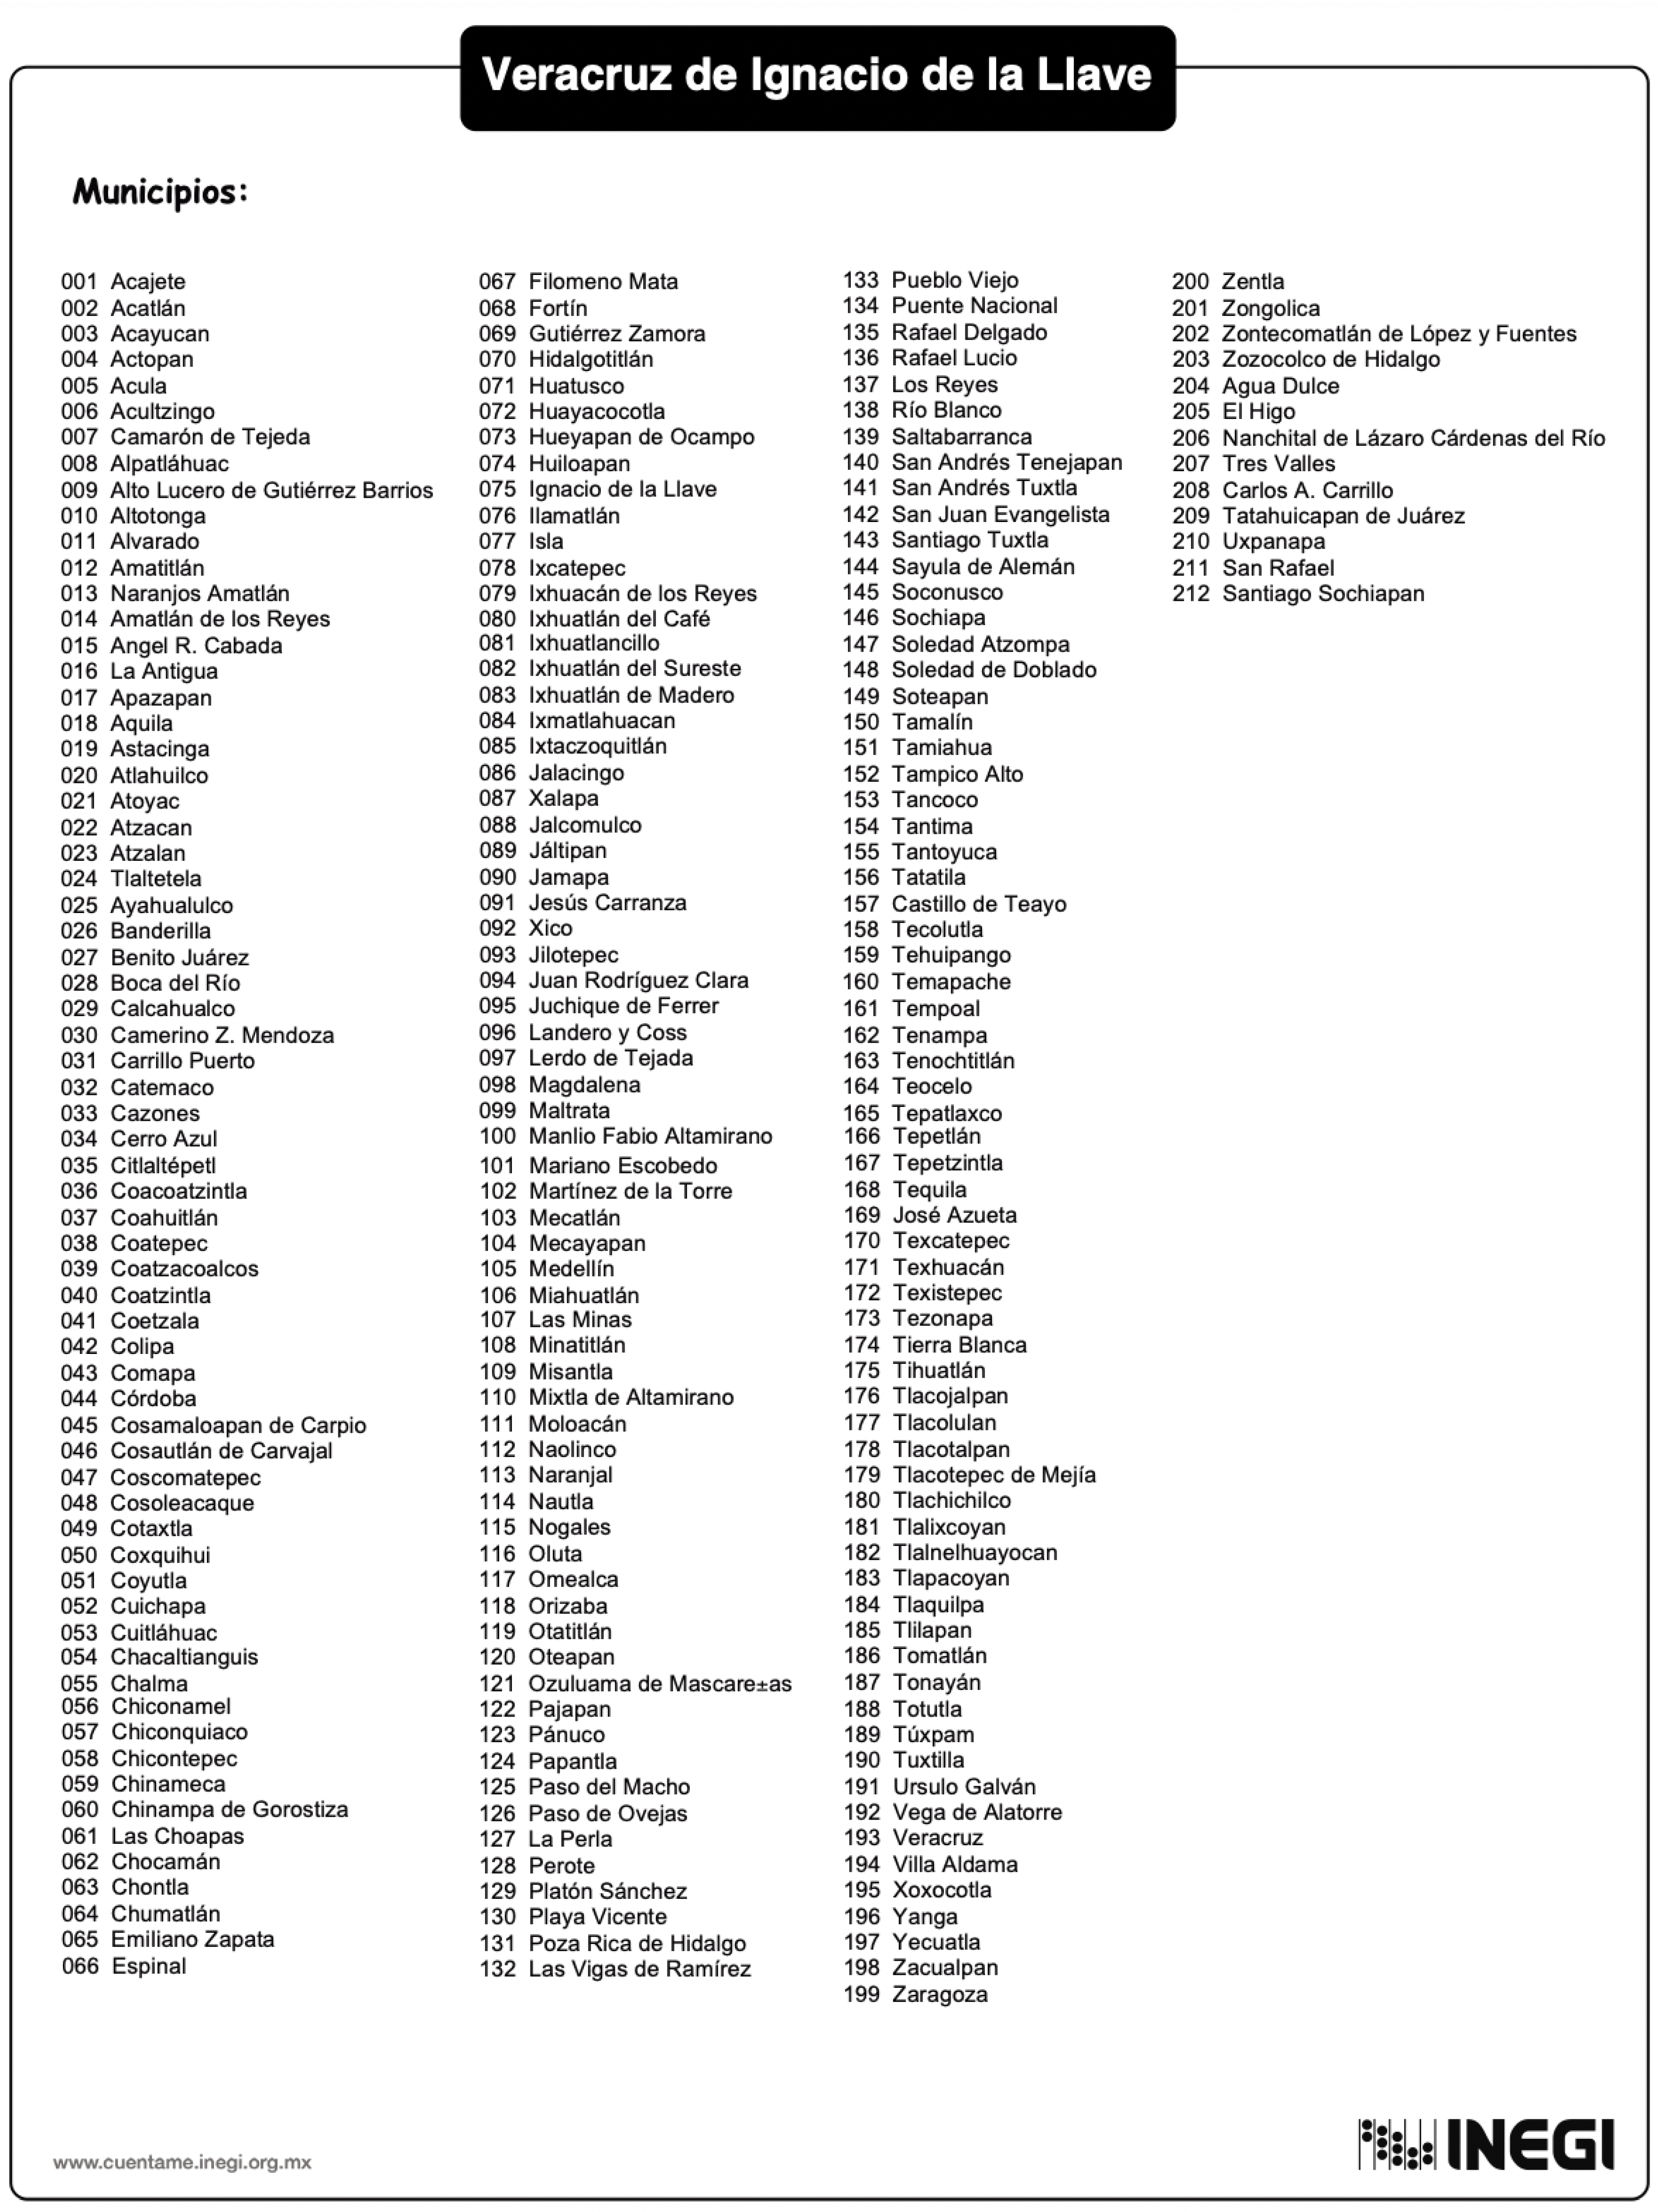
- INEGI Municipal Division Map of the State of Veracruz, Mexico; Cuéntame; 2018. Available online: http://cuentame.inegi.org.mx/mapas/pdf/entidades/div_municipal/veracruzmpios.pdf (accessed on 21 June 2021).


| Program | Period of Validity |
|---|---|
| Municipal Performance Advisory Guide | (2019,––) |
| Agenda for Municipal Development Program | (2014–2018) |
| Agenda Program From the Local | (2004–2013) |
| Theoretical Considerations | Determination of Analysis Unit |
|---|---|
| Type: | Formal or jurisdictional |
| Level: | Subnational |
| Variety: | Political and administrative unit; municipalities |
| Number of levels of analysis: | Single level (Municipal) |
| Criteria | INAFED Programs | Municipal Institutional Development Index (IDIM) | Municipal Functional Capacities Index (ICFM) |
|---|---|---|---|
| Observation maximization | No * | Yes | Yes |
| Complete contiguity of areas | No * | Yes | Yes |
| Maximization of comparability with studies | No * | Yes | Yes |
| Maximization of temporal stability | Yes | No ** | No *** |
| Scalability | No * | No ** | Yes |
| Agent Responsible: | National Institute for Federalism and Municipal Development (INAFED) | Superior Audit of the Federation (ASF) | United Nations Development Programme (UNDP) |
| Property | Value |
| Type | Queen |
| Symmetry | Symmetric |
| File | ICFM_2016Q1.gal |
| Id variable | CVEGEO |
| Order | 1 |
| # Observations | 212 |
| Min neighbors | 1 |
| Max neighbors | 12 |
| Mean neighbors | 5.15 |
| Median neighbors | 5.00 |
| % Non-zero | 2.43% |
| Spatial Patterns | ||
|---|---|---|
| Positive spatial autocorrelation | Negative spatial autocorrelation | No autocorrelation |
| Cluster pattern | Dispersed pattern | Random pattern |
| Theoretical Moran Index | ||
| I > 0 | I < 0 | I = 0 |
| Moran index in practice | ||
| I > 0.35 | I < −0.35 | −0.35 ≤ I ≤ 0.35 |
Publisher’s Note: MDPI stays neutral with regard to jurisdictional claims in published maps and institutional affiliations. |
© 2022 by the authors. Licensee MDPI, Basel, Switzerland. This article is an open access article distributed under the terms and conditions of the Creative Commons Attribution (CC BY) license (https://creativecommons.org/licenses/by/4.0/).
Share and Cite
Lagunes-Gómez, I.; Hernández-Orduña, M.G.; Murrieta-Galindo, R.; Hernández-Pitalua, D.; Mayorga-Cruz, D. Spatial Analysis of the Empirical Behavior of Municipal Institutional Capacity for the Formulation of Sustainable Growth Management Strategies with a Regional Focus: State of Veracruz, Mexico. Sustainability 2022, 14, 2000. https://doi.org/10.3390/su14042000
Lagunes-Gómez I, Hernández-Orduña MG, Murrieta-Galindo R, Hernández-Pitalua D, Mayorga-Cruz D. Spatial Analysis of the Empirical Behavior of Municipal Institutional Capacity for the Formulation of Sustainable Growth Management Strategies with a Regional Focus: State of Veracruz, Mexico. Sustainability. 2022; 14(4):2000. https://doi.org/10.3390/su14042000
Chicago/Turabian StyleLagunes-Gómez, Isabel, María Graciela Hernández-Orduña, Rene Murrieta-Galindo, Daniel Hernández-Pitalua, and Darwin Mayorga-Cruz. 2022. "Spatial Analysis of the Empirical Behavior of Municipal Institutional Capacity for the Formulation of Sustainable Growth Management Strategies with a Regional Focus: State of Veracruz, Mexico" Sustainability 14, no. 4: 2000. https://doi.org/10.3390/su14042000
APA StyleLagunes-Gómez, I., Hernández-Orduña, M. G., Murrieta-Galindo, R., Hernández-Pitalua, D., & Mayorga-Cruz, D. (2022). Spatial Analysis of the Empirical Behavior of Municipal Institutional Capacity for the Formulation of Sustainable Growth Management Strategies with a Regional Focus: State of Veracruz, Mexico. Sustainability, 14(4), 2000. https://doi.org/10.3390/su14042000