Article

Diversification of Eco-Innovation and Innovation Activity of Small and Medium-Sized Enterprises in the European Union Countries

by
Elżbieta Sobczak
* and
Dariusz Głuszczuk
Department of Regional Economy, Wroclaw University of Economics and Business, Nowowiejska 3, 58-500 Jelenia Góra, Poland
*
Author to whom correspondence should be addressed.
Sustainability 2022, 14(4), 1970; https://doi.org/10.3390/su14041970
Submission received: 30 December 2021 / Revised: 28 January 2022 / Accepted: 5 February 2022 / Published: 9 February 2022

Abstract

:
The development of eco-innovation activities performed by enterprises remains one of the key challenges of sustainable development. In modern economies, the implementation of innovative technological solutions should also take into account performing eco-innovation activities by enterprises. The aim of the research was to assess the involvement level of small and medium-sized enterprises in eco-innovation activities, regarding the implementation of actions for the effective management of resources and the implementation of sustainable products, against the background of their involvement in innovation activities related to the implementation of product innovations and business processes, as well as the assessment of spatial-temporal diversity and trends for changes in this regard. The spatial scope of the research addresses 27 European Union countries, and the time scope of the research covers the years 2013–2020. The methods of multivariate statistical analysis, with particular emphasis on classification methods, were used in the research. The main finding of the research is the division of the European Union countries into three types of classes, including the countries assessed as: (1) poor eco-innovators and moderate innovators; (2) moderate eco-innovators and poor innovators; and (3) leaders of eco-innovation and innovation. The conducted research shows that SMEs in the European Union countries are much less involved in eco-innovation activities than in innovation ones; the level of involvement in eco-innovation can be divergent from that of involvement in innovation. Moreover, the involvement in eco-innovation does not show an upward trend.

1. Introduction

The economic development of mankind reveals various correlations occurring between a human being and the surrounding nature. In the times of gathering and hunting, we were completely dependent on the natural environment. The goods of nature determined our existence and we had no influence on the processes taking place in the components of nature. We started changing the world around us along with moving on to the agrarian era. Cultivation of land and animal husbandry initiated the process of subordinating nature to human needs. This interference gained importance in the industrial era. The exploitation of mineral deposits, the development of steel industry and metallurgy, the age of steam and electricity, the emergence of industrial districts including high-tech, and the related urbanization placed man at the epicenter of nature. The dynamic socio-economic development intensified anthropopressure in its worst dimension—in the form of degradation and devastation of the natural environment. The information age—initiated, i.e., by the invention of the Internet—resulted in geometric technological progress, however, did not contribute to satisfactory slowdown in the natural environment destruction, even though due measures were taken up in this respect (sustainable development).
The development of civilization within the economic epochs of mankind, and also between them, was constantly connected with the search for and the implementation of new or significantly improved solutions, i.e., innovations. Many of them were focused on a human being and the narrowly approached quality of life—consumption without harmony with care for the condition of the natural environment. In consequence, significant problems emerged, such as air pollution, ozone hole, acid rain, the greenhouse effect, weather anomalies, urban smog, soil acidification and depletion, post-mining excavations, slag heaps, surface water pollution, degradation of flora and fauna habitats, or lowering of the groundwater table.
Innovations have certainly contributed to the improvement of the living standard, ensuring intensive economic growth but, at the same time, bringing about extensive degradation of the natural environment. New or significantly improved solutions have to offer a remedy to this problem, which requires taking a non-traditional approach to innovation. This postulate includes eco-innovations which articulate sensitivity to the natural environment.
In accordance with the concept of sustainable development, enterprises should permanently implement product and process eco-innovations in order to minimize damage to the natural environment [1,2]. It is equally important that similar activities are implemented by their business partners, which can, in turn, contribute to the construction of an eco-innovation network [3,4]. In this way, consumer behavior can also be changed by opening it to environmental awareness.
Eco-innovations—synonymously: ecological innovations, green innovations, sustainable innovations, environmental innovations [5,6,7]—are perceived as one of the innovation types which determines:
Generating benefits (added value) for the entrepreneur and the consumer along with reducing negative impacts on the environment [8,9,10];
Creating new business opportunities and environmental benefits [11,12,13];
Harmonization with the idea of sustainable development [14,15,16];
Reduction of negative impacts on the natural environment along with achieving the specific environmental performance [17,18,19,20,21,22,23];
Taking into account both social and environmental issues [24];
Creating benefits for the environment comparing to alternative solutions [25,26,27];
Contributing to ecological balance [28];
Reducing environmental risk throughout the life cycle in relation to alternative solutions [29,30];
The lowest harmful consequences to physical, biological and cultural systems [31];
Optimizing the satisfaction of human needs and ensuring a better quality of life, while taking into account the aspects of environmental protection [32];
The emergence of external social benefits resulting from the innovating R&D activities [33];
Improvement of ecological parameters of products and processes [34,35];
Striving to reduce burdens on the environment [36,37].
Among the characteristics distinguishing eco-innovations from innovations, the features related to the natural environment clearly dominate, however, additional components are also present, which combine green innovations with benefits for the entrepreneurs. In such a situation, sustainable innovation is motivated by both environmental and economic reasons [29,38,39]. This merge does not always take place because various types of regulations are frequently the primary inspiration and the driving force for eco-innovations [40,41,42,43]. It also happens that pro-ecological solutions are not clearly dedicated to the needs of environmental protection and are based on typical business objectives, such as cost reduction or product quality improvement. In this context, it is worth noting that an eco-innovation is not determined by the intention but by the environmental result [44,45,46,47]. Thus, the term eco-innovation can cover both the environmentally-motivated innovations and business innovations beneficial for the environment in which the pro-ecological effect remains a side effect [48]. In addition, eco-innovations are not located in the business sphere alone (e.g., product innovations), but also include innovations in social and institutional structures [49].
Sensitivity to natural environment represents the essential determinant of green innovations, even when attempting to reach the consensus between environmental, business, and consumer needs. The definitions of eco-innovation indicating the need to create benefits in the triad: natural environment–innovators–recipients of innovation do not seem to exclude the situation of mutual concessions made by entrepreneurs and consumers for the natural environment. Ultimately, any benefit to the natural environment works to the advantage of humans. It is obvious that comprehensive added value is the best eco-innovation implementation scenario (win–win). Within its framework, companies can increase their competitiveness while caring for the natural environment [50,51], ensuring harmony between their own economic goals and the concept of sustainable development [52,53,54].
Categorizing eco-innovation as an innovation combined with environmental awareness creates a different perspective on the life cycle of new or significantly improved solutions. Green innovation should be characterized, i.e., by durability and the possibility of regeneration [55], susceptibility to recycling [56,57], low material and energy consumption, as well as waste minimization [58]. Moreover, its impact on the environment can be assessed using such criteria as: the level of gas emission and air pollutants, the degree of water pollution, noise intensity, or the scale of soil degradation [59].
The criterion of benefits for the natural environment is of significant importance among the components of the eco-innovation definition. A benefit is a fairly general concept, certainly associated with added value, however, difficult to be explicitly estimated. In this calculation, as in [25]—alternative solutions can be adopted as a reference basis. It remains an open question whether to consider them from the perspective of an entity implementing green innovation and its impact on the natural environment (partial comparisons), or taking a holistic approach, i.e., against the background of all possible pro-environmental solutions (comprehensive comparisons). In this matter, it seems reasonable to combine partial and comprehensive comparisons. The first of them allows identifying added value within a given entity and its environment, whereas the second is necessary to determine the importance of the implemented solution.
The gradation of eco-innovation importance leads to the distinction of breakthrough solutions that significantly reduce the negative environmental effects as well as incremental solutions slightly reducing the harmful environmental impacts [60]. Each of them is desirable from the viewpoint of protection and restoration of the natural environment, although the greatest benefits are, beyond any doubt, brought about by the breakthrough eco-innovations (e.g., quitting the coal-based economy).
A diverse approach to eco-innovation indicates that understanding the nature of sustainable innovation requires taking a multidimensional approach [61,62]. The characteristics of green innovations emphasizing their sensitivity to the natural environment can be treated as the features distinguishing them from innovations, or in the category of supplementing the contemporary definitions of new or significantly improved solutions. Taking the first approach, it has been adopted that innovations can be positive, neutral, or negative in relation to the natural environment [63,64], while the second one assumes that they have to take into account environmental issues. This problem seems to be part of the debate addressing mutual relationships between innovations and eco-innovations [65,66,67,68,69]. Summing up the discourse in this area, green innovations do not replace the term of innovations, but, as previously mentioned, represent only one of the types of innovations. This approach covers:
Definitions of eco-innovation, in which green innovation is a category of innovation characterized by specific features;
Discussion highlighting the difference between eco-innovation and innovation;
Concepts identifying the categories of new or significantly improved solutions, the implementation of which either intentionally or unintentionally aims to protect the environment.
The perception of eco-innovation as a different category of innovation results in identifying not only the separate features of these concepts, but also the common ones. Both of these ideas can be analyzed in terms of a process and a result. Taking the first approach, their semantic dimension covers all activities related to the development and implementation of new or significantly improved solutions (the synonym of innovation activity), while the second comes down to the result of innovation activity, i.e., the implementation of specific innovations or eco-innovations. This differentiation seems to correspond with a holistic and resultant statistical approach to innovation and eco-innovation. The Summary Innovation Index (SII) groups the indicators, which characterize not only the results of innovation activity (innovators), but also the factors and the environment supporting these processes (e.g., human resources, research systems, innovation-friendly environment, finance and support). A similar approach can be noticed in the construction of the Eco-Innovation Index (EII). Its components also determine the results of innovation activities (e.g., enterprises that introduced an innovation with environmental benefits obtained within the enterprise, enterprises that introduced an innovation with environmental benefits obtained by the end user), as well as the factors responsible for this success (e.g., total R&D personnel and researchers, eco-innovation related patents, employment in eco-industries).
The examples of SII and EII component indicators describing the effects of innovation processes through the number of innovators and eco-innovators do not exhaust the list of measures characterizing the results of innovation activities under the Summary Innovation Index and the Eco-Innovation Index. Innovations in terms of their results are also illustrated by, “sales impacts”, for example, while eco-innovations by exports of products from eco-industries, turnover in eco-industries. It is worth noting, however, that the justifiable pressure on innovation—and primarily eco-innovation—should cover as many enterprises as possible, because the prevalence of new or significantly improved solutions seems to influence the economy competitiveness and the degree of its neutrality regarding the natural environment. In this perspective, the features/indicators describing the effects of innovation activity as the number of entities that implemented innovations and/or eco-innovations, i.e., innovators and eco-innovators, are of particular importance. At the same time, distinguishing between these concepts may raise doubts as to the ecological effect of some innovations—e.g., a new product packaging may be an innovation that remains in disharmony with eco-innovation.
In the presented study, an attempt was made to determine:
Are small and medium-sized enterprises operating in the EU countries characterized by a similar intensity of eco-innovation implementation compared to the intensity of innovation implementation?
Does the innovation and eco-innovation activity of SMEs in the analyzed area show spatial-temporal diversity and a growing trend for changes?
Unlike in the EU reports, in this study, the authors have adopted as the classification basis only the results of small and medium-sized enterprise operations in terms of the following processes:
Eco-innovation (2 out of 16 indicators making up the aggregate Eco-Innovation Index (Eco-I), i.e., the implementation of resource efficiency actions and the implementation of sustainable products were taken into account);
Innovation (2 out of 27 indicators making up the Summary Innovation Index (EII), i.e., SMEs with product innovations and SMEs with business process innovations were taken into account).
The originality of this study results from focusing on SMEs innovators and eco-innovators alone, i.e., the entities which have implemented new or significantly improved solutions.

2. Materials and Methods

The information used in the research was based on statistical information from the Eco-Innovation Observatory and the European Innovation Scoreboard databases.
The research covered eco-innovation activities—indicators developed by the Eco-Innovation Observatory, the initiative financed by the European Commission’s Directorate-General for the Environment, which defines the extent to which companies in a given country are active in eco-innovation:
REA—implementation of resource efficiency actions in SMEs as % of SMEs with no following actions, few actions, some actions, many actions (on the list of 8 resource efficiency actions). We have assigned the score from 0 to 3 to each of these groups and calculated the score per country as follows: Score per country = 0 * (% of SMEs with no action) + 1 * (% of SMEs with few actions) + 2 * (% of SMEs with some actions) + 3 * (% of SMEs with many actions);
SP—implementation of sustainable products in SMEs) as % of SMEs that have implemented actions to design products which are easier to maintain, repair, or reuse (end user focus).
Eco-innovation activities in the field of resource efficiency actions (included in the REA index) cover:
(1)
Saving water;
(2)
Saving energy;
(3)
Using predominantly renewable energy (e.g., including own production through solar panels, etc.);
(4)
Saving materials;
(5)
Minimizing waste;
(6)
Selling scrap material to another company;
(7)
Recycling, by reusing material or waste within the company;
(8)
Designing products that are easier to maintain, repair or reuse;
(9)
Other.
Both of these indicators measure the activity of small and medium-sized enterprises that introduced innovations with environmental benefits; in the case of the REA index, they refer to the benefits obtained within the enterprise, and, in the case of the SP index, the benefits achieved by the end user [70].
The indicators included in the revised measurement framework for the EIS 2021 under the sub-index innovation activities and dimension innovators were used to measure the innovation activity of enterprises in the examined European Union country:
PI—SMEs with product innovations (% share);
BPI—SMEs with business process innovations (% share).
Compared to the EIS 2020 the definition of both indicators has changed: the first indicator is now focused on product innovations, and the second on business process innovations, combining process, marketing, and organizational innovations [71].
The spatial scope of empirical research was determined by the availability of statistical data. The research addresses all European Union countries as of 2020. The time scope of the research covers the years 2013–2020.
As the above discussion shows, the study is focused on small and medium-sized enterprises—eco-innovators and innovators—operating in the European Union countries.
The applied research methods were selected for the research purposes, i.e., the assessment of the involvement level of small and medium-sized enterprises operating in the European Union countries in eco-innovation activities, against the background of their involvement in innovation activities, as well as the assessment of spatial-temporal diversity and trends for change in this respect.
The research used the broadly approached methods of multivariate statistical analysis, including econometric models of the development trend, data classification methods, with particular emphasis on Ward’s hierarchical classification method, and the k-means clustering method. Statistica ver. 13.1 package was used to calculate and visualize the research findings.
The research was carried out according to the described below research procedure consisting of seven stages.
Stage 1. Construction of the development trend models for:
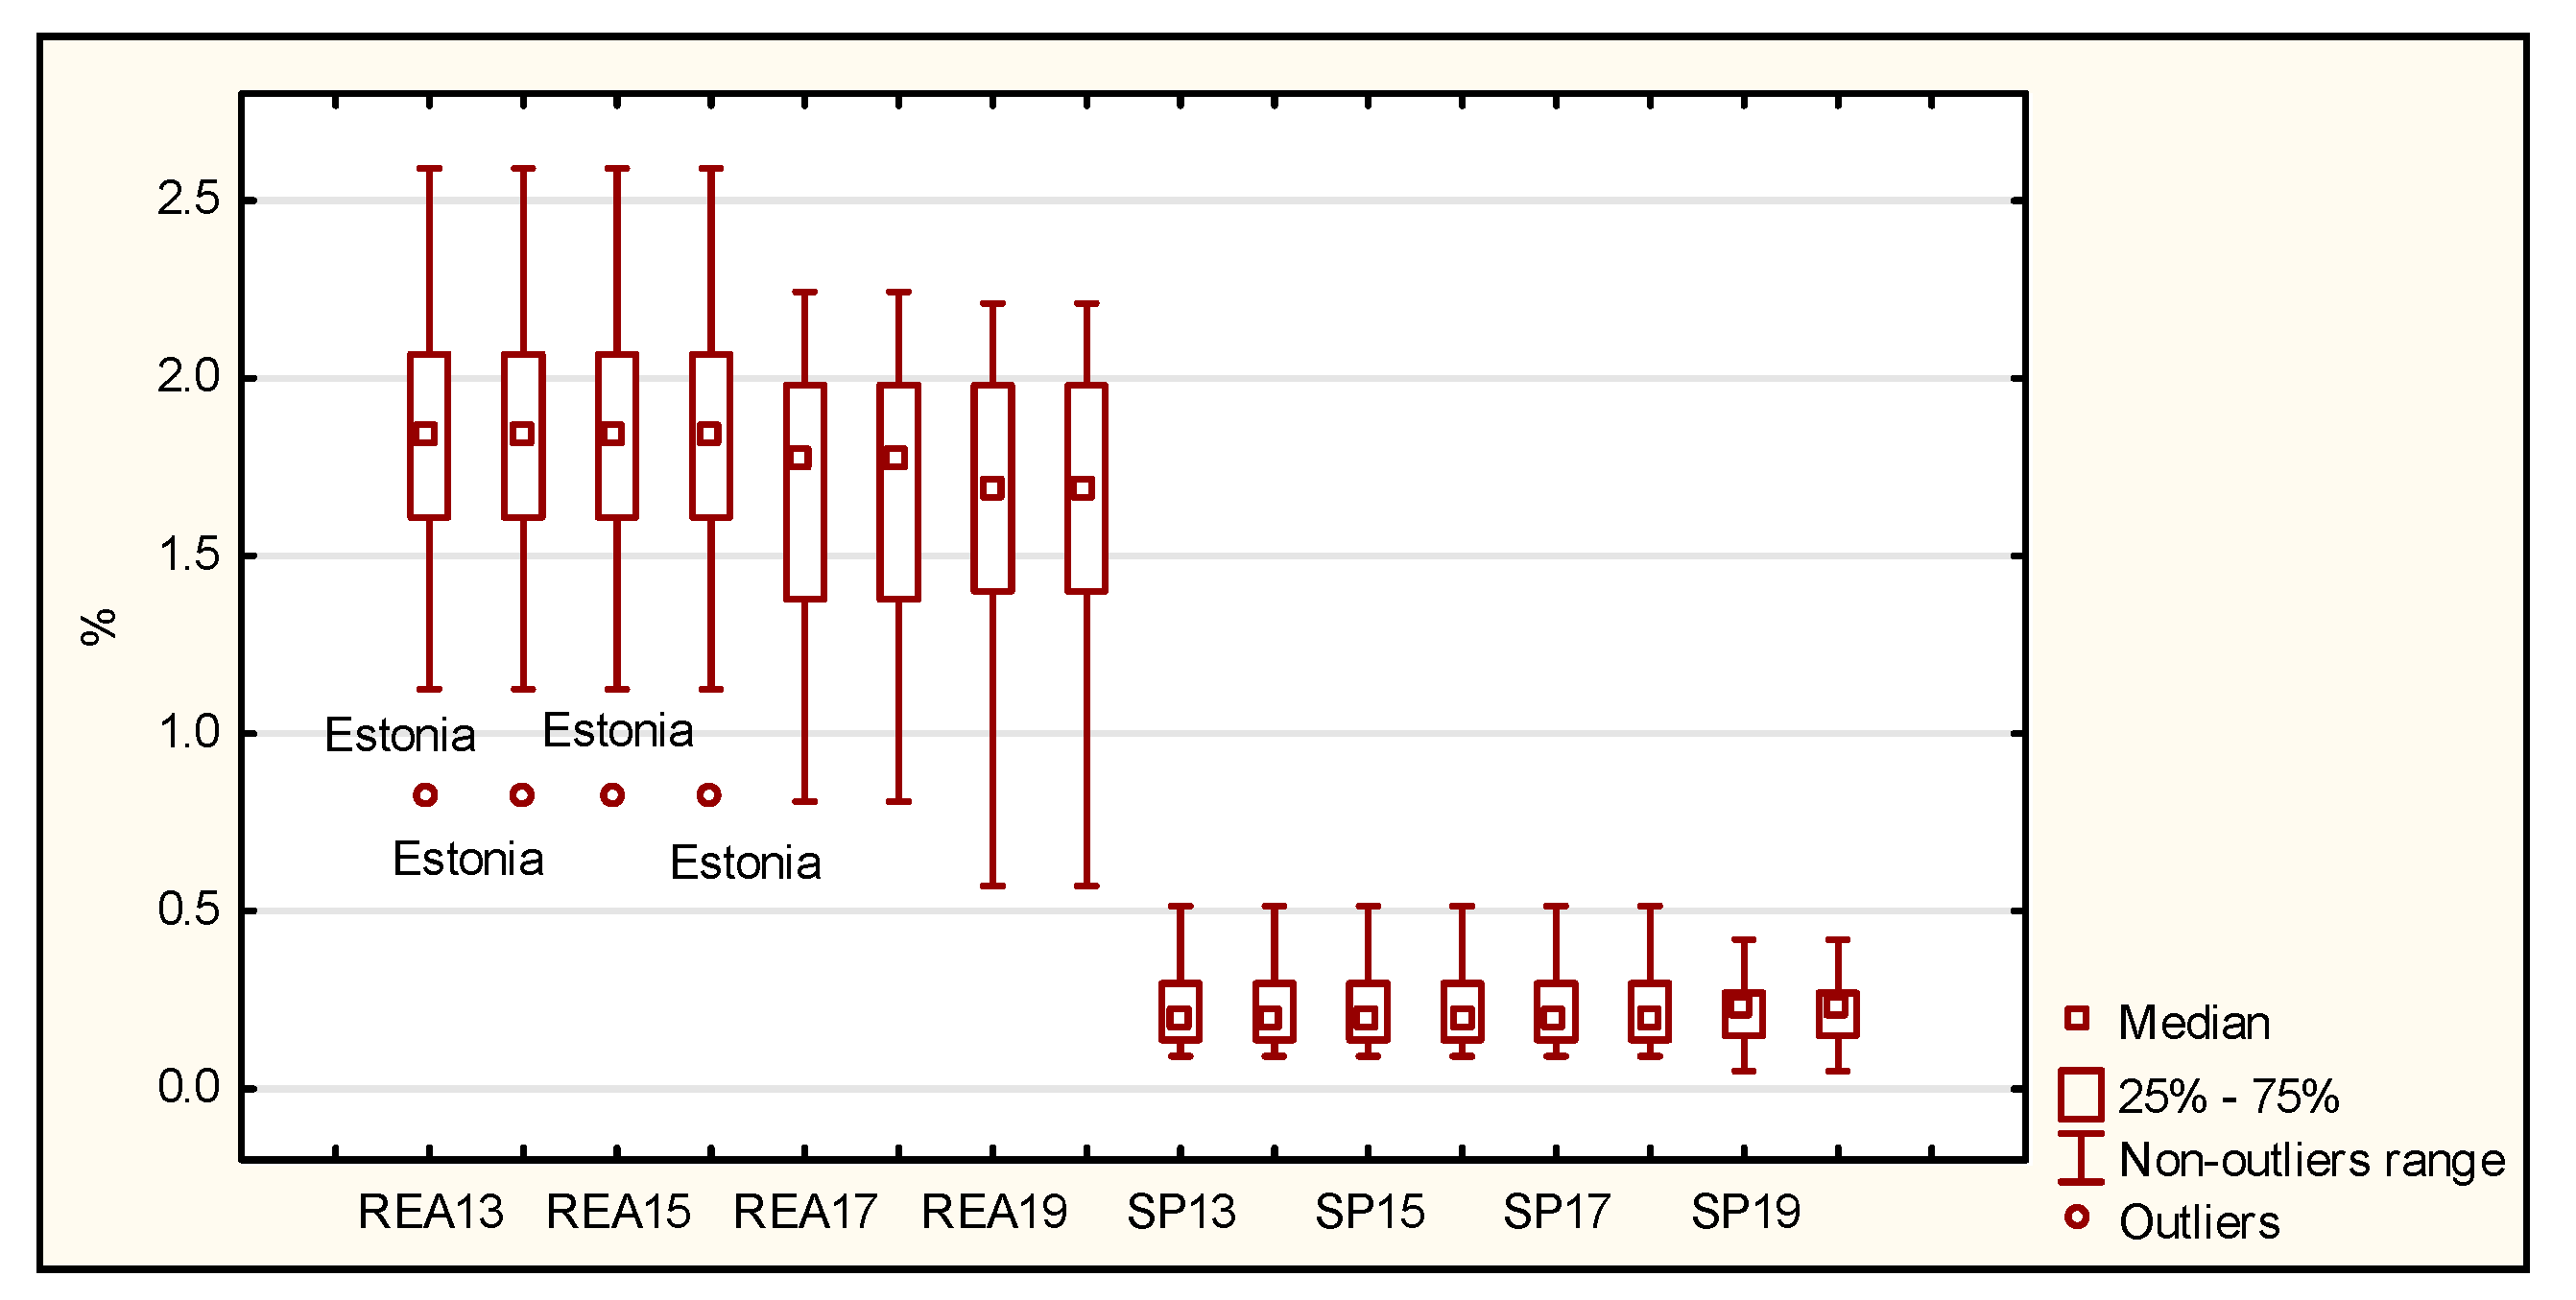
Eco-innovation activity index—implementation of resource efficiency actions in SMEs as % of SMEs (REA);
Eco-innovation activity index—implementation of sustainable products in SMEs as % of SMEs (SP);
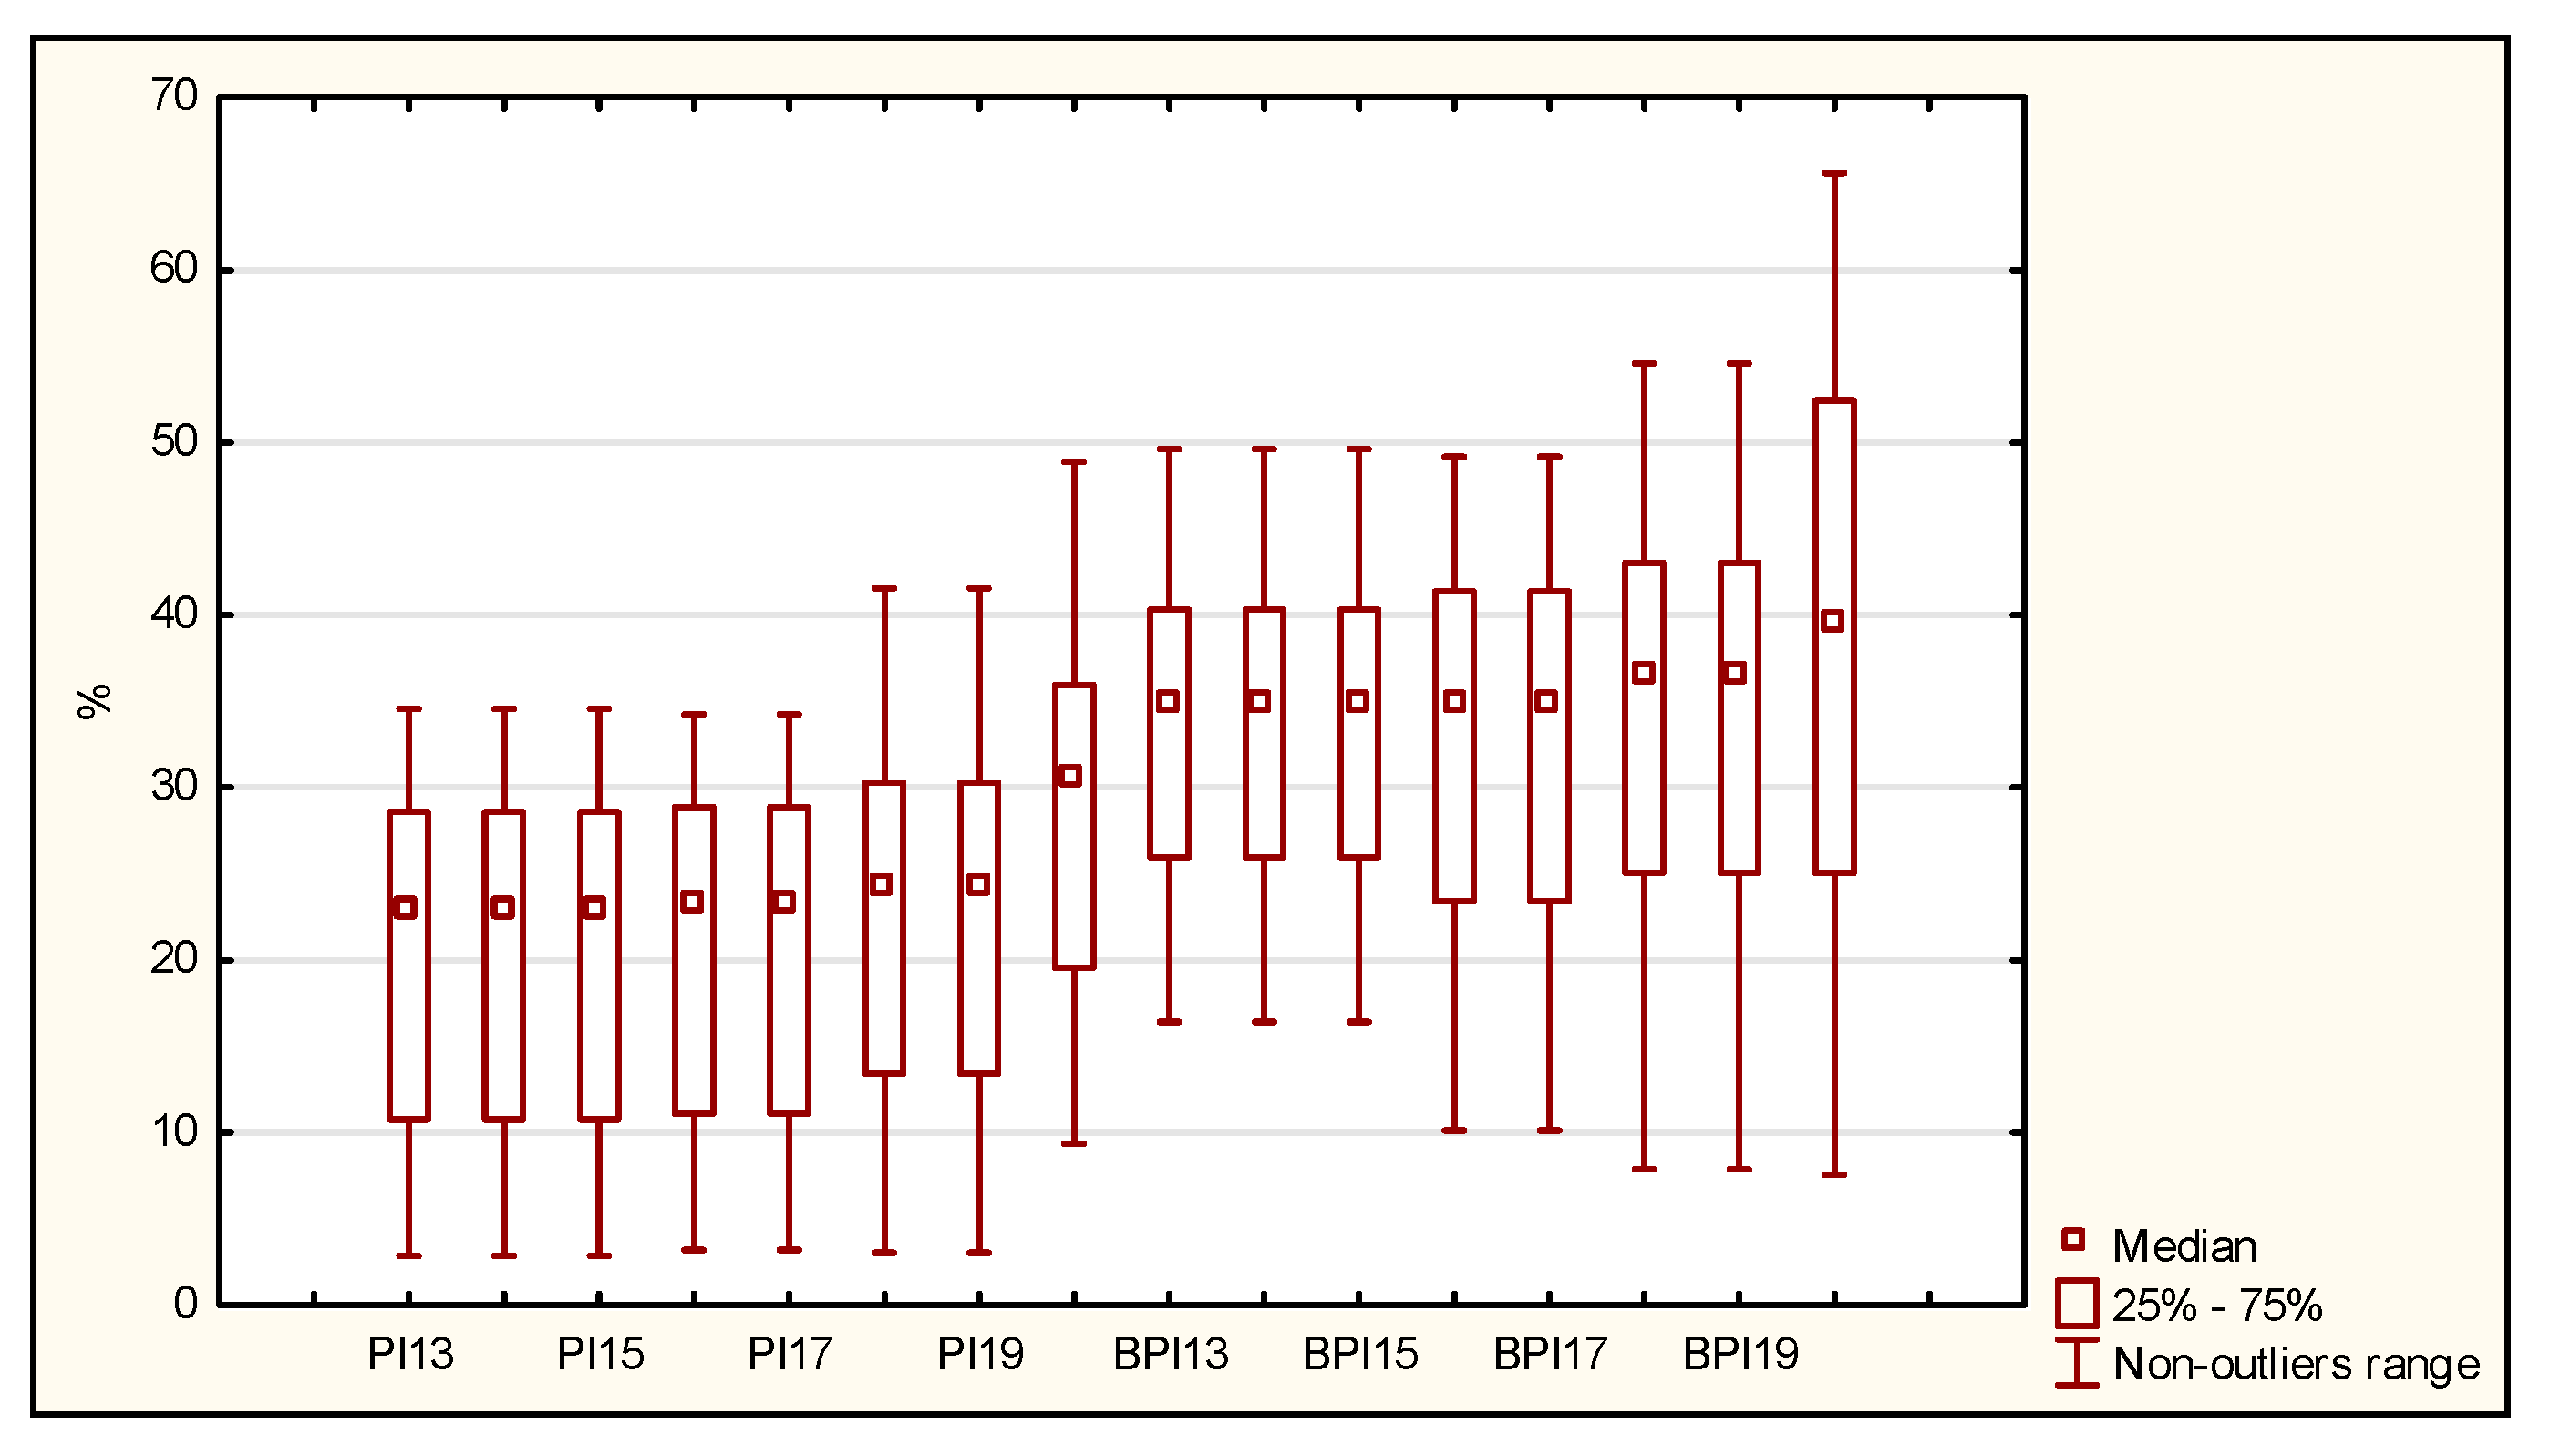
Innovation activity index—SMEs with product innovations as % of SMEs (PI);
Innovation activity index—SMEs with business process innovations as % of SMEs (BPI) in the European Union countries (EU 27) in 2013–2020.
The problem of developing econometric models, including trend models, was addressed in the studies [72,73].
The analytical form of the trend function was selected using the heuristic method of successive approximations.
Stage 2. Comparative analysis and diversity assessment of the European Union countries in 2013–2019, using basic descriptive parameters and their visualization using box charts regarding the distribution of values of the eco-innovation activity indexes: REA and SP and the innovation activity indexes PI and BPI.
Stage 3. Construction of the block matrix X for the eco-innovation and innovation activity index values taking the form:
X = [ X R E A X S P X P I X B P I ] ( N x 4 T ) = [ x i t R E A x i t S P x i t P I x i t B P I ] ( N x 4 T )
where:
  • X R E A ,   X S P ,   X P I ,   X B P I —matrix of values for the eco-innovation activity indexes REA and SP and the innovation activity indexes PI and SPI, respectively.
  • x i t R E A ,   x i t S P ,   x i t P I ,   x i t B P I —value of the eco-innovation activity indexes REA and SP and the innovation activity indexes PI and SPI in i-th object and t-th analyzed period, respectively.
  • i = 1,…, N—number of the analyzed object (country),
  • t = 1,…, T—number of the analyzed period.
Stage 4. Construction of the block matrix Z for the normalized index values of eco-innovation REA and SP and innovation PI and SPI activities, which is preceded by defining the reference value of the analyzed indicators and applying the selected standardization formula.
The description of the normalization of variables and the applied properties is presented in the following studies [74].
All the analyzed indicators represent stimulants, which means that their higher values are desirable as they inform about higher involvement of a given object (country) in the eco-innovation or innovation activities, respectively.
The values of examined indicators were normalized to zero [cf. Formula (2)] to standardize their order of magnitude:
z i t S = x i t S min i x i t S R t S
where:
  • S { R E A ,   S P ,   P I ,   B P I } ,
  • z i t S —normalized value of S indicator for i-th object in t-th analyzed period,
  • x i t S   —value of S indicator for i-th object in t-th analyzed period,
  • R t S   —range of S indicator values in t-th analyzed period.
Block matrix Z for the normalized values of eco-innovation activity REA and SP and innovation activity PI and SPI indexes takes the following form:
Z = [ Z R E A Z S P Z P I Z B P I ] ( N x 4 T ) = [ z i t R E A z i t S P z i t P I z i t B P I ] ( N x 4 T )
where:
  • Z R E A ,   Z S P ,   Z P I ,   Z B P I   —matrix for the normalized values of the eco-innovation activity indexes REA and SP and the innovation activity indexes PI and SPI, respectively.
  • z i t R E A ,   z i t S P ,   z i t P I ,   z i t B P I —normalized values of the eco-innovation activity indexes REA and SP and innovation activity indexes PI and SPI in i-th object and t-th analyzed period.
Stage 5. Selection of the optimal number of country classes based on the dendrogram of connections, integration distances, and classification stages obtained following the application of the hierarchical classification method. The classification using Ward’s method was preceded by determining the squared Euclidean distance between the studied EU countries according to the analyzed indicators of eco-innovation and innovation activities. More information on the classification methods can be found in the studies [75,76].
Stage 6. Division of the EU countries into the relatively homogeneous classes using k-means clustering (the number of classes was determined in the previous stage of the analysis).
Stage 7. Determining the typology and characteristics for the obtained classes of the EU countries in terms of eco-innovation and innovation activity indexes for small and medium-sized enterprises.

3. Results

Figure 1 presents the course of variation, the analytical form, and the fit level to the dispersion of empirical points of the trend models, which constitute the basis for assessing the current trends of changes regarding the involvement of small and medium-sized enterprises in eco-innovation and innovation activities carried out in the European Union (EU27).
For all the analyzed indicators of eco-innovation and innovation activity, the second-degree polynomial turned out to be the best fit analytical form of the trend function in 2013–2020. The degree of models’ fit to empirical data was verified using the coefficient of determination R2 and the significance of structural parameters. For the significance level α = 0.05 structural parameters of the constructed models for the indicators: implementation of sustainable products in SMEs (SP), SMEs with product innovations (PI), and SMEs with business process innovations (BPI) turned out to be significant (p < 0.05). Only in the case of the trend model for the implementation of resource efficiency actions index in SMEs (REA), all parameters of the model turned out to be insignificant, which means that in the period under study no trend to change emerged in this case. As shown in Figure 1, on average, there are very large differences between the share of small and medium-sized enterprises in the EU related to the implementation of product and process innovations and the implementation of resource efficiency actions and also the implementation of sustainable products, to the detriment of the latter. In addition, a clear growing tendency can be noticed only in the case of PI and BPI innovation activity indexes.
Table 1 and Table 2 and Figure 2 present descriptive parameter values of the eco-innovation activity indexes, REA and SP, respectively, determined separately for each analyzed period in 2013–2020.
As can be seen based on Figure 2, in 2013–2020 there are clear disproportions in the European Union countries between the share of SMEs in the implementation of resource efficiency actions (REA) and the implementation of sustainable products (SP). The REA eco-innovation activity index is characterized by the significantly higher values of the median and the arithmetic mean than the SP index. Estonia recorded the lowest REA and SP values of eco-innovation indexes in the entire analyzed period. In 2013–2016, it was an outlier regarding the share of enterprises implementing sustainable products, which was only 0.81%. The largest portion of enterprises who implemented resource efficiency actions was in 2013–2016 in Spain, and in 2017–2020 in Portugal. Portuguese SMEs also had the largest share in the implementation of sustainable products.
In the analyzed period, the decrease in average values of both eco-innovation indexes was observed. The differences in the EU countries regarding REA values measured by the coefficient of variation were not very large, however, showed an increasing tendency from 22.20% in 2013 to 25.15% in 2020. In the case of REA index, the values of the median, the first quartile, and the third quartile declined over the years. In 2013, in half of the EU Member States, the share of SMEs implementing resource efficiency actions did not exceed 1.84%, whereas in 2020 it was lower than or equal to 1.6%. Throughout the analyzed period, the values of the indicator showed negative skewness, along with its fluctuating intensity. It means that the majority of countries were characterized with a higher-than-average share of SMEs in the implementation of resource efficiency actions. The implementation of sustainable products in SMEs presented a very high variation, ranging from 46.24% in 2013 to 44.86% in 2020, as well as strong skewness of a fluctuating nature. In 2013–2018, a strong positive skewness was observed, which informs that in most of the analyzed countries the value of SP index was lower than the average value. Negative skewness was recorded in 2017–2020.
Table 3 and Table 4 and Figure 3 present descriptive parameter values of the innovation activity indicators for small and medium-sized enterprises, PI and BPI, respectively.
As shown in Figure 3, the EU countries are characterized by higher median values regarding the participation of enterprises with business process innovations than with product innovations. Moreover, the median values for both indicators show a clear upward trend. In 2013, in 50% of the analyzed countries the share of SMEs with product innovations (PI) was lower than or equal to 22.81%, while in 2021 it did not exceed 30.40%. The median of SMEs with business process innovations (BPI) in 2013 was 34.73%, while in 2020 it reached 39.44%. The minimum values of PI index, oscillating around 3% in the entire analyzed period were observed in Romania, and the maximum values were recorded in Germany—34.55% in 2013–2016, in the subsequent years, until 2017 in Ireland (34.24%), next until 2019 in Finland (41.58%), and in 2020 in Estonia (48.88%).
The EU countries are characterized by high, however, declining variation over time in terms of the % of SMEs with product innovations. The coefficient of variation throughout the analyzed period, except for 2020, exceeded 42%. In 2013–2020, the participation coefficient of SMEs with product innovations was characterized by negative skewness of a decreasing intensity, so the countries with PI values higher than the arithmetic mean were the predominating ones. The minimum value of BPI index in 2013–2015 was characteristic for Poland, and in 2016–2020 for Romania. The highest share of SMEs with business process innovations occurred in Luxembourg (33.24%) in 2013–2015, in Belgium (39.06%) in 2016–2017, in Portugal (54.59%) in 2018–2019, and in Cyprus (65.62%) in 2020. The dispersion of countries in terms of the BPI innovation index was clear and increased over time. The CV coefficient of variation was 26.94% in 2013 and went up, reaching 37.05% in 2020. Negative skewness was observed throughout the analyzed period; the majority of the EU countries showed higher than average values of BPI index.
Figure 4a,b presents the dendrogram of connections, integration distances, and classification stages obtained as a result of applying Ward’s hierarchical classification method, using squared Euclidean distance.
Based on the analysis of Figure 4, the EU countries were classified, according to the values of REA and SP eco-innovation activity indexes and the PI and BPI innovation activity indexes in 2013–2020, into three relatively homogeneous classes using k-means clustering. The classification results are shown in Table 5 and Figure 5.
The most numerous 13 element class 3 of the EU countries includes the leaders of eco-innovation and innovation in 2013–2019 and leaders of eco-innovation and average innovators in 2020. This group covers 11 countries from the EU15 and two countries from the so-called new enlargement: Czechia and Malta. The third class of EU countries had the highest share of SMEs in the implementation of resource efficiency actions (REA) and the implementation of sustainable products (SP) in 2013–2020, as well as the highest share, except for 2020, of SMEs with product innovations (PI) and SMEs with business process innovations (BPI). In class 3, Portugal is most distant from the middle of the cluster (0.31), whereas Austria (0.10) is the least distant. The remaining classes are of the same size and group seven EU countries each. The first class includes catching-up eco-innovators and average innovators in 2013–2019 and also catching-up eco-innovators and leaders of innovation in 2020. Greece and Italy, as the EU15 countries, belong to this class, the remaining five are the countries of the new EU enlargement. The countries from this group are characterized by definitely the lowest, though increasing, share of SMEs in the implementation of resource efficiency actions and the lowest, but similar to the countries in class 3, share of SMEs in the implementation of sustainable products (SP). The countries included in class 1 are characterized by an average (except for 2020), however, increasing over time share of SMEs with product innovations and SMEs with business process innovations. A significant improvement in eco-innovation indicators in 2020 and overcoming class 3 in this respect is also characteristic for the first class. The first class shows the longest average distance from the middle of the class. Estonia (0.26) is the country in class 1 most distant from the middle of the cluster, while Cyprus is the closest to the center of gravity (0.11). The second class consists of the countries which can be referred to as REA average—SP catching-up eco-innovators and catching-up innovators. Apart from Spain, it includes the countries of Central and Eastern Europe. The countries in this group are characterized by average values of REA eco-innovation index and low values of SP index and also by a very large distance from the countries in the first and the third class regarding the values of both analyzed PI and BPI innovation activity indexes. Spain (0.23) is the country most distant from the middle of the cluster in class 2, while Hungary (0.06) is the closest to the center of the cluster.
Table 6 presents mean values of the examined eco-innovation (REA, SP) and innovation (PI, BPI) activity indexes for small and medium-sized enterprises in the identified types of classes in 2013–2020.
The analysis of average values of eco-innovation and innovation activity indexes in the cross-section of the identified classes allows for their more detailed description. In class 3, the share of small and medium-sized enterprises in the implementation of resource efficiency actions was the highest in the specified classes of countries and amounted to 2.02% in 2013, to decrease slightly and reach 1.91% in 2020. The lowest average value of REA index was recorded for class 1 (from 1.41% in 2013 to 1.34% in 2020). Class 3 is also characterized by the highest share of SMEs in the implementation of sustainable products (SP), ranging from 0.29% to 0.28%. In class 1 this share in the entire analyzed period was 0.15%, remaining slightly lower than in class 2 (0.16% in 2013–2020). The average share of SMEs with product innovations and SMEs with business process innovations in class 3 presented the level from 27.25% in 2013 to 31.29% in 2020 and from 38.65% in 2013 to 43.90% in 2020, respectively. In the specific class 1, in 2020 the PI and BPI indexes reached the highest level in all identified classes, taking the values of 39.76% SMEs and 50.05% SMEs, respectively.
The research findings, which are worth emphasizing, differ from the classification of the European Union countries based on the aggregate Eco-Innovation Index and the Summary Innovation Index. This results from the fact that in our research—in accordance with the adopted research objective—only the selected indicators contributing to the aggregate measures Eco-I and SII were considered. These discrepancies can be observed, e.g., in the case of Malta, which in our classification is included in class 3—leaders of eco-innovation and innovation in 2013–2019 and leaders of eco-innovation and average innovators in 2020, and from the perspective of the Eco-Innovation Index, it is classified among the Eco-I catching-up countries.

4. Discussion

This article attempts to provide answers to the key research questions formulated in the introduction:
Are small and medium-sized enterprises operating in the EU countries characterized by a similar intensity of eco-innovation implementation compared to the intensity of innovation implementation?
Does the innovation and eco-innovation activity of SMEs in the analyzed area show spatial-temporal diversity and a growing trend for changes?
When searching for answers to the aforementioned questions, the research focused on the involvement of small and medium-sized enterprises in eco-innovation activities, consisting of the implementation of solutions resulting in increased efficiency of resource management and introducing sustainable products to the economy. This approach allows for consideration of the eco-innovation activities of small and medium-sized enterprises not only from the perspective of their importance for the ecosystem, but also through the prism of the place of creating environmental benefits. In the case of activities aimed at the efficient management of natural resources, it is the enterprise where benefits for the ecosystem are generated. It is not possible to overestimate the importance of efficient resource management throughout their entire life cycle, i.e., from the moment of obtaining them through to waste disposal. The eco-innovation activity of SMEs results in using the resources in a sustainable manner, i.e., not only taking into account the aspects of environmental protection, but also reducing the negative impact of human activity on the environment.
The implementation of sustainable products brings about benefits for the end user, consumer, or other sectors of the economy. A sustainable product, along with maintaining its functionality, should meet environmental requirements, remain easy to maintain, and be repairable and reusable as well as recyclable. In other words, it is a product which, after leaving the place of production, is neutral from the climatic and environmental point of view or contributes to the protection and restoration of the natural environment.
Small and medium-sized enterprises (employing from 5 to 249 employees) play a significant role in the development of any market economy, stimulating economic development and influencing a competitive position of the economy on the international market. Therefore, special importance is attributed to eco-innovation activities performed by SMEs, which can play a breakthrough role in modernizing the economy of the European Union countries in harmony with the idea of sustainable development. In the context of the European Union involvement in the implementation of sustainable development strategy, it is particularly important to promote and strengthen the innovation-oriented activities in harmony with the natural environment of humans, which means taking care not only of the environmental neutrality but also the reconstruction of the degraded elements within ecosystems. This leads to the need for recognizing the primacy of ecological innovations over technological innovations, which do not take into account the aspects of sustainable development.
In the years 2013–2020, the involvement of the EU countries in eco-innovation and innovation activities was highly diverse. In 2013, on average, 1.81% of the European SMEs implemented the resource efficiency measures, such as saving water, energy, using mainly renewable energy, or recycling. In 2020, this share declined to the level of 1.64%. In the entire analyzed period, Estonia recorded the lowest share of SMEs in the implementation of resource efficiency actions (from 0.81% in 2013 to 0.57% in 2020). The most favorable situation in this respect occurred in Spain (2.29%) and Portugal (2.24% in 2017–2018 and 2.21% in 2019–2020).
In the case of eco-innovation activities consisting in the implementation of sustainable products, the average involvement of SMEs in the EU countries was slightly higher, amounting to 0.22% in 2013 and slightly lower in 2020 (0.21%).
The average share of SMEs with product innovations in 2013 reached 20.53% and systematically increased up to the value of 29.20% in 2020. Romania was characterized by an extremely low involvement in product innovations throughout the analyzed period (2.84% in 2013 and 3.03% in 2020). The highest share of SMEs with product innovations was observed in Germany, Ireland, Finland and Estonia (from 34.55% in 2013 to 48.88% in 2020).
A larger average involvement of SMEs in innovation activities occurred in the case of business process innovations. In 2013, on average, 33.54% of SMEs implemented this type of activity in the EU countries, and their average involvement increased to 39.01% in 2020. In 2013–2015, Poland had the lowest share of SMEs with business process innovations (16.4%) and, in 2016–2020, Romania (from 10.11% in 2013 to 7.7% in 2020).
The EU countries were characterized by the most extensive differences, measured by the coefficient of variation, in terms of the implementation of sustainable products in SMEs (from 46.24% in 2013 to 44.86% in 2020). The EU countries were slightly less diversified in terms of SMEs % with product innovations (42.24% in 2013 and 36.44% in 2020).
Even smaller dispersion took place in the case of SMEs with business process innovations. It presented the level of 26.94% in 2013 and continued to grow, reaching the value of 37.05% in 2020.
In 2013–2020, the EU countries were the least diversified in terms of the implementation of resource efficiency actions. In 2013, the coefficient of variation was 22.20% and increased to 25.15% in 2020.
In 2013–2020, the EU27 showed a clear upward trend in the values of innovation activity indexes (PI, BPI). The REA eco-innovation activity index did not present any tendency to change (the structural parameters of the trend function turned out to be insignificant), while the values of the SP eco-innovation activity index showed a downward trend.
When searching for an answer to the research question regarding the similarity in the involvement level of the EU countries in eco-innovation and innovation activities, they were divided into relatively homogeneous classes. The values of eco-innovation activity indicators (REA, SP) and of innovation activity indicators (PI, BPI) in the entire period covered by the study, i.e., the years 2013–2020, were adopted as the classification criteria. The empirical findings indicate the absence of an explicit answer to this question. Three classes of countries were distinguished and only the third class, grouping the leaders of eco-innovation and innovation in 2013–2019 and the leaders of eco-innovation and average innovators in 2020, showed similarities regarding the involvement in eco-innovation and innovation activities, because this class included countries with the highest eco-innovation and innovation activity in 2013–2019, however, the level of involvement was different. The average share of SMEs in class 3 of the countries regarding eco-innovation activities related to the implementation of resource efficiency actions (REA) and the implementation of sustainable products (SP) did not exceed the values of 2.02% and 0.29%, respectively, and was decreasing over the analyzed period. In turn, the average share of SMEs in innovation activities in 2020 was 31.29% in the case of implementing product innovations (PI) and 43.90% in business process innovations (BPI), respectively. Moreover, this share showed an increasing tendency throughout the entire period under study.
In the other two classes of countries, no similar involvement of SMEs in eco-innovation and innovation activities was observed. The first class group covers catching-up eco-innovators and average innovators in 2013–2019 and catching-up eco-innovators and leaders of innovation in 2020, while the second class covers REA average—SP catching-up eco-innovators and catching-up innovators. In both classes, there are also analogical disproportions regarding the values of eco-innovation (REA, SP) and innovation (PI, BPI) activity indexes.
Following the conducted analyses based on reliable sources of secondary data collected at the level of European institutions, it should be concluded that the activity of SMEs in the implementation of resource efficiency actions and implementation of sustainable products does not show a growing tendency, and the involvement level of SMEs operating in the European Union countries in eco-innovation activities is lower than in innovation activities not emphasizing environmental values. It is, therefore, necessary for the European Union to continue efforts aimed at initiating innovation activities, programs, and strategies to support the development of eco-innovation in the economies of the EU Member States, as well as to continue work involving the development of further regulations stimulating, or even forcing, higher involvement of enterprises in performing eco-innovation activities. It also sets the perspective for future inquiries and research. It seems justified to continue research studies focused on: the identification of factors enhancing and strengthening eco-innovation activity, recognizing barriers to eco-innovation actions among the enterprises implementing green innovations and not implementing such solutions, classifying and searching for eco-innovation leaders, along with determining their success factors. The indicated research directions may encounter limitations, because the sphere of public statistics does not always offer an adequate set of data. For example, the gap in this regard is related to information about the types of barriers to sustainable innovation perceived by enterprises refraining from their implementation.

5. Conclusions

The following conclusions can be formulated based on the conducted empirical research and source literature studies:
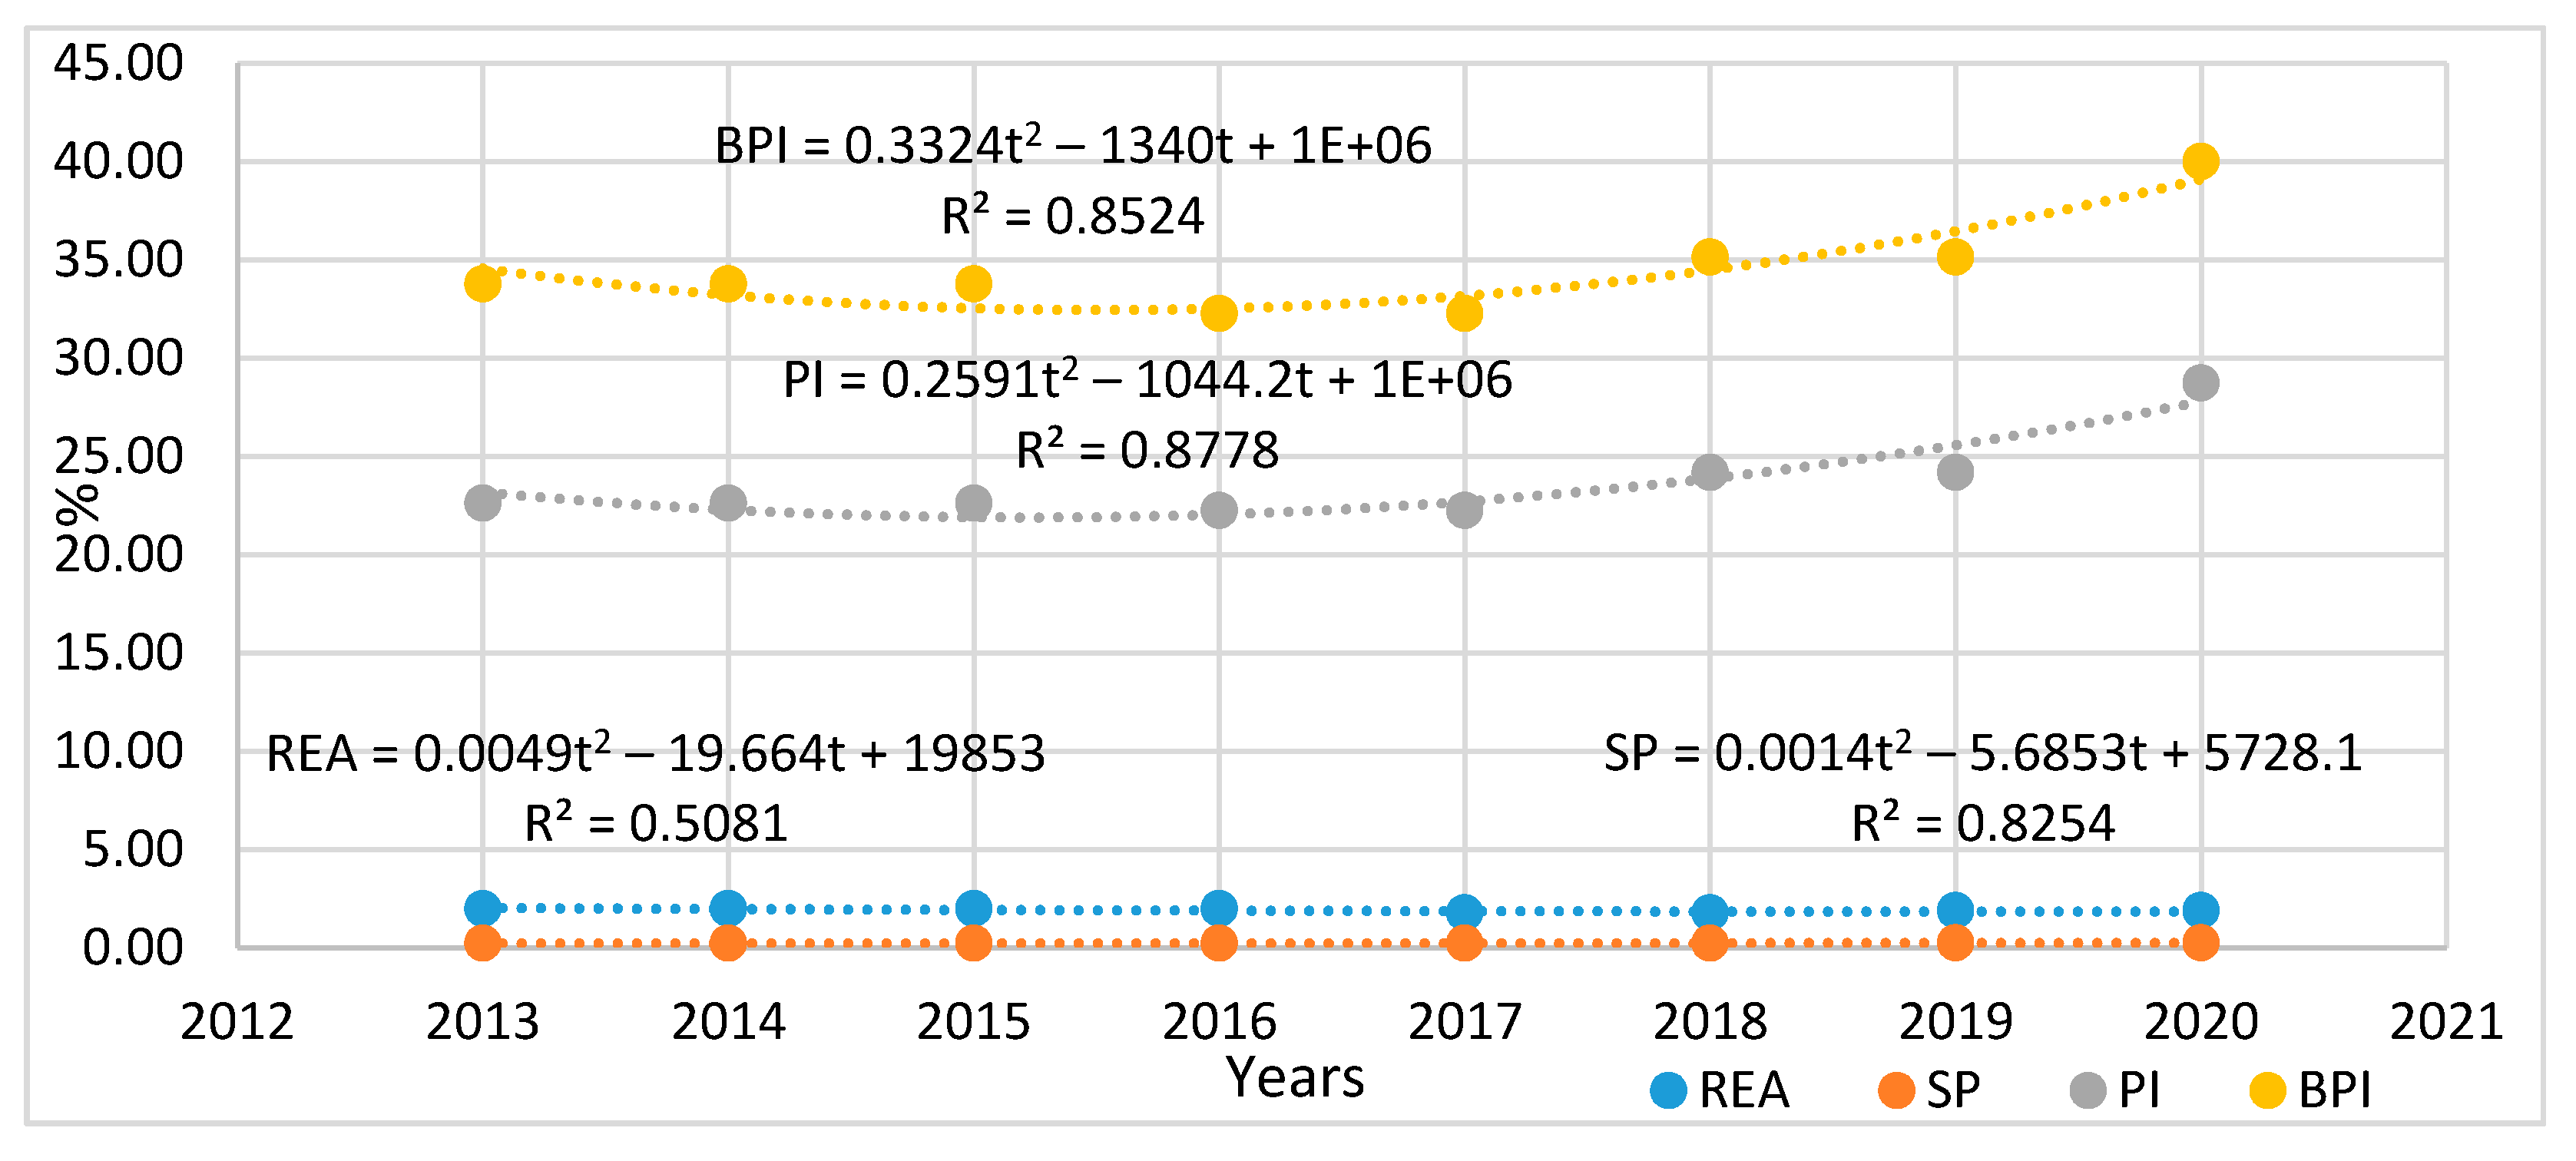
The activities performed by SMEs in the implementation of resource efficiency actions and the implementation of sustainable products did not show an increasing tendency in 2013–2020; in 2013–2020 the EU countries were the least diversified regarding the implementation of resource efficiency actions, and the most diversified in terms of the implementation of sustainable products in SMEs; small and medium-sized enterprises operating in the European Union countries showed a clearly lower level of involvement in eco-innovation than in innovation activities;
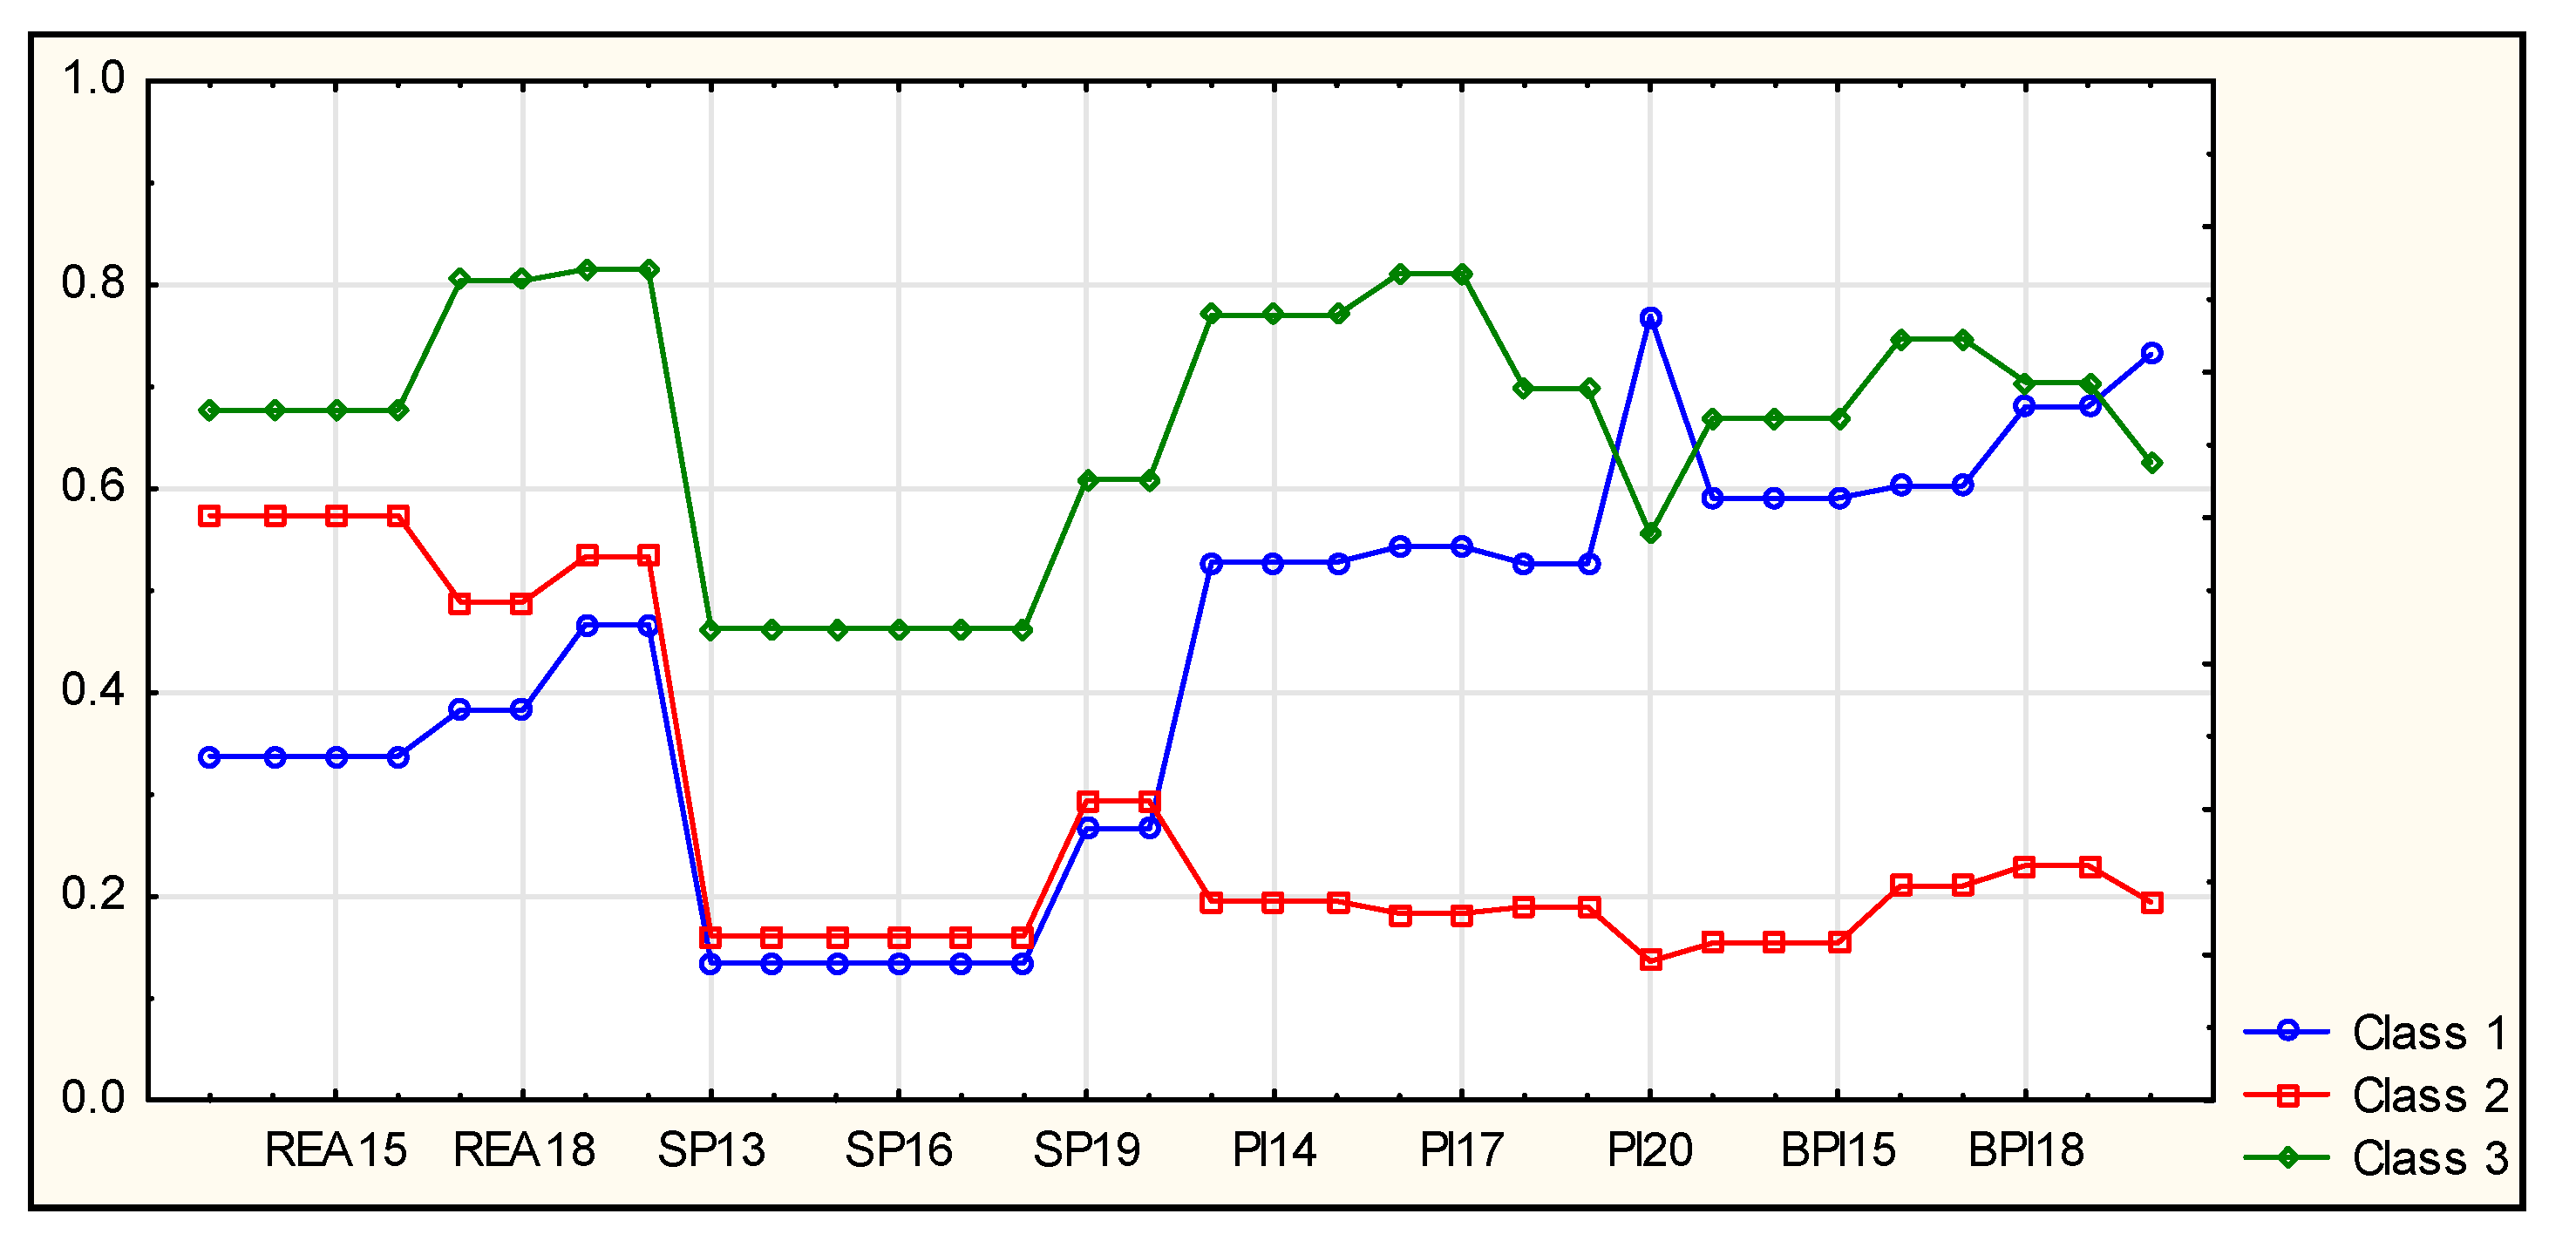
13 European Union countries were qualified to the class of the leaders of eco-innovation and innovation in 2013–2019 and the leaders of eco-innovation and average innovators in 2020, such as: Belgium, Czechia, Denmark, Germany, Ireland, France, Luxembourg, Malta, Netherlands, Austria, Portugal, Finland, and Sweden;
The information age stimulated technological progress, but did not bring about radical environmental changes in the form of a satisfactory implementation of sustainable development concept; human economic activity continues to aggravate environmental degradation and devastation, hence new or significantly improved solutions have to result in the reduction of natural environment burdens and the reconstruction of its degraded components;
The clear dominance of innovation activity over eco-innovation is not conducive to the sustainable development of the EU countries; it seems grounded to consider redefining innovation towards harmonization of new or significantly improved solutions with positive environmental changes; in practice it would mean replacing the term innovation with the concept of eco-innovation;
The enterprises, within the framework of corporate social responsibility, should focus on the ongoing search for and the implementation of product and process eco-innovations in order to minimize negative impacts of the economy on natural environment; it is justified to support the development of pro-ecological cooperation chains as part of business cooperation;
The processes for pro-ecological transformations of enterprises should be supported by customer behavior, which requires raising and strengthening ecological awareness in households; it can be achieved, i.e., by implementing specific incentive mechanisms; it also seems indispensable to enforce new legal regulations imposing pro-ecological solutions and business practices supporting sustainable development in the environment of enterprises and their clients;
It seems necessary to ensure permanent monitoring of the existing eco-innovation indicators, searching for new methods of measuring eco-innovation and improving the system of acquiring statistical information at the European Union level.

Author Contributions

All authors designed the research and analyzed the data. All authors have read and agreed to the published version of the manuscript.

Funding

This research was funded by Wroclaw University of Economics and Business grant number 35/2021.

Institutional Review Board Statement

Not applicable.

Informed Consent Statement

Not applicable.

Data Availability Statement

European innovation scoreboard 2021—Database https://ec.europa.eu/docsroom/documents/46934 (accessed on 30 October 2021). The eco-innovation scoreboard and the eco-innovation index The Eco-Innovation Scoreboard and the Eco-Innovation Index|Eco-innovation Action Plan (europa.eu (accessed on 30 October 2021)).

Conflicts of Interest

The authors declare no conflict of interest.

References

  1. Klassen, R.D.; Vachon, S. Collaboration and evaluation in the supply chain: Their impact on plant-level environmental investment. Prod. Oper. Manag. 2003, 12, 336–352. [Google Scholar] [CrossRef]
  2. Vachon, S.; Klassen, R.D. Supply chain management and environmental technologies: The role of integration. Int. J. Prod. Res. 2007, 45, 401–423. [Google Scholar] [CrossRef]
  3. Klewitz, J.; Hansen, G. Sustainability-oriented innovation of SMEs: A systematic review. J. Clean. Prod. 2014, 65, 57–75. [Google Scholar] [CrossRef]
  4. García-Granero, E.M.; Piedra-Muñoz, L.; Galdeano-Gómez, E. Multidimensional Assessment of Eco-Innovation Implementation: Evidence from Spanish Agri-Food Sector. Int. J. Environ. Res. Public Health 2020, 17, 1432. [Google Scholar] [CrossRef] [PubMed] [Green Version]
  5. Schiederig, T.; Tietze, F.; Herstatt, C. Green innovation in technology and innovation management—An exploratory literature review. R&D Manag. 2012, 42, 18–92. [Google Scholar]
  6. Karakaya, E.; Hidalgo, A.; Nuur, C. Diffusion of eco-innovations: A review. Renew. Sustain. Energy Rev. 2014, 33, 392–399. [Google Scholar] [CrossRef]
  7. Carrillo-Hermosilla, J.; del Río, P.; Könnölä, T. Diversity of eco-innovations: Reflections from selected case studies. J. Clean. Prod. 2010, 18, 1073–1083. [Google Scholar] [CrossRef]
  8. Fussler, C.; James, T. Driving Eco-Innovation: A Breakthrough Discipline for Innovation and Sustainability; Pitman Publishing: London, UK, 1996; p. 364. [Google Scholar]
  9. James, P. The Sustainability Circle: A new tool for product development and design. J. Sustain. Prod. Des. 1997, 2, 52–57. [Google Scholar]
  10. Jones, E.; Harrison, D.; McLaren, J. Managing creative eco-innovation, structuring outputs from eco innovation projects. J. Sustain. Prod. Des. 2001, 1, 27–39. [Google Scholar] [CrossRef]
  11. Arranz, N.; Arroyabe, M.F.; Molina-García, A.; de Arroyabe, J.F. Incentives and inhibiting factors of eco-innovation in the Spanish firms. J. Clean. Prod. 2019, 220, 167–176. [Google Scholar] [CrossRef]
  12. Dangelico, R.M. Green product innovation: Where we are and where we are going. Bus. Strategy Environ. 2016, 25, 560–576. [Google Scholar] [CrossRef]
  13. Jové-Liopis, E.; Segarra-Blasco, A. Eco-innovation strategies: A panel data analysis of Spanish manufacturing firms. Bus. Strategy Environ. 2018, 27, 1209–1220. [Google Scholar] [CrossRef]
  14. Pujari, C. Eco-innovation and New Product Development: Understanding the Influences on Market Performance. Technovation 2006, 26, 76–85. [Google Scholar] [CrossRef]
  15. Official Journal of the European Union. Decision No 1639/2006/EC of the European Parliament and of the Council of 24 October 2006 Establishing a Competitiveness and Innovation Framework Programme (2007 to 2013). Available online: https://eur-lex.europa.eu/legal-content/EN/TXT/PDF/?uri=CELEX:32006D1639&from=PL (accessed on 20 November 2021).
  16. Klemmer, P.; Lehr, U. Environmental Innovation. Incentives and Barriers; German Ministry of Research and Technology—Analytica-Verlag: Berlin, Germany, 1999; pp. 25–40.
  17. Rennings, K. Redefining innovation—Eco-innovation research and the contribution from ecological economics. Ecol. Econ. 2000, 32, 319–332. [Google Scholar] [CrossRef]
  18. Ottman, J.A.; Stafford, E.R.; Hartman, C.L. Avoiding green marketing myopia: Ways to improve consumer appeal for environmentally preferable products. Environ. Sci. Policy Sustain. Dev. 2006, 48, 22–36. [Google Scholar] [CrossRef]
  19. Ottman, J. The New Rules of Green Marketing: Strategies, Tools, and Inspiration for Sustainable Branding; Greenleaf Publishing: Brussels, Belgium, 2011; p. 89. [Google Scholar]
  20. Kanerva, M.; Arundel, A.; Kemp, R. Environmental Innovation: Using Qualitative Models to Identify Indicator for Policy; Working Papers Series; United Nations University: Maastricht, The Netherlands, 2009; p. 7. [Google Scholar]
  21. Kemp, R.; Andersen, M.M.; Butter, M. Background Report about Strategies for Eco-Innovation, Report for VROM; Maastricht Economic Research Institute on Innovation and Technology: Maastricht, The Netherlands, 2004; p. 70. [Google Scholar]
  22. Bartolomeo, M.; Kemp, R.; Rennings, K.; Zwick, T. Employment impacts of cleaner production: Theory, methodology and results. In Employment Impacts of Cleaner Production; Rennings, K., Zwick, T., Eds.; ZEW Economic Studies (Publication Series of the Centre for European Economic Research (ZEW), Mannheim, Germany); Physica: Heidelberg, Germany, 2003; Volume 21, pp. 3–53. [Google Scholar]
  23. Sinclair-Desgagne, B.; Feigenbaum, D.; Pawlak, É. The Integrated Product Policy and the Innovation Process: An Overview; CIRANO: Montreal, QC, Canada, 2003; pp. 1–39. [Google Scholar]
  24. Huppes, G.; Klejn, R.; Huele, R.; Ekins, P.; Shaw, B.; Schaltegger, S.; Esders, M. Measuring Eco-Innovation: Framework and Typology of Indicators. Management Summary of the Final Report of the ECODRIVE Project. ECODRIVE Report to the European Commission. 2010. Available online: https://cordis.europa.eu/project/id/44391/reporting/es (accessed on 20 November 2021).
  25. Kemp, R.; Pearson, P. Final Report MEI Project about Measuring Eco-Innovation; UM-MERIT: Maastricht, The Netherlands, 2007; p. 7. [Google Scholar]
  26. Horbach, J.; Rammer, C.; Rennings, K. Determinants of ecoinnovations by type of environmental impact. The role of regulatory push/pull, technology push and market pull. Ecol. Econ. 2012, 78, 112–122. [Google Scholar] [CrossRef] [Green Version]
  27. Peiró-Signes, Á.; Segarra-Oña, M. How past decisions affect future behavior on eco-innovation: An empirical study. Bus. Strategy Environ. 2018, 27, 1233–1244. [Google Scholar] [CrossRef]
  28. Oltra, V.; Saint, J.M. Sectoral Systems of Environmental Innovation: An Application to the French Automotive Industry. Technol. Forecast. Soc. Chang. 2009, 76, 567–583. [Google Scholar] [CrossRef]
  29. Arundel, A.; Kemp, R. Measuring Eco-Innovation. United Nations Univ.-Maastricht Econ. Soc. Res. Inst. Innov. Technol. (MERIT) 2009, 17, 1–40. [Google Scholar]
  30. Kemp, R.; Oltra, V. Research insights and challenges on eco-innovation dynamics. Ind. Innov. 2011, 18, 249–253. [Google Scholar] [CrossRef]
  31. Clarke, S.F.; Roome, N.J. Managing for environmentally sensitive technology: Networks for collaboration and learning. Technol. Anal. Strateg. Manag. 1995, 7, 191–216. [Google Scholar] [CrossRef]
  32. Reid, A.; Miedzinski, M. Eco-Innovation. Final Report for Sectoral Innovation Watch; Technopolis Group: Brussels, Belgium, 2008; Available online: https://www.researchgate.net/publication/301520793_Eco-Innovation_Final_Report_for_Sectoral_Innovation_Watch (accessed on 5 October 2021).
  33. Rave, T.; Goetzke, F.; Larch, M. The Determinants of Environmental Innovations and Patenting: Germany Reconsidered. Ifo Work. Pap. 2011, 97, 5–17. [Google Scholar]
  34. Giupponi, C.; Matthies, M.; Ostendorf, B. Environmental decision support systems: Current issues methods and tools. Environ. Model. Softw. 2007, 22, 123–127. [Google Scholar]
  35. Cainelli, G.; Mazzanti, M.; Montresor, S. Environmental innovations, local networks and internationalization. Ind. Innov. 2012, 19, 697–734. [Google Scholar] [CrossRef] [Green Version]
  36. Hemmelskamp, J. Environmental policy instruments and their effects on innovation. Eur. Plan. Stud. 1997, 5, 177–194. [Google Scholar] [CrossRef] [Green Version]
  37. VINNOVA-Swedish Governmental Agency for Innovation Systems. Drivers of Environmental Innovation. VINNOVA Innovation in Focus VF 2001:1; VINNOVA-Swedish Governmental Agency for Innovation Systems: Stockholm, Sweden, 2001; pp. 1–66.
  38. Cai, W.; Li, G. The drivers of eco-innovation and its impact on performance: Evidence from China. J. Clean. Prod. 2018, 176, 110–118. [Google Scholar] [CrossRef]
  39. Astuti, M.; Prawoto, P.; Irawan, Y.S.; Sugiono, S. The eco-innovation variables which influence the performance of creative industries center of natural stone crafts. J. Ecol. Eng. 2018, 19, 14–24. [Google Scholar] [CrossRef]
  40. Cleff, T.; Rennings, K. Determinants of environmental product and process innovation. Eur. Environ. 1999, 9, 191–201. [Google Scholar] [CrossRef]
  41. Rennings, K.; Rammer, C. The Impact of Regulation-Driven Environmental Innovation on Innovation Success and Firm Performance. Ind. Innov. 2011, 18, 255–283. [Google Scholar] [CrossRef]
  42. Yu, C.; Park, J.; Hwang, Y.S. How Do Anticipated and Self Regulations and Information Sourcing Openness Drive Firms to Implement Eco-Innovation? Evidence from Korean Manufacturing Firms. Int. J. Environ. Res. Public Health 2019, 16, 2678. [Google Scholar] [CrossRef] [Green Version]
  43. Zhang, J.; Liang, G.; Feng, T.; Yuan, C.; Jiang, W. Green innovation to respond to environmental regulation: How external knowledge adoption and green absorptive capacity matter? Bus. Strategy Environ. 2019, 29, 39–53. [Google Scholar] [CrossRef]
  44. Beise, M.; Rennings, K. Lead Markets of Environmental Innovations: A Framework for Innovation and Environmental Economics. ZEW Discuss. Papers. Cent. Eur. Econ. Res. 2003, 3, 1–24. [Google Scholar] [CrossRef] [Green Version]
  45. Carrillo-Hermosilla, J.; del Río, P.; Könnola, T. Eco-Innovation. When Sustainability and Competitiveness Shake Hands; Palgrave: London, UK, 2009; pp. 6–27. [Google Scholar]
  46. Berkhout, F. Technological regimes, environmental performance and innovation systems. In Towards Environmental Innovation Systems; Weber, M., Hemmelskamp, J., Eds.; Springer: Berlin, Germany, 2002; pp. 57–80. [Google Scholar]
  47. Rennings, K.; Markewitz, P.; Vögele, S. How clean is clean? Incremental versus radical technological change in coal-fired power plants. J. Evol. Econ. 2013, 23, 331–355. [Google Scholar] [CrossRef] [Green Version]
  48. Kemp, R.; Foxon, T. Typology of Eco-Innovations. Deliverable 2; EU FP6 Funded Project 044513: Maastricht, The Netherlands, 2007; pp. 1–25. [Google Scholar]
  49. Organization for Economic Co-Operation and Development. Sustainable Manufacturing and Eco-Innovation: Framework, Practices and Measurement—Synthesis Report; OECD: Paris, France, 2009; p. 13. [Google Scholar]
  50. Porter, M.E.; van der Linde, C. Toward a new conception of the environment-competitiveness relationship. J. Econ. Perspect. 1995, 9, 97–118. [Google Scholar] [CrossRef] [Green Version]
  51. Castellacci, F.; Lie, C.M. A taxonomy of green innovators: Empirical evidence from South Korea. J. Clean. Prod. 2017, 143, 1036–1047. [Google Scholar] [CrossRef] [Green Version]
  52. Costantini, V.; Crespi, F.; Palma, A. Characterizing the policy mix and its impact on eco-innovation: A patent analysis of energy-efficient technologies. Res. Policy 2017, 46, 799–819. [Google Scholar] [CrossRef]
  53. Doran, J.; Ryan, G. The importance of the diverse drivers and types of environmental innovation for firm performance. Bus. Strategy Environ. 2016, 25, 102–119. [Google Scholar] [CrossRef]
  54. Ghisetti, C.; Quatraro, F. Green technologies and environmental productivity: A cross-sectoral analysis of direct and indirect effects in Italian regions. Ecol. Econ. 2017, 132, 1–13. [Google Scholar] [CrossRef]
  55. Janssen, M.A.; Jager, W. Stimulating diffusion of green products. J. Evol. Econ. 2002, 12, 283–306. [Google Scholar] [CrossRef]
  56. Brouillat, E. Recycling and extending product-life: An evolutionary modelling. J. Evol. Econ. 2009, 19, 437–461. [Google Scholar] [CrossRef]
  57. Horbach, J.; Rammer, C. Circular Economy Innovations, Growth and Employment at the Firm Level: Empirical Evidence from Germany. J. Ind. Ecol. 2020, 24, 615–625. [Google Scholar] [CrossRef] [Green Version]
  58. Sharma, S.; Henriques, I. Stakeholder influences on sustainability practices in the Canadian forest products industry. Strateg. Manag. J. 2005, 26, 159–180. [Google Scholar] [CrossRef]
  59. Horbach, J.; Oltra, V.; Belin, J. Determinants and Specificities of Eco-Innovations Compared to Other Innovations—An Econometric Analysis for the French and German Industry Based on the Community Innovation Survey. Ind. Innov. 2013, 20, 523–543. [Google Scholar] [CrossRef]
  60. Roscoe, S.; Cousins, P.D.; Lamming, R.C. Developing eco-innovations: A three-stage typology of supply networks. J. Clean. Prod. 2016, 112, 1948–1959. [Google Scholar] [CrossRef]
  61. Rennings, K. Towards a Theory and Policy of Eco-innovation—Neoclassical and Co-Evolutionary Perspectives. ZEW Discuss. Pap. 1998, 98, 5–24. [Google Scholar]
  62. Hategan, V.P. Eco Trends, Counseling and Applied Ecology in Community Using Sophia. Int. J. Environ. Res. Public Health 2021, 18, 6572. [Google Scholar] [CrossRef]
  63. Cecere, G.; Corrocher, N.; Gossart, C.; Ozman, M. Lock-in and path dependence: An evolutionary approach to eco-innovations. J. Evol. Econ. 2014, 24, 1037–1065. [Google Scholar] [CrossRef]
  64. Taylor, M.R.; Rubin, E.S.; Hounshell, D.A. Control of SO2 emissions from power plants: A case of induced technological innovation in the U.S. Technol. Forecast. Soc. Chang. 2005, 72, 697–718. [Google Scholar] [CrossRef]
  65. Jacobsen, S.; Clausen, T. Comparing the Innovation Process in Environmental and Non-Environmental Firms: A Look at Barriers to Innovation. In Proceedings of the DRUID Society Conference, Copenhagen, Denmark, 16–18 June 2014; pp. 1–25. [Google Scholar]
  66. De Marchi, V. Environmental innovation and R & D Cooperation: Empirical Evidence from Spanish Manufacturing Firms. Res. Policy 2012, 41, 614–623. [Google Scholar]
  67. Arranz, N.F.; Arroyabe, C.; Fernandez de Arroyabe, J.C. The effect of regional factors in the development of eco-innovations in the firm. Bus. Strategy Environ. 2019, 28, 1406–1415. [Google Scholar] [CrossRef]
  68. Gente, V.; Pattanaro, G. The place of eco-innovation in the current sustainability debate. Waste Manag. 2019, 88, 96–101. [Google Scholar] [CrossRef] [PubMed]
  69. Pichlak, M.; Szromek, A.R. Eco-Innovation, Sustainability and Business Model Innovation by Open Innovation Dynamics. J. Open Innov. Technol. Mark. Complex. 2021, 7, 149. [Google Scholar] [CrossRef]
  70. Eco-Innovation Observatory. EU Eco-Innovation Index: 2021 Version—Policy Brief; Eco-Innovation Observatory: Brussels, Belgium, 2021; pp. 1–12. [Google Scholar]
  71. European Commission. Directorate-General for Internal Market, Industry, Entrepreneurship and SMEs, European Innovation Scoreboard 2021—Methodology Report; European Commission: Brussels, Belgium, 2021; pp. 1–41. [Google Scholar]
  72. Asteriou, D.; Hall, S.G. Applied Econometrics; Palgrave Macmillan: New York, NY, USA, 2016; pp. 27–62. [Google Scholar]
  73. Greene, W.H. Econometric Analysis; Pearson Education Limited: London, UK, 2018. [Google Scholar]
  74. Zeliaś, A. Some Notes on the Selection of Normalisation of Diagnostic Variables. Stat. Transit. 2002, 5, 787–802. [Google Scholar]
  75. Hartigan, J. Clustering Algorithms; John Wiley & Sons: New York, NY, USA, 1975. [Google Scholar]
  76. Aldefender, M.; Blashfield, R. Cluster Analysis; Sage Press: Beverly Hills, CA, USA, 1984. [Google Scholar]
Figure 1. Development trends of the eco-innovation activity indexes: REA and SP and innovation activity indexes: PI, BPI in the European Union countries in 2013–2020. Source: authors’ compilation based on the Eco-Innovation Index 2021 database (where: REA—implementation of resource efficiency actions in SMEs (% of SMEs); SP—implementation of sustainable products in SMEs (% of SMEs); PI—SMEs with product innovations (% of SMEs); BPI—SMEs with business process innovations (% of SMEs)).
Sustainability 14 01970 g001
Figure 2. Box plot for the eco-innovation activity indexes: REA and SP for the EU countries in 2013–2020. Source: authors’ compilation based on the Eco-Innovation Index 2021 database (where: REA—implementation of resource efficiency actions in SMEs (% of SMEs); SP—implementation of sustainable products in SMEs (% of SMEs)).
Sustainability 14 01970 g002
Figure 3. Box plot for the innovation activity indexes: PI and BPI of the EU countries in 2013–2020. Source: authors’ compilation based on the European Innovation Scoreboard 2021 database (where: PI—SMEs with product innovations (% of SMEs); BPI—SMEs with business process innovations (% of SMEs)).
Sustainability 14 01970 g003
Figure 4. (a) Dendrogram describing the hierarchical clustering analysis using Ward’s method for the EU countries; (b) Integration distances and classification stages using Ward’s method for the EU countries. Source: authors’ compilation based on the Eco-Innovation Index 2021 database and the European Innovation Scoreboard 2021 database using STATISTICA 13.1 package. Codes for EU countries: Austria (AT), Belgium (BE), Bulgaria (BG), Cyprus (CY), Czech Republic (CZ), Germany (DE), Denmark (DK), Estonia (EE), Greece (EL), Spain (ES), Finland (FI), France (FR), Croatia (HR), Hungary (HU), Ireland (IE), Italy (IT), Lithuania (LT), Luxembourg (LU), Latvia (LV), Malta (MT), Netherlands (NL), Poland (PL), Portugal (PT), Romania (RO), Sweden (SE), Slovenia (SI), Slovakia (SK).
Sustainability 14 01970 g004
Figure 5. Mean values of the normalized eco-innovation activity indexes: REA, SP and innovation activity indexes: PI, BPI in the European Union countries in 2013–2020. Source: authors’ compilation based on the Eco-Innovation Index 2021 database and the European Innovation Scoreboard 2021 database using STATISTICA 13.1 package (where: REA—implementation of resource efficiency actions in SMEs (% of SMEs); SP—implementation of sustainable products in SMEs (% of SMEs); PI—SMEs with product innovations (% of SMEs); BPI—SMEs with business process innovations (% of SMEs)).
Sustainability 14 01970 g005
Table 1. Descriptive parameters of the eco-innovation activity index—implementation of resource efficiency actions in SMEs as % of SMEs (REA) in 2013–2020.
Parameter20132014201520162017201820192020
min0.810.810.810.810.810.810.570.57
EEEEEEEEEEEEEEEE
max2.592.592.592.592.242.242.212.21
ESESESESPTPTPTPT
R1.781.781.781.781.431.431.641.64
Md1.841.841.841.841.771.771.681.68
x ¯ 1.811.811.811.811.691.691.641.64
Q11.611.611.611.611.401.401.411.41
Q32.062.062.062.061.981.981.941.94
CV22.2022.2022.2022.2020.9120.9125.1525.15
Sk−0.212−0.22−0.22−0.22−0.65−0.65−0.30−0.30
Where: EE—Estonia, ES—Spain, PT—Portugal, R—Range; Md—Median; x ¯ —Arithmetic Mean; Q1, Q3—first and third Quartiles; CV—Coefficient of Variation (%); Sk—Coefficient of Skewness. Source: authors’ compilation based on the Eco-Innovation Index 2021 database.
Table 2. Descriptive parameters of the eco-innovation activity index values—implementation of sustainable products in SMEs as % of SMEs (SP) in 2013–2020.
Parameter20132014201520162017201820192020
min0.090.090.090.090.090.090.050.05
EEEEEEEEEEEEEEEE
max0.520.520.520.520.520.520.420.42
PTPTPTPTPTPTPTPT
R0.420.420.420.420.420.420.370.37
Md0.190.190.190.190.190.190.230.23
x ¯ 0.220.220.220.220.220.220.210.21
Q10.140.140.140.140.140.140.160.16
Q30.290.290.290.290.290.290.270.27
CV46.2446.2446.2446.2446.2446.2444.8644.86
Sk0.860.860.860.860.860.86−0.56−0.56
Where: EE—Estonia, PT—Portugal, R—Range; Md—Median; x ¯ >—Arithmetic Mean; Q1, Q3—first and third Quartiles; CV—Coefficient of Variation (%); Sk—Coefficient of Skewness. Source: authors’ compilation based on Eco-Innovation Index 2021 database.
Table 3. Descriptive parameters of the innovation activity index values—SMEs with product innovations as % of SMEs (PI) in 2013–2020.
Parameter20132014201520162017201820192020
min2.842.842.843.203.203.033.033.03
RORORORORORORORO
max34.5534.5534.5534.2434.2441.5841.5848.88
DEDEDEIEIEFIFIEE
R31.7131.7131.7131.0431.0438.5438.54439.52
Md22.8122.8122.8123.3023.3024.0924.0930.40
x ¯ 20.5320.5320.5321.1721.1723.1423.1429.20
Q111.9211.9211.9211.1711.1714.3314.3322.38
Q327.5727.5727.5728.2128.2130.2230.2235.61
CV42.2442.2442.2443.3343.3343.0943.0936.44
Sk−0.79−0.79−0.79−0.70−0.70−0.29−0.29−0.34
Where: RO—Romania, DE—Germany, IE—Ireland, FI—Finland, EE—Estonia, R—Range; Md—Median; x ¯ —Arithmetic Mean; Q1, Q3—first and third Quartiles; CV—Coefficient of Variation (%); Sk –Coefficient of Skewness. Source: authors’ compilation based on the European Innovation Scoreboard 2021 database.
Table 4. Descriptive parameters of the innovation activity index values—SMEs with business process innovations as % of SMEs (BPI) in 2013–2020.
Parameter20132014201520162017201820192020
min16.4016.4016.4010.1110.117.887.887.57
PLPLPLRORORORORO
max49.6449.6449.6449.1849.1854.5954.5965.62
LULULUBEBEPTPTCY
R33.2433.2433.2439.0639.0646.7146.7158.05
Md34.7334.7334.7334.9634.9636.5936.5939.44
x ¯ 33.5433.5433.5432.4132.4134.7534.7539.01
Q126.1426.1426.1425.1725.1726.6226.6228.34
Q340.1640.1640.1639.7239.7242.4742.4749.87
CV26.9426.9426.9434.3634.3633.6933.6937.05
Sk−0.39−0.39−0.39−0.69−0.69−0.47−0.47−0.09
Where: PL—Poland, RO—Romania, LU—Luxembourg, BE—Belgium, PT—Portugal, CY—Cyprus, R—Range; Md—Median; x ¯ —Arithmetic Mean; Q1, Q3—first and third Quartiles; CV—Coefficient of Variation (%); Sk—Coefficient of Skewness. Source: authors’ compilation based on the European Innovation Scoreboard 2021 database.
Table 5. Classification of the European Union countries according to the eco-innovation activity (REA and SP) indexes and the innovation activity (PI and BPI) indexes.
Class
Number
Class NameClass CompositionClass
Size
Average
Distance from the Middle of the Class
12013–2019
Catching-up eco-innovators
and average innovators
Estonia, Greece, Croatia, Italy, Cyprus, Lithuania, Slovenia70.16
2020
Catching-up eco-innovators
and leaders of innovation
22013–2020
REA average—SP catching-up eco-innovators
and catching-up innovators
Bulgaria, Spain, Latvia, Hungary, Poland, Romania, Slovakia70.13
32013–2019
Leaders of eco-innovation and innovation
Belgium, Czechia, Denmark, Germany, Ireland, France, Luxembourg, Malta, Netherlands, Austria, Portugal, Finland, Sweden130.15
2020
Leaders of eco-innovation
and average innovators
Where: REA—implementation of resource efficiency actions in SMEs (% of SMEs); SP—implementation of sustainable products in SMEs (% of SMEs); PI—SMEs with product innovations (% of SMEs); BPI—SMEs with business process innovations (% of SMEs). Source: authors’ compilation.
Table 6. Mean values of eco-innovation (REA and SP) and innovation activity (PI and BPI) indexes for the identified types of classes of the European Union countries in 2013–2020 (%).
Class NameMean
Values
20132014201520162017201820192020
Class 12013–2019: Catching-up eco-innovators
and average innovators
REA1.411.411.411.411.361.361.341.34
SP0.150.150.150.150.150.150.150.15
2020: Catching-up eco-innovators
and leaders of innovation
PI19.5819.5819.5820.0720.0723.3323.3339.76
BPI36.0436.0436.0433.6633.6639.6639.6650.05
Class 22013–2020: REA average—SP catching-up eco-innovators and catching-up innovatorsREA1.831.831.831.831.511.511.441.44
SP0.160.160.160.160.160.160.160.16
PI9.039.039.038.888.8810.3510.3514.74
BPI21.5321.5321.5318.3318.3318.6318.6318.87
Class 32013–2019: Leaders of eco-innovation
and innovation
REA2.022.022.022.021.961.961.911.91
SP0.290.290.290.290.290.290.280.28
2020: Leaders of eco-innovation
and average innovators
PI27.2527.2527.2528.3828.3829.9329.9331.29
BPI38.6538.6538.6539.3139.3140.7940.7943.90
Where: REA—implementation of resource efficiency actions in SMEs (% of SMEs); SP—implementation of sustainable products in SMEs (% of SMEs); PI—SMEs with product innovations (% of SMEs); BPI—SMEs with business process innovations (% of SMEs). Source: authors’ compilation based on the Eco-Innovation Index 2021 database and the European Innovation Scoreboard 2021 database.
Publisher’s Note: MDPI stays neutral with regard to jurisdictional claims in published maps and institutional affiliations.

