Article

Price Prediction and Classification of Used-Vehicles Using Supervised Machine Learning

by
Lucija Bukvić
*,
Jasmina Pašagić Škrinjar
,
Tomislav Fratrović
and
Borna Abramović
Faculty of Transport and Traffic Sciences, University of Zagreb, 10000 Zagreb, Croatia
*
Author to whom correspondence should be addressed.
Sustainability 2022, 14(24), 17034; https://doi.org/10.3390/su142417034
Submission received: 6 October 2022 / Revised: 6 December 2022 / Accepted: 13 December 2022 / Published: 19 December 2022
(This article belongs to the Special Issue Sustainable Data-Driven Innovations in Supply Chains)

Abstract

:
Due to the large growth in the number of cars being bought and sold, used-car price prediction creates a lot of interest in analysis and research. The availability of used cars in developing countries results in an increased choice of used vehicles, and people increasingly choose used vehicles over new ones, which causes shortages. There is an important need to explore the enormous amount of valuable data generated by vehicle sellers. All sellers usually have the imminent need of finding a better way to predict the future behavior of prices, which helps in determining the best time to buy or sell, in order to achieve the best profit. This paper provides an overview of data-driven models for estimating the price of used vehicles in the Croatian market using correlated attributes, in terms of production year and kilometers traveled. In order to achieve this, the technique of data mining from the online seller “Njuškalo” was used. Redundant and missing values were removed from the data set during data processing. Using the method of supervised machine learning, with the use of a linear regression algorithm for predicting the prices of used cars and comparing the accuracy with the classification algorithm, the purpose of this paper is to describe the state of the vehicle market and predict price trends based on available attributes. Prediction accuracy increases with training the model with the second data set, where price growth is predicted by linear regression with a prediction accuracy of 95%. The experimental analysis shows that the proposed model predicts increases in vehicle prices and decreases in the value of vehicles regarding kilometers traveled, regardless of the year of production. The average value of the first data set is a personal vehicle with 130,000 km traveled and a price of EUR 10,000. The second set of data was extracted 3 months after the previously analyzed set, and the average price of used vehicles increased by EUR 1391 per vehicle. On the other hand, average kilometers traveled decreased by 8060 km, which justifies the increase in prices and validates the training models. The price and vehicle type are features that play an important role in predicting the price in a second-hand market, which seems to be given less importance in the current literature of prediction models.

1. Introduction

With the rapid development of the Internet and technologies, people are increasingly engaging in online shopping. Online shopping has a vital role in our daily lives due to the associated low cost, high convenience, ease of use, and other such advantages. Consequently, many types of retail websites, such as OLX and eBay, are available in the online market. In particular, the past decades have seen rapid growth in second-hand consumption across many global markets as a result of the booming collection of used and unwanted products. Pricing is not only a science but also an art that requires statistical and experimental formulas to create a profile for both the brand and product in the market. Fathalla et al. [1] proposed one of the main challenges faced by retailers, which is pricing. Today, the automotive industry is considered one of the backbones of the economy, and cars are called the “industry of industries” in developed countries. Lower inventory and longer vehicle retention in production and ownership, respectively, should lead to lower prices in the used-car sector in the second half of 2022 according to the Vehicle Remarketing Association (VRA). The used-car sector in the Republic of Croatia was at its peak of sales in 2019. However, the general economic picture is deteriorating and could degrade quickly during the second half of 2022, and this is likely to have an impact in all ways, but most of all on consumer confidence, with the cost of living crisis becoming acute [2]. This will have a direct impact on the market, as many private car owners would choose to keep their existing vehicle for longer as their personal finances are affected, which is likely to cause demand to soften. This decrease in demand could also be accompanied by a further decline in vehicle supply, driven by a new vehicle market that is not really improving in terms of the number of units available because, although the semiconductor situation is starting to ease, new factors, such as the situation in Ukraine, have emerged. Manufacturers that have been able to deliver new cars in large quantities over the past 2 to 3 years have often differentiated themselves from the traditionally dominant players in the market. The mix of brands and models on some websites is noticeably different than it was before the COVID-19 pandemic. A recent study in the United Kingdom shows that from April to May of 2022, used-car prices decreased by 1.4% and are now 0.1 percentage points lower than at the beginning of January 2022. The average used-car value fell in September 2021 from a high of GBP 12,000 to GBP 8,552 in April 2022. Values leveled off over the first four months of 2022, with lead prices moving from 99% in January to 94.8% in April [2]. According to the data of the Croatian Vehicle Center in Figure 1, it is evident that the sale of used vehicles exceeded the number of new vehicles sold after 2014. Likewise, after 2019, a total decline in new car sales was recorded [3].
The majority of sales contributing to the ownership of private cars, due to affordability and economy, falls on the used-car sector. To accurately predict the prices of used cars in the future, experts and their knowledge are needed when making decisions, due to the nature of the dependence of the price of a vehicle on various factors and features in the market. Authors [4] used a multiple linear regression model to predict the prices of new and second-hand vehicles, for which the data set is in a tabular form. Yang et al. [5] proposed a model for predicting vehicle prices based on product images only by using a custom convolutional neural network (CNN) architecture. Authors in [6,7] used sentiment analysis and machine learning for predicting stock prices. Kalaiselvi et al. [8] developed pricing analytics for smartphones by using a multilayer feed-forward neural network. Ahmed et al. [9] used a data set of tabular data and images to address house price prediction using support vector regressor (SVR) and neural network (NN) models. Moreover, the authors in [10] present an approach to identify the segment of recreational trips implemented within the bike-sharing system based on popular clusterization algorithms. The authors developed subroutines for cleaning the raw data obtained from GPS trackers. By using the purified data on the numeric parameters of trips in a bicycle-sharing system, the clustering model identifies such a cluster that represents recreational trips. The use of the proposed approach is demonstrated on the example of data obtained from the bike-sharing system in the city of Krakow, Poland. More recently, the authors in [11] exploit unique feature of the bike-sharing system, such as stopovers—short, non-traffic-related stops made by cyclists during their trips. The price prediction of second-hand items has not been widely addressed. Only a few studies have addressed the price prediction of used products in a specific domain, specifically, the price prediction of second-hand cars [12]. Furthermore, Chen et al. [13] conducted an empirical investigation and compared two techniques, namely linear regression and random forest. This shows that the latter is the best algorithm for dealing with complex models with a large number of variables and data. However, it lacks a clear benefit when dealing with effortless models with fewer variables. The mean error of the sample data fluctuates around 0.3. It can be seen that the existing used-car price prediction methods are not ideal, so it is necessary to find a reasonable, efficient, scientific, and accurate method. Artificial neural networks (ANN), fuzzy logic systems (FLS), and evolutionary algorithms (EA) are the most quickly emerging fields in computing intelligence, and they can be used to solve a variety of prediction and optimization challenges [14,15,16]. A back-propagation neural network (BPNN) is a typical ANN that does not rely on any empirical formula and can automatically generate rules to existing data to obtain the intricate patterns of the data, which is suitable for building multi-factor non-linear forecasting models, such as those for used cars. Wu et al. [17] compared a BPNN for used-car price prediction with the proposed ANFIS (adaptive neuro-fuzzy inference system). The results showed that when three feature variables are input, the prediction accuracy of the BPNN is lower than the latter. Zhou [18] introduced the BPNN to establish an evaluation model, reducing the subjectivity and randomness amid the valuation process. It showed that the price evaluation predicted by the BPNN is closer to the actuality, with a maximum error of 3.04%, indicating the reliability and applicability of the model. In order to standardize the evaluation standards of used-car prices and improve the accuracy of used-car price forecasts, the linear correlation between vehicle parameters, vehicle conditions, and transaction factors and used-car price was comprehensively investigated, and grey relational analysis was applied by [19] to filter the feature variables of factors affecting used-car prices; furthermore, the traditional BP neural network was also optimized by combining the particle swarm optimization algorithm. To the best of the authors’ knowledge, state-of-the-art methods have limited work for predicting the prices of second-hand products based on machine learning methods. In addition, a method to predict second-hand product prices by using statistical-based approaches and time series models has not been established yet. ML-based methods address only a certain product, while no effort has been made for developing a generic model that can predict the price for a set of different product types. Furthermore, most of the existing second-hand price prediction methods used the textual attributes of products and do not focus on the visual features and condition of the product. However, the price prediction models of second-hand products should rely on product images in addition to textual data [1].
The prices of used cars are not constant on the market, so both buyers and sellers need an intelligent system that will enable the effective prediction of prices on the market and the correct price according to vehicle classification. In such a system, a major limitation is the collection of data that contain the most important elements, namely: (1) year of car production, (2) motor type, (3) condition, (4) kilometers traveled, (5) horsepower, (6) number of doors, and (7) mass of the car. It is clear that the price of the product is affected by the listed features; however, unfortunately, information about these features is not always available [20]. Since this research is primarily focused on the Croatian market, the data were extracted from the most common seller of used vehicles, namely “Njuškalo”. The attributes extracted from the raw data are: manufacturer, model, year of manufacture, kilometers traveled, and selling price [21]. It is necessary to pre-process and transform the collected data into an appropriate format before it is directly fed into the data mining model. As a first step, the data set was analyzed statistically in order to establish which parameters have the greatest correlation. Features are selected and extracted using a correlation matrix. To build an efficient model, the most relevant features were retained, namely vehicle price, kilometers traveled, year of manufacture, and the classification variable of the vehicle manufacturer. The goal of this paper is to predict the prices of used cars in the Republic of Croatia using data mining techniques, collecting data from websites for the sale of used cars, and analyzing the various aspects and factors that lead to the actual estimation of the price of a used car. This enables consumers to check the actual value of their car—or desired car.

2. Applied Methods of Machine Learning

The advantage of machine learning (ML) is the ability of a computer to learn without explicit instructions using mathematical models and processed data. Artificial intelligence is a subset of machine learning. The data are analyzed using pattern identification algorithms, which are then used to create predictive models. Similar to a human, the conclusions of machine learning enable accurate prediction with as much data and experience as possible. With machine learning, the model can adapt to situations where data are constantly changing or coding a solution is not feasible.
Categories of machine learning [22]:
  • Supervised (classification and regression);
  • Unsupervised (clustering and association);
  • Semi-supervised;
  • Reinforcement.
Supervised and unsupervised learning are common types, while reinforcement learning is a sequential decision-making technique. To date, a computer cannot yet make a decision without training [22]. The word "supervised" comes from the word supervisor, which means teacher or expert. In this case, the class label will be categorized or predicted. During the training of the algorithm, the correct answers were already marked with the corresponding class labels. Support vector machines (SVM), random forest trees, and decision trees are commonly used algorithms for supervised machine learning [23]. Unsupervised learning occurs when the input data have no class labels. In order to classify data, it is necessary to model the underlying structure of the data. There are two main types: clustering and association. Well-known unsupervised algorithms are K-means clustering and affinity propagation [24].

2.1. Data Processing

The data are collected from the retail web portal Njuskalo.hr [21]. The following attributes are stored for each used car: manufacturer, kilometers traveled, selling vehicle price, and year of production. Since manual data collection is a time-consuming task, especially when there are numerous records for processes, a web scraper was created as a part of this research to perform data mining automatically, thereby reducing data collection time. Web scraping is a well-known technique for extracting information from a web page and storing the data in a local file or database. Web scrapers are programmed for specific websites and can mimic regular users and their website browsing. This research does not include vehicles manufactured before 2010. After the raw data were collected and stored in a local database, the following steps were implemented through this research (Figure 2).
Some vehicles are labeled “sold” and are excluded from the data set. We also excluded ads that do not contain useful information for prediction; more precisely, if there are too many characters in the name, it is not possible to extract the manufacturer or model of the vehicle. Such ads affect the character length of the entire database, so they are removed. On the other hand, these data do not significantly affect the overall result because a total of 12 examples were thrown out from the database. The next step is a graphical representation (Figure 3) of the relationship between the price of the vehicle and the kilometers traveled in order to identify vehicles that deviate from the limits (outliers).
Two outliers are visible from the graph:
-
Porsche 911 GT3 4.0 manual, 510 horsepower, 2021;
-
Mercedes-Benz C-class 180, 2011, for which the kilometers traveled, under the assumption of error, were entered in the amount of over 2 million.
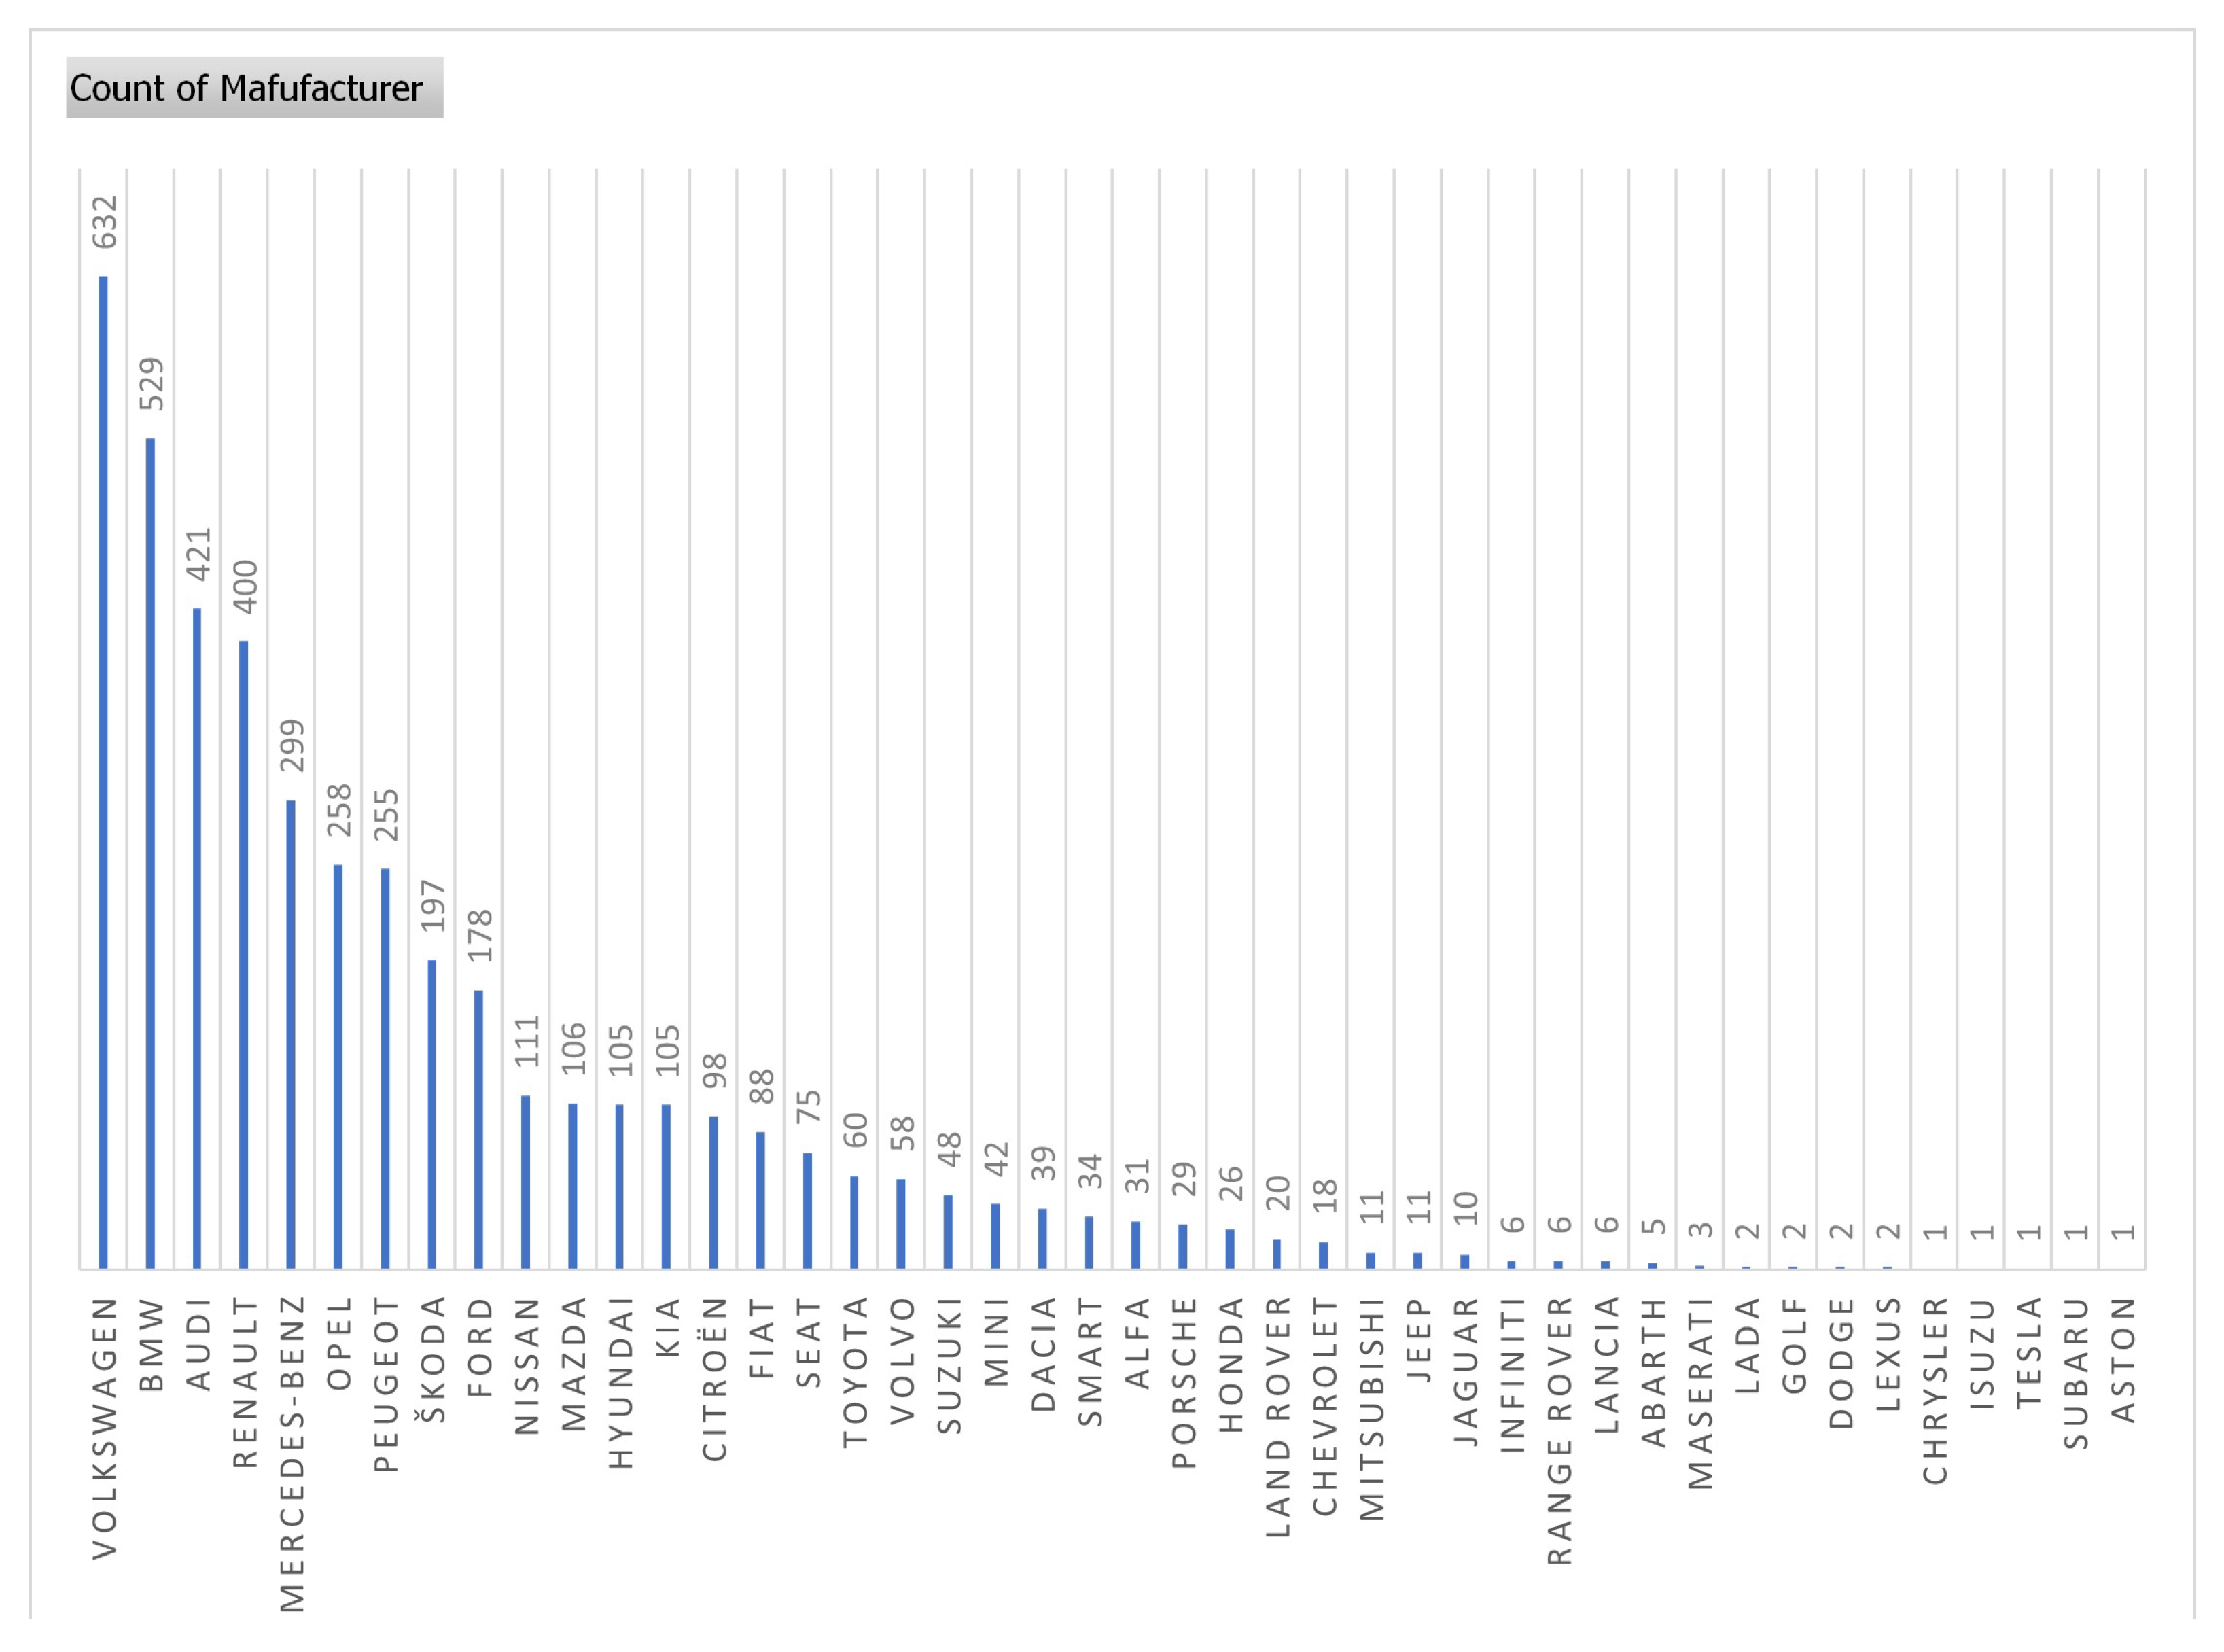
According to the data trained in the regression learner tool (Matlab), the results are not correct due to the large deviation of a few outliers, and a more detailed analysis is not possible until vehicles with a value above EUR 300,000 and 1,000,000 km traveled are excluded. In the initial analysis, price-drop predictions occurred, and the classification of vehicles by manufacturer is incorrect (the actual Audi class is predicted in the Aston manufacturer class). After processing the data and removing outliers, the final number of vehicles in the database is 4388. This data set in Table 1 was retrieved on 30 May 2022.
From Figure 4, it can be seen that the most represented vehicle manufacturers are:
1.
Volkswagen;
2.
BMW;
3.
Audi;
4.
Renault;
5.
Mercedes-Benz.
The SAS Studio (OnDemand for Academics) program was used for the analysis and description of the variables. Figure 5 shows the percentage of vehicles from the data set according to kilometers traveled. The highest percentage of 12.61% refers to vehicles with kilometers traveled between 140,000 and 150,000 km. The largest number of vehicles was produced in 2017, more precisely 13.26% of vehicles from the set. For most vehicles, the warranty expires after 5 years, so the sellers decide to replace the vehicle before the warranty period expires. More than half of the used vehicles, 51.55% of them, are in the price range of up to EUR 10,000. The normal distribution defines a probability density function of the price for the continuous random variable. The random variables, which follow the normal distribution, are ones whose values can assume any known value in a given range. In that manner, kilometers traveled can predict the price range of the used vehicle [25].
Figure 6 shows vehicles in relation to vehicle price and kilometers traveled, classified by the manufacturer. The shades are arranged from red representing Abarth to dark blue representing Volvo (alphabetically).

2.2. Analysis of Model Residuals

Linear regression [26] is a regression model that assumes a linear relationship between the independent variable (X) and the target class, which is the dependent variable (y). With this model, the target class is derived from a linear combination of the input variables. Based on the number of variables, it can be single linear regression or multiple linear regression. Linear regression has an Equation (1) of the following form:
y ^ = a + b X
where y is the predicted dependent variable, X is the independent variable, the slope of the line is b, and a is the intercept. Residuals (errors) represent the difference between the predicted and actual results of the observed data set. The display of vehicle price and kilometers traveled grouped by the manufacturer is shown by box plots in Figure 7 and Figure 8, and the manufacturers are selected from the average in order regarding the highest value:
-
By price: BMW, Mercedes-Benz, Porsche;
-
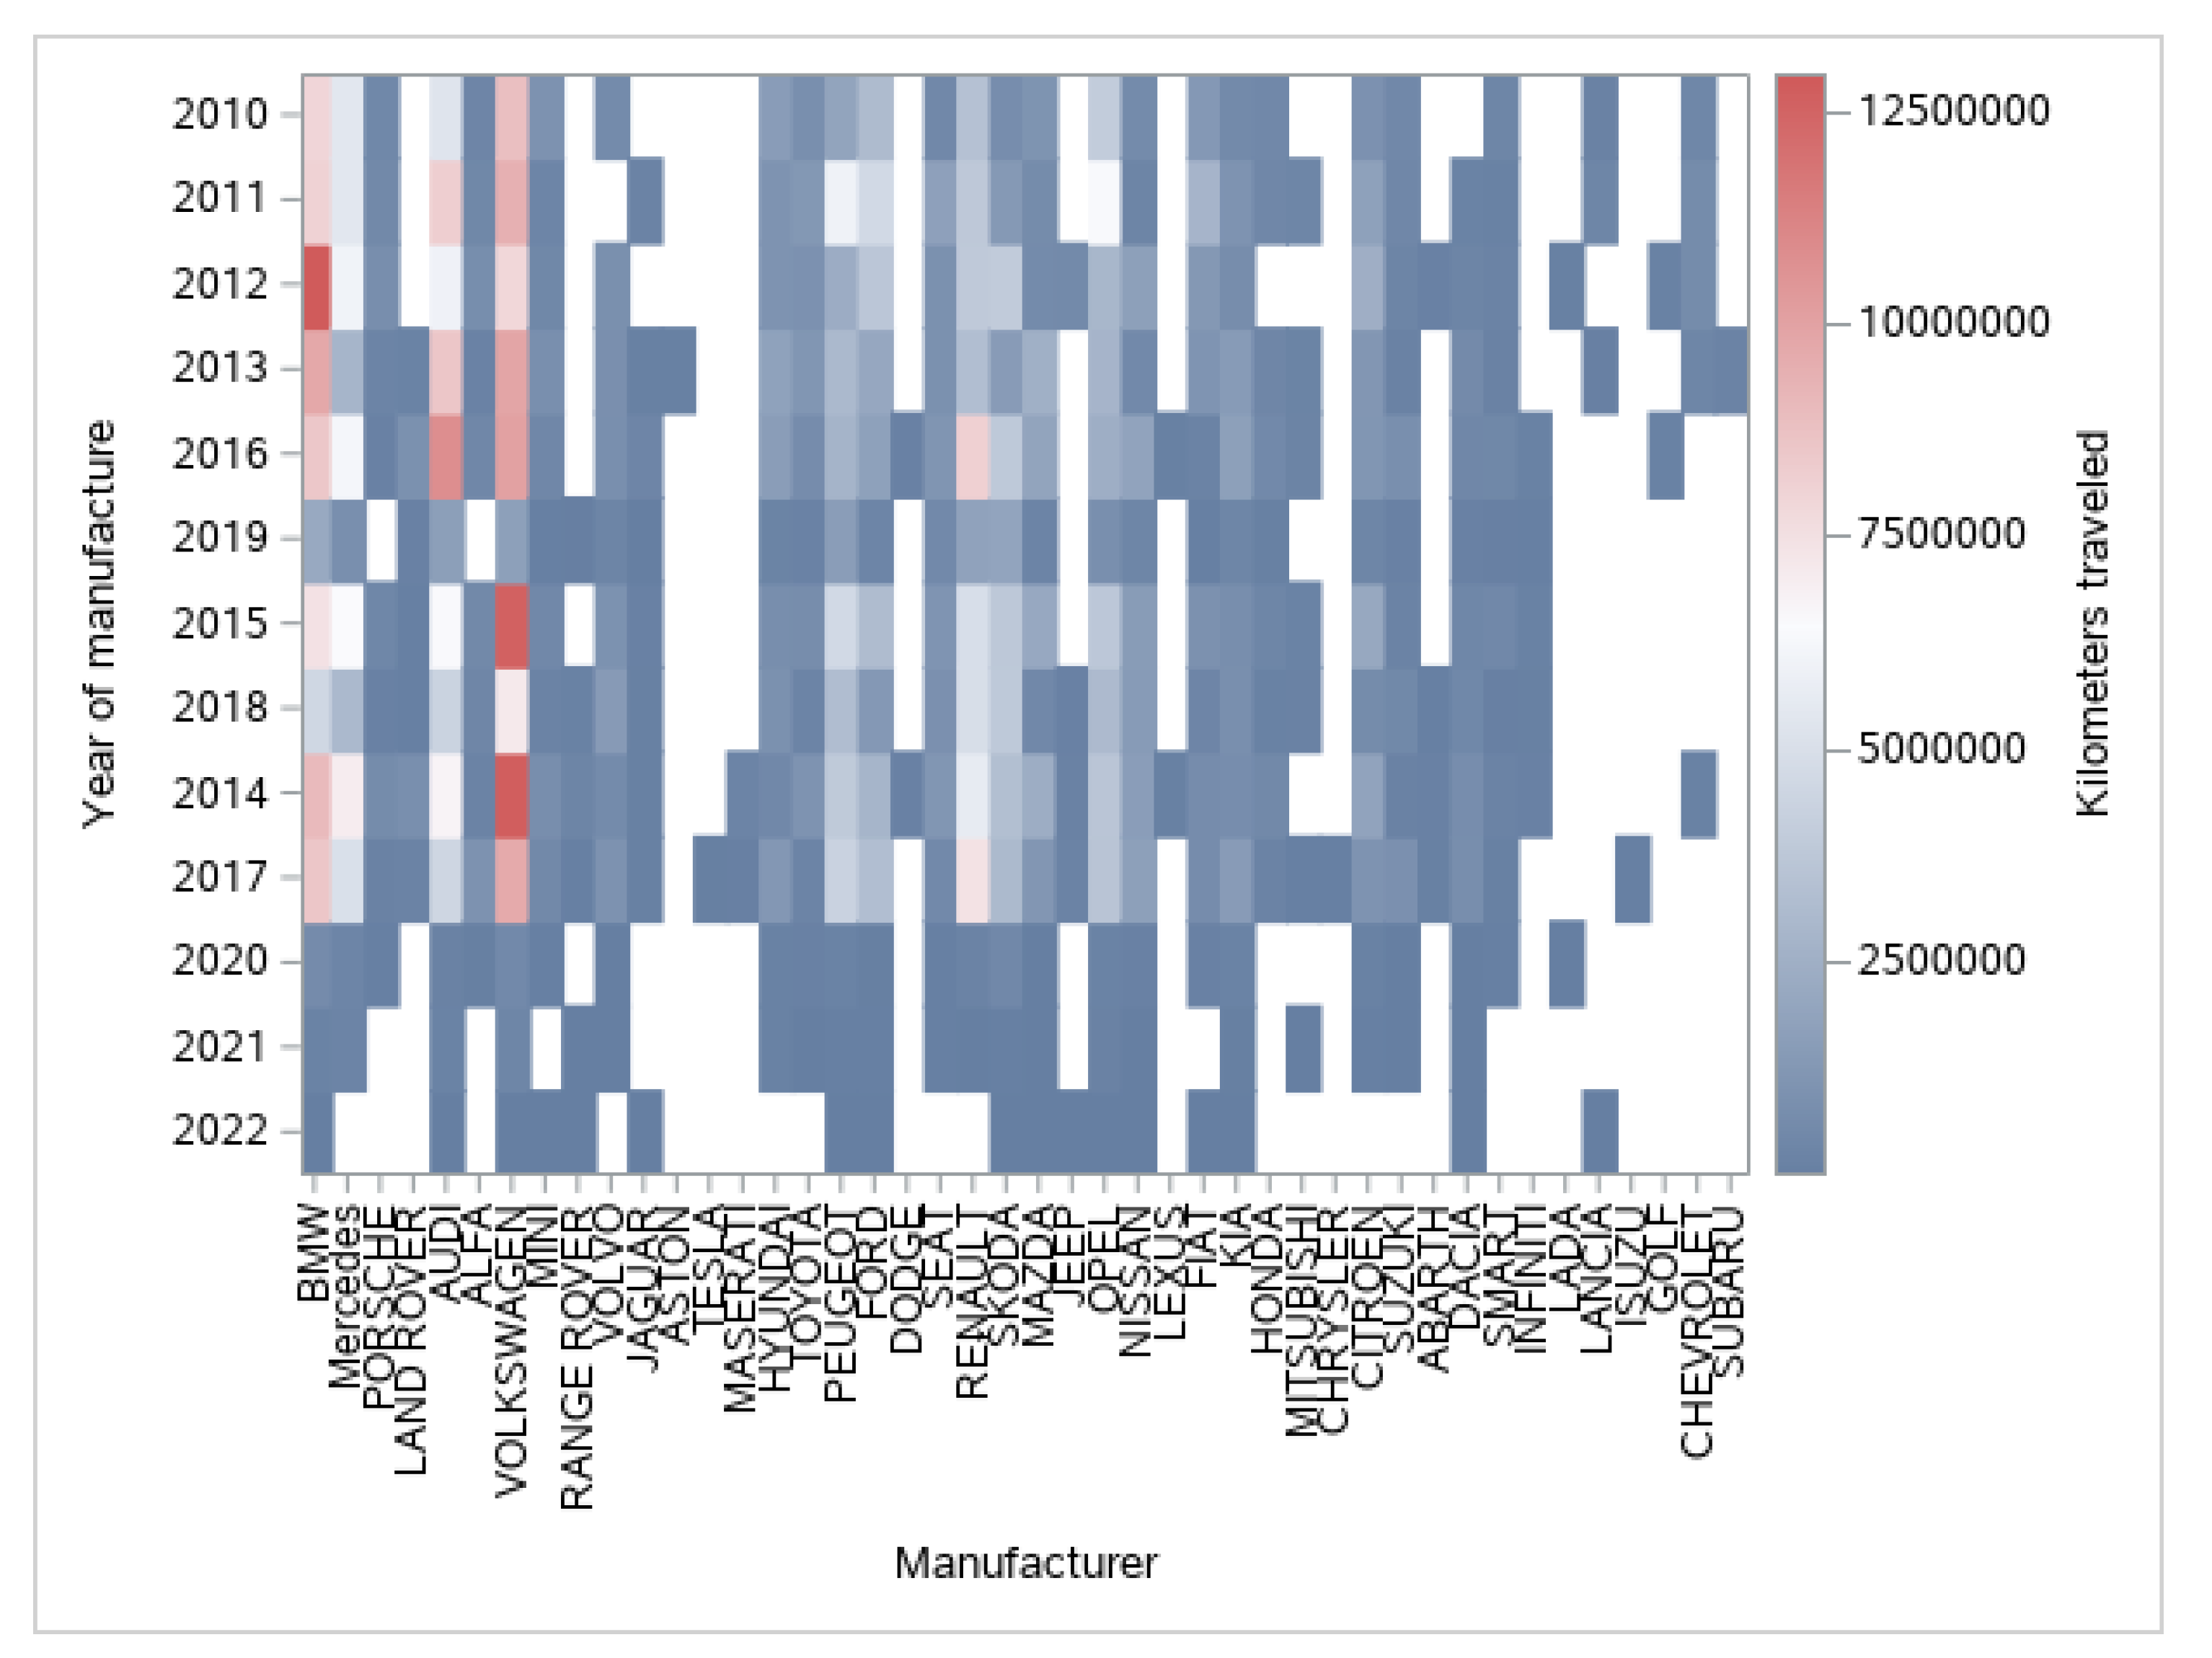
By kilometers traveled: Mercedes-Benz, BMW, Škoda, Volkswagen.
According to the number of vehicles and the price, the data according to the manufacturer are expected. As for the kilometers traveled, there is a special emphasis on the manufacturer Škoda, because the vehicles maintain a constant acceptable price and their service life exceeds the vehicles that are in the price class above (Mercedes-Benz, BMW and Volkswagen).
At any time in the independent variable X, the values must be fairly close to the line and evenly distributed with only few outliers. A histogram of the residuals (errors) in the model can be used to check whether the values are normally distributed. If the residuals are distributed around zero, as can be seen in Figure 9, this means that the model’s prediction is not random [27]. Another method to check is to make a graph of the prediction in relation to the residuals and determine whether the points are evenly distributed around the axis [28].
In Figure 10, shades of red show the vehicle manufacturer that has the highest price regarding the year of production and kilometers traveled. If it is distributed for each observed year, the following manufacturers had the highest price in terms of kilometers traveled and age:
-
2010 Volkswagen;
-
2011–2013 BMW;
-
2014 Volkswagen;
-
2015 Audi;
-
2016 Audi and Mercedes-Benz;
-
2017–2018 BMW;
-
2019 BMW, Audi, and Mercedes-Benz;
-
2020 Porsche and BMW;
-
2021 Mercedes-Benz;
-
2022 BMW (according to available data for half of the year).
The average median value of the entire set of data in paired profiles is a used vehicle with 133,000 km traveled that is priced just under EUR 10,000. Another graphic representation that shows the distribution of model parameters is the Q-Q plot in Figure 11, and with such representation, it can be concluded that the data do not behave according to a normal distribution, but according to a regression model.

2.3. Processing and Analysis of the Second Data Set

In order to show the trend of price movements, and to predict the results of the change in the situation in the used-vehicle market, the second set of data was extracted 3 months after the previously analyzed set. This set also does not show vehicles older than 2010, and the number of vehicles is 4322 after removing two outliers that reach a price above EUR 232,000. Although the time gap is only 3 months, the changes in the sets are visible, so the average price of used vehicles increased by EUR 1,391 per vehicle. On the other hand, average kilometers traveled decreased by 8,060 km, which justifies the increase in prices. The following Table 2 lists the attributes for the second set of data and compares them with the first set. The increases are also visible in Figure 12, where the percentage of vehicles in the lower price range is 5% lower and the distribution of kilometers traveled is skewed towards smaller values.

3. Model Prediction by Linear Regression

The behavior prediction of the variables in relation to the dependent variable of the vehicle price is shown and trained through all regression models (train–regression—all linear). The parameters are inserted into the regression learner model and the validation is grouped into five classes (five-fold cross-validation). The first iteration uses the first class (fold validation) to test the model, while the remaining classes are used to train the model. The second iteration uses the second overlay as the test set and the remaining classes as the training set. This process is repeated until each of the five classes is used as a test set. This method enables the automatic learning of all regressors, and the choice of the best solution is based on the smallest mean square error (RMSE—root mean square error) or mean absolute error (MAE—mean absolute error) [29]. Linear regression is a commonly used machine learning and statistical algorithm for predictive analysis. In that way, linear regression shows the relationship between a single dependent variable and how it changes according to multiple independent variables [30]. Decision tree is a supervised machine learning technique that builds a regression or classification model. It uses a tree-like structure where leaf nodes are outcomes. All other nodes except leaf nodes are called decision nodes, where further division is performed depending on categorical questions (true/false). The goal of a decision tree is to create a model that can be used to predict the value of a target variable by learning simple decision rules from the loaded data. Random forest is a learning method that uses multiple decision trees to create a classification or regression model. A random forest consists of a large number of decision trees working together. Each individual tree predicts the value of the target class, and their predictions are combined to produce an even more accurate prediction. Random forest is a supervised machine learning algorithm that can solve classification and regression problems. It is the most widely used algorithm that comes under supervised learning, and it is based upon the concept of ensemble learning [4]. An additional method for validating the trained data, support vector machines (SVM), is used to predict the price of used cars with higher accuracy than regression models, such as multiple and multivariate regression [31]. The best R 2 score and RMSE by regressors are listed in the following Table 3.
According to the trained data, Figure 13 shows the results of a significant drop in prices, partly due to the increase in kilometers driven and the age of the vehicle. Therefore, the response variable is the predicted vehicle price, while the explanatory variable is kilometers traveled per observation. Predictions would be more accurate if the variables, such as drive type, vehicle condition, horsepower, number of doors, and car weight were also included for used vehicles. Considering the state of the market, inflation, the lack of materials for the production of new vehicles, the reduced number of available used vehicles, and the instability of the price of gas products, the prices of vehicles will certainly increase.
When it is assumed that a strong rise in prices will condition further price movements, the actual and predicted situation can be compared if it is assumed that prices will rise linearly in the next period, which can be seen in Figure 14.
With SVM, the predicted price for every observation has a decreasing predicted value, which can be seen from Figure 15, where blue observations are the actual selling prices and yellow are the predicted prices for every model of the vehicle. For further research and newer data sets, using the variance inflation factor (VIF) is proposed, which quantifies how much the variance is inflated due to the collinearity of regressor matrix columns. Iteration entry in the output vector is the variance inflation factor for the i th predictor, which indicates how much the variance of the i th predictor is inflated due to collinearity [32].

4. Discussion

In this paper, a model was trained with two data sets of used cars for the price prediction and classification of vehicles from the online retail web page “Njuškalo”. Various statistical tools were used to analyze the data set, including the SAS program for parameter explanation and correlation, and Matlab Regression Learner for training. The effectiveness of regression analysis results always relies on the various conditions related to the nature of the data features that we enter into the model.
Therefore, it is necessary to check in advance whether the regression assumptions are violated before making any decision about the usefulness of the regression model. The most common regression assumptions that are not resistant to violation are [31]:
-
No multicollinearity: predictor variables are not highly correlated with each other.
-
Linearity: there must be a linear relationship between the predictor variables and the target variable (vehicle price and kilometers traveled).
-
Normality: the residuals of the model follow a normal distribution (Figure 9).
-
Homoscedasticity: this assumes that the errors are constant across the values of the independent variables (Figure 16).
The initial results show a drop in vehicle prices with respect to the trained parameters and a prediction accuracy of 21.9%, which confirms other works predicting the prices of used vehicles in European countries. It is important to note that the mentioned works and trained data are in the period of stability of the market supply of energy products. Prediction accuracy increases with training the model with the second data set, where price growth is predicted by linear regression with a prediction accuracy of 95%. The proposed model was also validated with the 5- and 10-cross-fold validation method. The experimental analysis shows that the proposed model is incorporated as an already optimized model, and with all the regressors used, an increase in prices and a decrease in the value of kilometers traveled are predicted, regardless of the year of production. The average value of the data set is a personal vehicle with 130,000 km traveled and a price of EUR 10,000. To compute the price for vehicles, there are platforms that can compute a linear regression model that defines a set of input variables. However, it does not give details as what features can be used for specific types of vehicles for such predictions. In this study, important features for predicting the price of used cars were taken into consideration when describing the actual state of the Croatian second-hand vehicle market. The authors in [12] use the Kaggle data set to perform the price prediction of a used car. The author evaluates the performance of several classification methods (logistic regression, SVM, decision tree, Extra Trees, AdaBoost, random forest) to assess the performance. Among all these models, the random forest classifier proves to perform the best for the prediction task. This work uses five features (brand, power, kilometer, selling Time, vehicle age) to perform the classification task after the removal of irrelevant features and outliers from the data set, which gives an accuracy of 83.08% on the test data. However, the difference lies in the inclusion of a few more relevant features in the prediction model, such as the price of the car and vehicle type. These two features play an important role in predicting the price of a used car, which seems to be given less importance in their research. In addition to this, the range of features, including year of registration, power, and price, seems to be narrowed down, meaning the test data set gives less accuracy. Therefore, the item quality score and the forecasted minimum and maximum prices are combined to provide the item’s final predicted price. Using a data set taken from a website for second-hand vehicles, the proposed method of combining the predicted car quality score with the forecasted minimum and maximum price outperforms the other models in all of the used accuracy metrics with a significant performance gap.

5. Conclusions

The price prediction of second-hand items has not been widely addressed, which was the main motivation for this research, as various sellers generate the price of the vehicle mainly by the manufacturer brand. Only a few studies have addressed the price prediction of used products in a specific domain, specifically, the price prediction of second-hand cars [1,12]. In this paper, the proposed approach uses exploratory data analysis along with features extracted from actual and historical attributes to predict the future behavior of the used-cars market. The prediction model uses supervised machine learning techniques and validation methods regarding statistical outputs.
To summarize,
  • Data were collected from an online seller of used cars and important features were identified that reflect the price;
  • Non-available values and entries were removed, and we discarded features not relevant for the prediction of the price;
  • Supervised ML techniques applied in first data set and validation was compared with the price prediction outputs of the second data set regarding important features;
  • The predicted model has the highest accuracy with linear regression where main features (price and model) are available.
This is performed by considering different types of vehicles, their usage condition, and prices. Furthermore, different techniques for numeric data pre-processing as well as text analysis for handling the unstructured data are considered. The competitive advantage of second-hand market trend prediction achieved by data mining and analysis includes the optimal price for the vehicle observations, avoiding misclassification and risks along with improving the customer’s awareness of the market, leading to accurate buying decisions. Future research will apply additional data sets extracted over the next two quarters, using data mining, machine learning techniques, and model validation with different methods for optimization. For this, it is necessary to extract additional variables related to the condition of the vehicle and the drive type. The increased interest in used vehicles can change the perception of vehicle valuation and price prediction; furthermore, the application machine learning methods have a great influence for various applications. Likewise, one of the important aspects of car ownership is the shift of the automotive industry toward electric vehicle (EV) production. The automotive sector is the main employer in Europe, directly employing more than 2.8 million people. However, little is known about the effects that this structural transformation of the automotive industry will have on vehicle markets and the labor market, especially in the area of information and communication technology. The growing influence of the electric vehicle market is also present on Njuškalo webpage, where in the first set of data there are over 1100 such passenger vehicles, and after a three-month period, that number is 317 available electric vehicles for sale, which shows the expanding amount of sold EVs. A framework for analyzing vehicle market trends using digital data needs to be developed and applied to the case of the electric vehicle industry because of the different features that generate the price, which is initially higher than for conventional vehicles. Furthermore, the locations and number of available charging stations in Croatia are currently limited.

Author Contributions

Conceptualization, L.B.; methodology, L.B.; software, L.B., B.A. and T.F.; validation, L.B.; formal analysis, L.B. and J.P.Š.; investigation, L.B.; resources, L.B.; data curation, L.B.; writing—original draft preparation, L.B.; writing—review and editing, B.A.; visualization, L.B.; supervision, J.P.Š. and T.F. All authors have read and agreed to the published version of the manuscript.

Funding

This research received no external funding.

Data Availability Statement

Data supporting reported results can be found on https://github.com/Bookwa/Used_Vehicles_HR (accessed on 30 May 2022).

Acknowledgments

Special thanks to Jure Aleksić for their assistance in data acquisition and technical support in this study.

Conflicts of Interest

The authors declare no conflict of interest.

Abbreviations

The following abbreviations are used in this manuscript:
VRAVehicle Remarketing Association
CNNConvolutional Neural Network
SVRSupport Vector Regressor
NNNeural Network
ANNArtificial Neural Networks
FLSFuzzy Logic Systems
EAEvolutionary Algorithms
BPNNBack-Propagation Neural Network
ANFISAdaptive Neuro-Fuzzy Inference System
MLMachine Learning
SVMSupport Vector Machines
RMSERoot Mean Square Error
MAEMean Absolute Error
EVElectric Vehicles

References

  1. Fathalla, A.; Salah, A.; Li, K.; Li, K.; Francesco, P. Deep end-to-end learning for price prediction of second-hand items. Knowl. Inf. Syst. 2020, 62, 4541–4568. [Google Scholar] [CrossRef]
  2. de Prez, M. Used car market to soften in second-half of 2022. General News, 31 May 2022. [Google Scholar]
  3. Statistics. Vehicle Center Croatia. Centar za vozila Hrvatske—Statistika, 2022. Available online: https://cvh.hr/gradani/tehnicki-pregled/statistika/ (accessed on 30 May 2022).
  4. Noor, K.; Jan, S. Vehicle Price Prediction System using Machine Learning Techniques. Int. J. Comput. Appl. 2017, 167, 27–31. [Google Scholar] [CrossRef]
  5. Yang, R.R.; Chen, S.; Chou, E. AI Blue Book: Vehicle Price Prediction Using Visual Features. arXiv 2018, arXiv:1803.11227. [Google Scholar]
  6. Khedr, A.E.; S.E.Salama.; Yaseen, N. Predicting Stock Market Behavior using Data Mining Technique and News Sentiment Analysis. Int. J. Intell. Syst. Appl. 2017, 9, 22–30. [Google Scholar] [CrossRef]
  7. Shastri, M.; Roy, S.; Mittal, M. Stock Price Prediction using Artificial Neural Model: An Application of Big Data. ICST Trans. Scalable Inf. Syst. 2018, 19, 156085. [Google Scholar] [CrossRef] [Green Version]
  8. Kalaiselvi, N.; Aravind, K.; Balaguru, S.; Vijayaragul, V. Retail price analytics using backpropogation neural network and sentimental analysis. In Proceedings of the 2017 Fourth International Conference on Signal Processing, Communication and Networking (ICSCN), Chennai, India, 16–18 March 2017; pp. 1–6. [Google Scholar]
  9. Ahmed, E.; Moustafa, M. House price estimation from visual and textual features. arXiv 2016, arXiv:1609.08399. [Google Scholar]
  10. Naumov, V.; Banet, K. Using Clustering Algorithms to Identify Recreational Trips within a Bike-Sharing System. In Reliability and Statistics in Transportation and Communication; Springer: Cham, Switzerland, 2020. [Google Scholar] [CrossRef]
  11. Banet, K.; Naumov, V.; Kucharski, R. Using city-bike stopovers to reveal spatial patterns of urban attractiveness. Curr. Issues Tour. 2022, 25, 2887–2904. [Google Scholar] [CrossRef]
  12. Pal, N.; Arora, P.; Sundararaman, D.; Kohli, P.; Palakurthy, S.S. How much is my car worth? A methodology for predicting used cars prices using Random Forest. arXiv 2017, arXiv:1711.06970. [Google Scholar]
  13. Chen, C.; Hao, L.; Xu, C. Comparative analysis of used car price evaluation models. AIP Conf. Proc. 2017, 1839, 020165. [Google Scholar] [CrossRef] [Green Version]
  14. Moayedi, H.; Mehrabi, M.; Mosallanezhad, M.; Rashid, A.S.A.; Pradhan, B. Modification of landslide susceptibility mapping using optimized PSO-ANN technique. Eng. Comput. 2019, 35, 967–984. [Google Scholar] [CrossRef]
  15. Nilashi, M.; Cavallaro, F.; Mardani, A.; Zavadskas, E.; Samad, S.; Ibrahim, O. Measuring Country Sustainability Performance Using Ensembles of Neuro-Fuzzy Technique. Sustainability 2018, 10, 2707. [Google Scholar] [CrossRef] [Green Version]
  16. Dreżewski, R.; Dziuban, G.; Pająk, K. The Bio-Inspired Optimization of Trading Strategies and Its Impact on the Efficient Market Hypothesis and Sustainable Development Strategies. Sustainability 2018, 10, 1460. [Google Scholar] [CrossRef]
  17. Wu, J.D.; Hsu, C.C.; Chen, H.C. An expert system of price forecasting for used cars using adaptive neuro-fuzzy inference. Expert Syst. Appl. 2009, 36, 7809–7817. [Google Scholar] [CrossRef]
  18. Zhou, X. The usage of artificial intelligence in the commodity house price evaluation model. J. Ambient. Intell. Humaniz. Comput. 2020, 11. [Google Scholar] [CrossRef]
  19. Liu, E.; Li, J.; Zheng, A.; Liu, H.; Jiang, T. Research on the Prediction Model of the Used Car Price in View of the PSO-GRA-BP Neural Network. Sustainability 2022, 14, 8993. [Google Scholar] [CrossRef]
  20. Samruddhi, K.; Kumar, R.A. Used Car Price Prediction using K-Nearest Neighbor Based Model. Int. J. Innov. Res. Appl. Sci. Eng. 2020, 4, 629–632. [Google Scholar] [CrossRef]
  21. Njuskalo.hr. 2022. Available online: https://www.njuskalo.hr/auti (accessed on 30 May 2022).
  22. Botvinick, M.; Ritter, S.; Wang, J.X.; Kurth-Nelson, Z.; Blundell, C.; Hassabis, D. Reinforcement Learning, Fast and Slow. Trends Cogn. Sci. 2019, 23, 408–422. [Google Scholar] [CrossRef] [Green Version]
  23. Singh, A.; Thakur, N.; Sharma, A. A review of supervised machine learning algorithms. In Proceedings of the 2016 3rd International Conference on Computing for Sustainable Global Development (INDIACom), New Delhi, India, 16–18 March 2016; pp. 1310–1315. [Google Scholar]
  24. AlShared, A. Used Cars Price Prediction and Valuation using Data Mining Techniques. Master’s Thesis, Rochester Institute of Technology, Rochester, NY, USA, 2021. [Google Scholar]
  25. Haijiao, J.; Jiancheng, L.; Wei, Y.; Chunyong, W.; Zhenhua, L. Theoretical distribution of range data obtained by laser radar and its applications. Opt. Laser Technol. 2013, 45, 278–284. [Google Scholar] [CrossRef]
  26. Siva, R.; Adimoolam, M. Linear Regression Algorithm Based Price Prediction of Car and Accuracy Comparison with Support Vector Machine Algorithm. ECS Trans. 2022, 107, 12953–12964. [Google Scholar] [CrossRef]
  27. Pudaruth, S. Predicting the Price of Used Cars using Machine Learning Techniques. Int. J. Inf. Comput. Technol. 2014, 4, 753–764. [Google Scholar]
  28. Monburinon, N.; Chertchom, P.; Kaewkiriya, T.; Rungpheung, S.; Buya, S.; Boonpou, P. Prediction of prices for used car by using regression models. In Proceedings of the 2018 5th International Conference on Business and Industrial Research (ICBIR), Bangkok, Thailand, 17–18 May 2018; pp. 115–119. [Google Scholar] [CrossRef]
  29. Bharambe, P.P.; Bagul, B.; Dandekar, S.; Ingle, P. Used Car Price Prediction using Different Machine Learning Algorithms. Int. J. Res. Appl. Sci. Eng. Technol. 2022, 10, 773–778. [Google Scholar] [CrossRef]
  30. Puteri, C.K.; Safitri, L.N. Analysis of linear regression on used car sales in Indonesia. J. Phys. Conf. Ser. 2020, 1469, 012143. [Google Scholar] [CrossRef]
  31. Hankar, M.; Birjali, M.; Beni-Hssane, A. Used Car Price Prediction using Machine Learning: A Case Study. In Proceedings of the 2022 11th International Symposium on Signal, Image, Video and Communications (ISIVC), El Jadida, Morocco, 18–20 May 2022; pp. 1–4. [Google Scholar] [CrossRef]
  32. Miles, J. Tolerance and Variance Inflation Factor. In Book section: Wiley Statistics Reference Online; John Wiley & Sons: New York, NY, USA, 2015; ISBN 9781118445112. [Google Scholar] [CrossRef]
Figure 1. Number of new and used sold vehicles in the Republic of Croatia.
Sustainability 14 17034 g001
Figure 2. Flow diagram of the proposed methodology.
Sustainability 14 17034 g002
Figure 3. The relationship between the price of the vehicle and the kilometers traveled.
Sustainability 14 17034 g003
Figure 4. Distribution of the number of vehicles in the data set classified by the manufacturer.
Sustainability 14 17034 g004
Figure 5. Distribution of the vehicle share by kilometers traveled and price.
Sustainability 14 17034 g005
Figure 6. Vehicle classification by the manufacturer.
Sustainability 14 17034 g006
Figure 7. Box plot of the vehicle price according to the manufacturer.
Sustainability 14 17034 g007
Figure 8. Box plot of kilometers traveled by manufacturer.
Sustainability 14 17034 g008
Figure 9. Distribution of difference between the kilometers traveled and the price of the vehicle.
Sustainability 14 17034 g009
Figure 10. Heatmap of all parameters grouped by manufacturer.
Sustainability 14 17034 g010
Figure 11. Matched values and difference of price and kilometers traveled.
Sustainability 14 17034 g011
Figure 12. Distribution of the vehicle share by kilometers traveled and price.
Sustainability 14 17034 g012
Figure 13. Prediction of vehicle price using decision tree regressors.
Sustainability 14 17034 g013
Figure 14. The relationship between the predicted price movement and the actual price of the vehicles.
Sustainability 14 17034 g014
Figure 15. Predicted vehicle prices according to the number of observations using SVM (support vector machines).
Sustainability 14 17034 g015
Figure 16. Graph of the residuals of the data set according to the year of production and the number of observations.
Sustainability 14 17034 g016
Table 1. Overview of data set attributes.
AttributeMinMaxAverage
Price [EUR]1000232,00017,490.72
Km traveled1515,000133,622.5
Numbers of vehicles in the data set—4388. Number of different manufacturers—44.
Table 2. Overview of second data set attributes.
AttributeMinMaxAverage
Price [EUR]1500232,00018,882.5
Km traveled1375,000125,562.3
Numbers of vehicles in the data set—4322.
Table 3. Regression analysis validation results.
Model R 2 ValueRMSEMAE
Linear regression0.952104.71373.2
Random forest0.2414,6277946.5
SVM0.599173.95950.2
Publisher’s Note: MDPI stays neutral with regard to jurisdictional claims in published maps and institutional affiliations.

