Abstract
Recognizing regional economic resilience and its influencing factors under different shocks is necessary to promote stable regional economic development. The article analyzes the regional economic resilience of 31 Chinese provinces under three kinds of shocks, namely, financial crisis, economic downturn, and COVID-19, in terms of the resistance of regional economies to shocks, and examines spatial distribution and main influencing factors. The results of the study found that: (1) The characteristics of regional economic resilience under different shocks are different. During the financial crisis, the strong resilient provinces are distributed in the central and western and northern regions; during the economic downturn, the strong resilient provinces are mainly distributed in the western and central regions; during COVID-19, the strong resilient provinces are mainly distributed in the western and eastern coastal regions. The economic resilience of each province shows significant “high-high” and “low-low” spatial clustering characteristics during the economic downturn and the COVID-19. (2) The main influencing factors of economic resilience in different shocks are different. In the financial crisis, the magnitude of the contribution of the influencing factor is leading industry (0.283) > related diversity (0.197) > foreign trade dependence (0.190); during the economic downturn, the magnitude of the contribution of the influencing factor is population density (0.464) > leading industry (0.427) > related diversity (0.285); the magnitude of the contribution of the impact factor during the COVID-19 was related diversity (0.282) > unrelated diversity (0.274) > leading industry (0.272). (3) In the interaction of impact factors, the strongest explanatory power is found in related diversity, unrelated diversity, and leading industries, which represent the industrial structure. Therefore, there is a need to adjust the industrial structure and improve the regional economic resilience from the shock itself.
1. Introduction
Since the new century, China’s economy has developed steadily and maintained steady growth. While the economy is developing steadily, it is also facing various shocks such as financial crisis, natural disasters, economic downturn, changing international situation and unexpected public events, etc. These shocks have caused serious negative impacts on regional economic development in various provinces in China, and the magnitude of their impacts varies. Against this background, regional economic resilience, which measures the quality of regional economic development, has come into being. Studies have focused on the economic resilience under the same kind of shocks; however, does the economic resilience of different regions vary under different shocks? Are the influencing factors the same? It is also worthwhile to conduct an in-depth study.
Toughness (resilience) was first applied to the physical discipline to indicate the ability of a system or an individual to recover from a shock or perturbation. The definition of resilience varies from one research area to another. Early studies of “engineering resilience” focused on the stability of a system, mainly as a system approaching equilibrium or steady state [1], while “ecological resilience” refers to the ability of a system to move from one possible steady-state path to another without changing its structure, function, or properties [2,3]. There is also evolutionary resilience, which emphasizes the balance between adaptive states and adaptive capacity through the restructuring of the economy, which is essentially adaptive [4]. As the field of research expands and the depth of research deepens, the concept of resilience slowly penetrates into the economic field. Some regions are able to recover quickly to their original development trends under the impact of economic crisis, while some regions even generate new development paths that exceed their original development trends, and some others decline as a result. Different regions differ in their ability to withstand shocks and their ability to recover, adapt, and innovate after shocks, and this difference is regional economic resilience [5]. Purwandari considers a city to be economically resilient when it does not fall into adverse conditions when faced with a major economic shock [6]. Hu et al. explored the relationship between maintaining the original economic growth path and exploring new economic growth paths after a shock to the economic system and the different impacts caused by their evolution, arguing that regional resilience refers to the complementary, symbiotic, and locally grounded relationship between adaptation and resilience [7]. In this view, the definition of regional economic resilience differs by perspective.
There are two main approaches to measure regional economic resilience: the indicator system approach and the construction of a regional economic resilience index. The indicator system method is to construct a regional economic resilience assessment system and synthesize a regional economic resilience index to measure the economic resilience of different regions. Cutter et al. [8] in 2008 developed a resilience assessment indicator system from six dimensions: social, economic, institutional, infrastructure, ecological, and community. In 2014, Cutter further proposed a baseline indicator of community resilience (BRIC), using public data from government or research institutions to measure the resilience of different regions in the United States in six dimensions: social, economic, community, organizational, infrastructure, and environmental [9]. Huang et al. [10] drew on the resilience baseline model proposed by Cutter and combined it with the actual situation in China to construct a provincial level covering five dimensions: economic resilience, social resilience, environmental resilience, infrastructure resilience, and organizational resilience. Artiom et al. [11] proposed an innovative approach to measure economic resilience at the sectoral level, analyzing the resilience of the Lithuanian agricultural sector by constructing a system of indicators for affordable food products, farm viability, employment, and income. Sharma et al. [12]. constructed a resilience-based framework to outline four salient factors of resilience in the tourism sector: government response, technological innovation, local belonging, and consumer and employee confidence. The construction of a regional economic resilience index reflects is expressed by choosing the change in a core variable in the face of a shock perturbation [13]; Martin in his 2012 study uses a sensitivity indicator to measure the regional economic resilience of the UK based on the change in employment during the economic crisis [5], and Martin in his 2019 study calculates the economic resilience of the UK based on the change in the value added of output between the contractionary period and the resilience and recovery resilience during the expansionary period [14]. Giannakis et al. [15] use input–output models with deviation–share analysis to explore the economic resilience of the Greek region in response to the crisis. Fingleton et al. [16] use employment rate as a measure of resilience to study the resistance and correlation of economic resilience under employment shocks.
In studies of the factors influencing regional economic resilience, industrial structure is considered the most important determinant of regional economic resilience [4]. Frenken [17] classifies industrial structure diversity into related diversity and unrelated diversity, when multiple industries with strong economic and technological ties are clustered in space, and when multiple industries with no obvious economic and technological ties are clustered and distributed in space. He argues that related diversity can increase regional employment and economic growth through Jacobs’ externality, and unrelated diversity can stabilize regional economic development by suppressing the growth of unemployment under shocks through the portfolio effect. The emergence of this study provides new ideas on the impact of industrial diversity on regional economic resilience. Aarstad [18] argues that unrelated diversity is a negative driver of firm productivity, with no significant effect on increasing innovation, but unrelated diversity can support rare breakthrough innovations, while related diversity has no such effect [19]. In a study of industrial specialization and regional economic resilience Mratini argues that industrial specialization within a region has no direct relationship to economic resilience [20], while service sector specialization negatively affects regional economic resilience [21].
As research progresses, more and more scholars are adding “soft variables” such as responsive society, policy, culture, and innovation networks to the list of factors influencing economic resilience. Pendall and Hauser [22,23] argue that the potential vulnerability of individuals or households, unstable urban residential housing living environments, and cognitive coherence in social networks are closely related to regional economic resilience. Whitley, Swanstorm, et al. argue that the impact of government intervention on economic resilience is twofold; overly entrenched institutions can impede economic transformation and industrial restructuring, and a strong government can have a largely positive effect in coping with shocks and promoting industrial upgrading [24,25]. The choices of local actors such as governments and universities are critical to regional resilience [26]. Magro explores the association between industrial and innovation policies and the resistance and resilience of regional economic resilience [27], and Žičkienè examines the impact of direct payment policies on the economic resilience of the agricultural sector [28]. For cultural factors, an open and diverse socio-cultural atmosphere is conducive to resilience to economic shocks [29,30]. Rosca argues that innovations in urban governance can contribute to economic resilience [31], and Shutters explores the economic resilience of different structures by creating an urban economic network using interdependent industrial sectors and comparing structural changes in that network with economic changes [32].
Most of the existing literature is mainly theoretical and focuses on the measurement of regional economic resilience and the influencing factors under the global financial crisis shock in 2008–2009 [33], and the research on the economic resilience of different regions under different shocks is relatively scarce. In this paper, by studying the economic resistance capacity as regional economic resilience under three different shocks faced by China’s economic development, we aim to find that 31 Chinese provinces show spatial differences in economic resilience in response to different shocks, and mainly analyze the factors influencing regional economic resilience, clarify the influence mechanism of regional economic resilience, and provide a reference basis for the development of regional economic resilience.
2. Research Methodology and Data Sources
2.1. Research Methodology
2.1.1. Measurement of Economic Resilience
The core indicator method was used. Drawing on Martin with the measurement of economic resilience [5,14], the sensitivity index is used to measure the regional economic resilience and study the difference between the economic resistance of provinces and the national economic resistance. GDP, as one of the important indicators in the economic accounting system, can visually reflect the trend of economic changes, so this paper uses GDP to calculate regional economic resilience. The formula for calculating the regional economic resilience resistance is as follows:
where: is the economic resilience of the pth research object in year t; , are the GDP increase values of the research object p (province) at time t and t − k; , are the GDP increase values of the region (country) where the research object is located at time t, t − k.
When > 0, it means that the resistance ability of the study object p in the face of shocks is greater than the average level of the study region C, i.e., the economic resilience of object p is stronger; when < 0, it means that the resistance ability of the study object p in the face of shocks is less than the average level of the study region C, i.e., the economic resilience of object p is weaker.
2.1.2. Spatial Correlation Measurement of Economic Resilience
In order to better grasp the spatial correlation characteristics of regional economic resilience of Chinese provinces, it can be explored through exploratory spatial data analysis (ESDA), which can be divided into global spatial autocorrelation analysis and spatial local autocorrelation analysis, and the global Moran index is used to measure the overall trend of spatial correlation of economic resilience in the whole study area. The calculation formula is as follows [34,35].
where n is the number of provinces studied; and are the economic resilience of provinces i and j, respectively; Wij is the spatial weight matrix (1 for spatial adjacency and 0 for non-adjacency); represents the variance of economic resilience; and represents the mean of economic resilience.
The local Moran index, as a complement to the global Moran index, is used to measure the local spatial autocorrelation characteristics of the provinces in the study area. The calculation formula is as follows:
At a given significance level, > 0 indicates a positive spatial correlation between neighboring provinces, i.e., the strength of economic resilience is more similar between neighboring provinces; if < 0, it indicates a negative correlation between neighboring provinces, i.e., the strength of economic resilience differs between neighboring provinces.
2.1.3. Analysis Method of Influence Factors
Geodetector is a statistical method to detect spatial heterogeneity as well as to reveal its influencing factors. The core idea is that if the independent variable can have an important influencing effect on the dependent variable, then there is a similar spatial distribution between the independent variable and the dependent variable [36,37], and it can detect the spatial divergence and influence factors by avoiding the limitations in the traditional mathematical models. Its divergence and factor detection can detect the spatial divergence of the explanatory variable Y, as well as detect how much a factor, i.e., the explanatory variable X, explains the spatial divergence of the explanatory variable Y. In this paper, the factor detection and interaction in the Geodetector model are used to identify the influencing factors of economic resilience under different shocks. The calculation formula is as follows:
where: q is the influence factor explanatory capacity detection value, h = 1, 2..., L is the number of classifications; and N are the number of cells contained in the detection element and the number of cells in the whole region, respectively; and denote the variance of layer h and the whole region; q takes values in the range of [0, 1] and the larger q indicates the better explanatory ability of the influence factor on regional economic resilience.
2.2. Data Sources
This paper is based on 31 provinces in China, and due to the availability of data, this study does not include data from Hong Kong, Macao, and Taiwan. The study period is three time periods in 2007–2020, namely, for 2007–2009, 2011–2013, and 2018–2020. The data are mainly obtained from the China Statistical Yearbook 2007–2020 and the statistical yearbooks of provinces and cities. The following data are used to measure regional economic resilience and the factors influencing it:
- (a)
- Gross Domestic Product. A total of 288 observations, including 31 provinces as well as the national GDP, are brought into Equation (1) to calculate regional economic resilience.
- (b)
- Impact factor data. Related diversity and unrelated diversity are calculated based on Equations (6) and (8), with a total of 5301 observations, including the number of urban units employed at the end of the year in 19 industries in 31 provinces; the leading industries are calculated based on Equation (9), with a total of 2232 observations, including agriculture, forestry, animal husbandry and fishery, industry, construction, wholesale and retail trade, transportation, storage and postal service, accommodation and catering, finance, and real estate in 31 provinces.
3. Study Content and Results
3.1. Shock Division
Since the type and nature of each shock in the economic development process varies, identifying the characteristics and influencing factors of regional economic resilience under different shocks is important and missing in current research. Therefore, a classification of shock types is needed.
GDP is an important indicator of economic conditions, and the GDP growth rate is a dynamic indicator reflecting the degree of change in the level of economic development in a certain period and is also a basic indicator reflecting the dynamism of a country’s economy. Therefore, this paper adopts the peak method to divide China’s economic cycle from 2007 to 2020 with reference to GDP growth rate, so as to clarify various short-term shocks. From Figure 1, we can visually see that China’s economic development has experienced three relatively obvious short-term shocks. The first was the global financial crisis shock in 2008 (financial crisis), which hit the European and American economies hard and caused a significant decline in China’s foreign exports and economic growth. The second was the structural shock (economic downturn) in 2012, when China’s economic development was in urgent need of industrial transformation and economic structure optimization due to the complex international situation and the long-term path lock of domestic industrial development. Under the internal and external problems, China’s economy entered the growth rate shift period, transitioning from high-speed growth to medium-to-high-speed growth, and economic development slowed down. The third time was the social public safety shock (COVID-19), which caused China and other countries to come to a socio-economic standstill for a time and economic growth fell off a cliff due to the characteristics of the rapid outbreak and wide spread of COVID-19 [38,39,40,41]. Since the downturn economic pressure and COVID-19 are still not over, this paper selects three times cross-sections from 2007–2009, 2011–2013, and 2018–2020 to study the resistance of regional economies in the face of shocks as regional economic resilience.
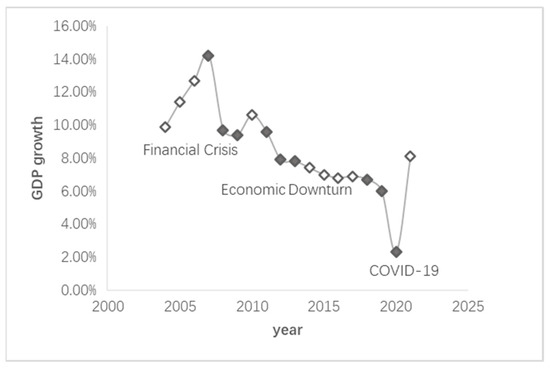
Figure 1.
Classification of economic shocks.
3.2. Analysis of Regional Economic Resilience Characteristics
The economic resilience of 31 Chinese provinces under three shocks is calculated based on Equation (1) under the GDP dimension, and the results are shown in Figure 2.
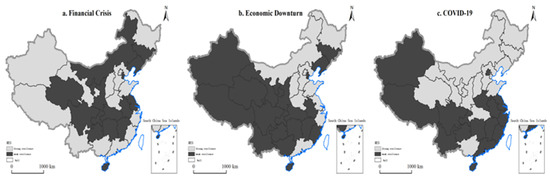
Figure 2.
Spatial divergence of economic resilience. Note: The map is based on the map with the review number GS (2019) 1698 down-loaded from the standard map service website of the Ministry of Natural Resources, and the base map is unmodified.
Figure 2 shows that there are significant differences in the resistance capacity of different regions to cope with shocks under different shocks. During the financial crisis, there are 16 provinces with economic resilience greater than zero, mainly in the central and western regions as well as the northern regions; there are 15 provinces with economic resilience less than zero, mainly in the coastal regions and north China, and the economic resilience is roughly distributed in the center-periphery in space, with a strong resistance in the center and a weak resistance in the periphery. Mainly due to the financial crisis on the development of China’s economy the main challenge is the decline in foreign demand, China’s exports fell sharply, resulting in a high degree of foreign trade dependence of the provinces being hit by a larger impact. In the economic downturn, there are 20 provinces with economic resistance capacity greater than zero, mainly in the western and central regions; there are 11 provinces and cities with economic resistance capacity less than zero, mainly in the northern and coastal regions. Due to the continued impact of the financial crisis, world economic development slowed down, and China’s economy entered a period of adjustment. The economic downward pressure has increased while introducing preferential policies for economic development in the central and western regions, making the central and western regions more resilient. During COVID-19, there were 17 provinces and cities with economic resistance greater than zero, mainly in the western and southwestern regions as well as the eastern coastal regions; there were 14 provinces and cities with economic resistance less than zero, mainly in the central and northern regions. Local governments have taken corresponding control measures to control the spread of the epidemic, which has seriously affected the development of the regional economy. For provinces and cities with stronger economies and that were less affected by the epidemic, the economic resistance is stronger.
From the values in Table 1, it can be seen that the global Moran index is positive in all three shocks, and the Moran index values are larger and tested significantly at a 1% significance level in the economic downturn and COVID-19. It indicates that the economic resilience of Chinese provinces and cities shows the clustering characteristics of strong resilient provinces and cities adjacent to strong resilient provinces and cities, and weak resilient provinces and cities adjacent to weak resilient provinces and cities.

Table 1.
Results of spatial correlation test of economic resilience.
This section may be divided into subheadings. It should provide a concise and precise description of the experimental results, their interpretation, as well as the experimental conclusions that can be drawn.
Further, the local spatial characteristics of China’s regional economic resilience are visualized by drawing Moran scatter plots using Stata. As shown in Figure 3. The slope of the trend line in the Moran scatter plot reflects the degree of spatial autocorrelation of the sample to a certain extent. During the financial crisis period (a), the slope of the trend line is smaller and the scatter distribution is more dispersed, indicating that the spatial clustering characteristics of economic resilience of provinces and cities are not obvious. During the economic downturn (b), the scatter points are mainly distributed in quadrants one and three, indicating that the economic resilience of each province and city shows a positive correlation. The first quadrant, including Yunnan, Sichuan, and Chongqing, shows a “high-high” clustering, which indicates that these provinces and cities are more resilient and positively influenced by neighboring provinces and cities, and their economic resilience shows a high level of spatial clustering. The third quadrant, including Shanxi, Hebei, Henan, etc., shows a “low-low” clustering, indicating that these provinces and cities are less resilient and negatively influenced by neighboring provinces and cities, and their economic resilience shows low spatial clustering characteristics. In the COVID-19 period (c), the scattered points are mainly distributed in the first and third quadrants, with the largest distribution in the first quadrant, indicating that most provinces and cities have “high-high” clustering, and economic resilience has a high level of spatial autocorrelation.
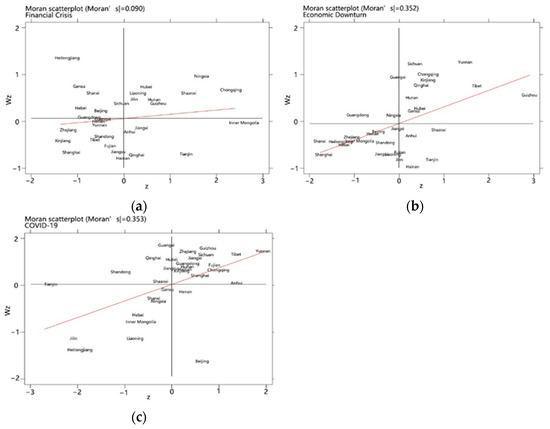
Figure 3.
Moran scatter plot of regional economic resilience.
3.3. Analysis of Regional Economic Resilience Influencing Factors
3.3.1. Selection of Influencing Factors
Regional economic resilience is determined by a variety of factors. These factors determine a region’s ability to resist, adapt, and recover [42]. There have been studies that commonly analyze economic resilience by economic development status and industrial structure [43,44,45,46]. In this paper, six variables, industry-related diversity (RV), industry-unrelated diversity (UV), leading industry (LI), foreign trade dependence (FTD), degree of innovation (DI), and population density (DP), are selected as influencing factors of regional economic resilience. Related diversity, unrelated diversity, and leading industry are derived from Equations (6), (8), and (9) (Table 2); foreign trade dependence is expressed by the value of import and export trade to total GDP; the degree of innovation is expressed by the number of patents per 10,000 people; and population density is expressed by the ratio of year-end population to the area of each province.
Table 2.
Related diversity, unrelated diversity, and leading industries.
3.3.2. Measurement of Influencing Factors
Industrial diversity is divided into related diversity and unrelated diversity. In the measurement of related diversity and un-related diversity, 19 types of industries are used as the sub-category sectors according to the China Statistical Yearbook, and the major sectors are divided into six categories of industries, namely, primary industry, secondary industry, production industry, consumption industry, distribution industry, and social service industry according to the International Standard Industrial Classification (ISIC). Due to the availability of data this paper uses output value to measure industrial diversity.
The calculation of the related diversity index (RV) and the un-related diversity index (UV) were based on Frenken who defined them [17].
The methodology provided in the concept of diversity. It is assumed that the small category sector i belongs to the large category sector Sk, where k = 1, 2, ..., K.
The share of urban large-class sectors in all industries is Pk and the share of small-class sectors in all industries is Pi, calculated as follows:
The related diversity (RV) can represent the entropy index of all subcategories of sectors under the broad category; is expressed as the entropy index of subcategories of sectors within the broad category:
The unrelated diversity (UV) Index can be expressed as an entropy index for the broad sectoral categories:
Regional leading industries need to choose industries that can give full play to their comparative advantages, and the size of the industry is an intuitive reflection of the comparative advantages of regional industries. In regional economics, location entropy is usually used to judge the scale of an industry [47]. In this paper, location entropy is used to evaluate the leading industries of provinces and cities. The locational entropy is calculated as follows:
where is the output value of industry j in the study object p; is the total output value of the study object p; is the total output value of industry j in the study region (country); and Y is the total output value of the study region (country). The larger the , the more obvious the comparative advantage of industry, and the more likely it is to become the leading industry.
3.3.3. Analysis of the Results of Influencing Factors
After reading literature related to the Geodetector model, it is known that the independent variable should be a type variable, and if the independent variable is a numerical, then the relevant data needs to be discretized first [48]. In this paper, related diversity, unrelated diversity, and leading industry are classified and processed by the natural interruption point grading method in ArcGIS software. Factor probes (Table 3) and interaction probes (Table 4) were conducted for each impact factor in the three shocks to investigate the explanatory power of different factors on China’s regional economic resilience.
Table 3.
Explanatory power of regional economic resilience impact factors.
Table 4.
Regional economic resilience impact factor interactions.
Analyzing the impact factors of regional economic resilience under three different shocks reveals that the explanatory power of leading industries on regional economic resilience is higher during the financial crisis. This is due to the fact that the financial crisis mainly affects the financial industry, export-oriented industries, and real estate industry, and has less impact on basic industries such as accommodation and catering, agriculture, forestry, and fishery. During the economic downturn, the leading industries and population density have stronger explanatory power for regional economic resilience. Due to the long period of the financial crisis and the strong after-effects, as well as China’s “four trillion” stimulus plan, which vigorously promotes the development of the infrastructure industry, the provinces with the construction industry as the leading industry have strong economic resilience. Related diversity, unrelated diversity, and leading industries are strong determinants of economic resilience during COVID-19. Related diversity and unrelated diversity represent the degree of concentration of industries with strong economic and technological ties in the region. Related diversity can accelerate recovery from industry-specific shocks because technological linkages between industries can enable laborers who lost their jobs in shocks to find new jobs [49], and regions with related diversity are better at reabsorbing unemployment than regions with unrelated diversity [50]. Regions with diversified industries are more resistant [51,52].
Most of the current studies on the influence factors on the spatially differentiated characteristics of regional economic resilience have considered only single-factor influences, rarely involving the interactions of different factors. Interaction detection using geographic probes analyses whether every two factors in the three shocks together change the explanatory power of Y or whether the effects of these influencing factors on Y are independent of each other [37] From Table 4, every two-factor interaction shows a two-factor enhancement i.e., q(X1∩X2) > Max(q(X1),q(X2)) versus a non-linear enhancement i.e., q(X1∩X2) > q(X1) + q(X2). This indicates that the explanatory power of any two influencing factors when acting together is greater than the explanatory power of individual factors, i.e., the influence of each influencing factor on the spatial divergence of China’s regional economic resilience is not isolated. Specifically, the interaction power of related diversity and leading industry (0.771) and of unrelated diversity and leading industry (0.771) are highest during the financial crisis; the interaction power of unrelated diversity and leading industry (0.750) is highest during the economic downturn, and the interaction power of related diversity and leading industry (0.737) is highest during COVID-19. Therefore, the factors that play a strong interaction under the three shocks are related diversity, unrelated diversity, and leading industry.
4. Discussion
Through measuring the economic resilience of China’s provinces under three different shocks, namely, the financial crisis, the economic downturn, and COVID-19, as well as the main influencing factors, this paper draws the following main conclusions: (1) The economic resilience of provinces under different shocks has very large regional differences. During the financial crisis, the provinces and cities with stronger economic resilience were distributed in the central and western, and northern regions in a circular pattern, and the economic resilience is roughly distributed in the center-periphery in space, with strong resistance in the center and a weak resistance in the periphery; during the economic downturn, the provinces with stronger economic resilience were mainly distributed in the western and central regions; during COVID-19, the regions with stronger economic resilience were mainly concentrated in the northwest, southwest and coastal regions. The economic resilience of each province shows significant “high-high” and “low-low” spatial clustering characteristics during the economic downturn and COVID-19. (2) The main influencing factors on economic resilience under different shocks differed. The explanatory power of the leading industry is stronger during the financial crisis period; the explanatory power of population density and leading industry is stronger during the economic downturn; the explanatory power of related diversity, unrelated diversity, and leading industry are stronger during COVID-19. The explanatory power of the same impact factor on economic resilience also varies across shocks. For example, population density has the strongest explanatory power in the downturn period but the weakest impact during COVID-19. (3) In the interaction of the two-by-two influencing factors, related diversity, unrelated diversity, and leading industry, which represent industrial structure, have stronger explanatory power, and population density has weaker explanatory power.
Overall, it seems that the economic resilience and impact factors vary across regions depending on the nature of the shock [53]. In the study of this paper, its primary explanatory factors are related diversity, unrelated diversity, and leading industry, and secondary explanatory factors are foreign trade dependence, degree of innovation, and population density. Slaper et al. argue that the economic resilience of a region depends on the region’s industrial structure [54,55,56,57] and the ability to transform the industrial composition, and that the ability of different industries in the region to contribute to regional economic resilience varies [54]; regions with resource-based industries as the leading industries are prone to form path locking, which hinders regional economic resilience [58]. Cainelli [52] found that industrial diversity within a region significantly enhances its short-term shock resistance, but lacks help in long-term shock resilience; a diversified industrial structure disperses external disturbances and enhances the region’s ability to cope with shocks, which helps improve regional economic resilience [30,59]; and unrelated diversity faces more switching costs and risk of innovation failure in shocks, which is detrimental to regional economic resilience [4]. Martini argues that regions with higher regional economic resilience have higher levels of human capital [20]. Kuliš demonstrates that that human capital, population density, and trade openness have a positive impact on regional economic resilience [21].
5. Conclusions
The theoretical discussion and empirical analysis in this paper add to the theory and practice of regional economic resilience research. Unlike previous studies on economic resilience under a single shock (mostly financial crisis), this paper distinguishes three short-term shocks in China’s economic development process: financial crisis shock, structural crisis shock (economic downturn), and public security shock (COVID-19); investigates the differences in economic resilience under different shocks; and detects the explanatory power of economic resilience impact factors under different shocks using a geographic probe, and finds that the main impact of economic resilience The explanatory power of the factors differs under different shocks, and the explanatory power of the same impact factor on economic resilience differs in different shocks. Under the interaction, industry-related impact factors have the strongest interactive explanatory power on regional economic resilience. Therefore, improving regional economic resilience needs to start from the nature of the shock itself, and the formulation of relevant policies needs to pay due attention to the interaction impact factors and promote industrial optimization and upgrading while taking multiple measures to jointly enhance economic resilience. This paper also has certain limitations, focusing on short-term economic resilience but ignoring the “chronic burning” [60] of long-term economic resilience. In the future, the correlation and difference between short-term economic resilience and long-term economic resilience can be further studied in depth to further improve the theoretical and empirical research on regional economic resilience.
Author Contributions
Conceptualization, T.Z., D.Y., X.Z. and J.H.; methodology, T.Z.; software, T.Z. and R.L.; formal analysis, T.Z.; data curation, T.Z.; writing—original draft preparation, T.Z.; writing—review and editing, T.Z., D.Y., J.H., X.Z., D.L., M.C. and Y.C.; visualization, T.Z. and D.L.; funding acquisition, J.H. All authors have read and agreed to the published version of the manuscript.
Funding
This research was funded by the Chinese Academy of Sciences, CAS “Light of West China” Program (Grant No. 2020-XBQNXZ-011).
Institutional Review Board Statement
Not applicable.
Informed Consent Statement
Not applicable.
Acknowledgments
The authors would like to thank Shengqin Wu from Xinjiang Institute of Ecology and Geography, Chinese Academy of Sciences, and Yue Zhang from Chengdu University of Technology for their help in writing. The authors also gratefully acknowledge the anonymous reviewers for their kind suggestions and comments on this research and manuscript.
Conflicts of Interest
The authors declare no conflict of interest.
References
- Rose, A. Defining and measuring economic resilience to disasters. Disaster Prev. Manag. 2004, 13, 307–314. [Google Scholar] [CrossRef]
- Holling, C.S. Resilience and stability of ecological systems. Annu. Rev. Ecol. Syst. 1973, 4, 1–23. [Google Scholar] [CrossRef]
- Reggiani, A.; Graaff, T.D.; Nijkamp, P. Resilience: An Evolutionary Approach to Spatial Economic Systems. Netw. Spat. Econ. 2002, 2, 211–229. [Google Scholar] [CrossRef]
- Boschma, R. Towards an Evolutionary Perspective on Regional Resilience. Reg. Stud. 2015, 49, 733–751. [Google Scholar] [CrossRef]
- Martin, R. Regional Economic Resilience, Hysteresis and Recessionary Shocks. J. Econ. Geogr. 2012, 12, 1–32. [Google Scholar] [CrossRef]
- Purwandari, T.; Hidayat, Y.; Ahmad, W.M.A.W. Developing New Method in Measuring City Economic Resilience by Imposing Disturbances Factors and Unwanted Condition. Computation 2022, 10, 135. [Google Scholar] [CrossRef]
- Hu, X.; Hassink, R. Exploring adaptation and adaptability in uneven economic resilience: A tale of two Chinese mining regions. Camb. J. Reg. Econ. Soc. 2017, 10, 527–541. [Google Scholar] [CrossRef]
- Cutter, S.L.; Barnes, L.; Berry, M.; Burton, C.; Evans, E.; Tate, E.; Webb, J. Community and regional resilience: Perspectives from haz-ard, disters, and emergency management. Community Reg. Resil. Initiat. Tenn. 2008, 1, 383–398. [Google Scholar]
- Cutter, S.L.; Ash, K.D.; Emrich, C.T. The geographies of community disaster resilience. Glob. Environ. Chang. 2014, 29, 65–77. [Google Scholar] [CrossRef]
- Huang, C.; Zhong, J.; Wu, J.; Fan, J. Evaluation and Comparative Study of Provincial Resilience in China. In Proceedings of the Thirteenth International Conference on Management Science and Engineering Management, 2020; Springer: Cham, Switzerland, 2019. [Google Scholar] [CrossRef]
- Volkov, A.; Žičkienė, A.; Morkunas, M.; Baležentis, T.; Ribašauskienė, E.; Streimikiene, D. A Multi-Criteria Approach for Assessing the Economic Resilience of Agriculture: The Case of Lithuania. Sustainability 2021, 13, 2370. [Google Scholar] [CrossRef]
- Sharma, G.D.; Thomas, A.; Paul, J. Reviving tourism industry post-COVID-19: A resilience-based framework. Tour. Manag. Perspect. 2021, 37, 100786. [Google Scholar] [CrossRef]
- Tan, J.; Zhao, H.; LIu, W.; Zhang, P.; Chou, F. Regional economic resilience and-influential mechanism during economic crises in China. Sci. Geo-Graph. Sin. 2020, 40, 173–181. (In Chinese) [Google Scholar]
- Martin, R.; Gardiner, B. The resilience of cities to economic shocks: A tale of four recessions (and the challenge of Brexit). Pap. Reg. Sci. 2019, 98, 1801–1832. [Google Scholar] [CrossRef]
- Giannakis, E.; Bruggeman, A. Economic crisis and regional resilience: Evidence from Greece. Reg. Sci. 2015, 96, 2–25. [Google Scholar] [CrossRef]
- Fingleton, B.; Garretsen, H.; Martin, R. Recessionary shocks and regional employment: Evidence on the resilience of U.K. regions. J. Reg. Sci. 2012, 52, 109–133. [Google Scholar] [CrossRef]
- Frenken, K.; Van, O.F.; Verburg, T. Related variety, unrelated variety and regional economic growth. Reg. Stud. 2007, 41, 685–697. [Google Scholar] [CrossRef]
- Aarstad, J.; Kvitastein, O.A.; Jakobsen, S.-E. Related and unrelated variety as regional drivers of enterprise productivity and innovation: A multilevel study. Res. Policy 2016, 45, 844–856. [Google Scholar] [CrossRef]
- Castaldi, C.; Frenken, K.; Los, B. Related variety and unrelated variety and technological breakthroughs: An analysis of US state-level patenting. Reginal Study 2015, 49, 767–781. [Google Scholar] [CrossRef]
- Martini, B. Resilience, Resistance and Recoverability, Regional Economic Structure And Human Capital In Italy. Are They Related? Appl. Econom. Int. Dev. Eur. Am. Assoc. Econ. Dev. 2020, 20, 47–62. [Google Scholar]
- Kuliš, Z.; Šimundić, B.; Kuliš, B. Re-orientation as a Tool for Resistance and Recovery: Analysis of Regional Economic Resilience in Croatian NUTS 3 Regions. In Proceedings of the FEB Zagreb 13th International Odyssey Conference on Economics and Business/Sever, Dubrovnik, Croatia, 1–4 June 2022; Mališ, S., Jaković, B., Načinović Braje, I.-Z., Eds.; Faculty of Economics & Business, University of Zagreb: Zagreb, Croatia, 2022; pp. 272–287. [Google Scholar]
- Pendall, R.; Theodos, B.; Franks, K. Vulnerable people, precarious housing and regional resilience: An exploratory analysis. Hous. Policy Debate 2012, 22, 271–296. [Google Scholar] [CrossRef]
- Hauser, C.; Tappeiner Walde, J. The Learning Region: The Impact of Social Capital and Weak Ties on Innovation. Reg. Stud. 2007, 41, 75–88. [Google Scholar] [CrossRef]
- Whitley, R.D. The Institutional Structuring of Innovation Strategies: Business Systems, Firm Types and Patterns of Technical Change in Different Market Economies. Organ. Stud. 2000, 21, 855–886. [Google Scholar] [CrossRef]
- Swanstrom, T. Regional resilience: A critical examination of the ecological framework. In Working Paper; University of California Berkeley: Berkeley, CA, USA, 2008. [Google Scholar]
- Corodescu-Rosca, E.; Hamdouch, A.; Iatu, C. La temporalité différenciée des stratégies des acteurs locaux comme facteur clé de résilience des métropoles régionales: Le cas de la Roumanie. Rev. D’économie Régionale Urbaine 2021, 5, 825–849. [Google Scholar] [CrossRef]
- Magro, E.; Uyarra, E.; Valdaliso, J.M. Agency, Institutions and Regional Resilience: An Approach from the Basque Region. In Towards Resilient Organizations and Societies. Public Sector Organizations; Pinheiro, R., Frigotto, M.L., Young, M., Eds.; Palgrave Macmillan: Cham, Switzerland, 2021; pp. 277–304. [Google Scholar] [CrossRef]
- Žičkienė, A.; Melnikienė, R.; Morkūnas, M.; Volkov, A. CAP Direct Payments and Economic Resilience of Agriculture: Impact Assessment. Sustainability 2022, 14, 10546. [Google Scholar] [CrossRef]
- Huggins, T. Local entrepreneurial resilience and culture: The role of social value-s in fostering economic recovery. Camb. J. Reg. Econ. Soc. 2015, 8, 313–330. [Google Scholar] [CrossRef]
- Brown, L.; Greenbaum, R.T. The role of industrial diversity in economic resilience: An empirical examination across 35 years. Urban Stud. 2017, 54, 1347–1366. [Google Scholar] [CrossRef]
- Corodescu-Roșca, E.; Hamdouch, A.; Iațu, C. Innovation in urban governance and economic resilience. The case of two Romanian regional metropolises: Timișoara and Cluj Napoca. Cities 2023, 132, 104090. [Google Scholar] [CrossRef]
- Shutters, S.T.; Kandala, S.S.; Wei, F.; Kinzig, A.P. Resilience of Urban Economic Structures Following the Great Recession. Sustainability 2021, 13, 2374. [Google Scholar] [CrossRef]
- Júnior, N.D.S.M.; Hoffmann, V.E. Regional resilience: A bibliometric study from the Web of Science. Gestão Reg. 2021, 37, 23–41. [Google Scholar] [CrossRef]
- Wang, F.; Gao, X. Spatial pattern evolvement of the economy in Inner Mongolia at the county level. Sci. Geogr. Sin. 2014, 34, 818–824. (In Chinese) [Google Scholar]
- Shi, L.; Liu, M.; Li, Y.; Zhang, X.; Gao, F.; Li, W. The spatiotemporal evolution and influencing factors of economic difference at county level in Fenhe River Basin. Geogr. Res. 2020, 39, 2361–2378. (In Chinese) [Google Scholar]
- Wang, J.F.; Li, X.H.; Christakos, G.; Liao, Y.L.; Zhang, T.; Gu, X.; Zheng, X.Y. Geographical detectors-based health risk assessment and its application in the neural tube defects study of the Heshun region, China. Int. J. Geogr. Inf. Sci. 2010, 24, 107–127. (In Chinese) [Google Scholar] [CrossRef]
- Xu, C.W.J. Geodetector: Principle and prospective. Acta Geogr. Sin. 2017, 72, 116–134. (In Chinese) [Google Scholar]
- Liu, W. The impacts of COVID-19 pandemic on the development of economic globalization. Geogr. Res. 2020, 39, 1439–1449. (In Chinese) [Google Scholar]
- Li, L.; Hu, X. Analysis on the Spatial-Temporal Pattern and Influencing Factors of Regional Economic Resilience in China under the COVID-19 Pandemic. [J/OL]. World Regional Studies. pp. 1–13. Available online: https://kns.cnki.net/kcms/detail/31.1626.P.20220610.1312.002.html (accessed on 10 June 2022).
- Sun, J. Impact of COVID-19 epidemic on China’s regional economic development. Reg. Econ. Rev. 2020, 2, 8–11. (In Chinese) [Google Scholar]
- Nicola, M.; Alsafi, Z.; Sohrabi, C.; Kerwan, A.; Al-Jabir, A.; Iosifidis, C. The socio-economic implications of the coronavirus pandemic (COVID-19): A review. Int. J. Surg. 2020, 78, 185–193. [Google Scholar] [CrossRef]
- Martin, R.; Sunley, P.; Gardiner, B.; Tyler, P. How regions react to recessions: Resilience and the role of economic structure. Reg. Stud. 2016, 50, 561–585. [Google Scholar] [CrossRef]
- Sun, J.; Sun, X. Research progress of regional economic resilience and exploration of its application in China. Econ. Geogr. 2017, 37, 1–9. (In Chinese) [Google Scholar]
- Kitsos, A.; Carrascal-incera, A.; Ortega-Argilés, R. The role of embeddedness on regional economic resilience: Evidence from the UK. Sustainability 2019, 11, 3800. [Google Scholar] [CrossRef]
- Xu, Y.; Zhang, L. The Economic Resilience of Chinese Cities and Its Origin: From the Perspective of Diversification of Industrial Structure. Financ. Trade Econ. 2019, 40, 110–126. (In Chinese) [Google Scholar]
- Giannakis, E.; Bruggeman, A. Determinants of regional resilience to economic crisis: A European perspective. Eur. Plan. Stud. 2017, 25, 1394–1415. [Google Scholar] [CrossRef]
- Zhou, X.; Zhou, Z.; Gao, Y. Study on the Evaluation and Selection of Leading Industries in Western Hunan. Econ. Geogr. 2020, 40, 133–142. (In Chinese) [Google Scholar]
- Cao, F.; Ge, Y.; Wang, J. Optimal discretization for geographical detectors based risk assessment. GISci. Remote Sens. 2013, 50, 78–92. [Google Scholar] [CrossRef]
- Diodato, D.; Weterings, A.B.R. The resilience of regional labour-markets to economic shocks: Exploring the role of interactions among firms and workers. J. Econ. Geogr. 2014, 15, 723–742. [Google Scholar] [CrossRef]
- Neffke, F.; Henning, M. Skill-relatedness and firm diversification. Strateg. Manag. J. 2013, 34, 297–316. [Google Scholar] [CrossRef]
- Rocchetta, S.; Mina, A. Technological coherence and the adaptive resilience of regional economies. Reg. Stud. 2019, 53, 1421–1434. [Google Scholar] [CrossRef]
- Cainelli, G.; Ganau, R.; Modica, M. Does related variety affect regional resilience? New evidence from Italy. Ann. Reg. Sci. 2019, 62, 657–680. [Google Scholar] [CrossRef]
- Di Pietro, F.; Lecca, P.; Salotti, S. Regional economic resilience in the European Union: A numerical general equilibrium analysis. Spat. Econ. Anal. 2021, 16, 287–312. [Google Scholar] [CrossRef]
- Slaper, T.F.; Dempwolf, C.S. Chapter 23: “Complexity, resilience and emergence in regional economic systems”. In Handbook on Entropy, Complexity and Spatial Dynamics; Edward Elgar Publishing: Cheltenham, UK, 2021. [Google Scholar] [CrossRef]
- Hill, E.; Clair, T.S.; Wial, H.; Wolman, H.; Atkins, P.; Blumenthal, P.; Ficenec, S.; Friedhoff, A. Economic shocks and regional economic resilience. In Urban and Regional Policy and Its Effects: Building Resilient Regions; Brookings Institution Press: Washington, DC, USA, 2012; pp. 193–274. [Google Scholar]
- Storper, M. Keys to the City; Princeton University Press: Princeton, NJ, USA, 2013. [Google Scholar]
- Martin, R.; Sunley, P. On the notion of regional economic resilience: Conceptualization and explanation. J. Econ. Geogr. 2015, 15, 1–42. [Google Scholar] [CrossRef]
- Brunelle, Cédric & Spigel, Ben. Path Dependency, Entrepreneurship, and Economic Resilience in Resource-Driven Economies: Lessons from the Newfoundland Offshore Oil Industry, Canada. In Creating Resilient Economies; Edward Elgar Publishing: Cheltenham, UK, 2017; pp. 89–108. [Google Scholar] [CrossRef]
- Evans, R.; Karecha, J. Staying on top: Why is Munich so resilient and successful? Eur. Plan. Stud. 2014, 22, 1259–1279. [Google Scholar] [CrossRef]
- Pendall, R.; Foster, K.A.; Cowell, M. Resilience and regions: Building understanding of te metaphor. Camb. J. Reg. Econ. Soc. 2010, 3, 71–84. [Google Scholar] [CrossRef]
Publisher’s Note: MDPI stays neutral with regard to jurisdictional claims in published maps and institutional affiliations. |
© 2022 by the authors. Licensee MDPI, Basel, Switzerland. This article is an open access article distributed under the terms and conditions of the Creative Commons Attribution (CC BY) license (https://creativecommons.org/licenses/by/4.0/).