An Air Quality Modeling and Disability-Adjusted Life Years (DALY) Risk Assessment Case Study: Comparing Statistical and Machine Learning Approaches for PM2.5 Forecasting
Abstract
1. Introduction
2. Methodology
2.1. Study Area
2.2. Data Collection
2.3. Statistical Analyses
2.4. Machine Learning
2.5. Human Health Risk Assessment
3. Results and Discussion
3.1. PM2.5 Pollution Profile
3.2. Pollution Profiles for PM10, CO, NO, NO2, and SO2
3.3. Correlation between PM2.5, Atmospheric Variables, and Meteorological Parameters
3.4. Multiple Linear Regression Predictive Models
3.5. Random Forest Prediction Models
3.6. Comparison between Prediction Methods
3.7. Human Health Risk Assessment (HHRA)
4. Conclusions
- The MLR models for PM2.5 concentrations yielded a high correlation of PM with CO. Overall, both MLR and RF well predicted PM concentrations as evidenced by model fit and validation parameters. The concentrations of PM10 and CO were the major describing parameters in the predictive models, suggesting a common source.
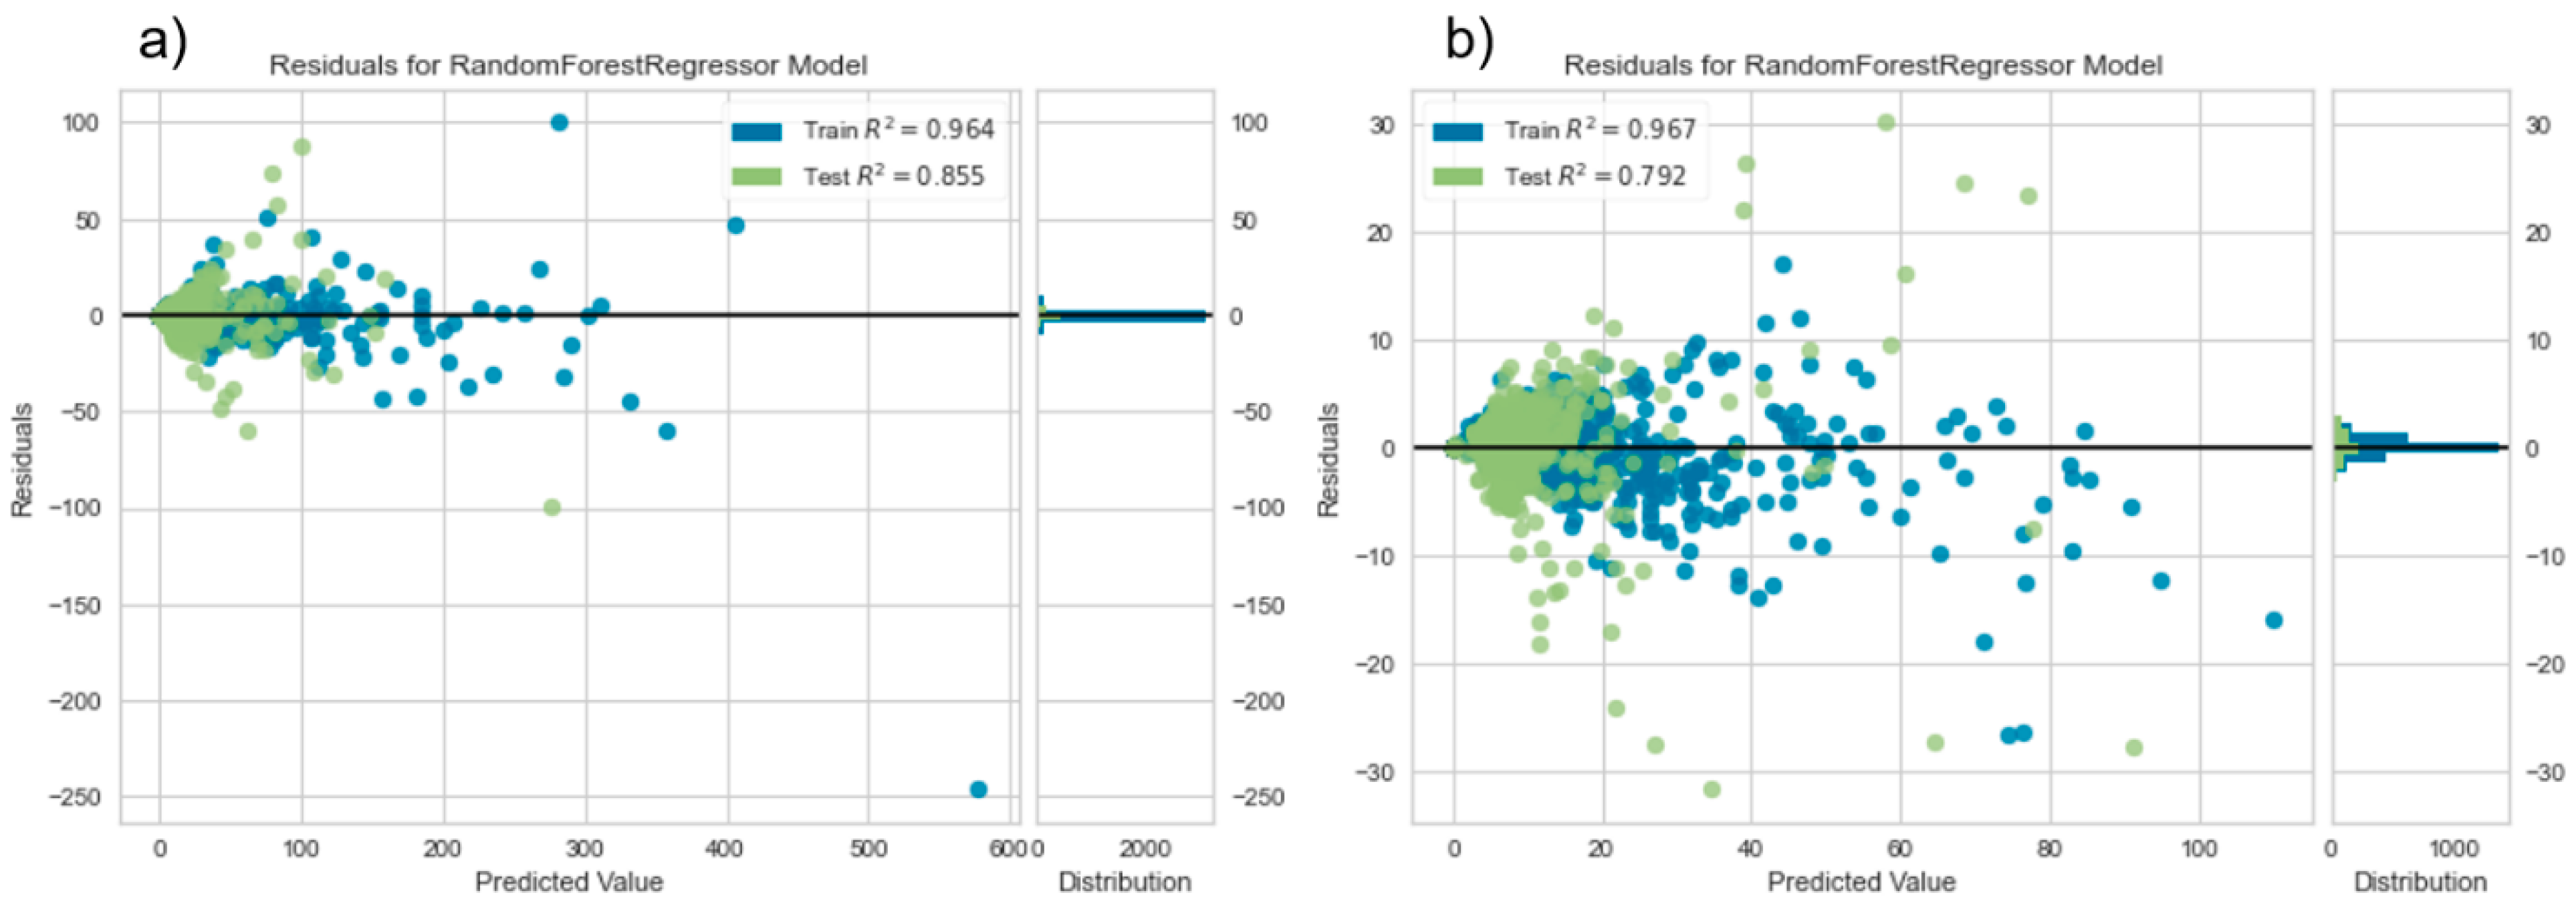
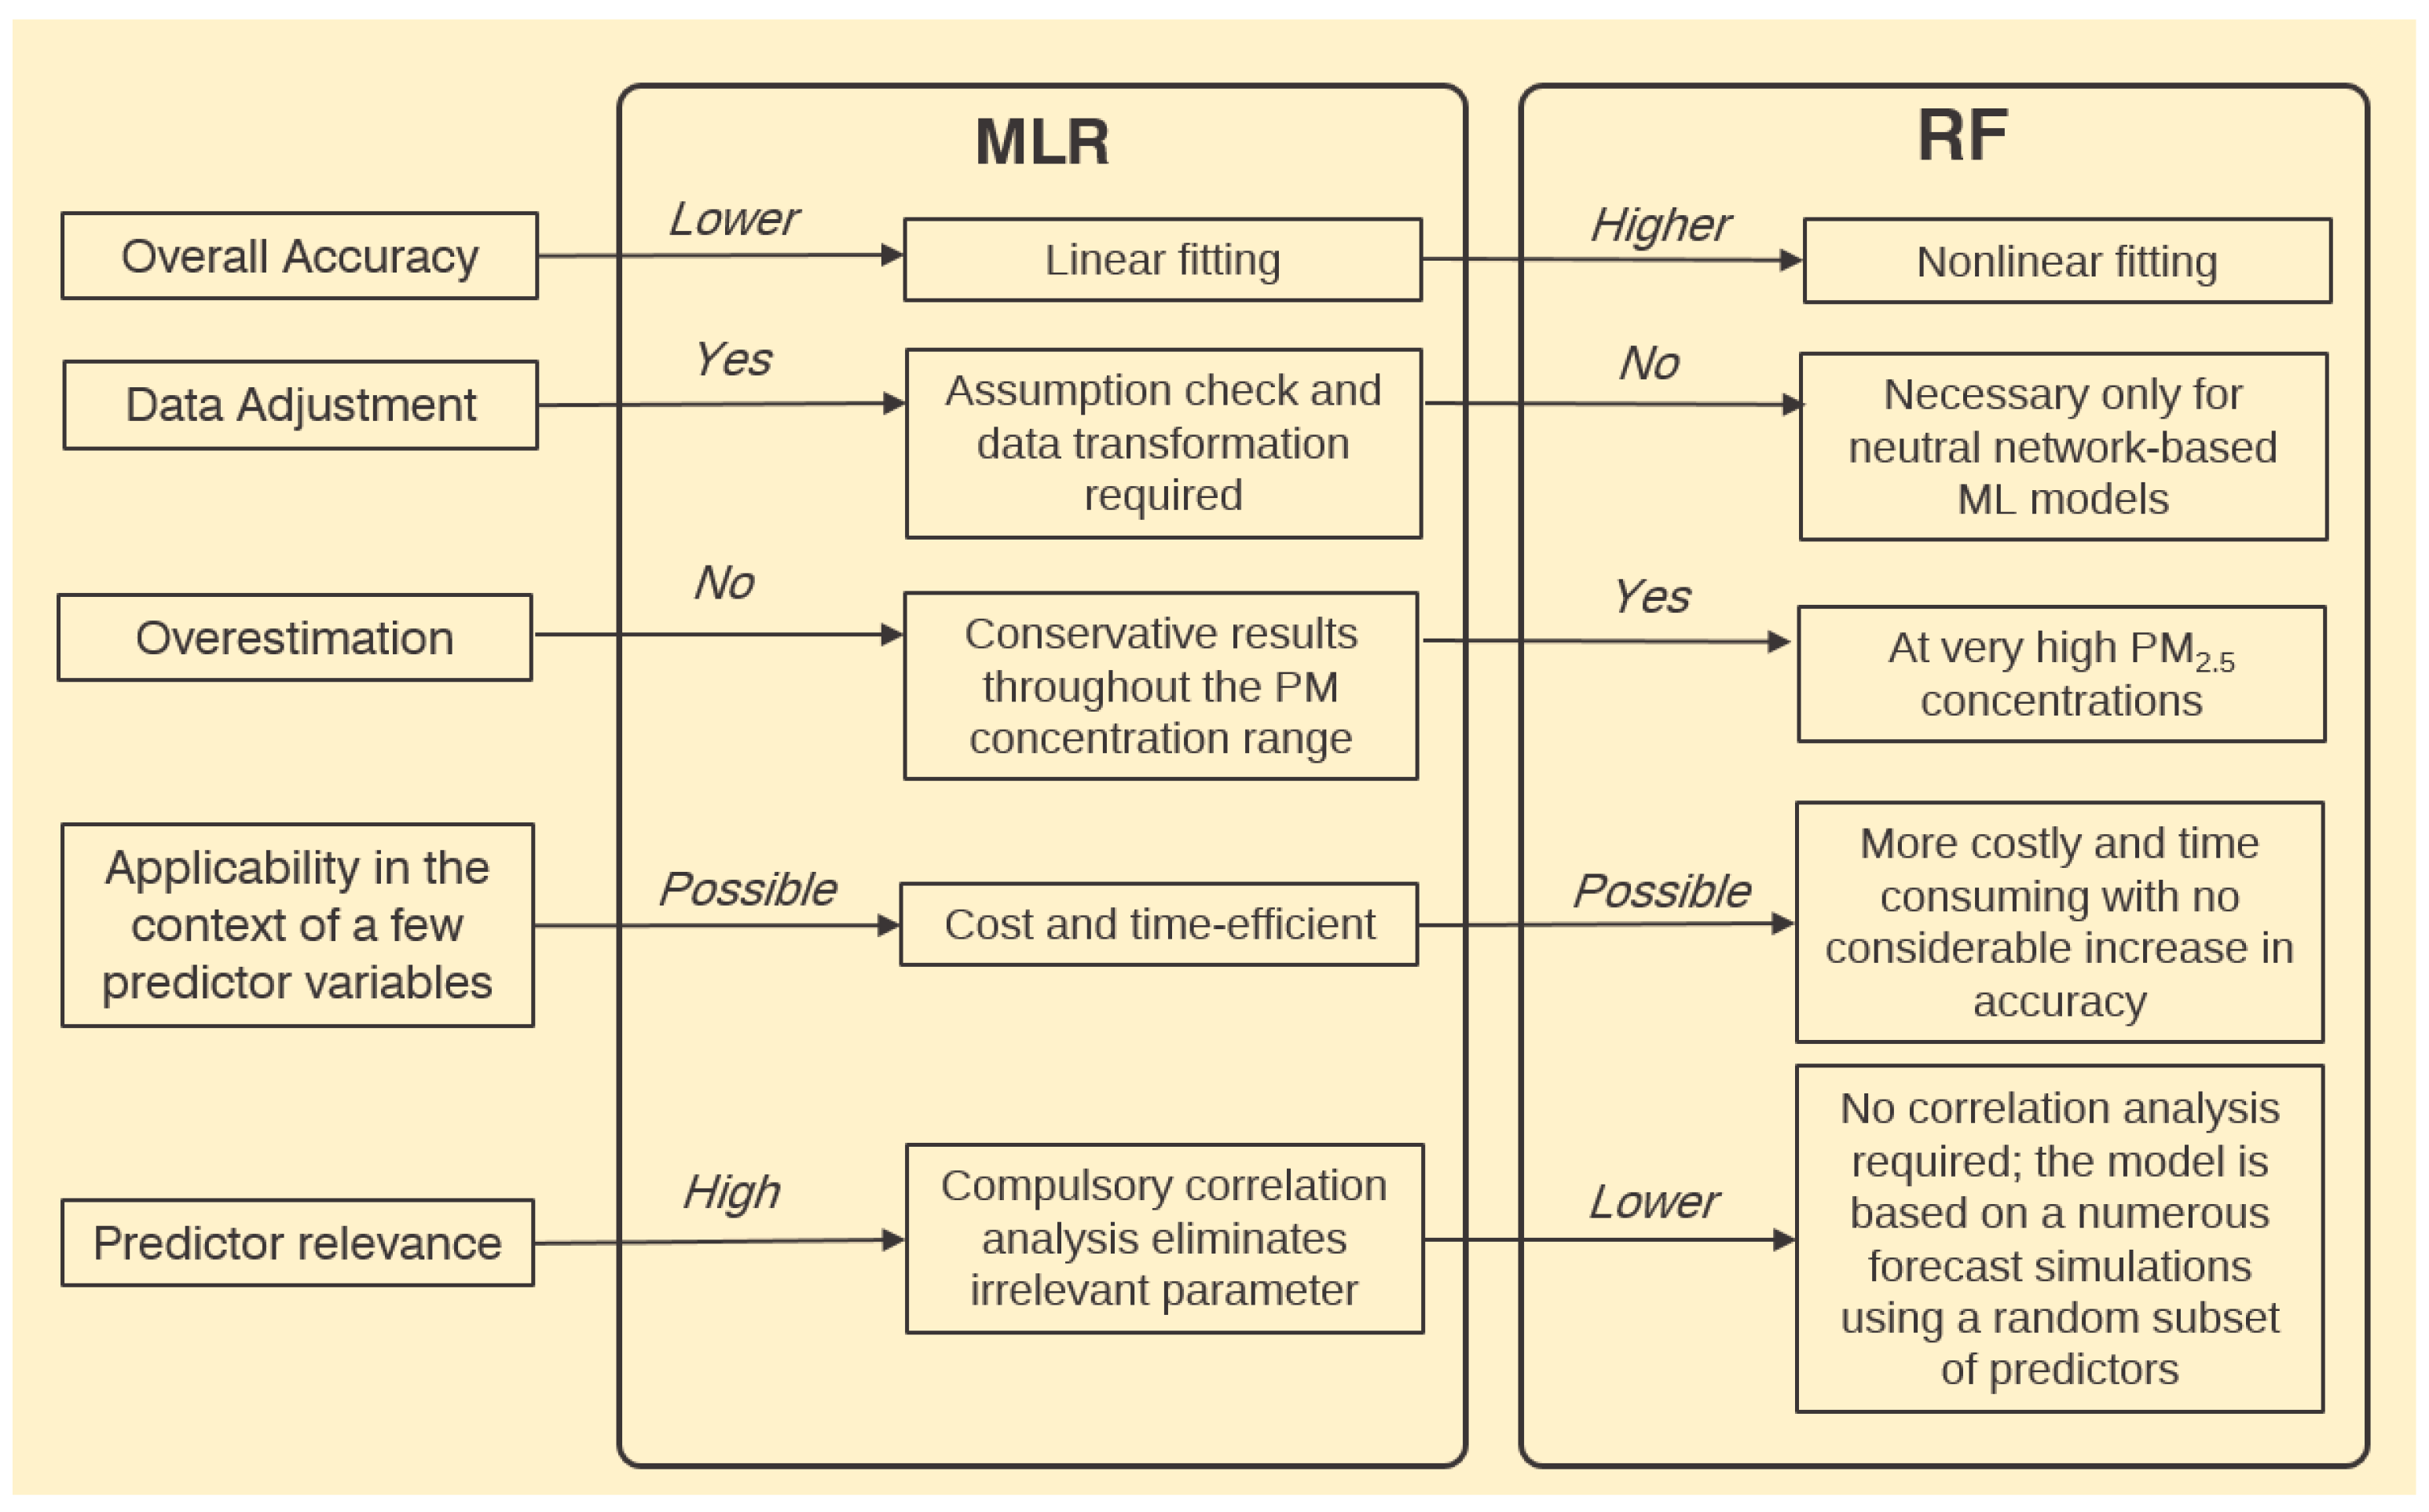
- The RF-based PM2.5 concentration prediction model showed slightly better performance than the MLR model due to better fitting for nonlinear data and higher sensitivity to the seasonal variation of air pollutants and weather parameters. Similarly to MLR, it suggested that PM10 and CO concentrations were the most important predictors of PM2.5 concentration. However, RF tended to overestimate at high PM2.5 concentrations, and MLR could still be a valuable alternative to machine learning algorithms as it provided more conservative predicted values. As suggested by the literature, MLR could also be more suitable in cases where the number of predictors is limited, which is typical for areas with sparse air monitoring data.
- Disability Adjusted Life Years (DALY) calculated based on the prediction data for the population of the city in 2019 were high and ranged from 2160 to 7531 y. Moreover, health effects due to exposure to other air pollutants could not be considered due to the lack of required medical record information.
- The methodology presented and employed in the present study for contaminant concentration prediction is applicable worldwide to locations with comparable severe air pollution and harsh climate characteristics. Furthermore, its outputs would provide valuable information for policymakers and health professionals in developing effective air pollution mitigation strategies to reduce human exposure to ambient air pollutants, as it is also scalable to regions with similar urban, topological, and metrological features.
- The AI-based models implemented to forecast and monitor air quality are better suited in the context of limited air pollution data, and have their own advantages and limitations as described above.
- The present study revealed the need for the development of a more extensive air quality system in the region for an accurate prediction of local pollution patterns and related health hazards.
- Finally, the results from the study emphasize the necessity of further research on air quality monitoring and modeling, health outcomes related to PM2.5 exposure, and morbidity/mortality caused by air pollution both in Astana, Kazakhstan and in regions of the globe with shared pollution and climate characteristics.
Supplementary Materials
Author Contributions
Funding
Institutional Review Board Statement
Informed Consent Statement
Data Availability Statement
Acknowledgments
Conflicts of Interest
References
- Thongthammachart, T.; Jinsart, W. Estimating PM2.5 concentrations with statistical distribution techniques for health risk assessment in Bangkok. Hum. Ecol. Risk Assess. Int. J. 2019, 26, 1848–1863. [Google Scholar] [CrossRef]
- Vlachogianni, A.; Kassomenos, P.; Karppinen, A.; Karakitsios, S.; Kukkonen, J. Evaluation of a multiple regression model for the forecasting of the concentrations of NOx and PM10 in Athens and Helsinki. Sci. Total Environ. 2011, 409, 1559–1571. [Google Scholar] [CrossRef] [PubMed]
- Aztatzi-Aguilar, O.; Valdés-Arzate, A.; Debray-García, Y.; Calderón-Aranda, E.; Uribe-Ramirez, M.; Acosta-Saavedra, L.; Gonsebatt, M.; Maciel-Ruiz, J.; Petrosyan, P.; Mugica-Alvarez, V. Exposure to ambient particulate matter induces oxidative stress in lung and aorta in a size- and time-dependent manner in rats. Toxicol. Res. Appl. 2018, 2. [Google Scholar] [CrossRef]
- Kelly, F.J.; Fussell, J.C. Size, source and chemical composition as determinants of toxicity attributable to ambient particulate matter. Atmos. Environ. 2012, 60, 504–526. [Google Scholar] [CrossRef]
- WHO. World Health Organization. Ambient Air Pollution: Health Impacts. 2018. Available online: https://www.who.int/news-room/fact-sheets/detail/ambient-(outdoor)-air-quality-and-health (accessed on 19 February 2022).
- Pope, C.A.; Dockery, D.W. Health Effects of Fine Particulate Air Pollution: Lines that Connect. J. Air Waste Manag. Assoc. 2006, 56, 709–742. [Google Scholar] [CrossRef] [PubMed]
- Kassomenos, P.; Papaloukas, C.; Petrakis, M.; Karakitsios, S. Assessment and prediction of short-term hospital admissions: The case of Athens, Greece. Atmos. Environ. 2008, 42, 7078–7086. [Google Scholar] [CrossRef]
- Hao, J.; Zhang, F.; Chen, D.; Liu, Y.; Liao, L.; Shen, C.; Liu, T.; Liao, J.; Ma, L. Association between ambient air pollution exposure and infants small for gestational age in Huangshi, China: A cross-sectional study. Environ. Sci. Pollut. Res. 2019, 26, 32029–32039. [Google Scholar] [CrossRef]
- Lee, Y.G.; Lee, P.H.; Choi, S.M.; An, M.H.; Jang, A.S. Effects of Air Pollutants on Airway Diseases. Int. J. Environ. Res. Public Health 2021, 18, 9905. [Google Scholar] [CrossRef]
- Darynova, Z.; Torkmahalleh, M.A.; Abdrakhmanov, T.; Sabyrzhan, S.; Sagynov, S.; Hopke, P.K.; Kushta, J. SO2 and HCHO over the major cities of Kazakhstan from 2005 to 2016: Influence of political, economic and industrial changes. Sci. Rep. 2020, 10, 12635. [Google Scholar] [CrossRef]
- Ul-Saufie, A.Z.; Yahaya, A.S.; Ramli, N.; Hamid, H.A. Performance of Multiple Linear Regression Model for Long-term PM10 Concentration Prediction Based on Gaseous and Meteorological Parameters. J. Appl. Sci. 2012, 12, 1488–1494. [Google Scholar] [CrossRef]
- Ul-Saufie, A.Z.; Yahaya, A.S.; Shukri, A.; Nor, Y.; Hazrul, A.R.; Hamid, A. Comparison Between Multiple Linear Regression and Feed forward Back propagation Neural Network Models For Predicting PM10 Concentration Level Based On Gaseous And Meteorological Parameters. Int. J. Appl. Sci. Technol. 2011, 1, 42–49. [Google Scholar]
- Abdullah, S.; Ismail, M.; Fong, S.Y. Multiple Linear Regression (MLR) models for long term PM10 concentration forecasting during different monsoon seasons. J. Sustain. Sci. Manag. 2017, 12, 60–67. [Google Scholar]
- Swain, S.; Patel, P.; Nandi, S. A multiple linear regression model for precipitation forecasting over Cuttack district, Odisha, India. In Proceedings of the 2017 2nd International Conference for Convergence in Technology (I2CT), Mumbai, India, 7–9 April 2017. [Google Scholar] [CrossRef]
- Dimitriadou, S.; Nikolakopoulos, K.G. Multiple Linear Regression Models with Limited Data for the Prediction of Reference Evapotranspiration of the Peloponnese, Greece. Hydrology 2022, 9, 124. [Google Scholar] [CrossRef]
- Morawska, L.; Thai, P.K.; Liu, X.; Asumadu-Sakyi, A.; Ayoko, G.; Bartonova, A.; Bedini, A.; Chai, F.; Christensen, B.; Dunbabin, M. Applications of low-cost sensing technologies for air quality monitoring and exposure assessment: How far have they gone? Environ. Int. 2018, 116, 286–299. [Google Scholar] [CrossRef]
- Spandonidis, C.; Tsantilas, S.; Giannopoulos, F.; Giordamlis, C.; Zyrichidou, I.; Syropoulou, P. Design and Development of a New Cost-Effective Internet of Things Sensor Platform for Air Quality Measurements. J. Eng. Sci. Technol. Rev. 2020, 13, 81–91. [Google Scholar] [CrossRef]
- Park, S.; Im, J.; Kim, J.; Kim, S.M. Geostationary satellite-derived ground-level particulate matter concentrations using real-time machine learning in Northeast Asia. Environ. Pollut. 2022, 306, 119425. [Google Scholar] [CrossRef]
- Khan, A.; Sharma, S.; Chowdhury, K.R.; Sharma, P. A novel seasonal index–based machine learning approach for air pollution forecasting. Environ. Monit. Assess. 2022, 194, 429. [Google Scholar] [CrossRef]
- Shaziayani, W.N.; Ul-Saufie, A.Z.; Mutalib, S.; Noor, N.M.; Zainordin, N.S. Classification Prediction of PM10 Concentration Using a Tree-Based Machine Learning Approach. Atmosphere 2022, 13, 538. [Google Scholar] [CrossRef]
- Ejohwomu, O.A.; Oshodi, O.S.; Oladokun, M.; Bukoye, O.T.; Emekwuru, N.; Sotunbo, A.; Adenuga, O. Modelling and Forecasting Temporal PM2.5 Concentration Using Ensemble Machine Learning Methods. Buildings 2022, 12, 46. [Google Scholar] [CrossRef]
- Joharestani, M.Z.; Cao, C.; Ni, X.; Bashir, B.; Talebiesfandarani, S. PM2.5 Prediction Based on Random Forest, XGBoost, and Deep Learning Using Multisource Remote Sensing Data. Atmosphere 2019, 10, 373. [Google Scholar] [CrossRef]
- Guo, B.; Zhang, D.; Pei, L.; Su, Y.; Wang, X.; Bian, Y.; Zhang, D.; Yao, W.; Zhou, Z.; Guo, L. Estimating PM2.5 concentrations via random forest method using satellite, auxiliary, and ground-level station dataset at multiple temporal scales across China in 2017. Sci. Total Environ. 2021, 778, 146288. [Google Scholar] [CrossRef] [PubMed]
- Vilesov, Е. Характеристики климата гoрoда Астана и их изменения за пoследние 90 лет. [Climate characteristics of Astana city and their changes over the past 90 years]. Hydrometeorol. Ecol. 2017, 3, 7–16. [Google Scholar]
- Kozhakhmetova, E.; Kozhakhmetov, P. О климате и егo изменении в гoрoде Астане. [About the climate and its change in the city of Astana]. Hydrometeorol. Ecol. 2011, 2, 7–14. [Google Scholar]
- Bureau of National Statistics of the Agency for Strategic Planning and Reforms of the Republic of Kazakhstan. Yearbook on Demographics of Republic of Kazakhstan. 2021. Available online: https://stat.gov.kz/ (accessed on 20 August 2022).
- Dutta, A.; Jinsart, W. Risks to health from ambient particulate matter (PM2.5 and PM10) to the residents of an Indian City: An analysis of prediction model. Hum. Ecol. Risk Assess. Int. J. 2021, 27, 1094–1111. [Google Scholar] [CrossRef]
- Kulkarni, P.; Sreekanth, V.; Upadhya, A.R.; Gautam, H.C. Which model to choose? Performance comparison of statistical and machine learning models in predicting PM2.5 from high-resolution satellite aerosol optical depth. Atmos. Environ. 2022, 282, 119164. [Google Scholar] [CrossRef]
- Al-Hemoud, A.; Gasana, J.; Alajeel, A.; Alhamoud, E.; Al-Shatti, A.; Al-Khayat, A. Ambient exposure of O3 and NO2 and associated health risk in Kuwait. Environ. Sci. Pollut. Res. 2020, 28, 14917–14926. [Google Scholar] [CrossRef]
- WHO. Health Impact Assessment of Air Pollution: AirQ+ Life Table Manual. WHO Regional Office for Europe. License: CC BY-NC-SA 3.0 IGO. 2020. Available online: https://apps.who.int/iris/bitstream/handle/10665/337683/WHO-EURO-2020-1559-41310-56212-eng.pdf?sequence=1&isAllowed=y (accessed on 13 April 2022).
- Gao, T.; Wang, X.C.; Chen, R.; Ngo, H.H.; Guo, W. Disability adjusted life year (DALY): A useful tool for quantitative assessment of environmental pollution. Sci. Total Environ. 2015, 511, 268–287. [Google Scholar] [CrossRef]
- Jung, S.; Kang, H.; Sung, S.; Hong, T. Health risk assessment for occupants as a decision-making tool to quantify the environmental effects of particulate matter in construction projects. Build. Environ. 2019, 161, 106267. [Google Scholar] [CrossRef]
- Yang, S.; Wang, X.; Guo, H.; Liu, J.; Wang, J. The Development and Application of the “DALY”-Based Environmental Risk Assessment Methods with a Case Study on the Impact of PM2.5 in Beijing. IOP Conf. Series Mater. Sci. Eng. 2019, 484, 012055. [Google Scholar] [CrossRef]
- Bhat, T.H.; Jiawen, G.; Farzaneh, H. Air Pollution Health Risk Assessment (AP-HRA), Principles and Applications. Int. J. Environ. Res. Public Health 2021, 18, 1935. [Google Scholar] [CrossRef]
- Kim, Y.M.; Kim, J.W.; Lee, H.J. Burden of disease attributable to air pollutants from municipal solid waste incinerators in Seoul, Korea: A source-specific approach for environmental burden of disease. Sci. Total Environ. 2011, 409, 2019–2028. [Google Scholar] [CrossRef] [PubMed]
- Yin, H.; Pizzol, M.; Xu, L. External costs of PM2.5 pollution in Beijing, China: Uncertainty analysis of multiple health impacts and costs. Environ. Pollut. 2017, 226, 356–369. [Google Scholar] [CrossRef] [PubMed]
- Cichowicz, R.; Wielgosiński, G.; Fetter, W. Dispersion of atmospheric air pollution in summer and winter season. Environ. Monit. Assess. 2017, 189, 605. [Google Scholar] [CrossRef] [PubMed]
- Meng, F.; Wang, J.; Li, T.; Fang, C. Pollution Characteristics, Transport Pathways, and Potential Source Regions of PM2.5 and PM10 in Changchun City in 2018. Int. J. Environ. Res. Public Health 2020, 17, 6585. [Google Scholar] [CrossRef] [PubMed]
- Kerimray, A.; Bakdolotov, A.; Sarbassov, Y.; Inglezakis, V.; Poulopoulos, S. Air pollution in Astana: Analysis of recent trends and air quality monitoring system. Mater. Today Proc. 2018, 5, 22749–22758. [Google Scholar] [CrossRef]
- Assanov, D.; Zapasnyi, V.; Kerimray, A. Air Quality and Industrial Emissions in the Cities of Kazakhstan. Atmosphere 2021, 12, 314. [Google Scholar] [CrossRef]
- Bathmanabhan, S.; Nagendra, S.; Madanayak, S. Analysis and interpretation of particulate matter–PM10, PM2.5 and PM1 emissions from the heterogeneous traffic near an urban roadway. Atmos. Pollut. Res. 2010, 1, 184–194. [Google Scholar] [CrossRef]
- Chen, W.; Tang, H.; Zhao, H. Diurnal, weekly and monthly spatial variations of air pollutants and air quality of Beijing. Atmos. Environ. 2015, 119, 21–34. [Google Scholar] [CrossRef]
- Yao, L.; Lu, N.; Yue, X.; Du, J.; Yang, C. Comparison of Hourly PM2.5 Observations Between Urban and Suburban Areas in Beijing, China. Int. J. Environ. Res. Public Health 2015, 12, 12264–12276. [Google Scholar] [CrossRef]
- Huang, Y.; Yan, Q.; Zhang, C. Spatial–Temporal Distribution Characteristics of PM2.5 in China in 2016. J. Geovisualization Spat. Anal. 2018, 2, 12. [Google Scholar] [CrossRef]
- NAAQS. Ambient Air Quality Standards for SO2. 2018. Available online: https://www.epa.gov/so2-pollution/primary-national-ambient-air-quality-standard-naaqs-sulfur-dioxide (accessed on 20 April 2022).
- WHO. WHO Air Quality Guidelines for Particulate Matter, Ozone, Nitrogen Dioxide and Sulfur Dioxide. 2006. Available online: http://apps.who.int/iris/bitstream/handle/10665/69477/WHO_SDE_PHE_OEH_06.02eng.pdf?sequence=1 (accessed on 20 February 2022).
- WHO. Chapter 5.5 Carbon Monoxide-World Health Organization. 2000. Available online: https://www.euro.who.int/__data/assets/pdf_file/0020/123059/AQG2ndEd_5_5carbonmonoxide.PDF (accessed on 20 February 2022).
- Kazhydromet. Monthly Climate Bulletin. 2021. Available online: https://www.kazhydromet.kz/ru/ecology/ezhemesyachnyy-informacionnyy-byulleten-o-sostoyanii-okruzhayuschey-sredy (accessed on 20 February 2022).
- Keuken, M.; Moerman, M.; Voogt, M.; Blom, M.; Weijers, E.; Röckmann, T.; Dusek, U. Source contributions to PM2.5 and PM10 at an urban background and a street location. Atmos. Environ. 2013, 71, 26–35. [Google Scholar] [CrossRef]
- Harrison, R.M. Outdoor Air. In Encyclopedia of Analytical Science; Elsevier: Amsterdam, The Netherlands, 2005; pp. 43–48. [Google Scholar]
- Ren, M.; Sun, W.; Chen, S. Combining machine learning models through multiple data division methods for PM2.5 forecasting in Northern Xinjiang, China. Environ. Monit. Assess. 2021, 193, 476. [Google Scholar] [CrossRef] [PubMed]
- Enebish, T.; Chau, K.; Jadamba, B.; Franklin, M. Predicting ambient PM2.5 concentrations in Ulaanbaatar, Mongolia with machine learning approaches. J. Expo. Sci. Environ. Epidemiol. 2020, 31, 699–708. [Google Scholar] [CrossRef]
- Ly, B.T.; Matsumi, Y.; Vu, T.V.; Sekiguchi, K. The effects of meteorological conditions and long-range transport on PM2.5 levels in Hanoi revealed from multi-site measurement using compact sensors and machine learning approach. J. Aerosol Sci. 2020, 152, 105716. [Google Scholar] [CrossRef]
- Bekkar, A.; Hssina, B.; Douzi, S.; Douzi, K. Air-pollution prediction in smart city, deep learning approach. J. Big Data 2021, 8, 161. [Google Scholar] [CrossRef] [PubMed]
- Zheng, L.; Lin, R.; Wang, X.; Chen, W. The Development and Application of Machine Learning in Atmospheric Environment Studies. Remote Sens. 2021, 13, 4839. [Google Scholar] [CrossRef]
- WHO. Ambient air pollution: A global assessment of exposure and burden of disease. Clean Air J. 2016, 26, 6. [Google Scholar] [CrossRef]
- Rovira, J.; Domingo, J.L.; Schuhmacher, M. Air quality, health impacts and burden of disease due to air pollution (PM10, PM2.5, NO2 and O3): Application of AirQ+ model to the Camp de Tarragona County (Catalonia, Spain). Sci. Total Environ. 2019, 703, 135538. [Google Scholar] [CrossRef]



| S5 | S6 | |||||
|---|---|---|---|---|---|---|
| Annual | Heating | Non- Heating | Annual | Heating | Non- Heating | |
| Mean | 14.5 | 18.1 | 10.4 | 58.0 | 77.2 | 38.7 |
| SD | 26.1 | 33.7 | 11.1 | 75.1 | 93.6 | 41.8 |
| Range (25th–95th) | (5.60–43.6) | (5.90–54.2) | (5.30–29.5) | (21.8–186) | (26.6–242) | (19.7–107) |
| Min | 0 | 0 | 0 | 5.7 | 5.7 | 7.1 |
| Max | 824 | 824 | 126 | 1086 | 1086 | 985 |
| S5 | |||||||||
| Annual | Heating | Non-Heating | |||||||
| Air Pollutant | Mean | SD | Range (25th–95th) | Mean | SD | Range (25th–95th) | Mean | SD | Range (25th–95th) |
| PM10 | 3.12 | 3.8 | (1.5–7.3) | 2.73 | 2.23 | (1.4–5.7) | 3.80 | 3.82 | (1.9–9.5) |
| CO | 485 | 3006 | (34.1–931) | 250 | 549 | (35.2–1011) | 745 | 4330 | (33.2–838) |
| NO | 29.9 | 33.8 | (2.4–88.2) | 25.3 | 32.0 | (1–83.9) | 35.1 | 35 | (12.5–94.7) |
| NO2 | 25.8 | 25.8 | (1.2–32.4) | 10.3 | 26.7 | (1.2–37.1) | 9.60 | 24.7 | (1.6–23.5) |
| SO2 | 19.7 | 18.6 | (7.9–58.1) | 20.9 | 20.7 | (8.00–63.7) | 18.3 | 15.8 | (7.8–45) |
| S6 | |||||||||
| Annual | Heating | Non-Heating | |||||||
| Air Pollutant | Mean | SD | Range (25th–95th) | Mean | SD | Range (25th–95th) | Mean | SD | Range (25th–95th) |
| PM10 | 60.3 | 75.9 | (23.4–190) | 79.1 | 94.5 | (27.9–244) | 41.4 | 43.4 | (21.3–114) |
| CO | 630 | 495 | (323–1553) | 742 | 540 | (405–1726) | 518 | 416 | (269–1245) |
| NO | 9.01 | 21.0 | (1.10–41.1) | 9.17 | 18.9 | (1.10–42.5) | 8.86 | 22.8 | (1.10–37.1) |
| NO2 | 39.7 | 27.1 | (17.2–81.0) | 40.7 | 23.9 | (20.6–77.6) | 38.7 | 30.0 | (15.1–88.5) |
| SO2 | 125 | 320 | (2.90–949) | 239 | 422 | (7.70–1114) | 10.3 | 10.9 | (2.90–28.0) |
| S5 | S6 | ||||||||||||
|---|---|---|---|---|---|---|---|---|---|---|---|---|---|
| Heating | Non-Heating | Heating | Non-Heating | ||||||||||
| Parameters Correlated with PM2.5 | r | Significance | Sample Size | r | Significance | Sample Size | r | Significance | Sample Size | r | Significance | Sample Size | |
| Pollutant concentrations | PM10 | 0.12 | 0.096 | 188 | 0.76 | <0.001 | 165 | 0.99 | <0.001 | 160 | 0.99 | <0.001 | 157 |
| SO2 | 0.03 | 0.716 | 188 | 0.23 | 0.003 | 165 | −0.09 | 0.239 | 160 | −0.02 | 0.758 | 157 | |
| CO | 0.87 | <0.001 | 188 | −0.17 | 0.025 | 165 | 0.87 | <0.001 | 160 | 0.62 | <0.001 | 157 | |
| NO2 | 0.48 | <0.001 | 188 | 0.17 | 0.031 | 165 | 0.55 | <0.001 | 160 | 0.18 | 0.023 | 157 | |
| NO | 0.49 | <0.001 | 188 | 0.47 | <0.001 | 165 | 0.48 | <0.001 | 160 | 0.28 | <0.001 | 157 | |
| Meteorological Parameters | T | −0.45 | <0.001 | 188 | 0.23 | 0.003 | 165 | −0.47 | <0.001 | 160 | 0.01 | 0.868 | 157 |
| P | 0.23 | 0.002 | 188 | 0.05 | 0.528 | 165 | 0.36 | <0.001 | 160 | 0.24 | 0.003 | 157 | |
| RH | 0.10 | 0.161 | 188 | −0.16 | 0.037 | 165 | 0.03 | 0.697 | 160 | 0.01 | 0.869 | 157 | |
| WD | −0.35 | <0.001 | 188 | −0.16 | 0.044 | 165 | −0.61 | <0.001 | 160 | −0.39 | <0.001 | 157 | |
| WS | −0.38 | <0.001 | 188 | −0.17 | 0.028 | 165 | −0.15 | 0.069 | 160 | 0.13 | 0.119 | 157 | |
| Model | VIF | |
|---|---|---|
| S5 | ||
| Heating | PM2.5 (µg/m3) = (−5.75) + 0.29 (PM10) (µg/m3) + 1.00 (CO) (µg/m3) − 0.13 (NO2) (µg/m3) | (1.04–1.63) |
| Non-heating | PM2.5 (µg/m3) = (−2.72) + 0.68 (PM10) (µg/m3) + 0.14 (SO2) (µg/m3) − 0.13 (NO2) (µg/m3) + 0.32 (NO) (µg/m3) | (1.09–1.89) |
| S6 | ||
| Heating | PM2.5 (µg/m3) = (−5.32) + 0.98 (PM10) (µg/m3) + 0.04 (CO) (µg/m3) − 0.02 (NO) (µg/m3) + 0.01 (WS) (m/s) | (1.37–4.43) |
| Non-heating | PM2.5 (µg/m3) = 74.24 + 1.02 (PM10) (µg/m3) − 0.02 (NO2) (µg/m3) − 0.02 (CO) (µg/m3) − 0.02 (P) (mmHg) | (1.08–1.99) |
| S5 | S6 | |||
|---|---|---|---|---|
| Heating | Non-Heating | Heating | Non-Heating | |
| Mean absolute error (MAE) | 6.37 | 3.57 | 1.55 | 1.47 |
| Root-mean-square error (RMSE) | 8.48 | 5.29 | 2.42 | 2.15 |
| Normalized absolute error (NMAE) | 0.39 | 0.37 | 0.02 | 0.04 |
| Coefficient of determination (R2) | 0.84 | 0.68 | 0.99 | 0.99 |
| Index of Agreement (IA) | 0.95 | 0.90 | 0.99 | 0.99 |
| Prediction accuracy (PA) | 0.84 | 0.69 | 0.99 | 1.01 |
| Observed mean (Oi) | 16.4 | 9.29 | 77.4 | 38.8 |
| Predicted mean (Pi) | 16.3 | 9.29 | 77.3 | 38.8 |
| Observed standard deviation (Ostd) | 21.3 | 9.28 | 61.8 | 26.9 |
| Predicted standard deviation (Pstd) | 19.6 | 7.07 | 61.7 | 27.9 |
| Model Performance Indicator | MAE (µg/m3) | RMSE (µg/m3) | CV-MSE (µg/m3) |
|---|---|---|---|
| S5 Heating | 3.95 | 8.70 | 175 |
| S5 Non-heating | 2.30 | 4.38 | 30.2 |
| S6 Heating | 3.07 | 16.5 | 141 |
| S6 Non-heating | 0.63 | 4.29 | 75.3 |
| Age Group | Population | Mortality Cases |
|---|---|---|
| 0–1 | 28,736 | 171 |
| 2–14 | 286,368 | 87 |
| 15–64 | 712,275 | 1878 |
| 65–120 | 51,005 | 2193 |
| S5 | S6 | |||
|---|---|---|---|---|
| Parameters | Mean | 95% CI | Mean | 95% CI |
| YLL per total population (all ages) | 12.7 | (0.00–25.3) | 131 | (0.00–253) |
| YLL per total population (age 30–64) | 3.82 | (0.00–7.59) | 39.3 | (0.00–75.9) |
| YLL per 100,000 people (all ages) | 1.18 | (0.00–2.34) | 12.1 | (0.00–23.4) |
| YLL per 100,000 people (age 30–64) | 0.35 | (0.00–0.70) | 3.64 | (0.00–7.04) |
| βrespiratory | Morbidity Casesrespiratory | Disability Weightrespiratory | βcardiovascular | Morbidity Casescardiovascular | Disability Weightcardiovascular |
|---|---|---|---|---|---|
| 0.0079 | 250,666 | 0.703 | 0.00068 | 30,318 | 0.787 |
| Parameter | S5 | S6 | |
|---|---|---|---|
| Respiratory disease | YLD per total population | 1912 | 6477 |
| YLD per 100,000 individuals | 177 | 601 | |
| Cardiovascular disease | YLD per total population | 235 | 923 |
| YLD per 100,000 individuals | 21.8 | 85.6 | |
| DALY per total population | 2160 | 7531 | |
| DALY per 100,000 individuals | 200 | 698 | |
Publisher’s Note: MDPI stays neutral with regard to jurisdictional claims in published maps and institutional affiliations. |
© 2022 by the authors. Licensee MDPI, Basel, Switzerland. This article is an open access article distributed under the terms and conditions of the Creative Commons Attribution (CC BY) license (https://creativecommons.org/licenses/by/4.0/).
Share and Cite
Agibayeva, A.; Khalikhan, R.; Guney, M.; Karaca, F.; Torezhan, A.; Avcu, E. An Air Quality Modeling and Disability-Adjusted Life Years (DALY) Risk Assessment Case Study: Comparing Statistical and Machine Learning Approaches for PM2.5 Forecasting. Sustainability 2022, 14, 16641. https://doi.org/10.3390/su142416641
Agibayeva A, Khalikhan R, Guney M, Karaca F, Torezhan A, Avcu E. An Air Quality Modeling and Disability-Adjusted Life Years (DALY) Risk Assessment Case Study: Comparing Statistical and Machine Learning Approaches for PM2.5 Forecasting. Sustainability. 2022; 14(24):16641. https://doi.org/10.3390/su142416641
Chicago/Turabian StyleAgibayeva, Akmaral, Rustem Khalikhan, Mert Guney, Ferhat Karaca, Aisulu Torezhan, and Egemen Avcu. 2022. "An Air Quality Modeling and Disability-Adjusted Life Years (DALY) Risk Assessment Case Study: Comparing Statistical and Machine Learning Approaches for PM2.5 Forecasting" Sustainability 14, no. 24: 16641. https://doi.org/10.3390/su142416641
APA StyleAgibayeva, A., Khalikhan, R., Guney, M., Karaca, F., Torezhan, A., & Avcu, E. (2022). An Air Quality Modeling and Disability-Adjusted Life Years (DALY) Risk Assessment Case Study: Comparing Statistical and Machine Learning Approaches for PM2.5 Forecasting. Sustainability, 14(24), 16641. https://doi.org/10.3390/su142416641


