3.1. Comparison and Analysis of Assignment Results of Combined Assignment Models
Taking Hunan Province as an example (see
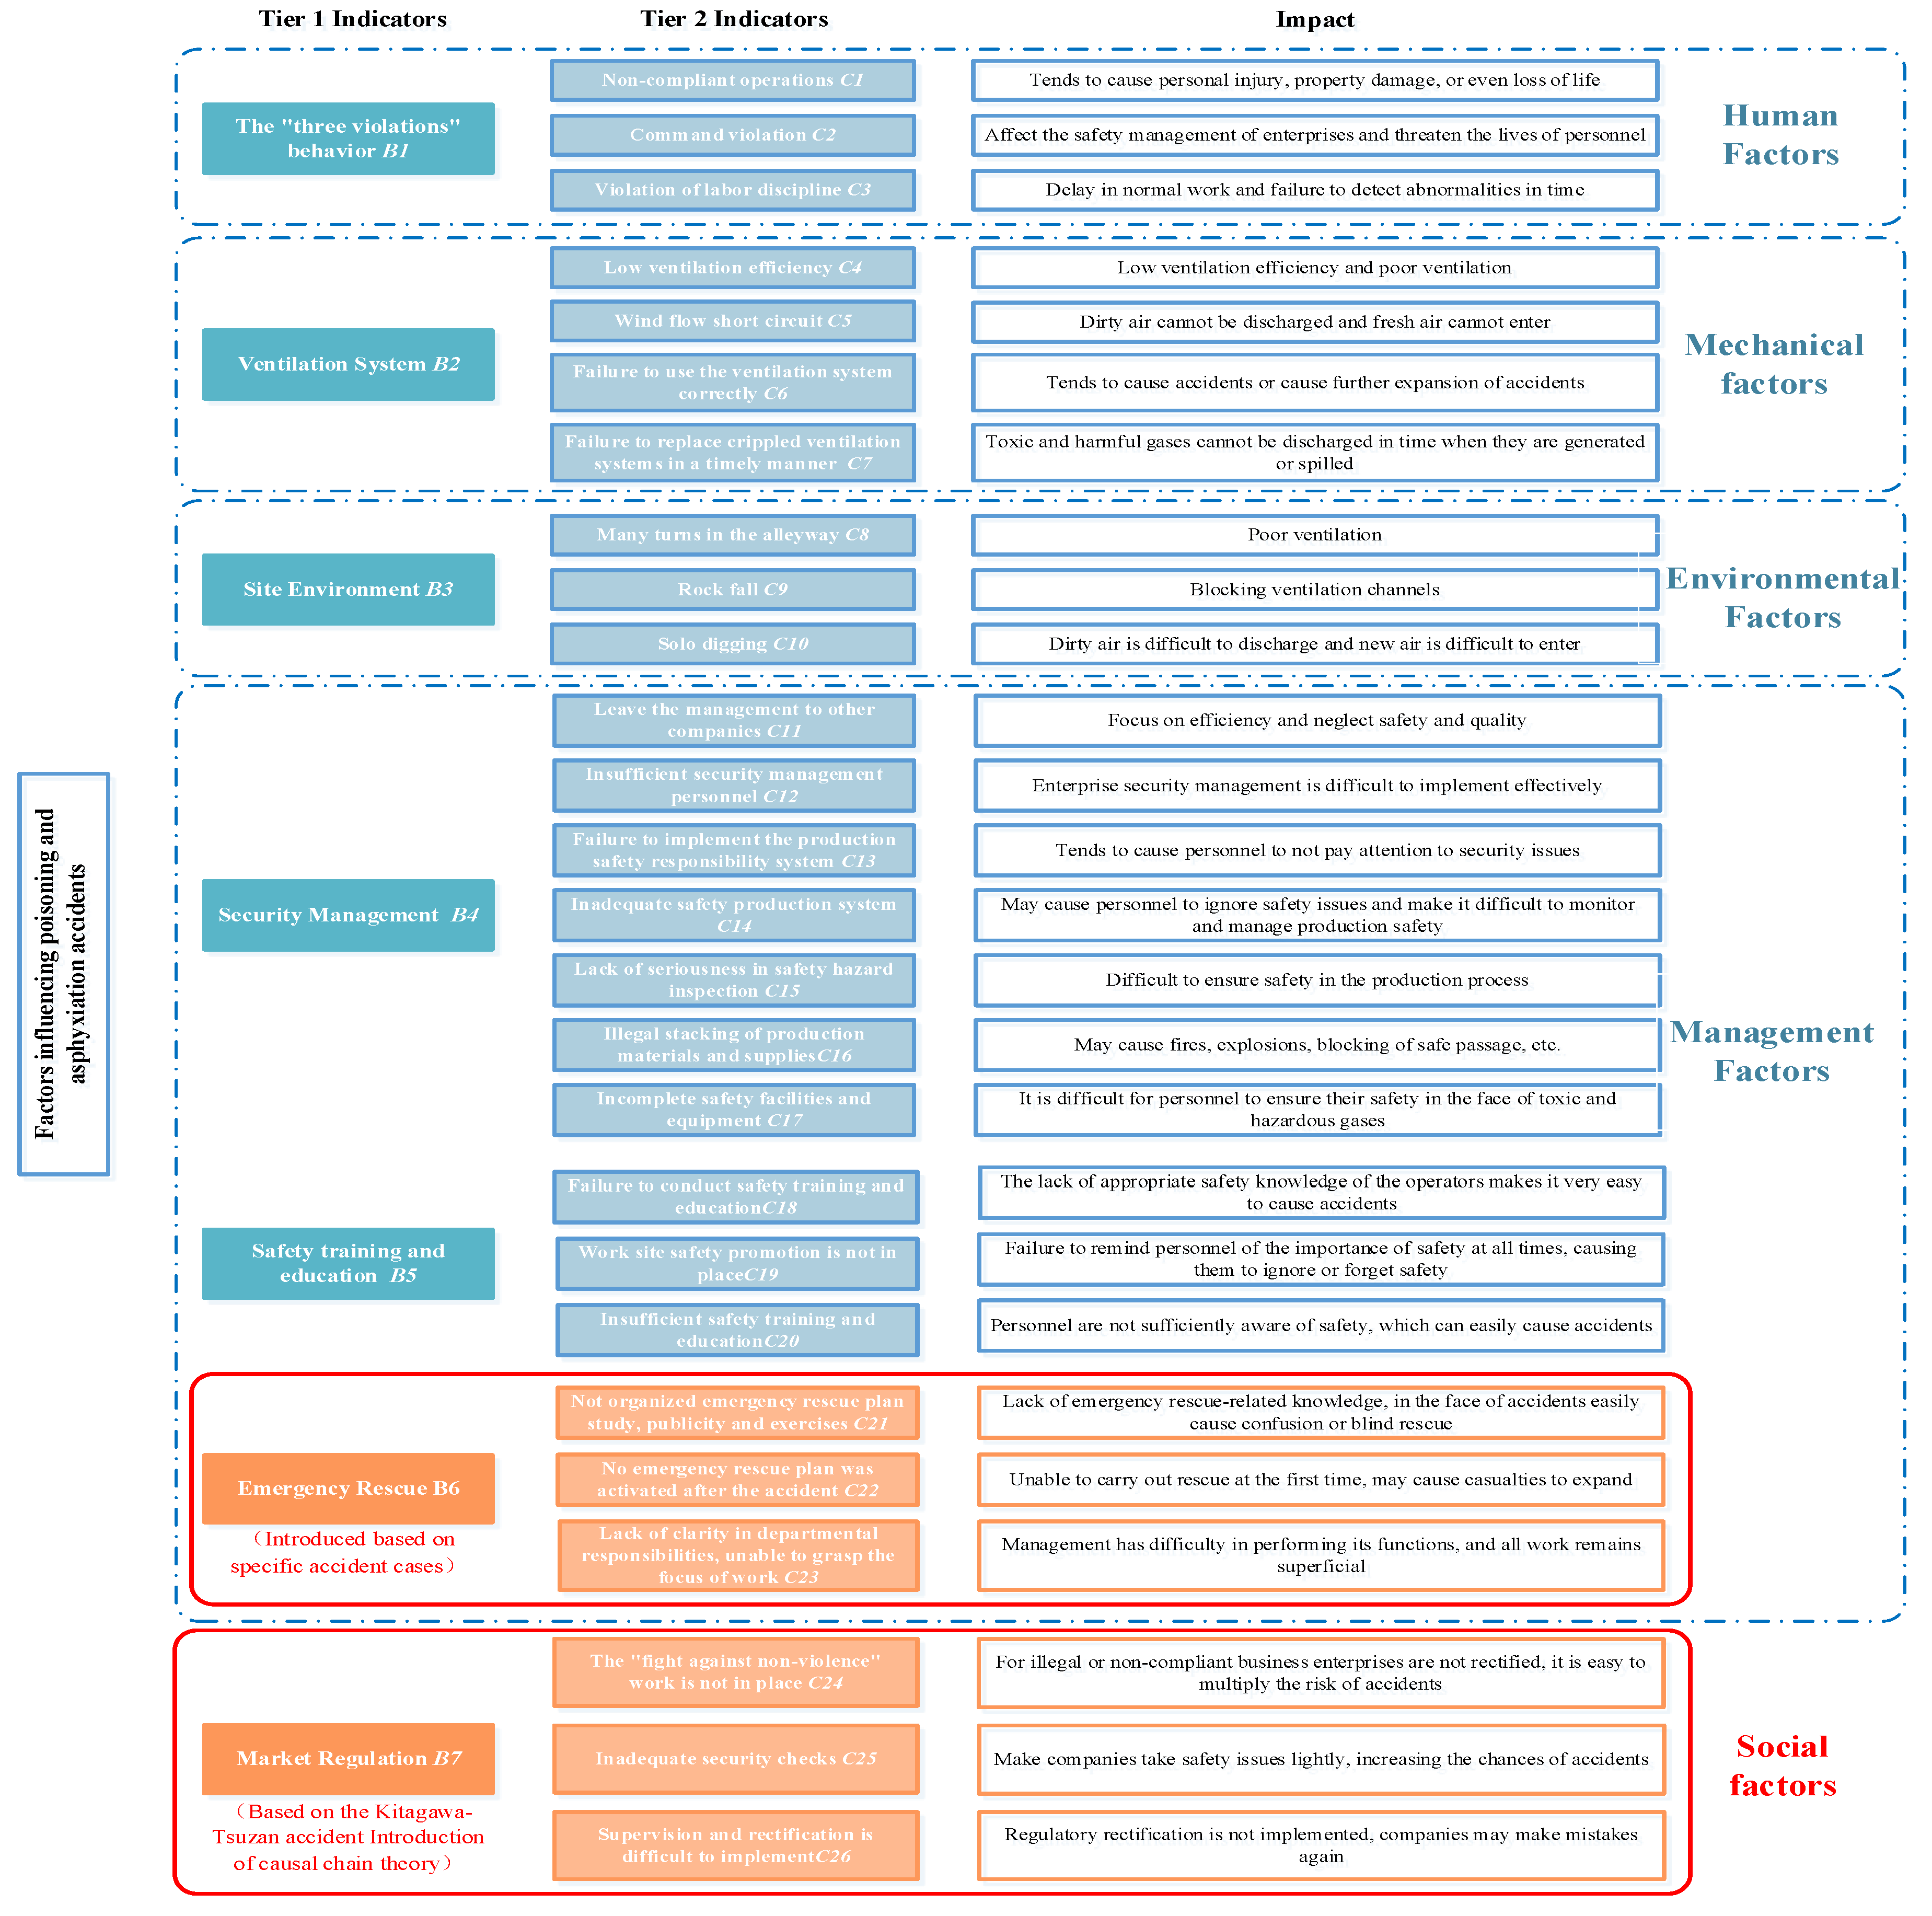
Appendix A Table A2 for details), the company studies the influence of accident factors in order of influence and compares and selects the combined allocation model. According to the accident investigation report, the main causes of the accident were poisoning and asphyxiation caused by carbon monoxide. Through the analysis of the accident case, combined with the evaluation index system in
Figure 2, we can understand that the top three first-level indicators with the greatest impact on this accident are safety management
B4, “three violations”
B1, and safety training and education
B5. The top three secondary indicators with the greatest impact on the mine are insufficient safety training and education
C20, non-compliance
C1, and poor implementation of safety production responsibilities
C13.
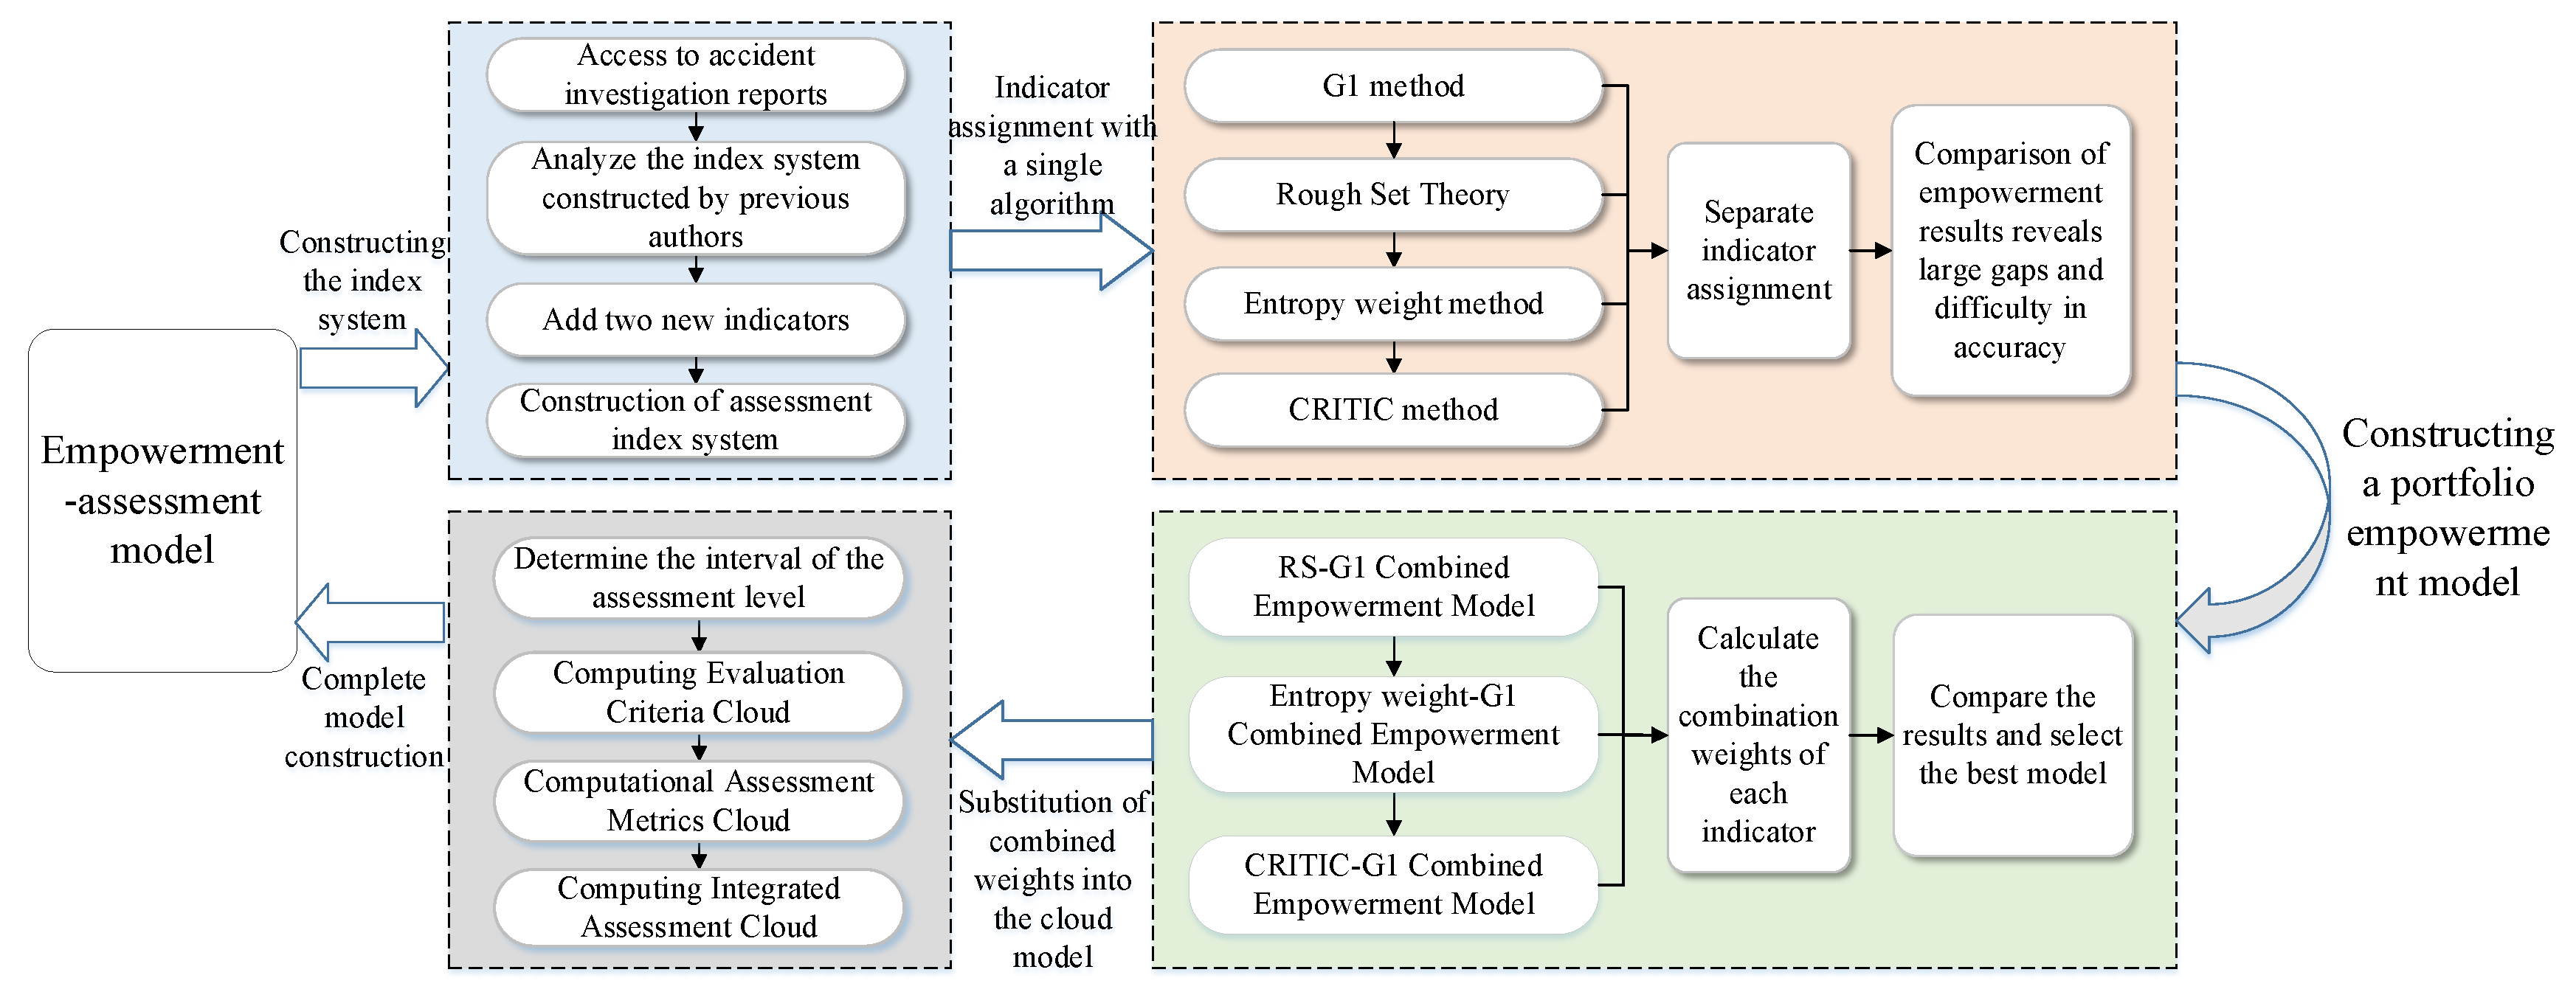
According to the theoretical knowledge of assignment methods in
Section 2.2, the G1 method, rough set theory, entropy method, and CRITIC method were used to assign weights to each influencing factor, and the calculation results are shown in
Table 4 and
Table 5.
By analyzing the statistical results of the weights in
Table 4 and
Table 5, the weight values obtained when one of the four allocation methods alone is used for weight calculation, whether it is subjective or objective distribution, are inconsistent. The weighted ranking obtained by the subjective G1 method is roughly the same as that obtained by the objective rough set method and the entropy method, while the weight ranking obtained by the CRITIC method is different from these three algorithms. In other words, the accuracy of the results cannot be guaranteed by either the subjective or objective assignment method when a particular algorithm is used alone, so the combination of the subjective and objective assignment methods is chosen to build a combined assignment model, considering both subjective and objective aspects, to improve the accuracy of the assignment results. To select the optimal combined assignment model, the four algorithms are combined two by two according to the combined weight calculation formula in
Section 2.2, and the weight values of each influencing factor are calculated. The specific results are shown in
Table 6 and
Table 7.
From the accident investigation report and consulting experts, we know that the weighting of the primary indicators of this accident is
B4 >
B1 >
B5 >
B2 >
B6 >
B7 >
B3. Due to a large number of secondary indicators, only the top three indicators of weighting are listed here, i.e.,
C20,
C13, and
C1. According to the calculation results of different combinations of weighting models shown in
Table 6 and
Table 7, the following conclusions can be drawn.
- (1)
In the weight statistics table of the first-level index, the weight ranking obtained by the RS-G1 combined weighting model is completely consistent with the actual situation. The weighted ranking obtained by the Entropy-G1 combinatorial weighting model is different from the actual situation. However, the ranking of the impact degree of the first-level indicators obtained by the CRITIC-G1 combined empowerment model is quite different from the actual situation. Therefore, the CRITIC-G1 combinatorial empowerment model is first excluded from combining the weighting of indicators.
- (2)
In the weight statistics table of the secondary indicators, it can be seen from the first three indicators with a large degree of influence listed that the results obtained by the Entropy-G1 combined weighting model are slightly different from the actual situation. The results obtained by the RS-G1 combinatorial empowerment model are completely consistent with the actual situation. Therefore, the RS-G1 combined empowerment method was finally adopted.
3.2. Accident Risk Level Assessment Results
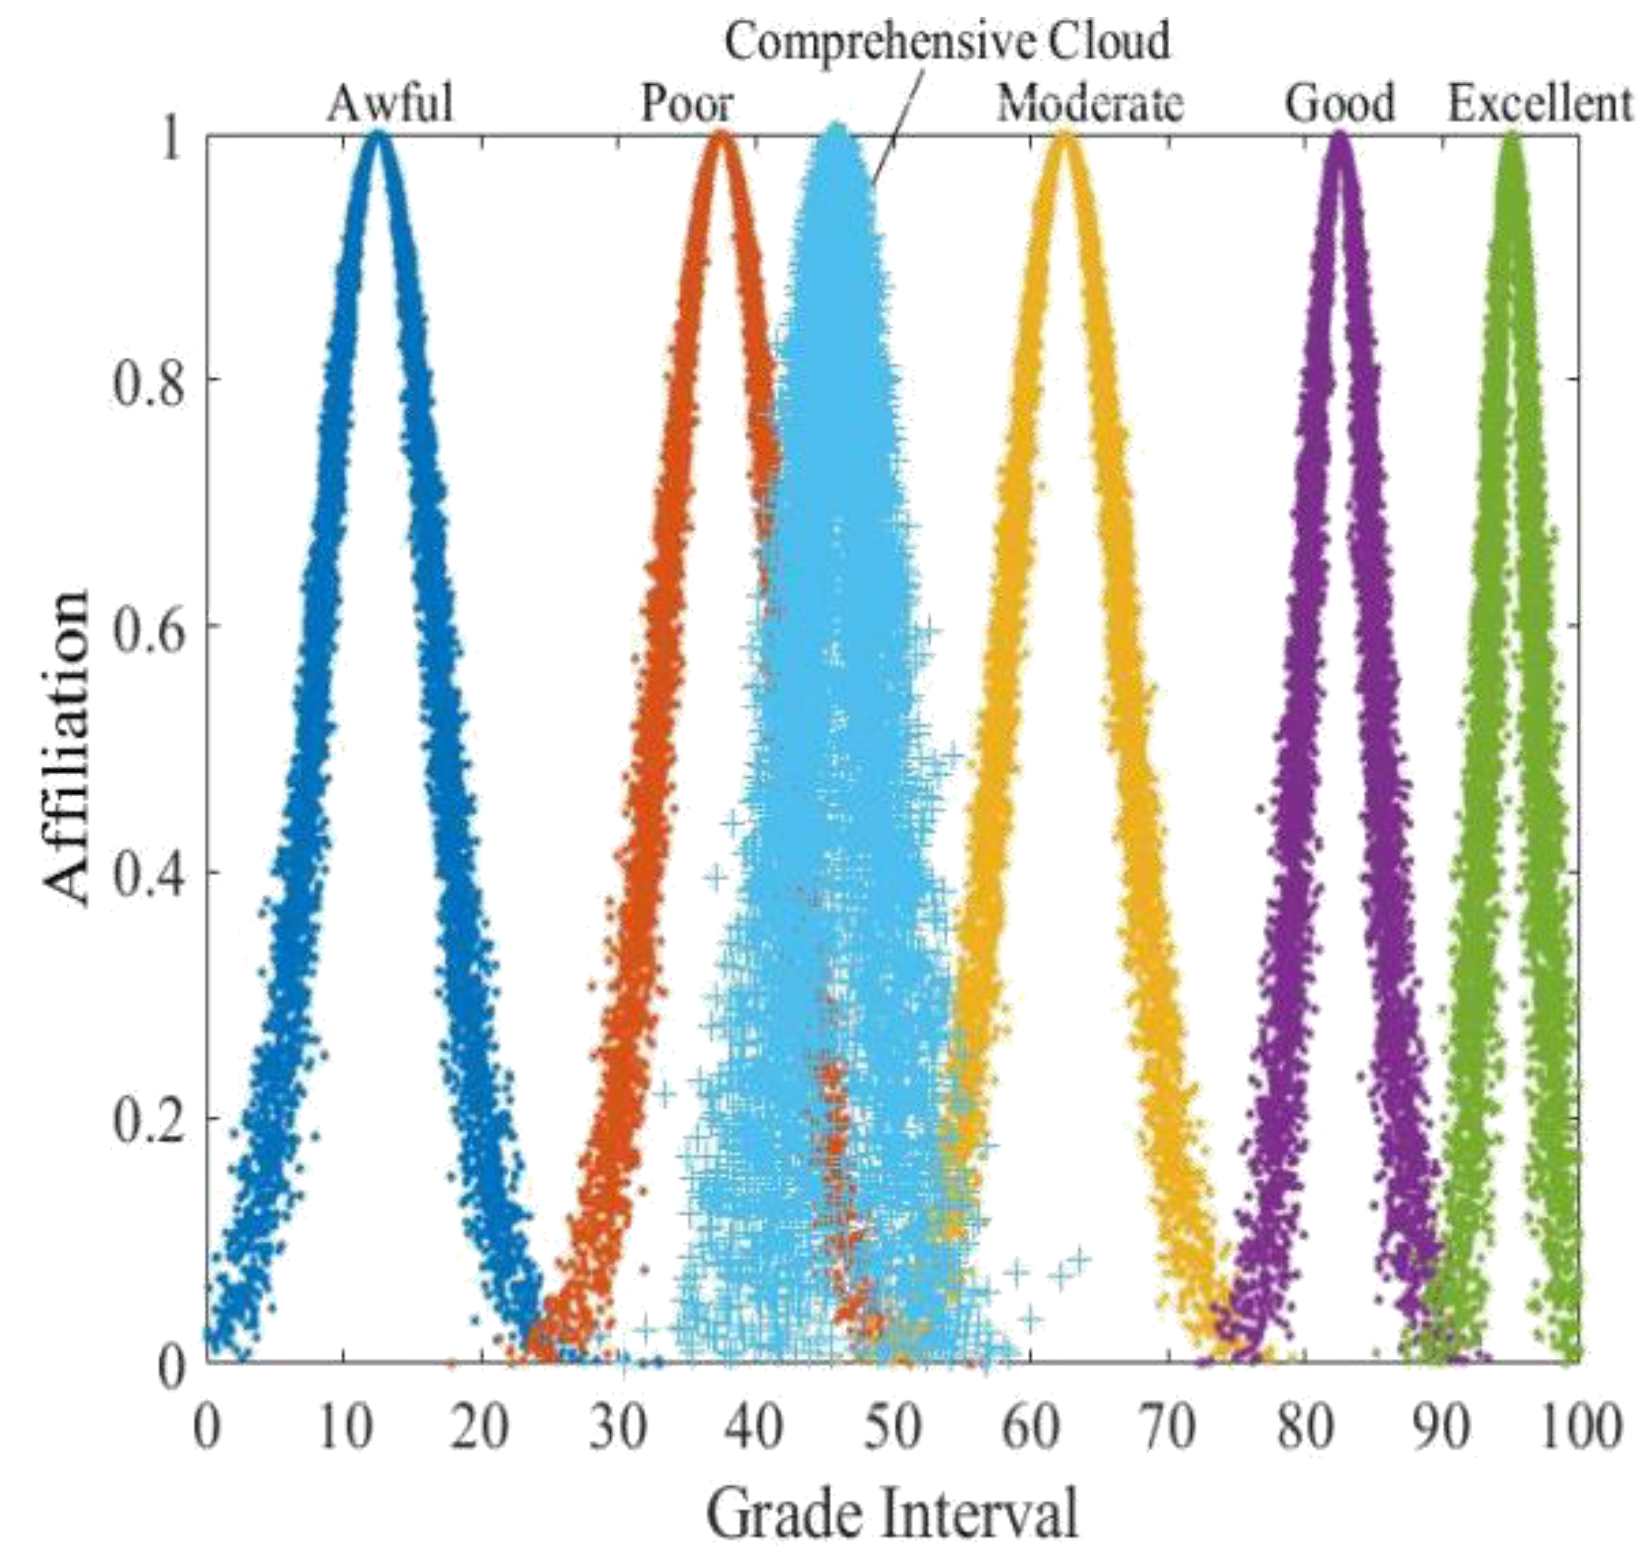
According to the accident classification of the Regulations on the Reporting and Investigation of Production Safety Accidents and the “blacklist” in the field of work safety released in 2022, the evaluation level range of the cloud model is divided according to the occurrence of accidents and the number of deaths: “awful” corresponds to major and particularly serious accidents (10 deaths or more), “poor” corresponds to major accidents (3~9 deaths), “moderate” corresponds to general accidents (1~2 deaths), “good” corresponds to accidents that occur but do not cause deaths, and “excellent” corresponds to no accidents. Since qualitative indicators are difficult to accurately quantify, the reference [
37] of this paper defines five risk assessment grade intervals. A 100-point system was used for judging, and five score intervals were quantified according to the principle that the greater the score, the smaller the risk. They are “awful”—[0, 25], “poor”—(25, 50], “moderate”—(50, 75], “good”—(75, 90], and “excellent”—(90, 100). According to Equation (2), we calculate the standard cloud corresponding to each grade interval. The specific evaluation level division is shown in
Table 8, and the corresponding cloud diagram is shown in
Figure 4.
Ten experts (see
Appendix A Table A3 for details) with in-depth research and work experience in underground mines were invited to score the indicators, build an evaluation matrix according to the scoring situation, and calculate the evaluation index cloud of each index according to Equation (3); the specific results are shown in
Table 9. The RS-G1 combined empowerment model selected in
Section 3.1 was combined with the cloud model to construct the empowerment rating model. First, the RS-G1 combinatorial weighting model was used to calculate the combined weight
Wj of each index. Then, the cloud model was used to calculate the evaluation index cloud
Cj (
Exj,
Enj,
Hej), and the combined weight
Wj and the evaluation index cloud
Cj (
Exj,
Enj,
Hej) were substituted together (4) to obtain the comprehensive assessment cloud
C (45.9, 2.4, 1.3) of the influencing factors of the mine poisoning asphyxiation. According to the characteristic parameters of the cloud model, the comprehensive evaluation cloud map was generated by MATLAB software. The risk level of the mine is judged by observing the fit between the “comprehensive cloud” and the five “standard clouds”. The final result is shown in
Figure 5.
According to the investigation report of the “3.10” poisoning and asphyxiation accident in Yaogang Xian mine, it is known that the accident caused eight deaths, which is a large accident, and the risk level corresponding to the large accident is “poor” according to
Table 8. The cloud model calculates an assessment cloud of
C (45.9, 2.4, 1.3), and
Figure 5 judges that the mine risk level is also “poor”. It shows that the evaluation results are consistent with the actual situation, which proves that the allocation rating model has strong reliability and practicability.
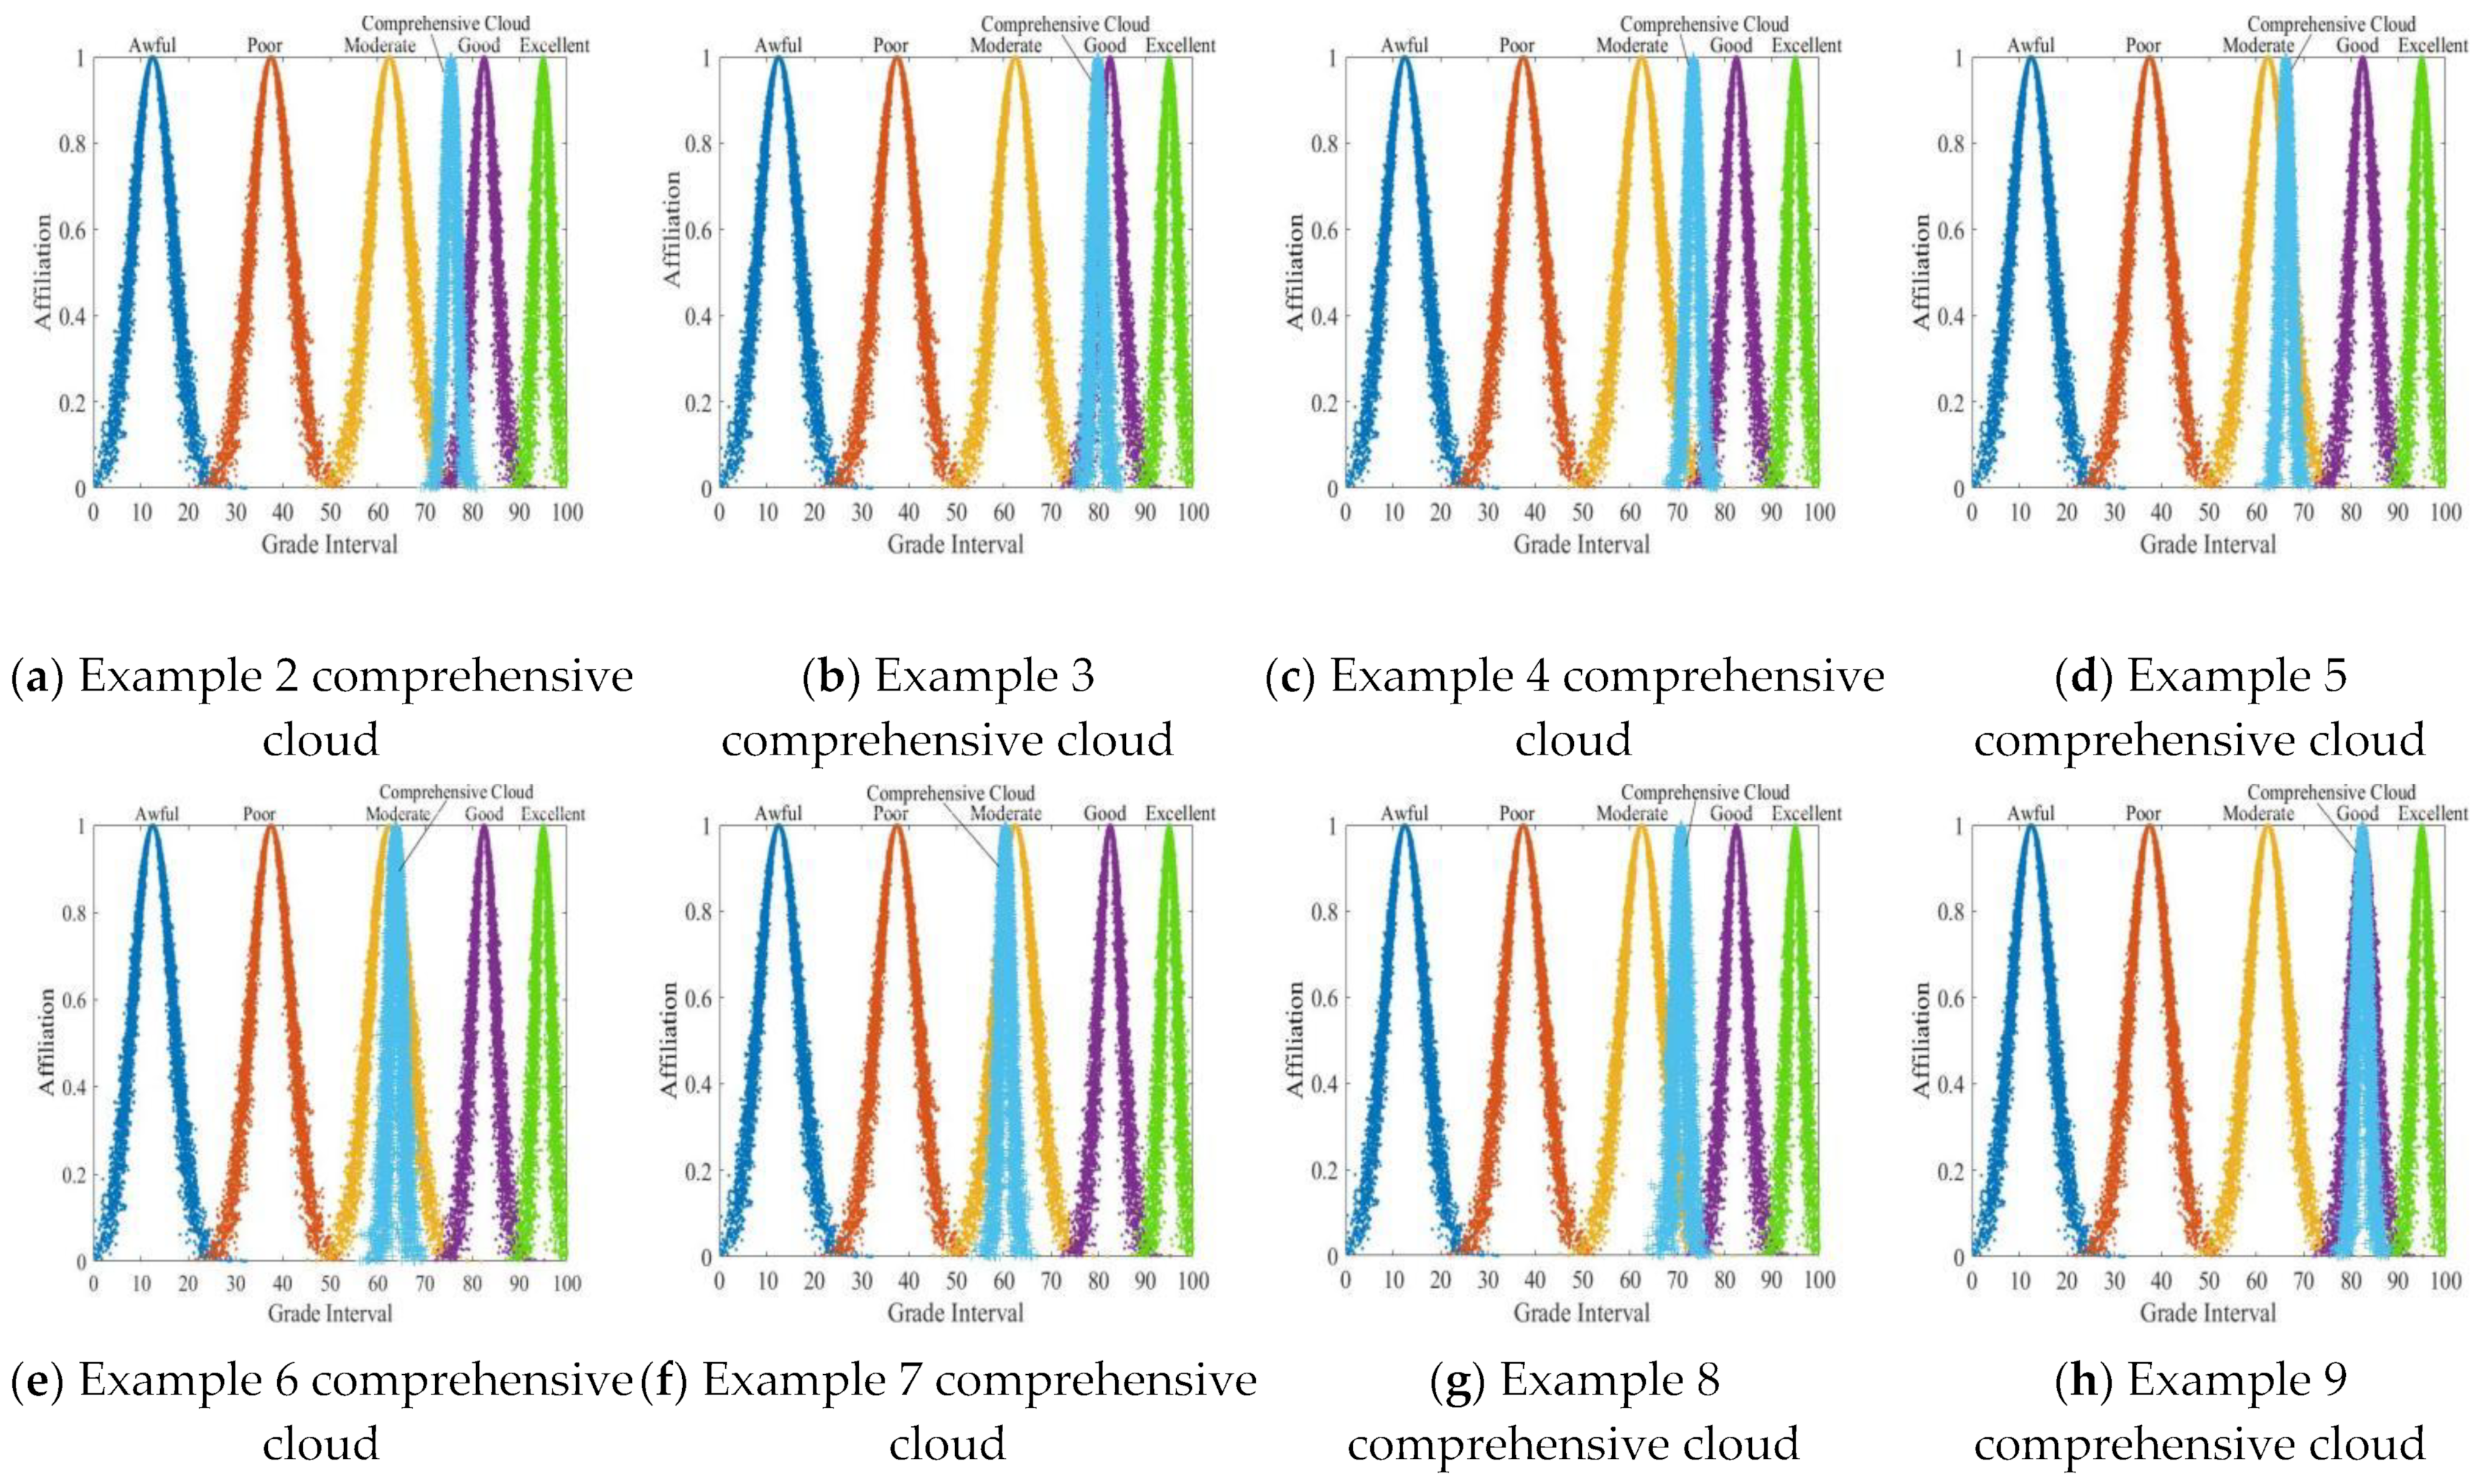
The comprehensive assessment cloud of the remaining mine instances can be calculated using the same method as Example 1. First, the RS-G1 combined empowerment model and the cloud model are used to construct the empowerment rating model. Then, we calculate the characteristic parameters of the comprehensive evaluation cloud model of each mine. Finally, MATLAB software is used to draw the corresponding cloud map. The comprehensive assessment cloud map of each mine can be obtained so that the risk level of each mine can be intuitively judged, and the specific results are shown in
Figure 6. As can be seen from
Figure 6, each mine is located in a different evaluation grade range due to the different evaluation comprehensive clouds calculated by it. The more the “synthetic cloud” fits into which “standard cloud”, the risk level of the mine is determined by which assessment level. As shown in
Figure 6a, the risk rating of the corresponding mine is “good”, and the risk level of the corresponding mine in
Figure 6d is “medium”.
3.3. Comparison and Analysis of CO Prediction Results
- (1)
Source of CO concentration data
According to the statistical results of 24 accident cases in
Table 1, CO is the main factor causing accidents. Therefore, the CO concentration after blasting the working face is estimated to predict the reasonable ventilation time after blasting.
The plateau mine has a high altitude, low air pressure, and low oxygen concentration, and the flue gas diffusion increases after blasting, and ventilation is difficult. Compared with non-highland mines, poisoning asphyxiation accidents are more likely to occur, and the consequences are more serious. Therefore, the highland underground mine located in the northwest is the object of study. It mainly adopts the ventilation mode of natural ventilation, central air intake, and two-wing pumping. Relevant instruments were used to measure the concentration data of toxic and harmful gases in the middle section and working area of the mine in the summer (August) and winter (December). Only CO concentration data after blasting the excavation face are used here. The data are shown in
Figure 7. After blasting the excavation face, the CPR-KF4 4-in-1 gas detector was used to record the data of CO concentration every 20 s, and the measurement time period was 17:16:36~17:33:18. Due to the limitations of the instrument and the consideration of safety factors, the valid data of CO concentration after blasting are not complete, but it can be seen that the overall CO concentration is decreasing, and for the convenience of subsequent calculation and plotting, the measurement time is indicated by serial number.
Because the measured sample size was large and the ventilation method did not change throughout the measurement process, only some of the measured data were selected as the original time series for the subsequent prediction of CO concentration. To obtain more accurate results, the influence of the number of data on the accuracy of the calculation results is determined first, and 5, 10, 15, 20, 25, and 30 data are selected as a group. The GM(1,1) model, the quadratic exponential smoothing method, and the ARIMA model were then applied to fit and predict the measured CO concentration. The posterior difference index and error evaluation index of the three methods were calculated, and the comparative analysis was carried out to select the best number of data and the optimal prediction method for prediction. Then, this method was used to make subsequent predictions and calculate the time when the CO concentration drops to the allowable value.
- (2)
The influence of the number of starting data on the accuracy of the results
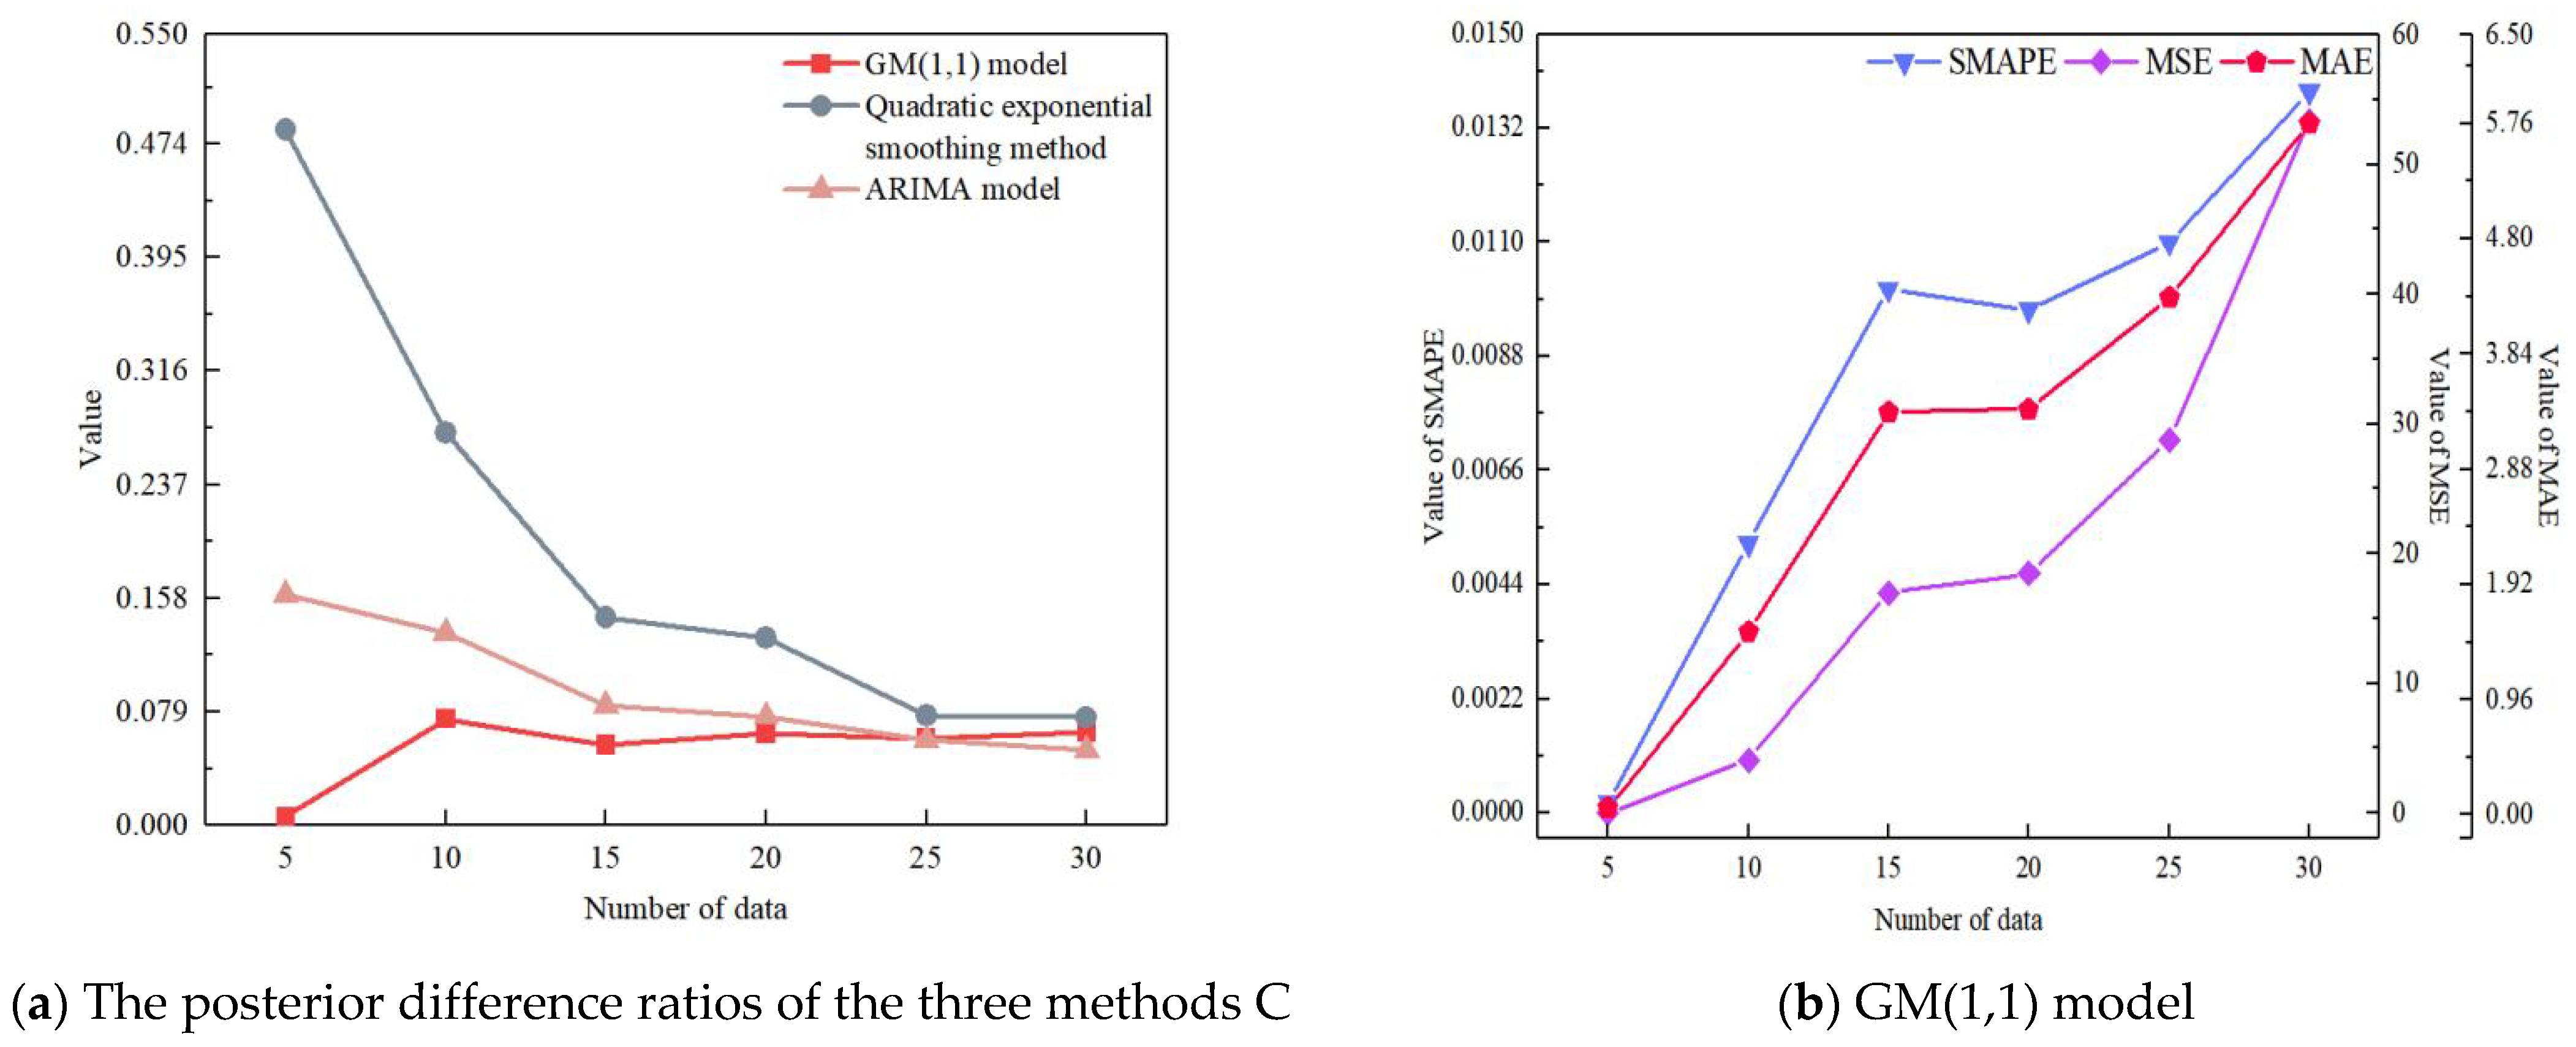
To investigate the influence of the number of data on the accuracy of the prediction results, the minimum number of data (5) required for prediction by the GM(1,1) model was used as the basis, and 5, 10, 15, 20, and 25 data were selected as a group. Three prediction methods were used to fit the prediction. The posterior difference indexes and error evaluation indexes of the three prediction methods were calculated according to the results of the fitted prediction, and the accuracy was compared. The results are shown in
Figure 8.
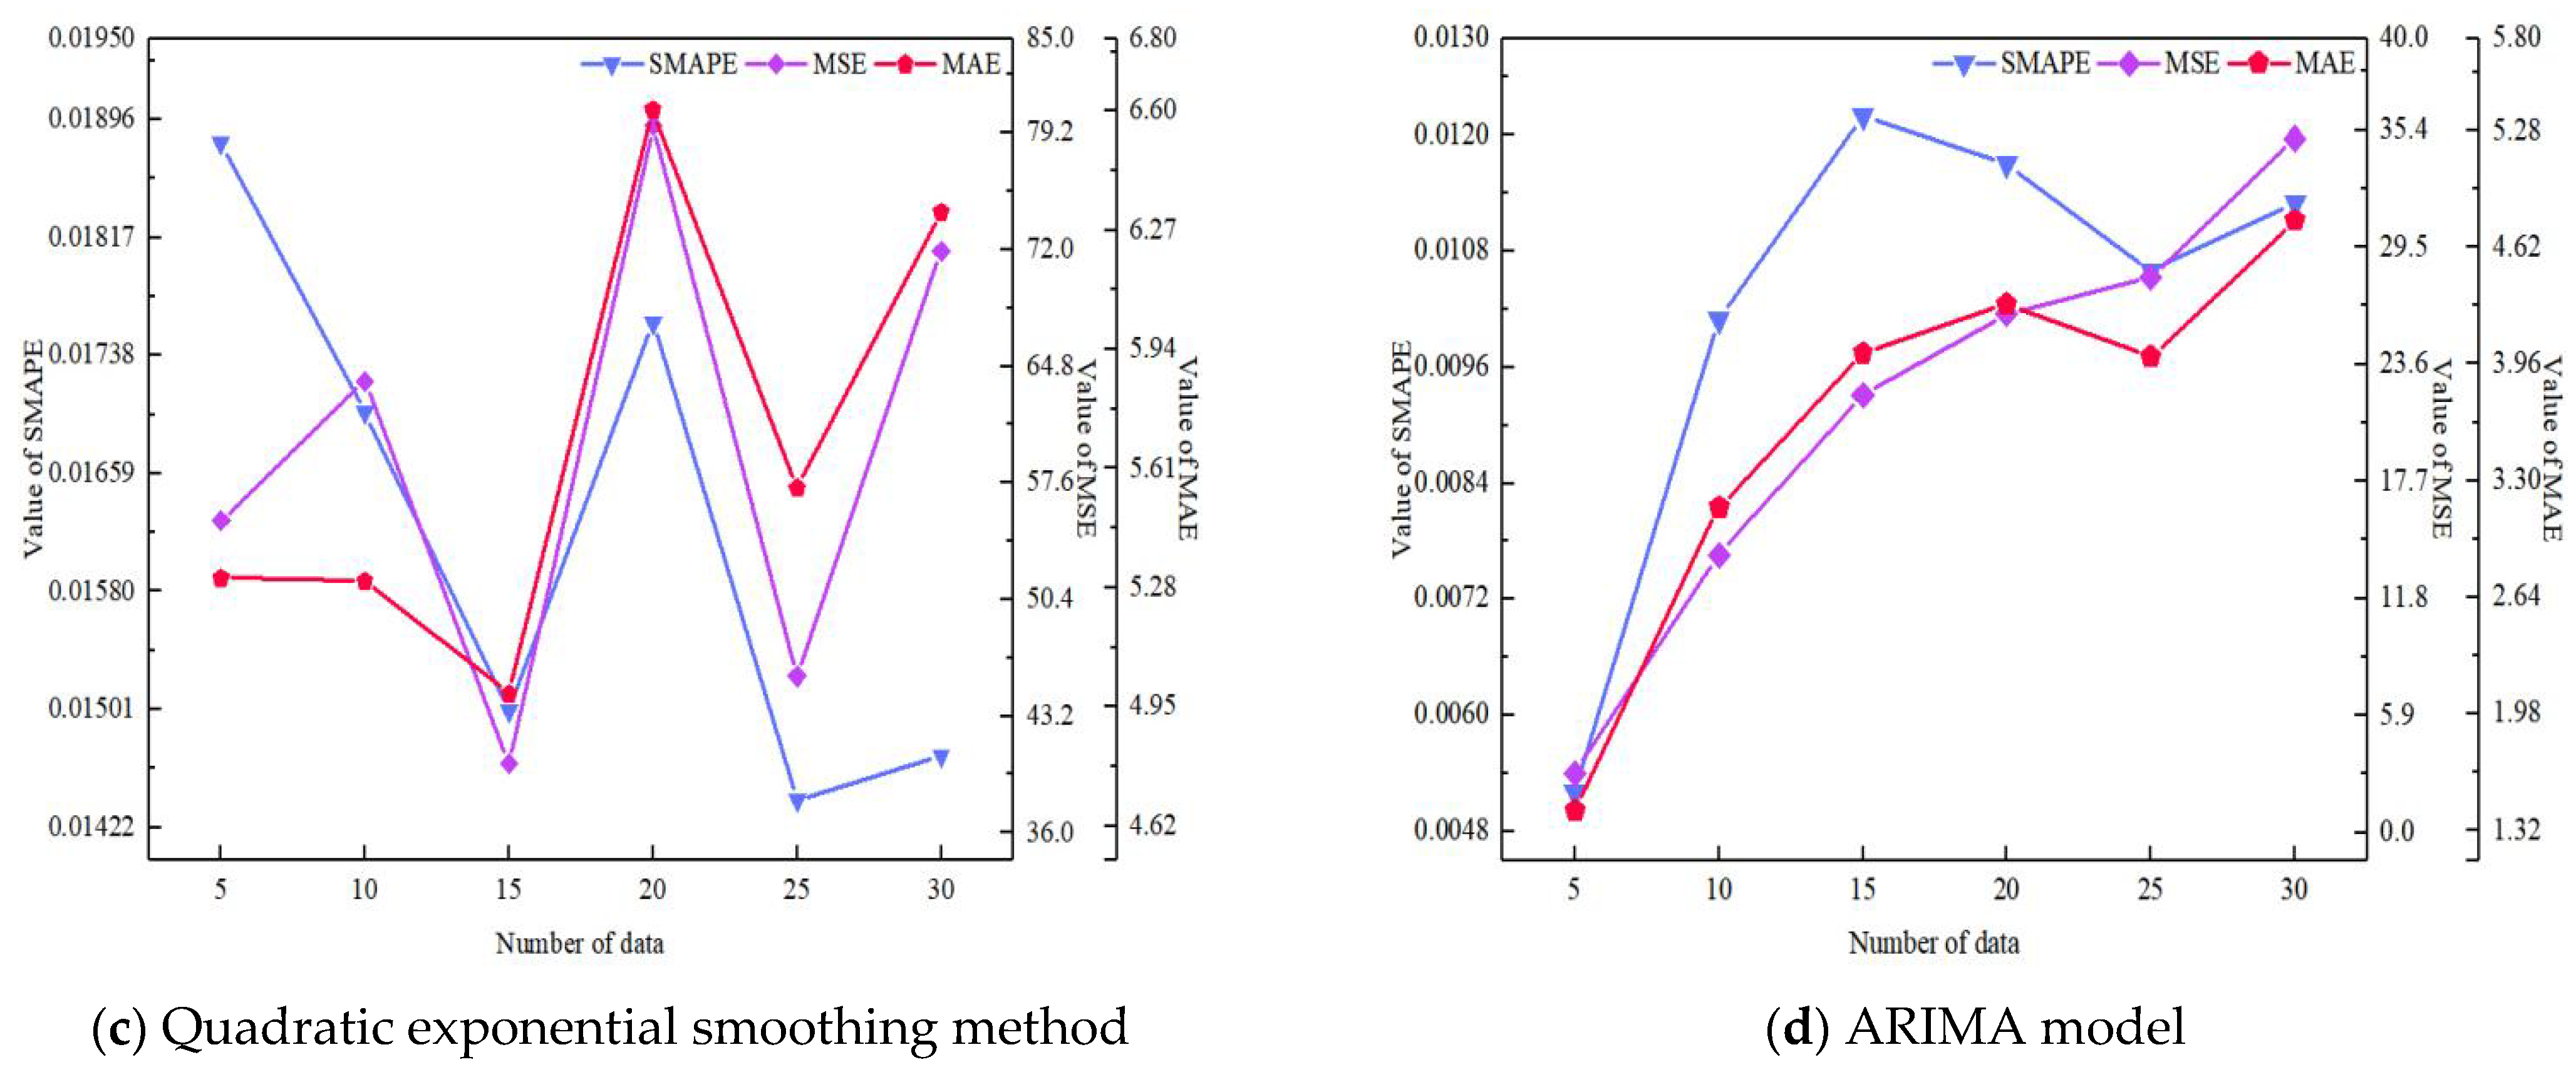
It can be seen from
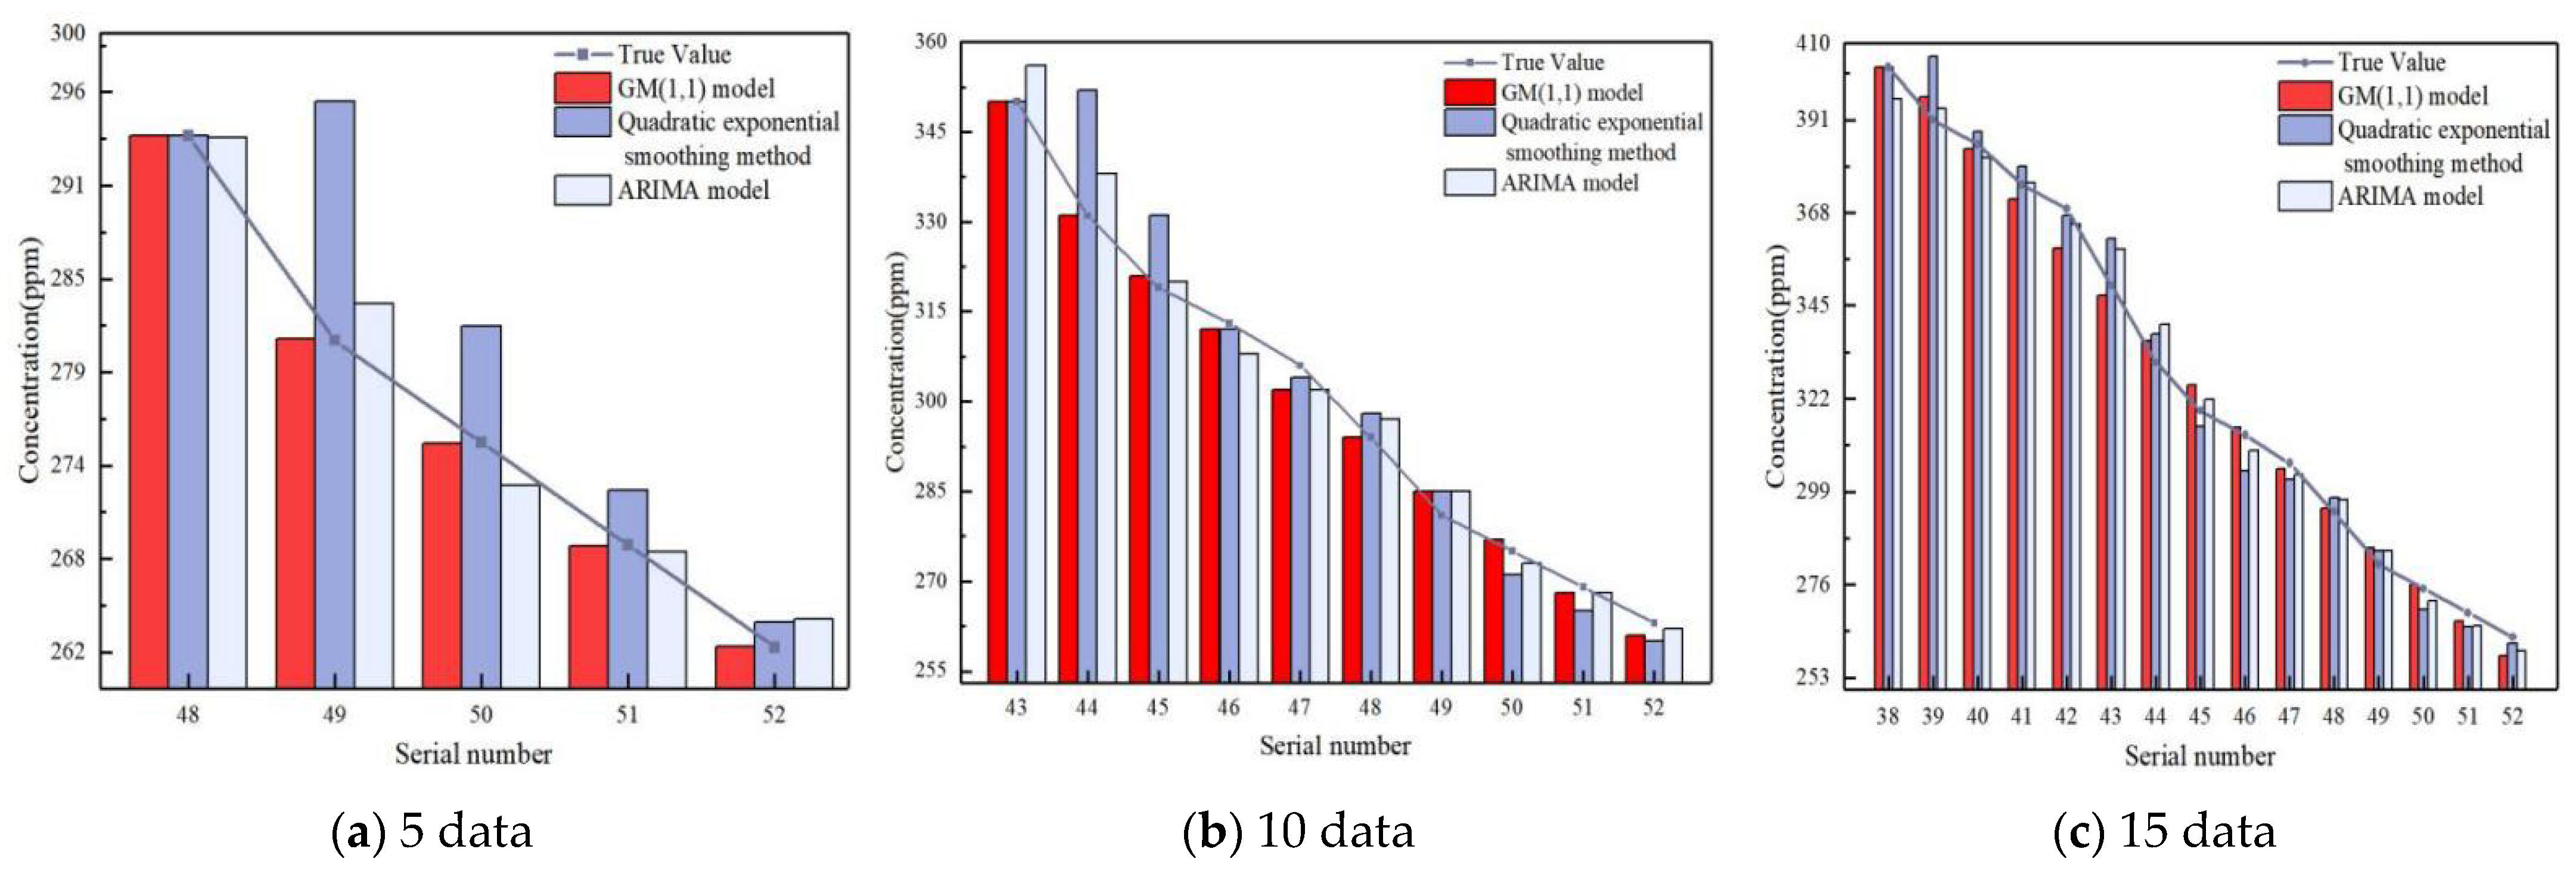
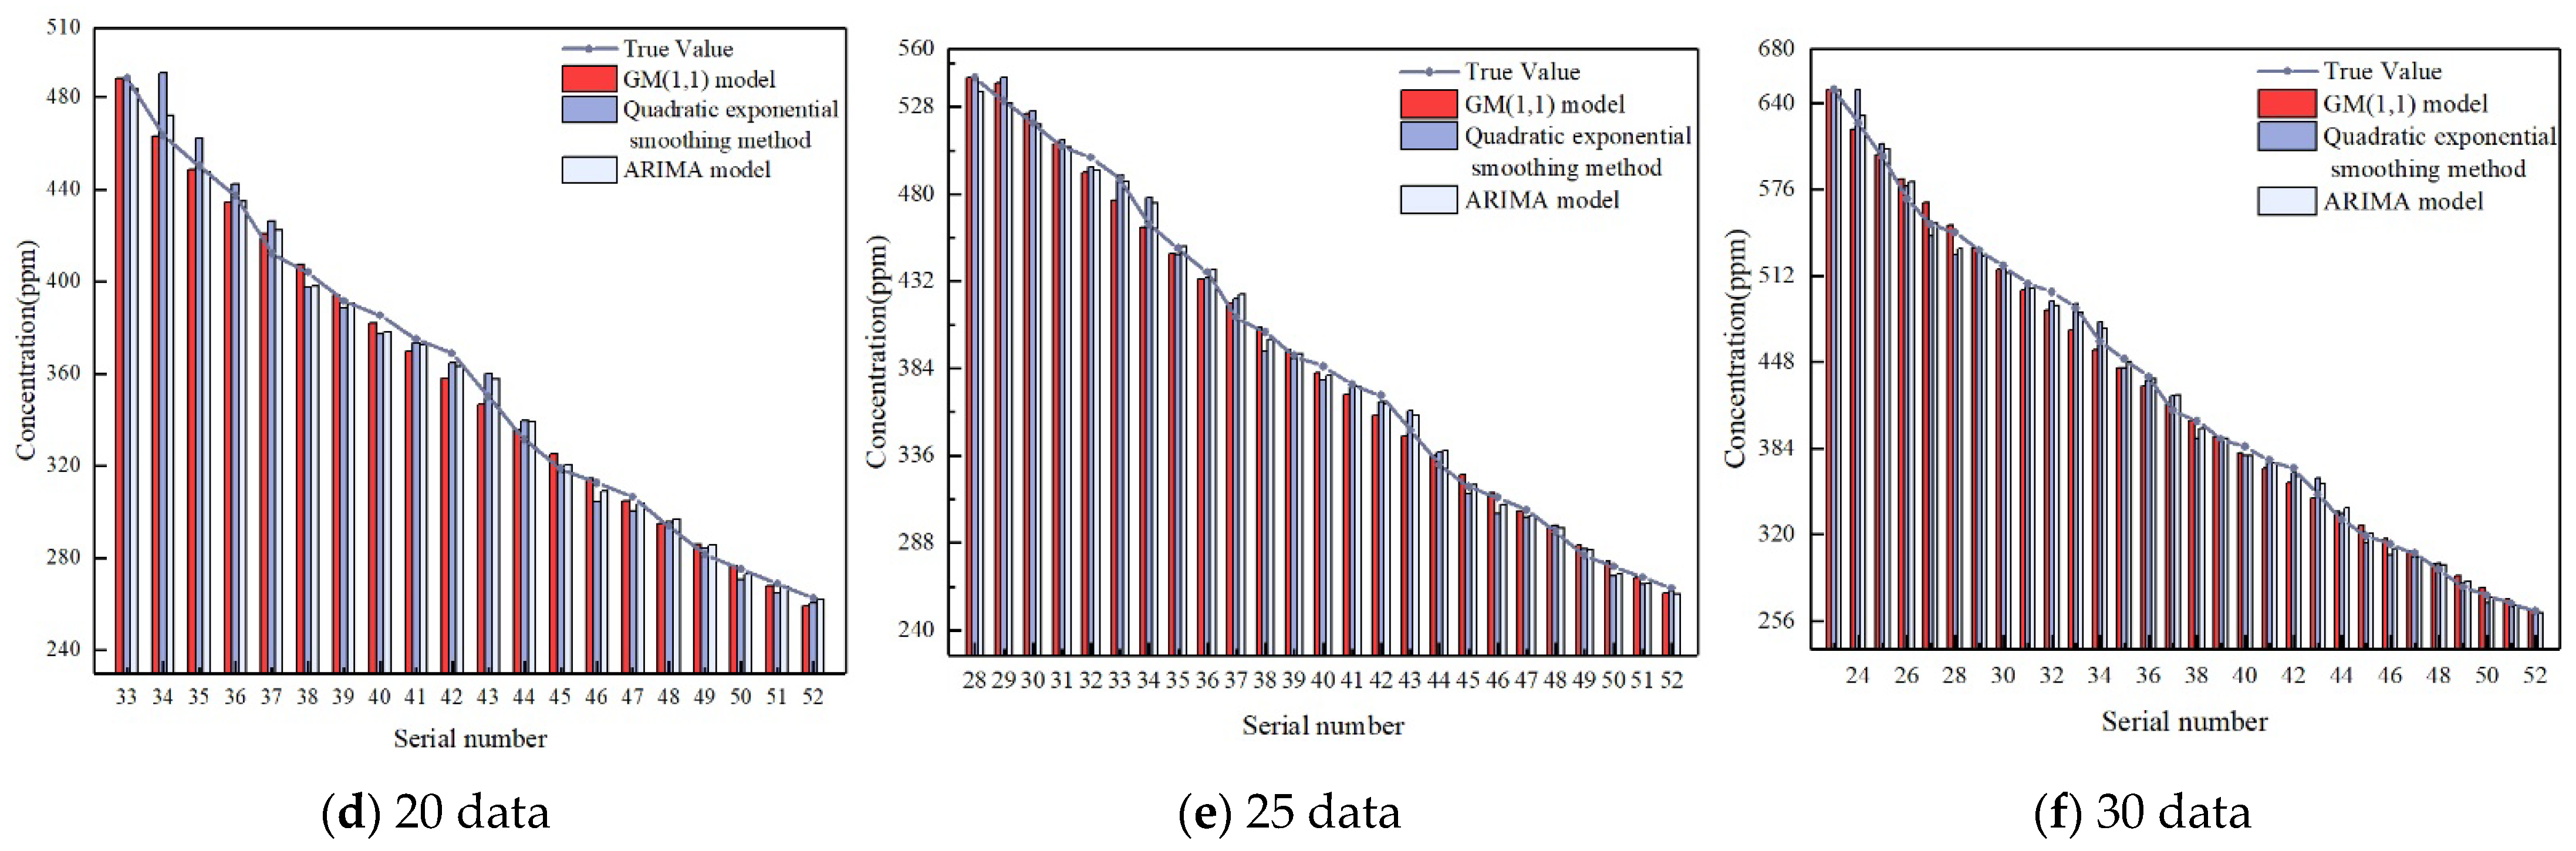
Figure 8 that with the increase in the number of data, the posterior difference ratio of the GM(1,1) model does not change significantly linearly, and the SMAPE value, MSE value, and MAE value all increase linearly. The posterior difference ratio of the quadratic exponential smoothing method and the ARIMA model showed a linear downward trend, and the three errors of the quadratic exponential smoothing method increased linearly. The three errors of the ARIMA model fluctuate without obvious change rules. It can be seen that the influence of the number of data on accuracy cannot be derived from the change in accuracy. As a result, the optimal number of data for the prediction cannot be determined, and further comparative analysis is required. Therefore, the fitting effect of the three prediction methods under different numbers of data is plotted. Due to the large amount of data, only 5 data, 10 data, and 15 data are displayed here. The results are shown in
Figure 9.
According to
Figure 9, as the number of data increases, the fitting effect of the prediction using the three methods gradually becomes better, but combined with the calculation results of the posterior differences and errors in the previous section, no valid conclusion can be drawn to illustrate the effect of the number of data on the accuracy of the prediction results. Therefore, it is still necessary to analyze the influence of the number of data on the accuracy of the results by combining the specific values of the posterior difference ratio
C and the three errors of SMAPE, MSE, and MAE. From the principles of SMAPE, MSE, and MAE, it is known that the smaller the value of the errors, the higher the accuracy, and then combined with
Figure 8 and
Figure 9, it is finally determined that the results obtained when the number of data is 15 are the most accurate, so these 15 data with serial numbers 38~52 are used as the original time series for the subsequent prediction calculation.
- (3)
Comparison of the prediction effects of three time series forecasting methods
The data with serial numbers 38~52 were selected as the original time series, and three forecasting methods were used to fit the forecast. Error bars represent the error between the real value and the fitted value. The longer the error bar, the greater the difference between the fitted value and the true value. The final result is shown in
Figure 10.
It can be seen from the fitting effect diagram of the three methods that when forecasting with the original time series composed of 15 data, the fitting effect of the three forecasting methods is better, and the difference between the prediction results is not obvious. For this reason, it is necessary to combine the specific results of the posterior difference and error for further analysis and comparison, as shown in
Table 10.
As can be seen from
Table 10, the GM(1,1) model was used to fit the CO concentration, and the posterior difference ratio C, symmetric mean absolute percentage error (SMAPE), mean square error (MSE), and mean absolute error (MAE) of the obtained results were the smallest among the three prediction methods. The GM(1,1) model was finally selected for the subsequent CO concentration prediction in combination with the results of the posterior difference test.
Without changing the ventilation method, using the GM(1,1) model, it can be calculated that after blasting at the excavation workface, it takes 43 min for the CO concentration to drop to the CO concentration (24 ppm) allowed for safe production in the mine, which means that after blasting at the excavation workface, ventilation is required for 43 min before the operator can continue production operations. After reviewing the relevant mine blasting safety operation procedures, we learned that after underground blasting in metal and non-metal mines, ventilation is generally required for more than 30 min if the ventilation conditions are good, or 2 h if the ventilation conditions are poor. Therefore, the results obtained by prediction in this paper are consistent with the actual mine safety production regulations.


