Article

Solar-Powered Direct Contact Membrane Distillation System: Performance and Water Cost Evaluation

1
Mechanical Engineering Department, Mehran University of Engineering and Technology, Shaheed Zulfiqar Ali Bhutto Campus, Khairpur Mirs 66020, Pakistan
2
Department of Mechanical Engineering, Baluchistan University of Information Technology, Engineering and Management Sciences, Quetta 87300, Pakistan
3
Department of Mechanical and Energy Systems Engineering, Faculty of Engineering and Informatics, University of Bradford, Bradford BD7 IDP, UK
4
Department of Physics and Astronomy, College of Science, King Saud University, Riyadh 11451, Saudi Arabia
*
Author to whom correspondence should be addressed.
Sustainability 2022, 14(24), 16616; https://doi.org/10.3390/su142416616
Submission received: 25 October 2022 / Revised: 17 November 2022 / Accepted: 9 December 2022 / Published: 12 December 2022
(This article belongs to the Section Sustainable Water Management)

Abstract

:
Fresh water is crucial for life, supporting human civilizations and ecosystems, and its production is one of the global issues. To cope with this issue, we evaluated the performance and cost of a solar-powered direct contact membrane distillation (DCMD) unit for fresh water production in Karachi, Pakistan. The solar water heating system (SWHS) was evaluated with the help of a system advisor model (SAM) tool. The evaluation of the DCMD unit was performed by solving the DCMD mathematical model through a numerical iterative method in MATLAB software®. For the SWHS, the simulation results showed that the highest average temperature of 55.05 °C and lowest average temperature of 44.26 °C were achieved in May and December, respectively. The capacity factor and solar fraction of the SWHS were found to be 27.9% and 87%, respectively. An exponential increase from 11.4 kg/m2·h to 23.23 kg/m2·h in permeate flux was observed when increasing the hot water temperatures from 44 °C to 56 °C. In the proposed system, a maximum of 279.82 L/day fresh water was produced in May and a minimum of 146.83 L/day in January. On average, the solar-powered DCMD system produced 217.66 L/day with a levelized water cost of 23.01 USD/m3.

1. Introduction

A sustainable energy supply, an adequate potable water source, and efficient environmental protection are essential elements for the socioeconomic growth of a country [1]. Regrettably, numerous under-developed and developing countries worldwide are lacking these essential elements [2]. Pakistan is also among the developing countries which are suffering greatly from energy crises, water shortages, and environmental pollution. In Pakistan, the potable water shortage has critically increased with the increase in population and urbanization. The potable water resources in the country are limited and depleting. Fortunately, the southern region of Pakistan is located on the Arabian sea, and hence, seawater is abundantly available in the country; however, the salt concertation of seawater is generally higher (35 g/L) compared to potable water. The World Health Organization (WHO) reported that water is considered drinkable if it contains 500 parts per million (ppm) or 0.5 g/L [3]. This could be achieved by seawater desalination, which could be an opportunity to overcome potable water shortages in the country.
Desalination processes can be divided into two broad categories, which are thermally driven desalination and membrane-based desalination, as presented in Figure 1. The thermally driven desalination processes use heat energy to evaporate seawater and subsequently condense it to produce potable water. In membrane-based water purification processes, the pressurized water passes across a membrane. It is important to mention here that thermally driven desalination technologies are energy-intensive [4]. In comparison, the energy consumption of membrane-based desalination technologies is quite less. This is the reason that membrane-based desalination technology is widely used worldwide. It has been reported that fresh water produced by membrane-based desalination was 68% and 30% by thermally driven desalination technologies and 2% through other technologies globally in 2015 [5]. Among the membrane desalination technologies, reverse osmosis (RO) is the most widely used technology. However, membrane distillation (MD) has received great attention in the past decade.
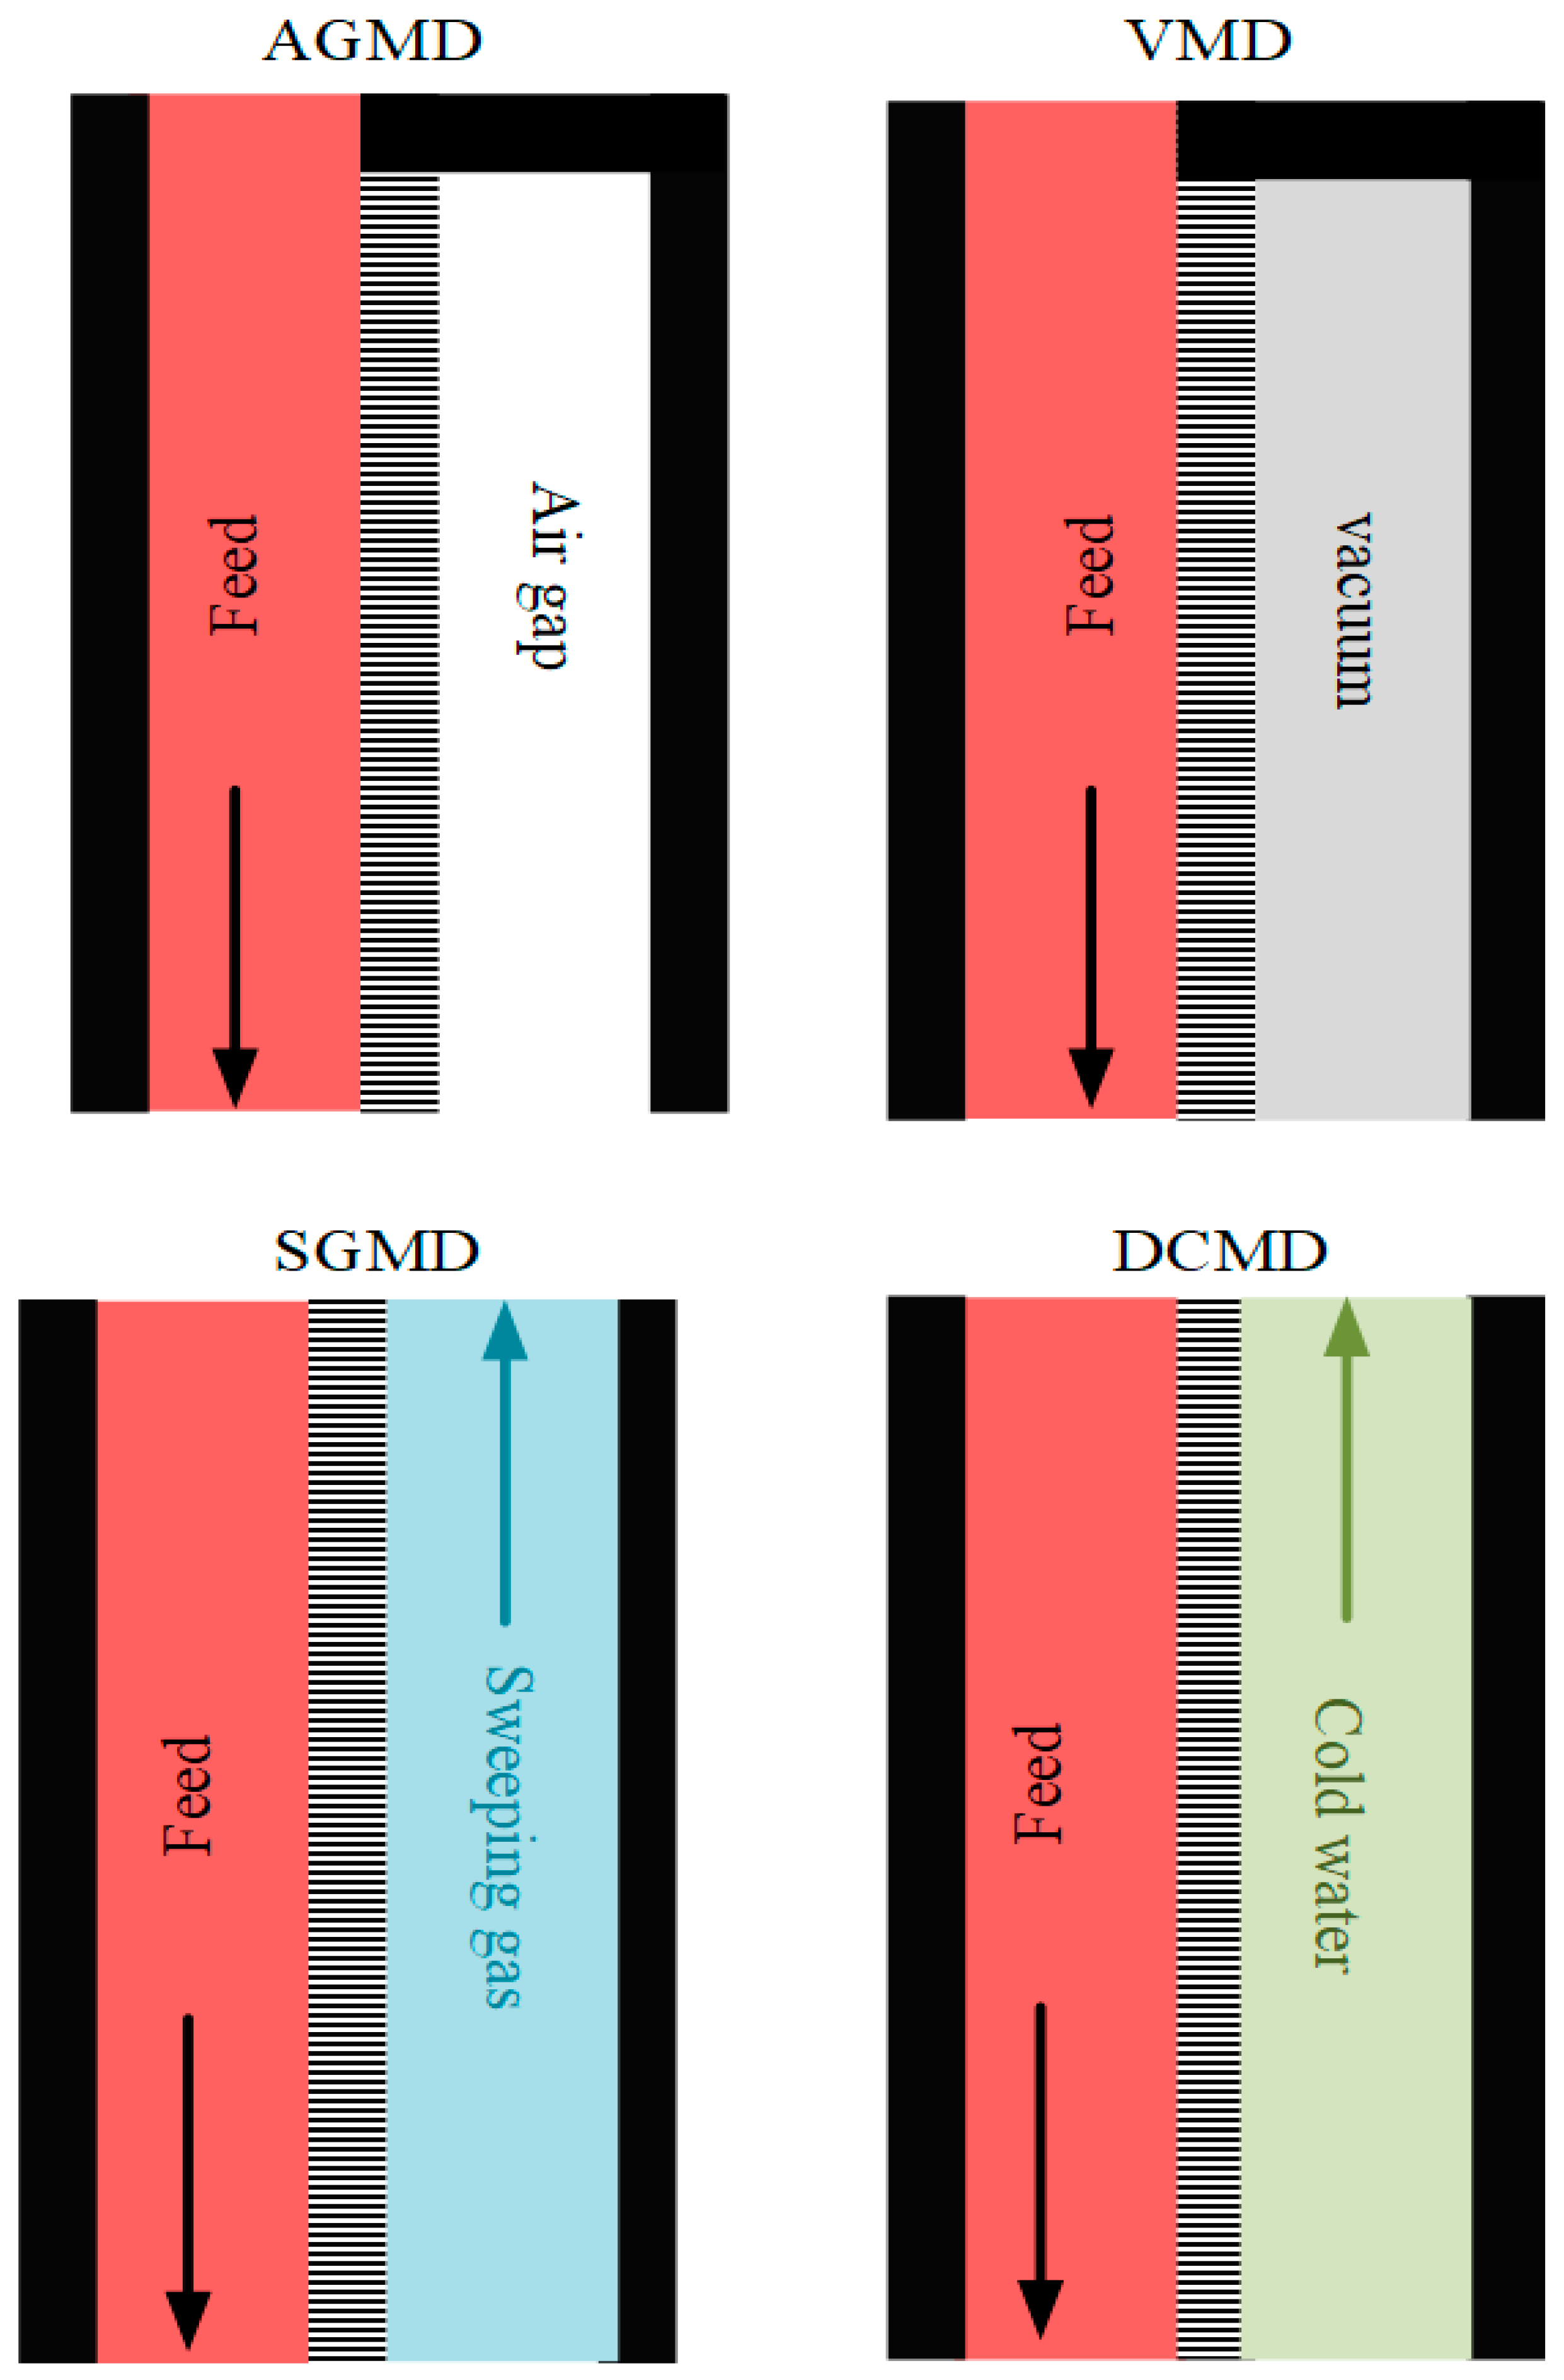
In MD, water vapors pass from one side of a hydrophobic membrane to another. The driving force behind this transportation is provided by the pressure gradient between the two sides. The pressure gradient is generated by the temperature difference between both streams. The basic classification of MD is direct contact MD (DCMD), air gap MD (AGMD), sweeping gas MD (SGMD), and vacuum MD (VMD), as shown in Figure 2 [6]. It is pertinent to mention here that the most investigated configuration is DCMD compared to the others [6]. In DCMD, feed (hot) water flows through one side, and permeate (cold) water flows on the opposite side of a hydrophobic membrane, but both are directly in contact with the membrane; this is the reason that it is known as direct contact MD. In DCMD, feed water evaporates, the vapors transport over its membrane, and condensation occurs subsequently at the permeate side to produce fresh water. The applications of DCMD include seawater desalination, food industries, medical fields, and environmental applications [7]. The advantages of DCMD are (i) low operating temperature, (ii) low operating pressure, (iii) 99.9% rejection ratio, (iv) less sensitive to feed concentration, and (v) coupling with low-grade heat and/or renewable energy resources [4].
The drawbacks of DCMD include high energy consumption and conductive loss. Although the high energy consumption is the foremost challenge of DCMD, in spite of that, the deployment of low-grade energy (such as waste thermal energy) and renewable energy sources (such as solar and geothermal) makes the DCMD system feasible for operation even at a low temperature [6]. It is worth noting that solar energy is one of the most powerful, environmentally friendly, and sustainable resources of energy on the Earth; therefore, solar-assisted DCMD is of particular interest in the most recent research.
Several researchers have investigated solar-powered/integrated membrane distillation for different regions of the world [8,9,10,11,12,13,14], as summarized in Table 1. Pal and Manna used three different types of membranes in a membrane distillation system and successfully separated almost 100% of arsenic from contaminated groundwater [8]. A novel approach was adapted to recover energy and reduce the energy consumption by 55% by increasing the collector area [9]. In addition, the performance of MD systems was improved with the arrangement of heat recovery devices (HRD) [11], using a number of MD modules in stages [12] and increased solar collector area [13]. Moreover, an integrated solar tower power plant with DCMD systems produced fresh water cost-effectively [14].
However, to the best of our knowledge, solar-powered/integrated membrane distillation has not been reported for Pakistan to cope with the energy and fresh water crises in the country. Since Pakistan lies in the sunbelt, the solar radiations are high with long sun shining hours. Therefore, this work aims to present the performance and cost evaluation of a solar-powered direct contact membrane distillation (DCMD) unit for fresh water production in Karachi, Pakistan. The solar-powered DCMD system consists of two units: a solar water heating system (SWHS) and a DCMD. The SWHS was simulated with the help of system advisor model (SAM v2017.9.5, Sindh, Pakistan ) software. Based on the location and its metrological conditions, temperature-varying seawater was introduced into the SWHS with an auxiliary heater to maintain the required temperature. To produce fresh water, the outlet seawater from the SWHS was directed into the DCMD. MATLAB (R2018b) software was used to solve the mathematical model for the evaluation of the DCMD system. The solar-powered DCMD system’s performance is reported here in terms of hot water delivered, specific thermal energy consumption (STEC), solar fraction, permeate flux (J), evaporation efficiency (EE), and monthly average fresh water production. Moreover, a water cost evaluation of the proposed system was also carried out to determine the capital cost of the system and water production cost (WPC) in terms of levelized water cost (LWC).

2. Solar Energy Potential in Pakistan

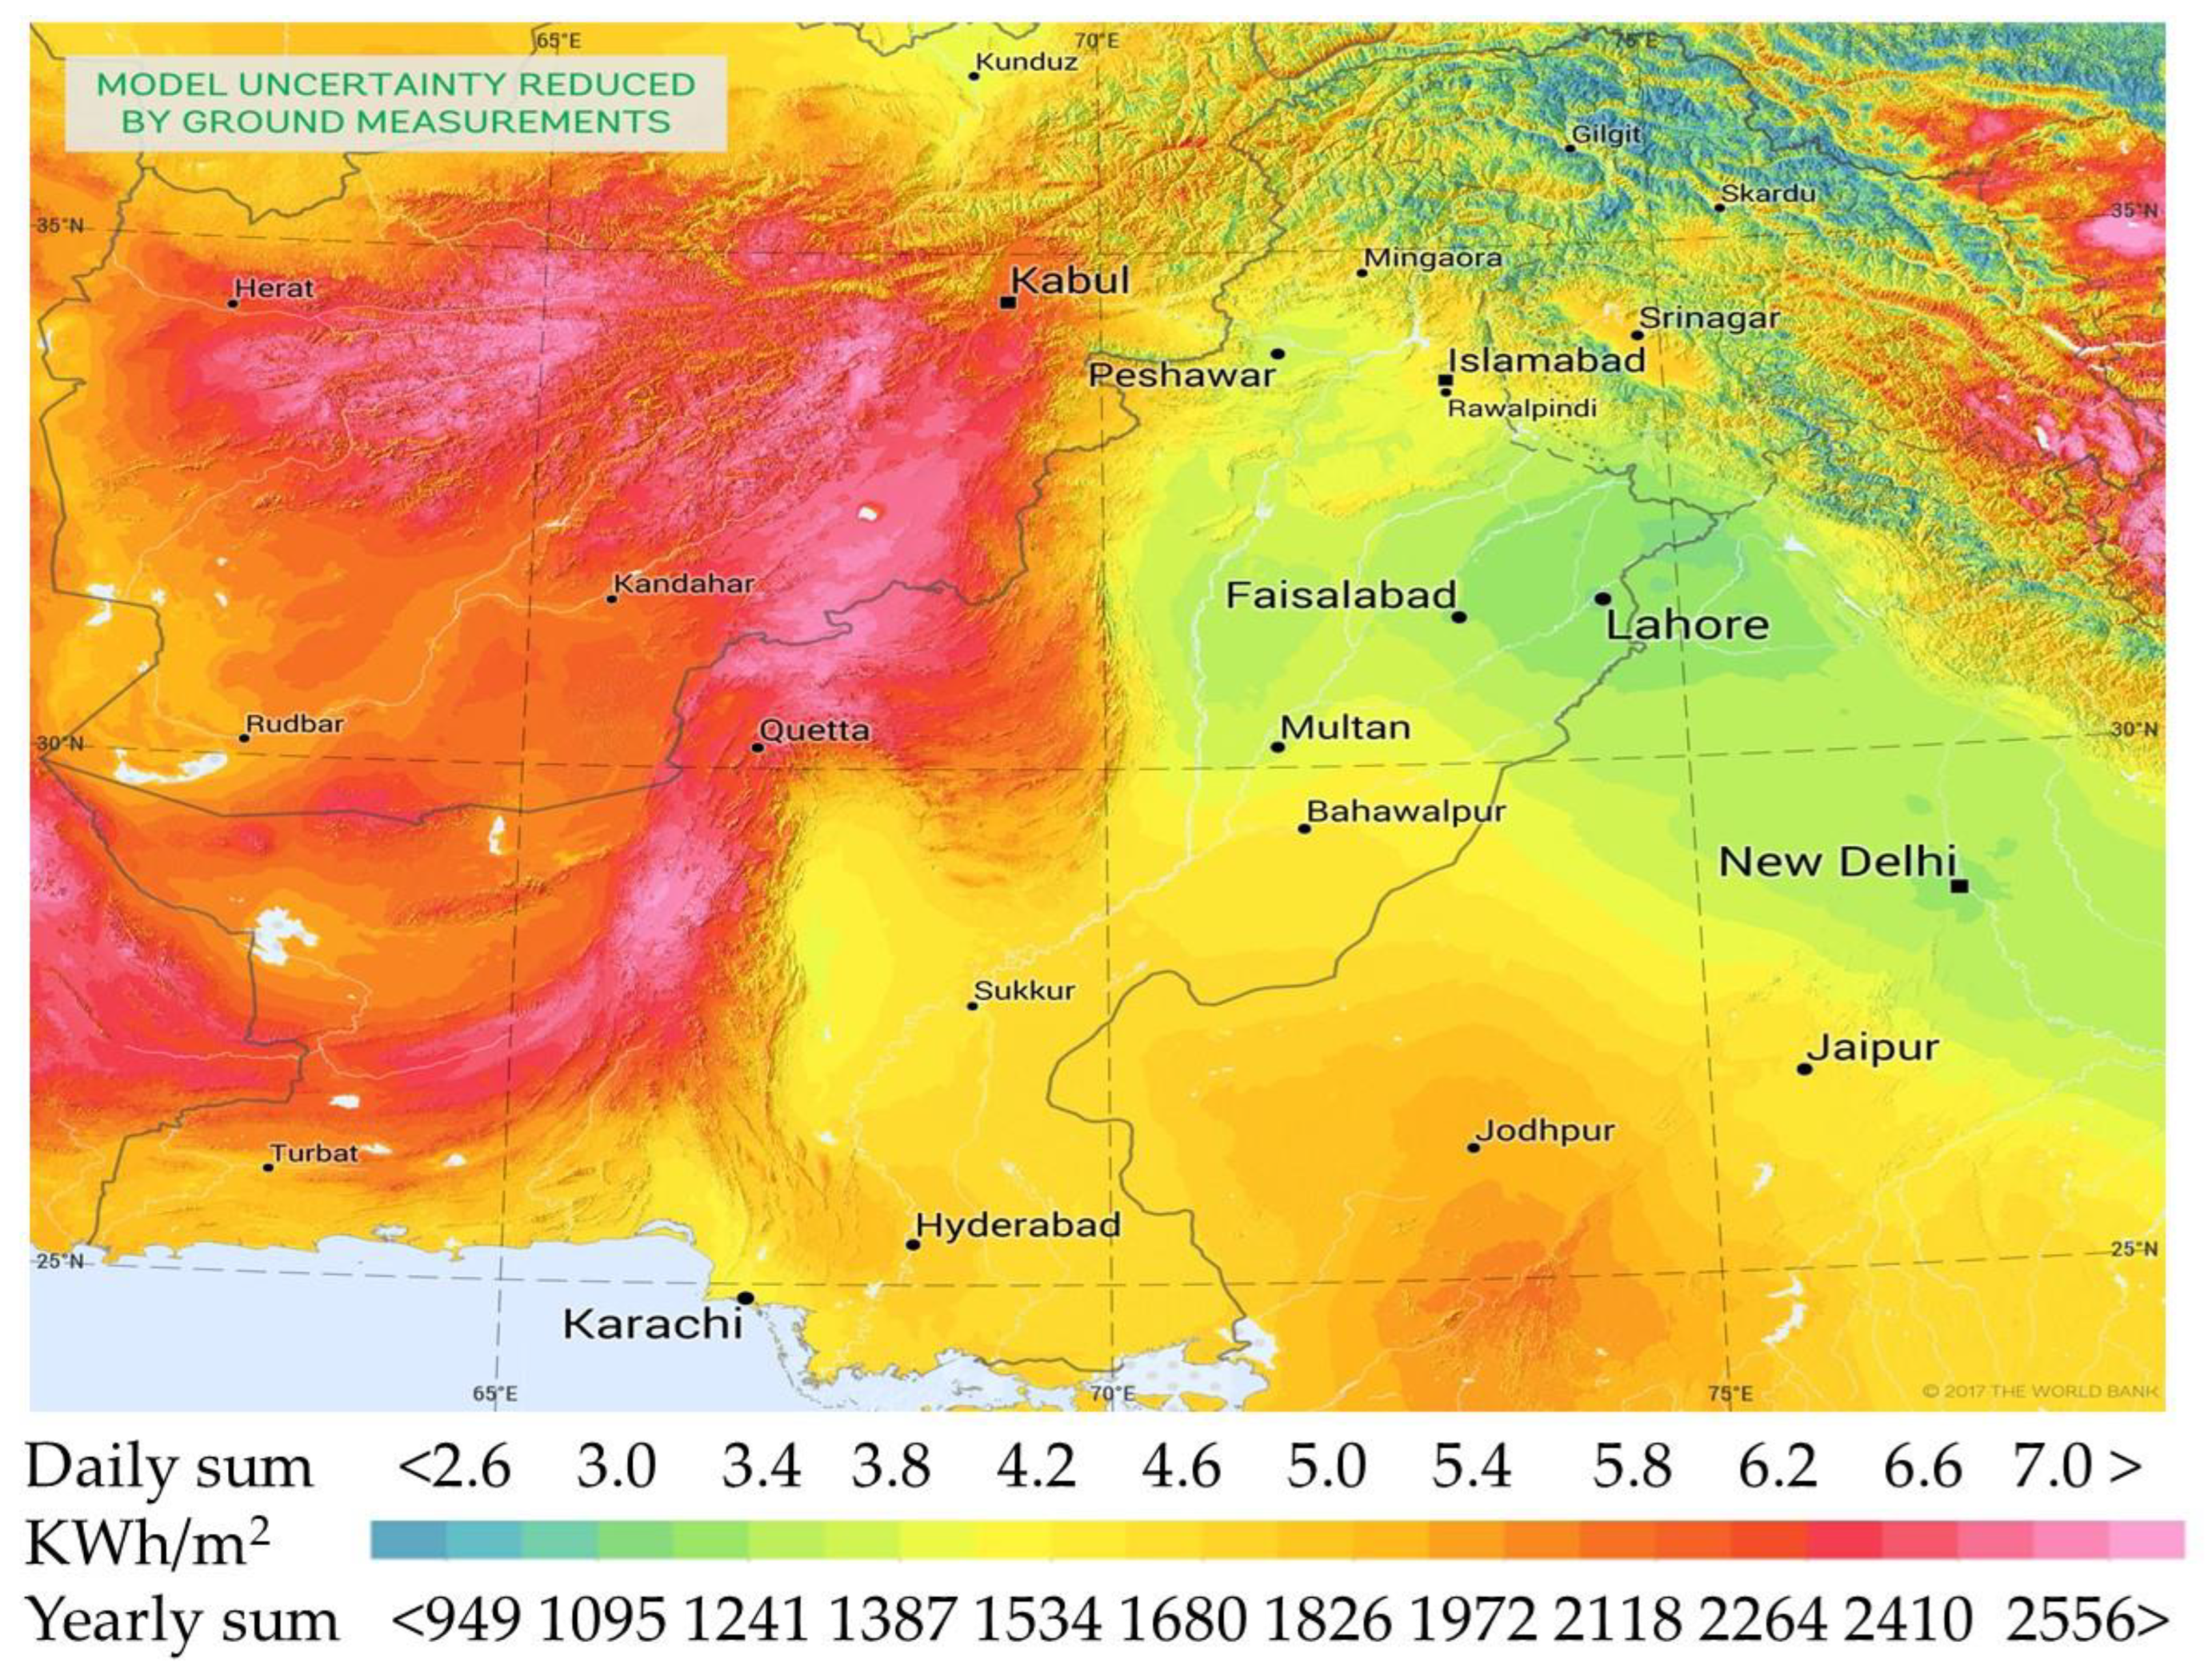
Pakistan, being in the sunbelt, has a tremendous amount of solar energy with long sun shining hours. This tremendous energy source is widely distributed throughout the county. A solar map showing direct normal irradiance in the country is illustrated in Figure 3 [18]. As illustrated, the direct normal irradiance is quite high throughout the country (excluding the northern part). In particular, Quetta city (which is located in Baluchistan province) has fascinating solar energy potential. In comparison, the solar energy potential in Karachi (which is in Sindh province) is lower than in Quetta, but even then, it is quite reasonable for utilization.
Since Karachi is located near the Arabian sea, it was selected for the proposed study. The direct normal irradiance in Karachi is shown in Figure 4 [19].
As shown, the maximum hourly direct normal irradiance (705.9 W/m2) was observed in April. The minimum hourly direct normal irradiance (382 W/m2) was observed in July.
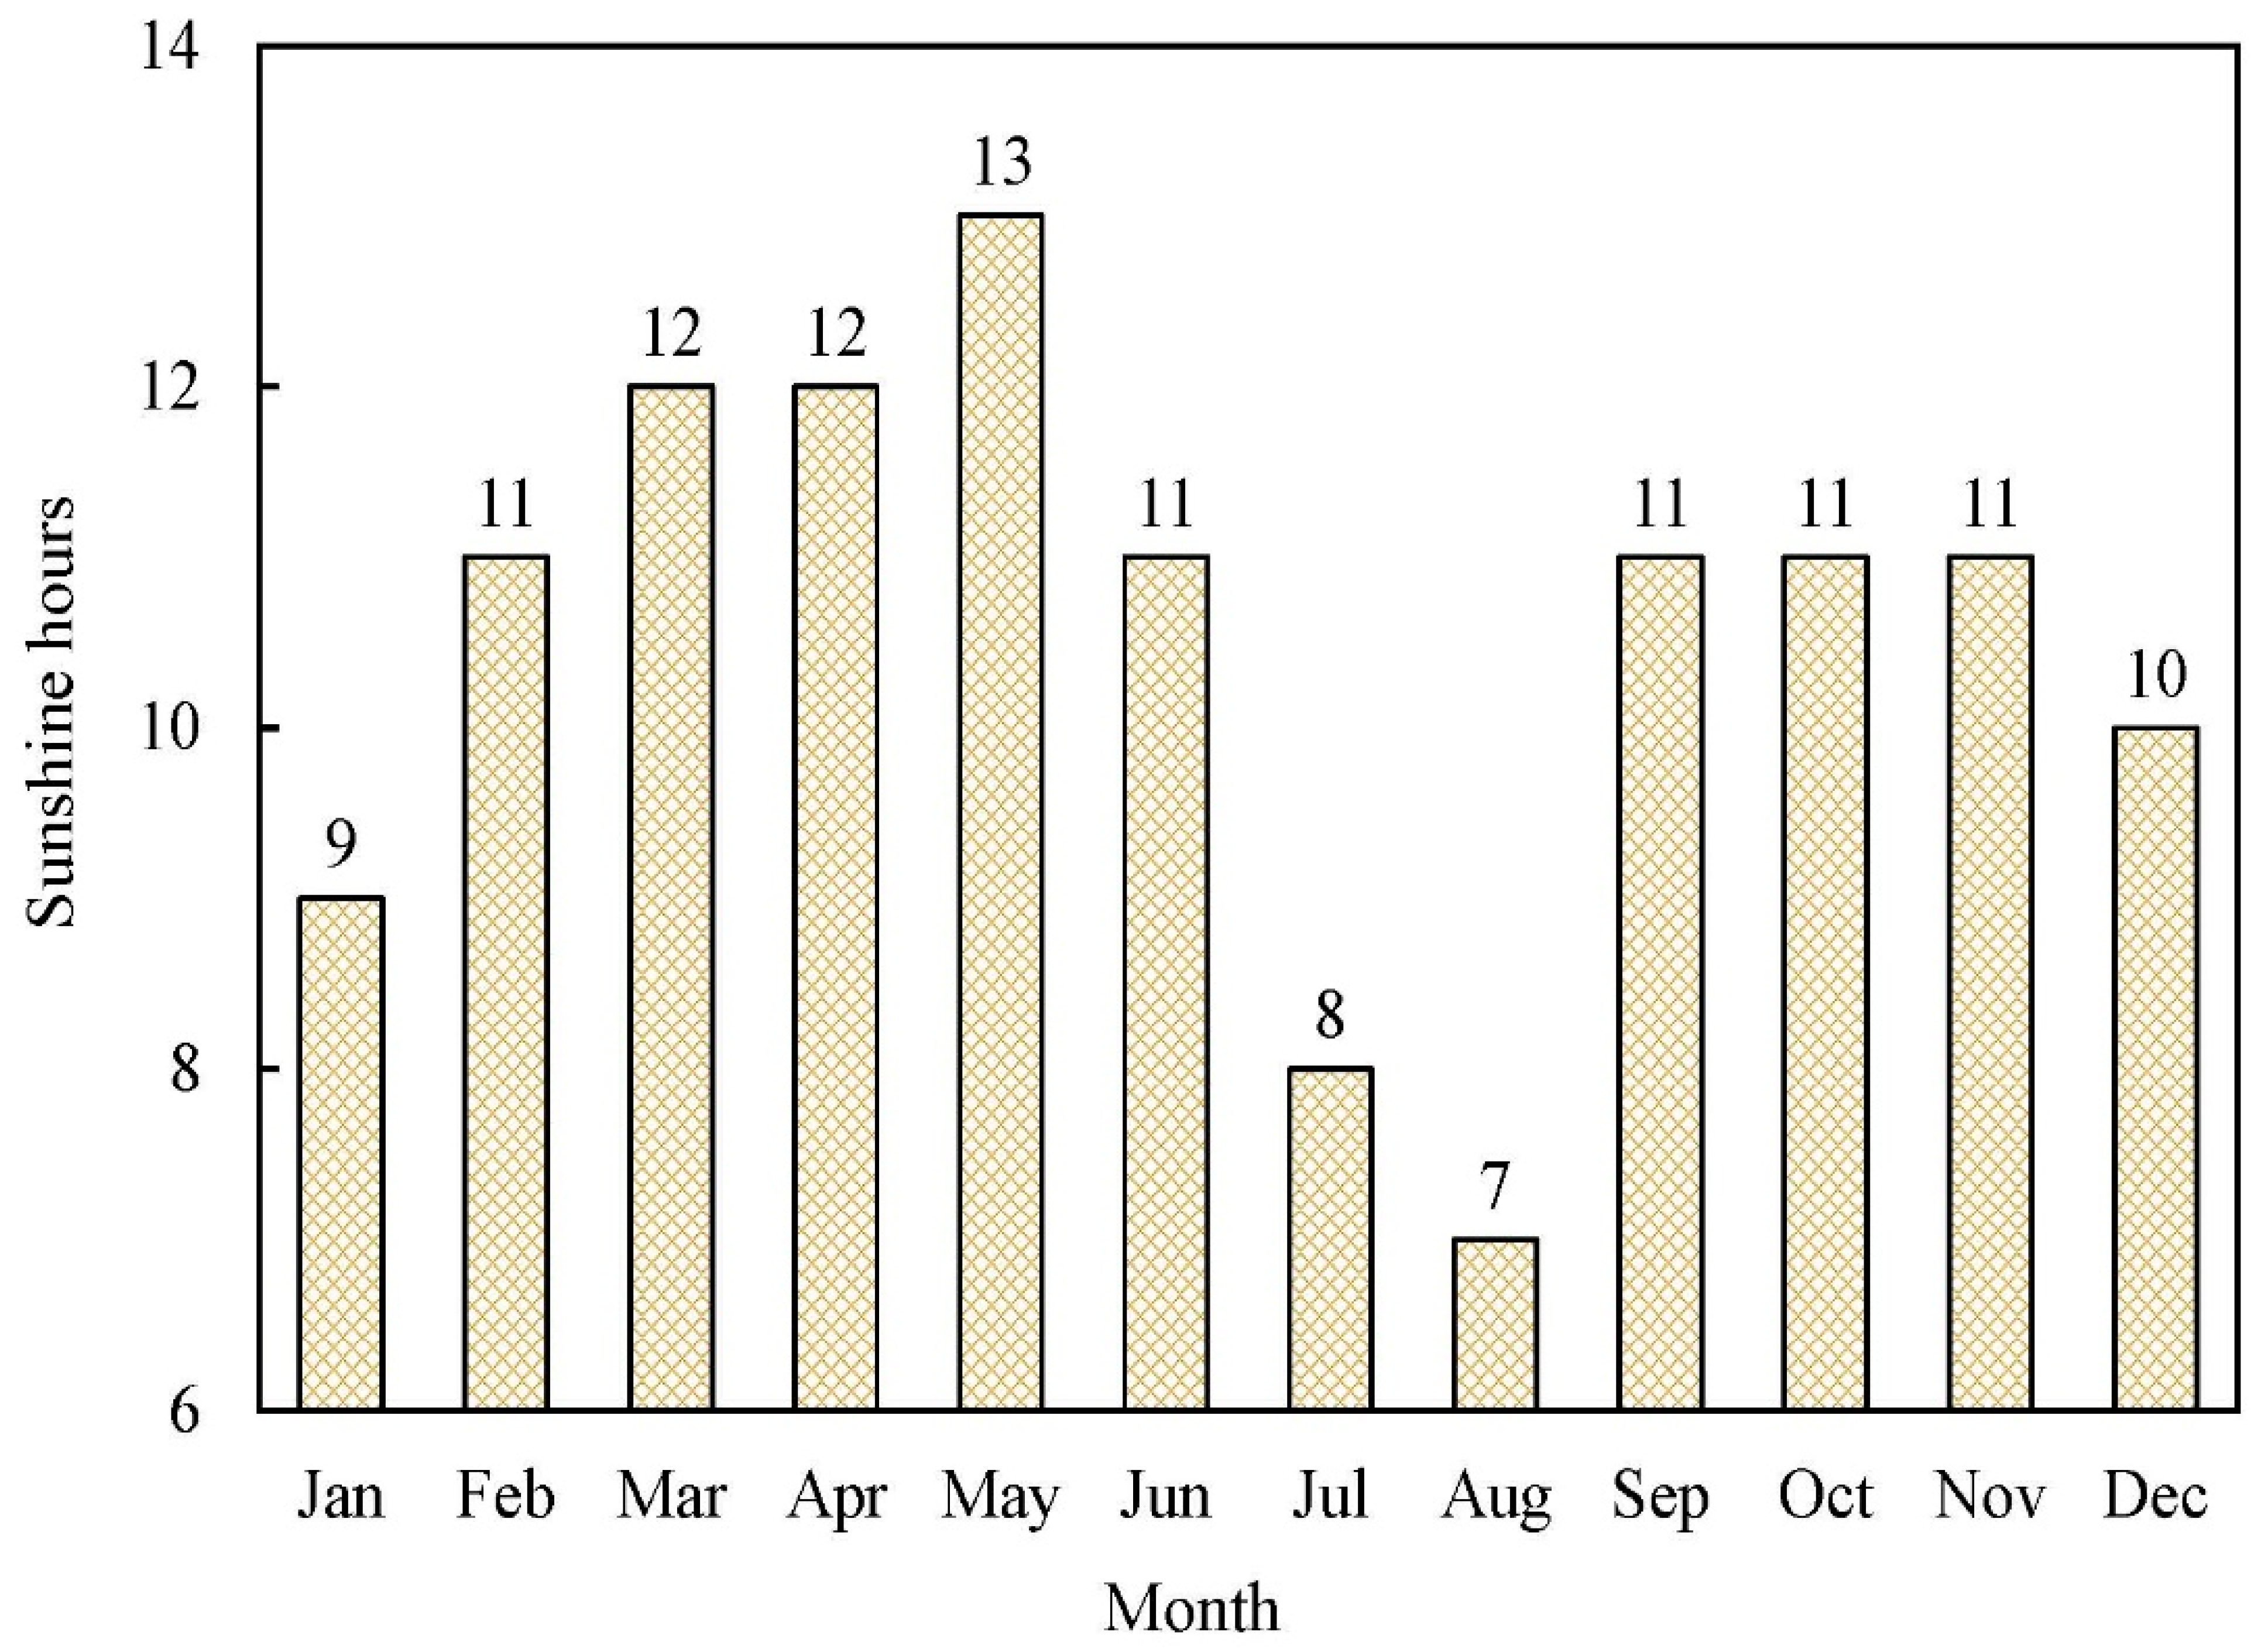
In addition, the average daily sunshine hours in Karachi are presented in Figure 5 [20]. As shown, the maximum sunshine hours (13 h) are observed in May, whereas the minimum sunshine hours (7 h) are observed in August.

3. Fresh Water Status in Pakistan

“Water is life”; this phrase describes the significance of water for life on Earth. Based on salinity levels, water can be classified as:
  • Fresh water <500 ppm;
  • Brackish water 5000–35,0000 ppm;
  • Saline water 35,000 and 45,000 ppm;
  • Brine >45,000 ppm.
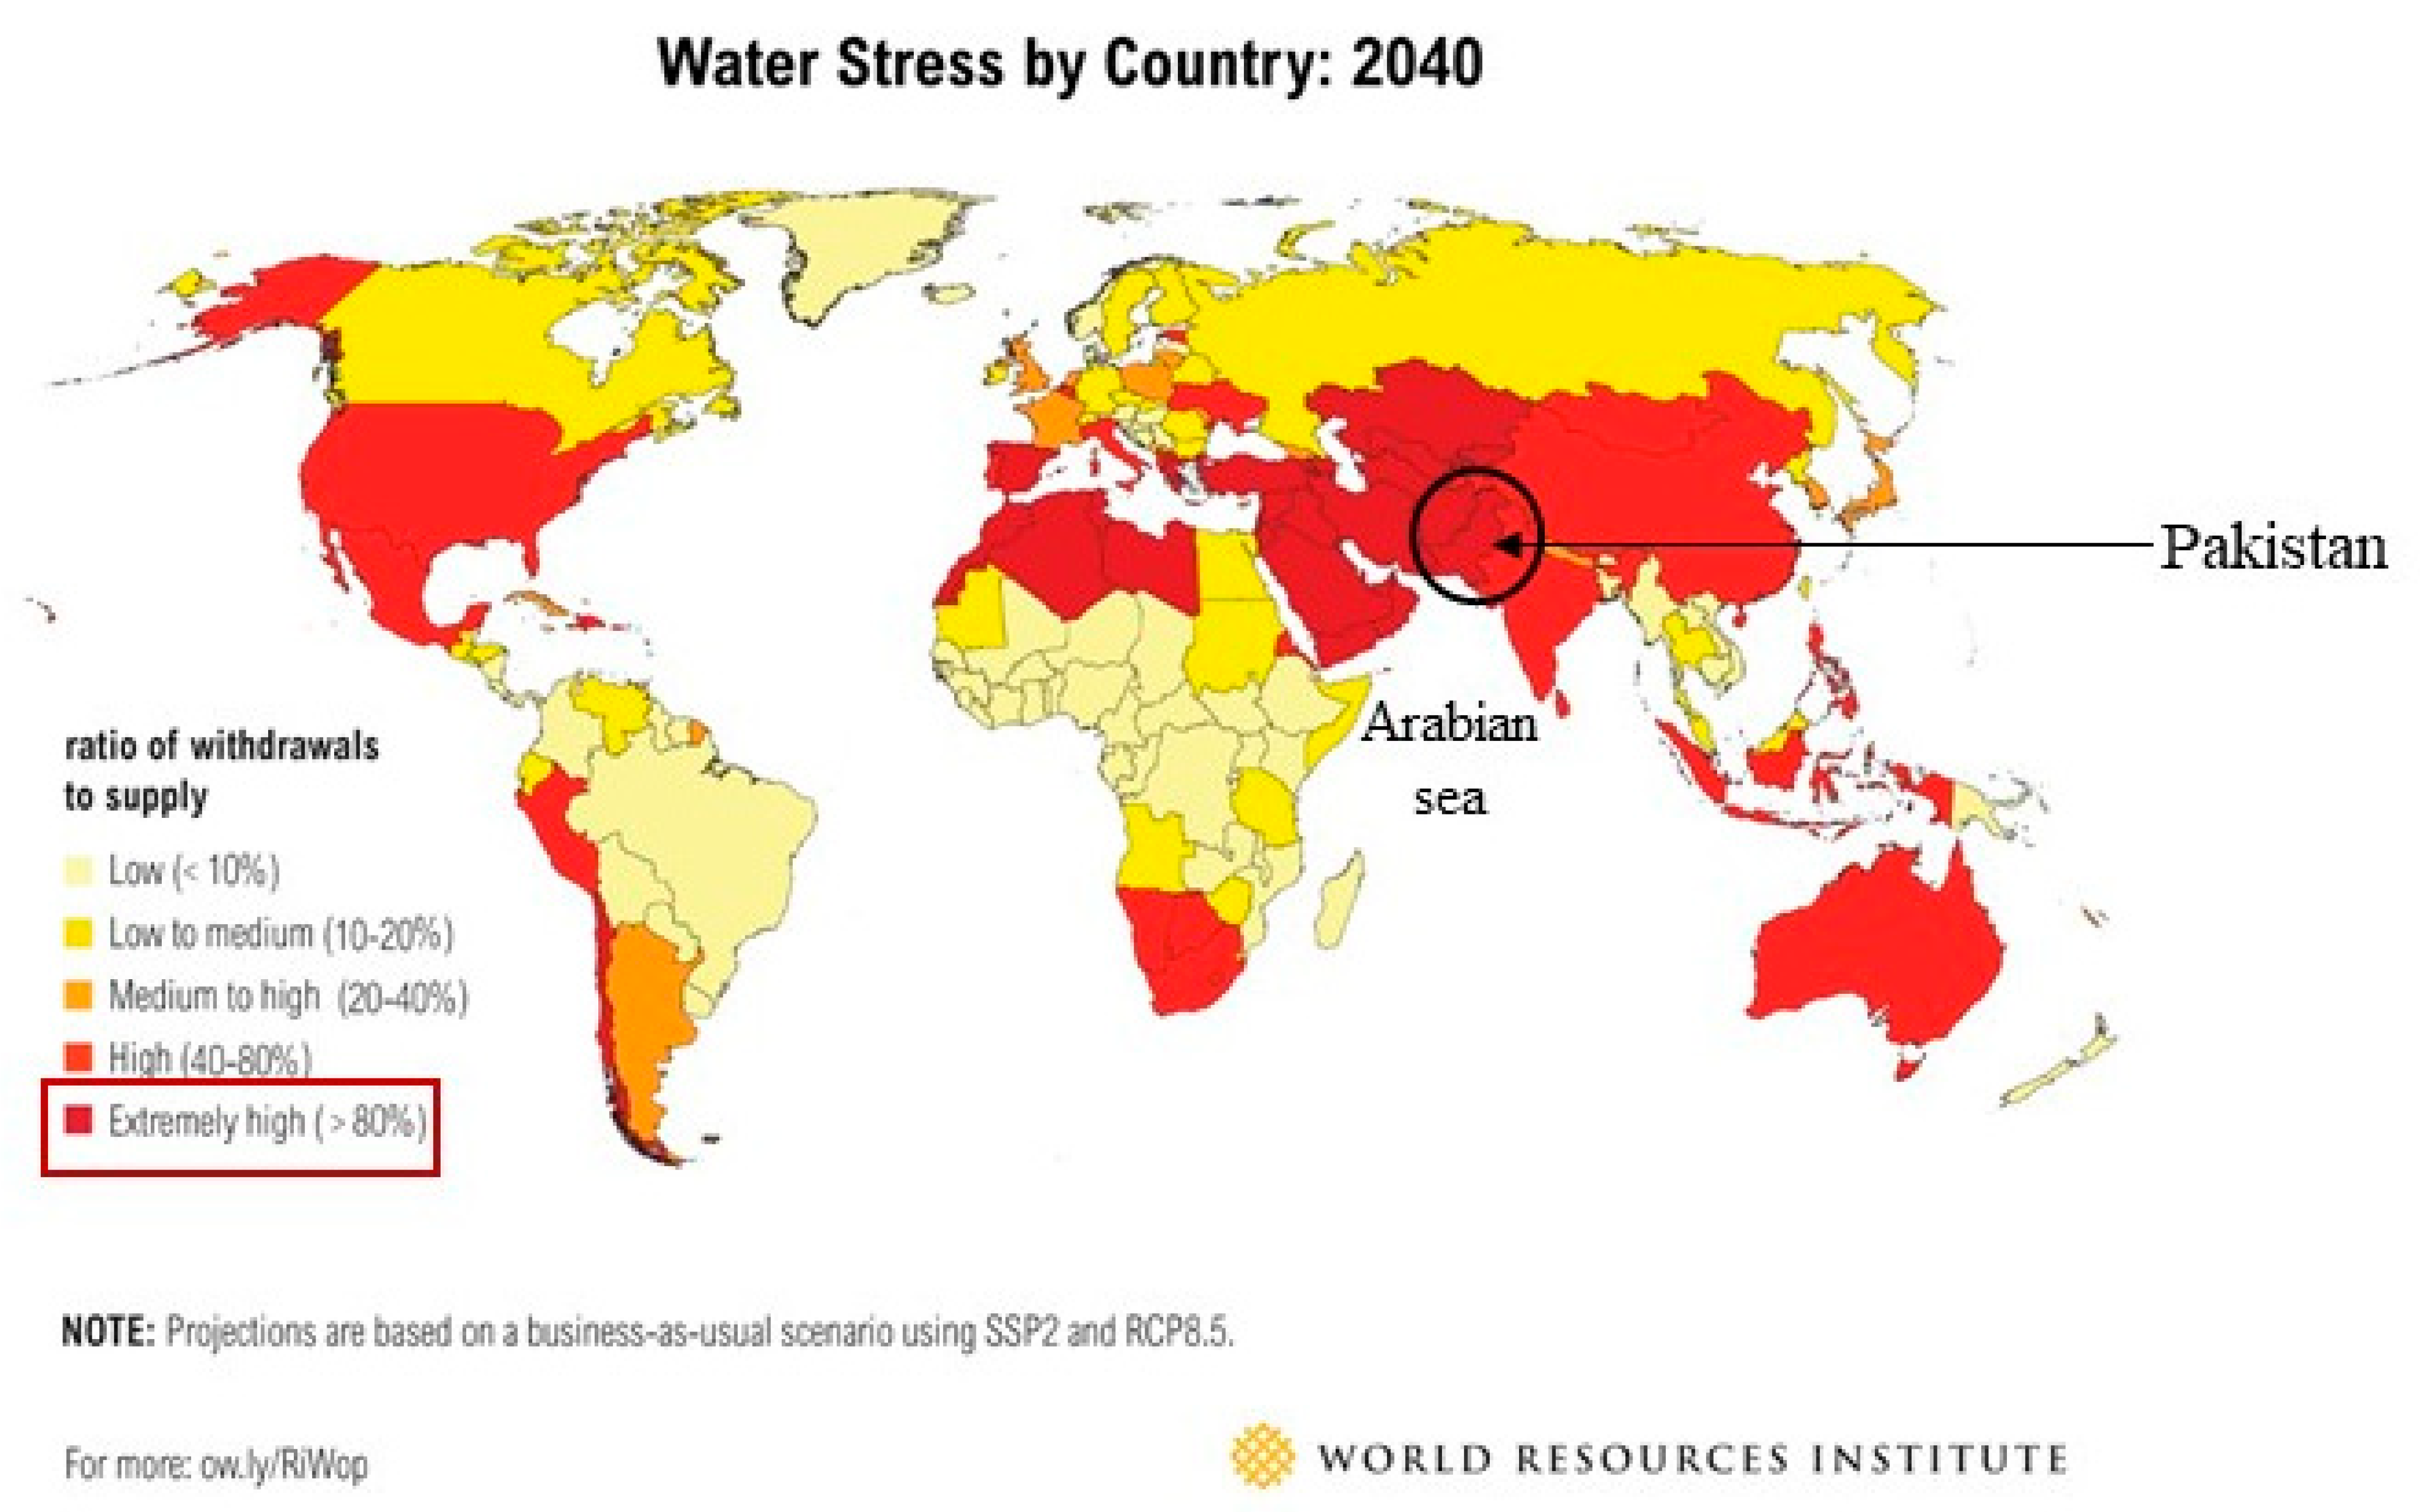
It is pertinent to mention that a person usually drinks 3 to 4 L of fresh water per day. Although almost 70% of the Earth is covered with water, its major portion is seawater, which is not drinkable due to high salinity. Moreover, most of the fresh water on the Earth is trapped in glaciers. Therefore, only a small fraction of water is available on the Earth’s surface for drinking. In Pakistan, the major sources of fresh water are rivers and groundwater, but the demand for fresh water is much higher than the supply. The country is water-stressed and close to being declared as water-scarce, as shown in Figure 6 [21]. In addition, the river and groundwater are unsafe for drinking in Pakistan. The problem with the river and groundwater is the high TDS and contamination with arsenic and other pollutants, respectively; the presence of arsenic at elevated levels in the groundwater is an extremely high health hazard in Pakistan. The country’s densely populated and metropolitan city Karachi is also severely lacking fresh water. Karachi has two main freshwater sources, i.e., Keenjhar Lake and Hub Dam. However, the latter has no water storage due to the shortage of rainfall in Karachi for a few years. Therefore, the water dependency of the city is on Keenjhar Lake, which cannot meet the demand alone. It has been reported that at least 20 million people in Karachi face severe water crises. Although the city is located in the coastal area of the country and it has a length of 100 km and infinite seawater is available, the option of desalination on a large and small scale is not seriously considered for producing fresh water from it.

4. System Description

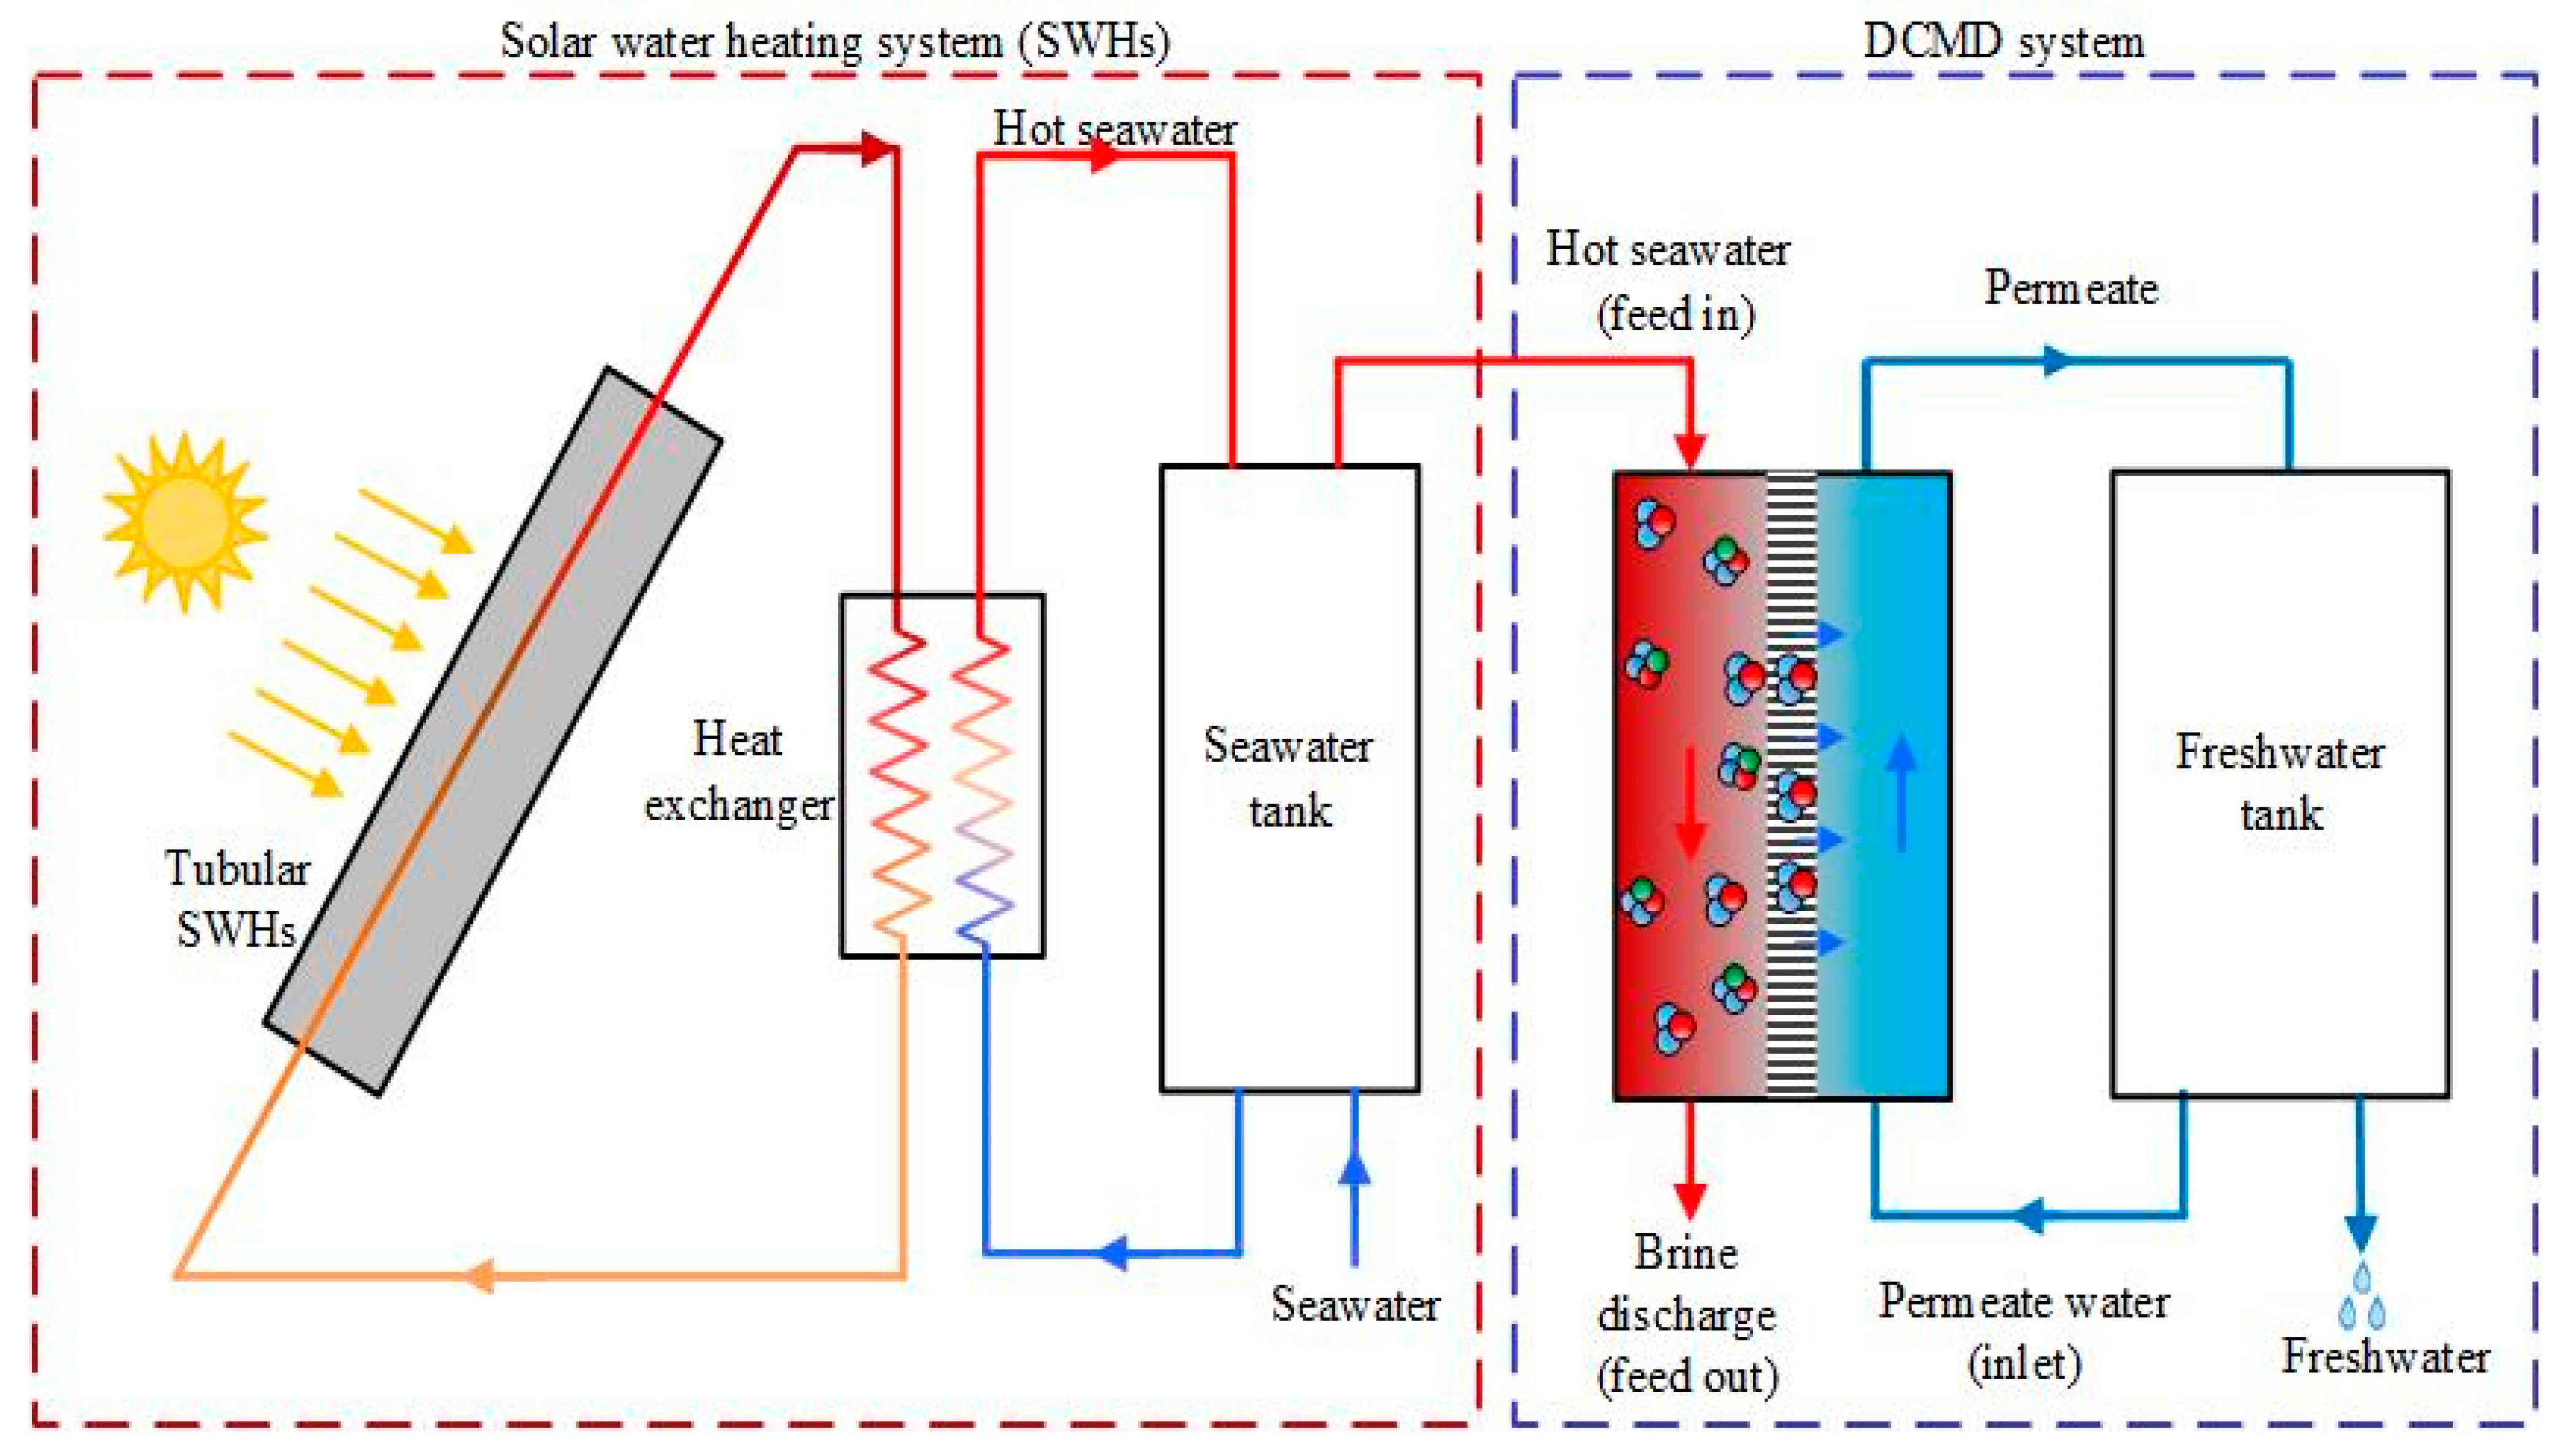
This system consists of solar-driven water heating and DCMD systems, as illustrated in Figure 7. The former system comprised a tank, a solar thermal collector, and a heat exchanger. The incident sunlight on the solar thermal collector is converted to heat, which is absorbed by a fluid. The resulting hot fluid flowed into the heat exchanger, where heat transfer took place between the hot fluid (water) and the cold fluid (seawater). As a result, the temperature of the cold fluid, which was seawater in the present study, increased. The heated seawater was stored in a tank. From the tank, seawater was directed into the DCMD system. The DCMD system comprised permeate-side and feed-side channels, and a membrane. The hot seawater (feed) flowed in the feed-side channel whereas fresh water (whose temperature is lower than feed) flowed in the permeate-side channel. The membrane prevents mixing of both the fluids, while allowing water vapors to cross it. The temperature difference across the membrane induces the pressure gradient between both sides, which results in permeation. The water vapors crossing the membrane (known as permeate flux) condense on the permeate-side channel as they come into contact with the fresh water, which has a lower temperature.
Finally, the produced fresh water is stored in a tank. The fresh water from the tank is used to supply potable water to residents, and a portion of fresh water is re-circulated in the permeate-side channel of the DCMD channel for the condensation of permeate flux.

5. Methodology

5.1. Solar Water Heating System

A tubular solar collector (Manufacturer: Solar Panels Plus, Model: SPP-30A, US) was selected to carry out the simulations. The area of the collector was 4.81 m2, and the total number of panels was 10. Hence, the total collector area of the heating system was 48.1 m2. The collector was tilted at 30°. The solar storage tank had a volume of 5 m3. The heat exchanger effectiveness was 0.75 and the outlet temperature was set at 50 °C. The average daily hot water to be supplied was assumed to be 7500 kg/day. The seawater was heated in the heat exchanger of the solar heating system, and it had different temperatures throughout the year due to seasonal changes.
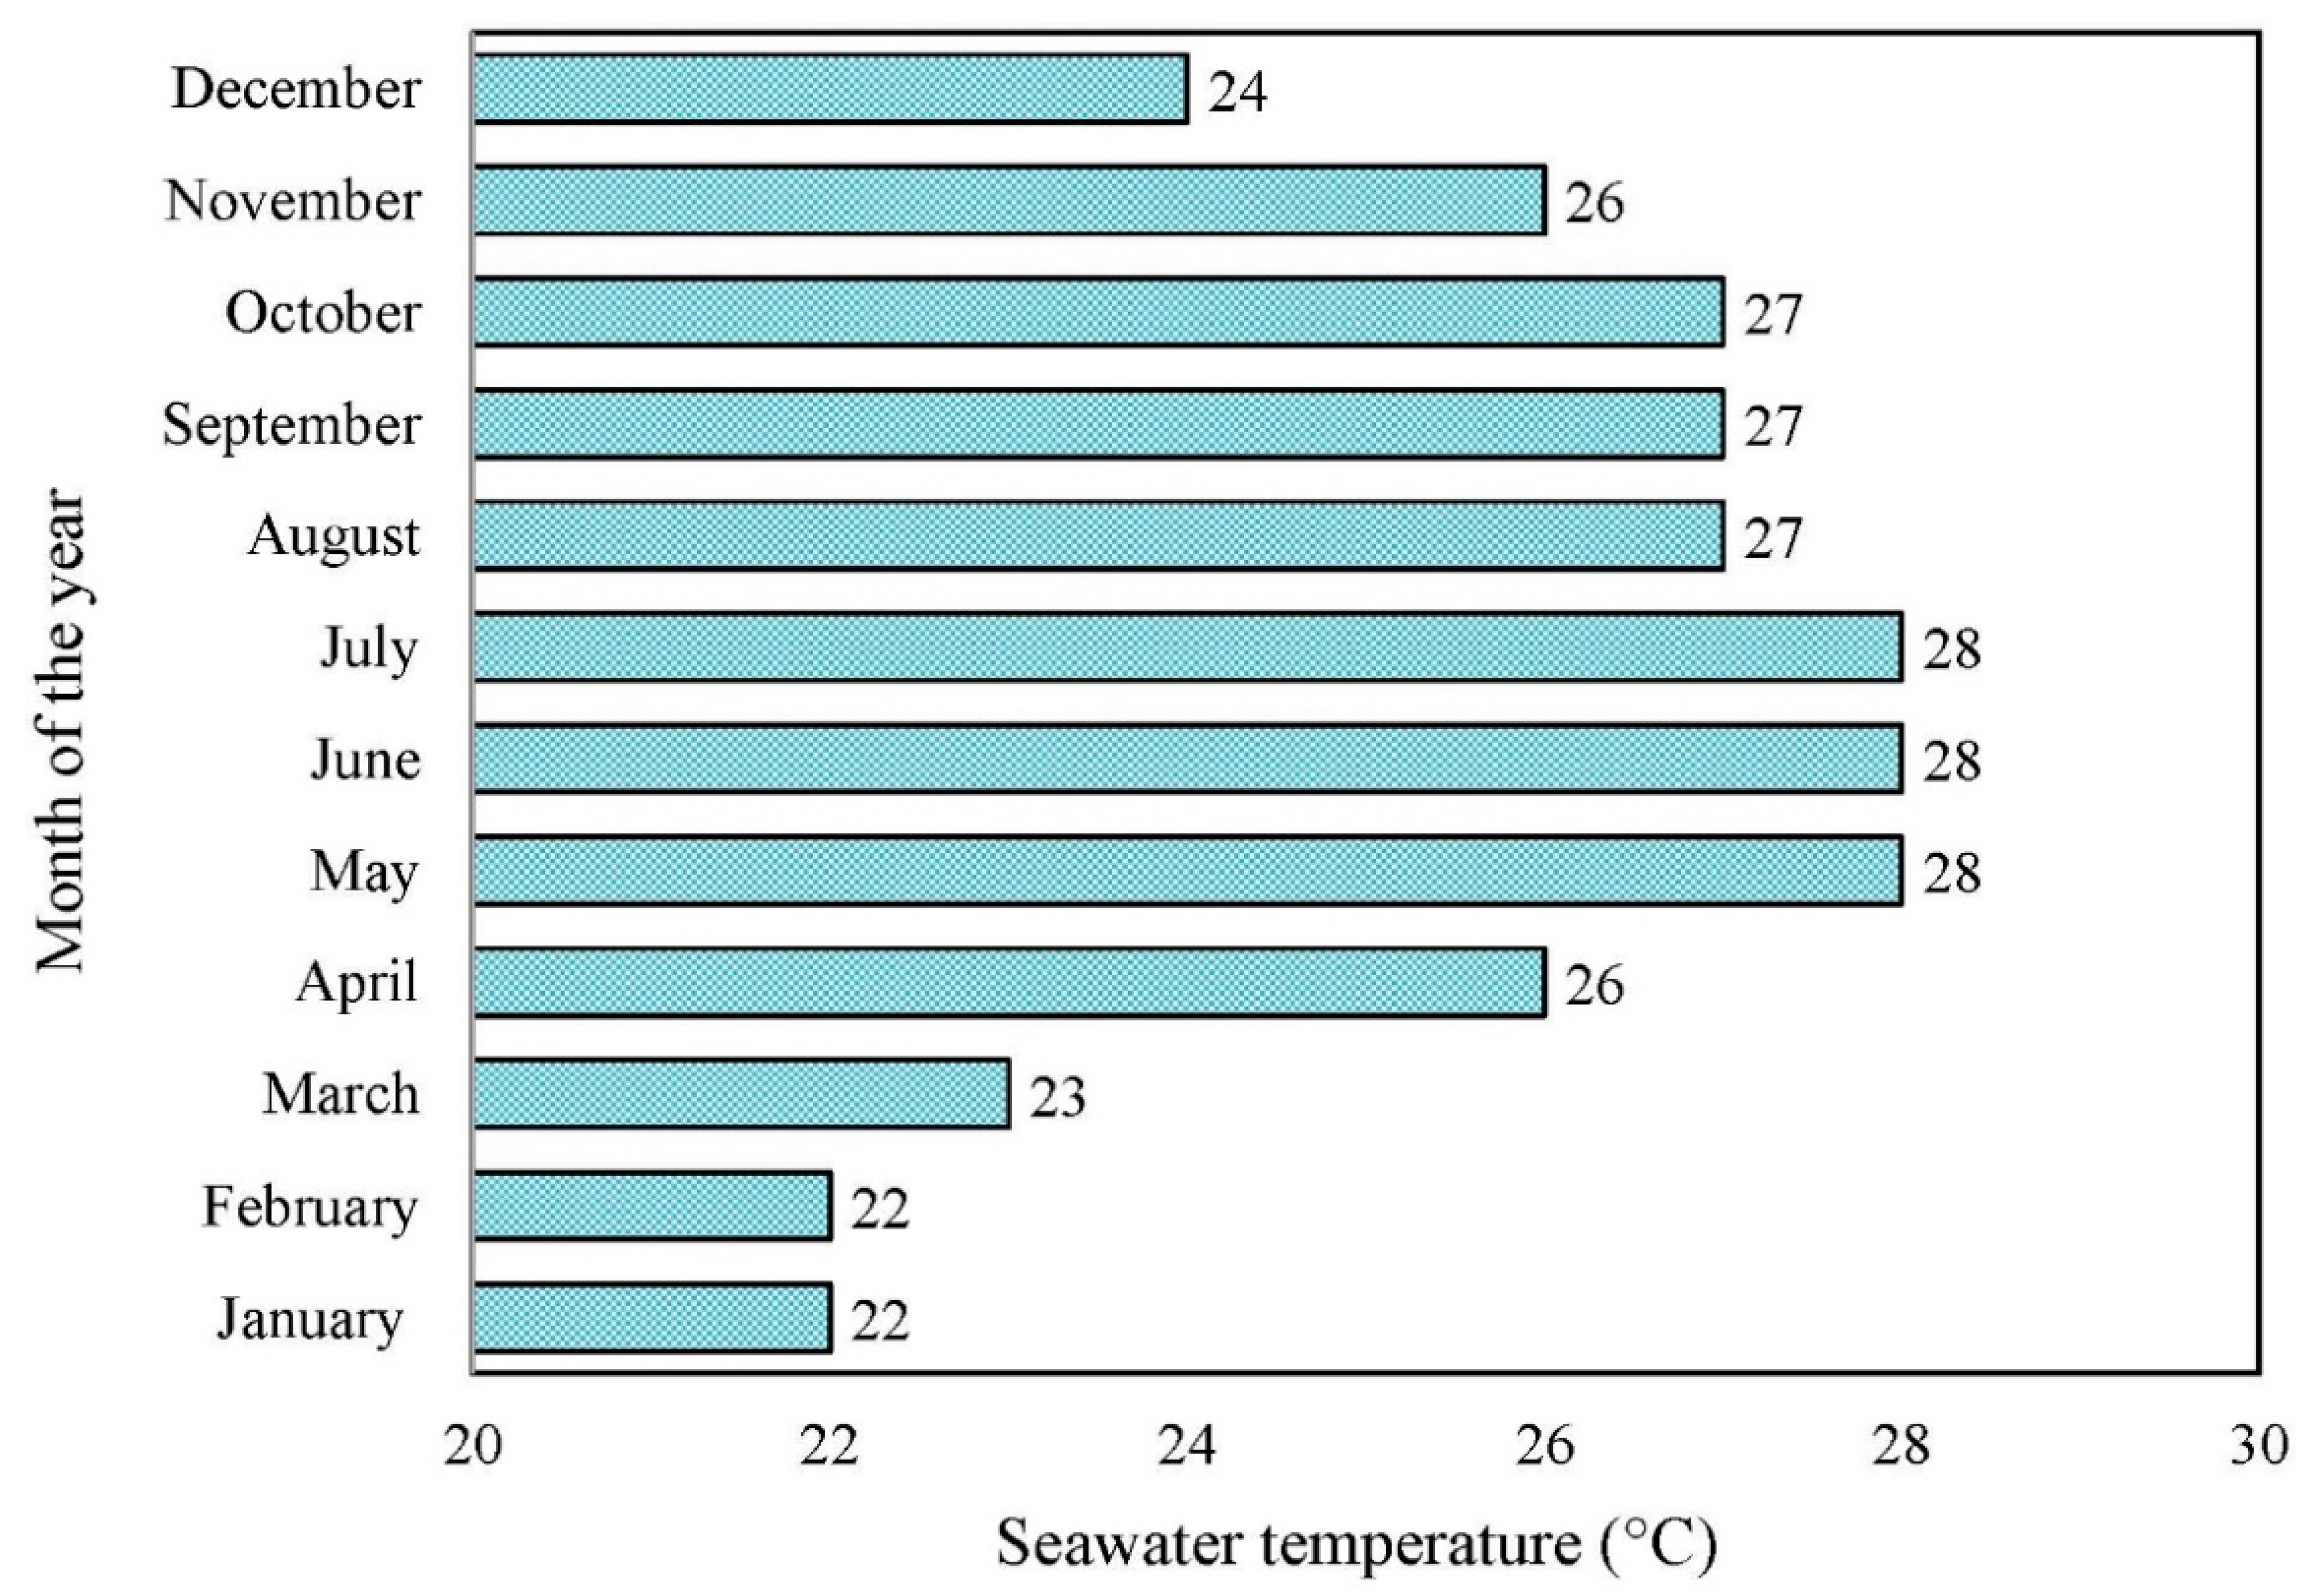
The average temperature of seawater in Karachi, which was used for the simulations, is presented in Figure 8 [22]. The solar water heating system’s performance has been evaluated based on hot water temperature and solar fraction. In addition, capital cost has also been estimated for the solar water heating system.

5.2. DCMD System

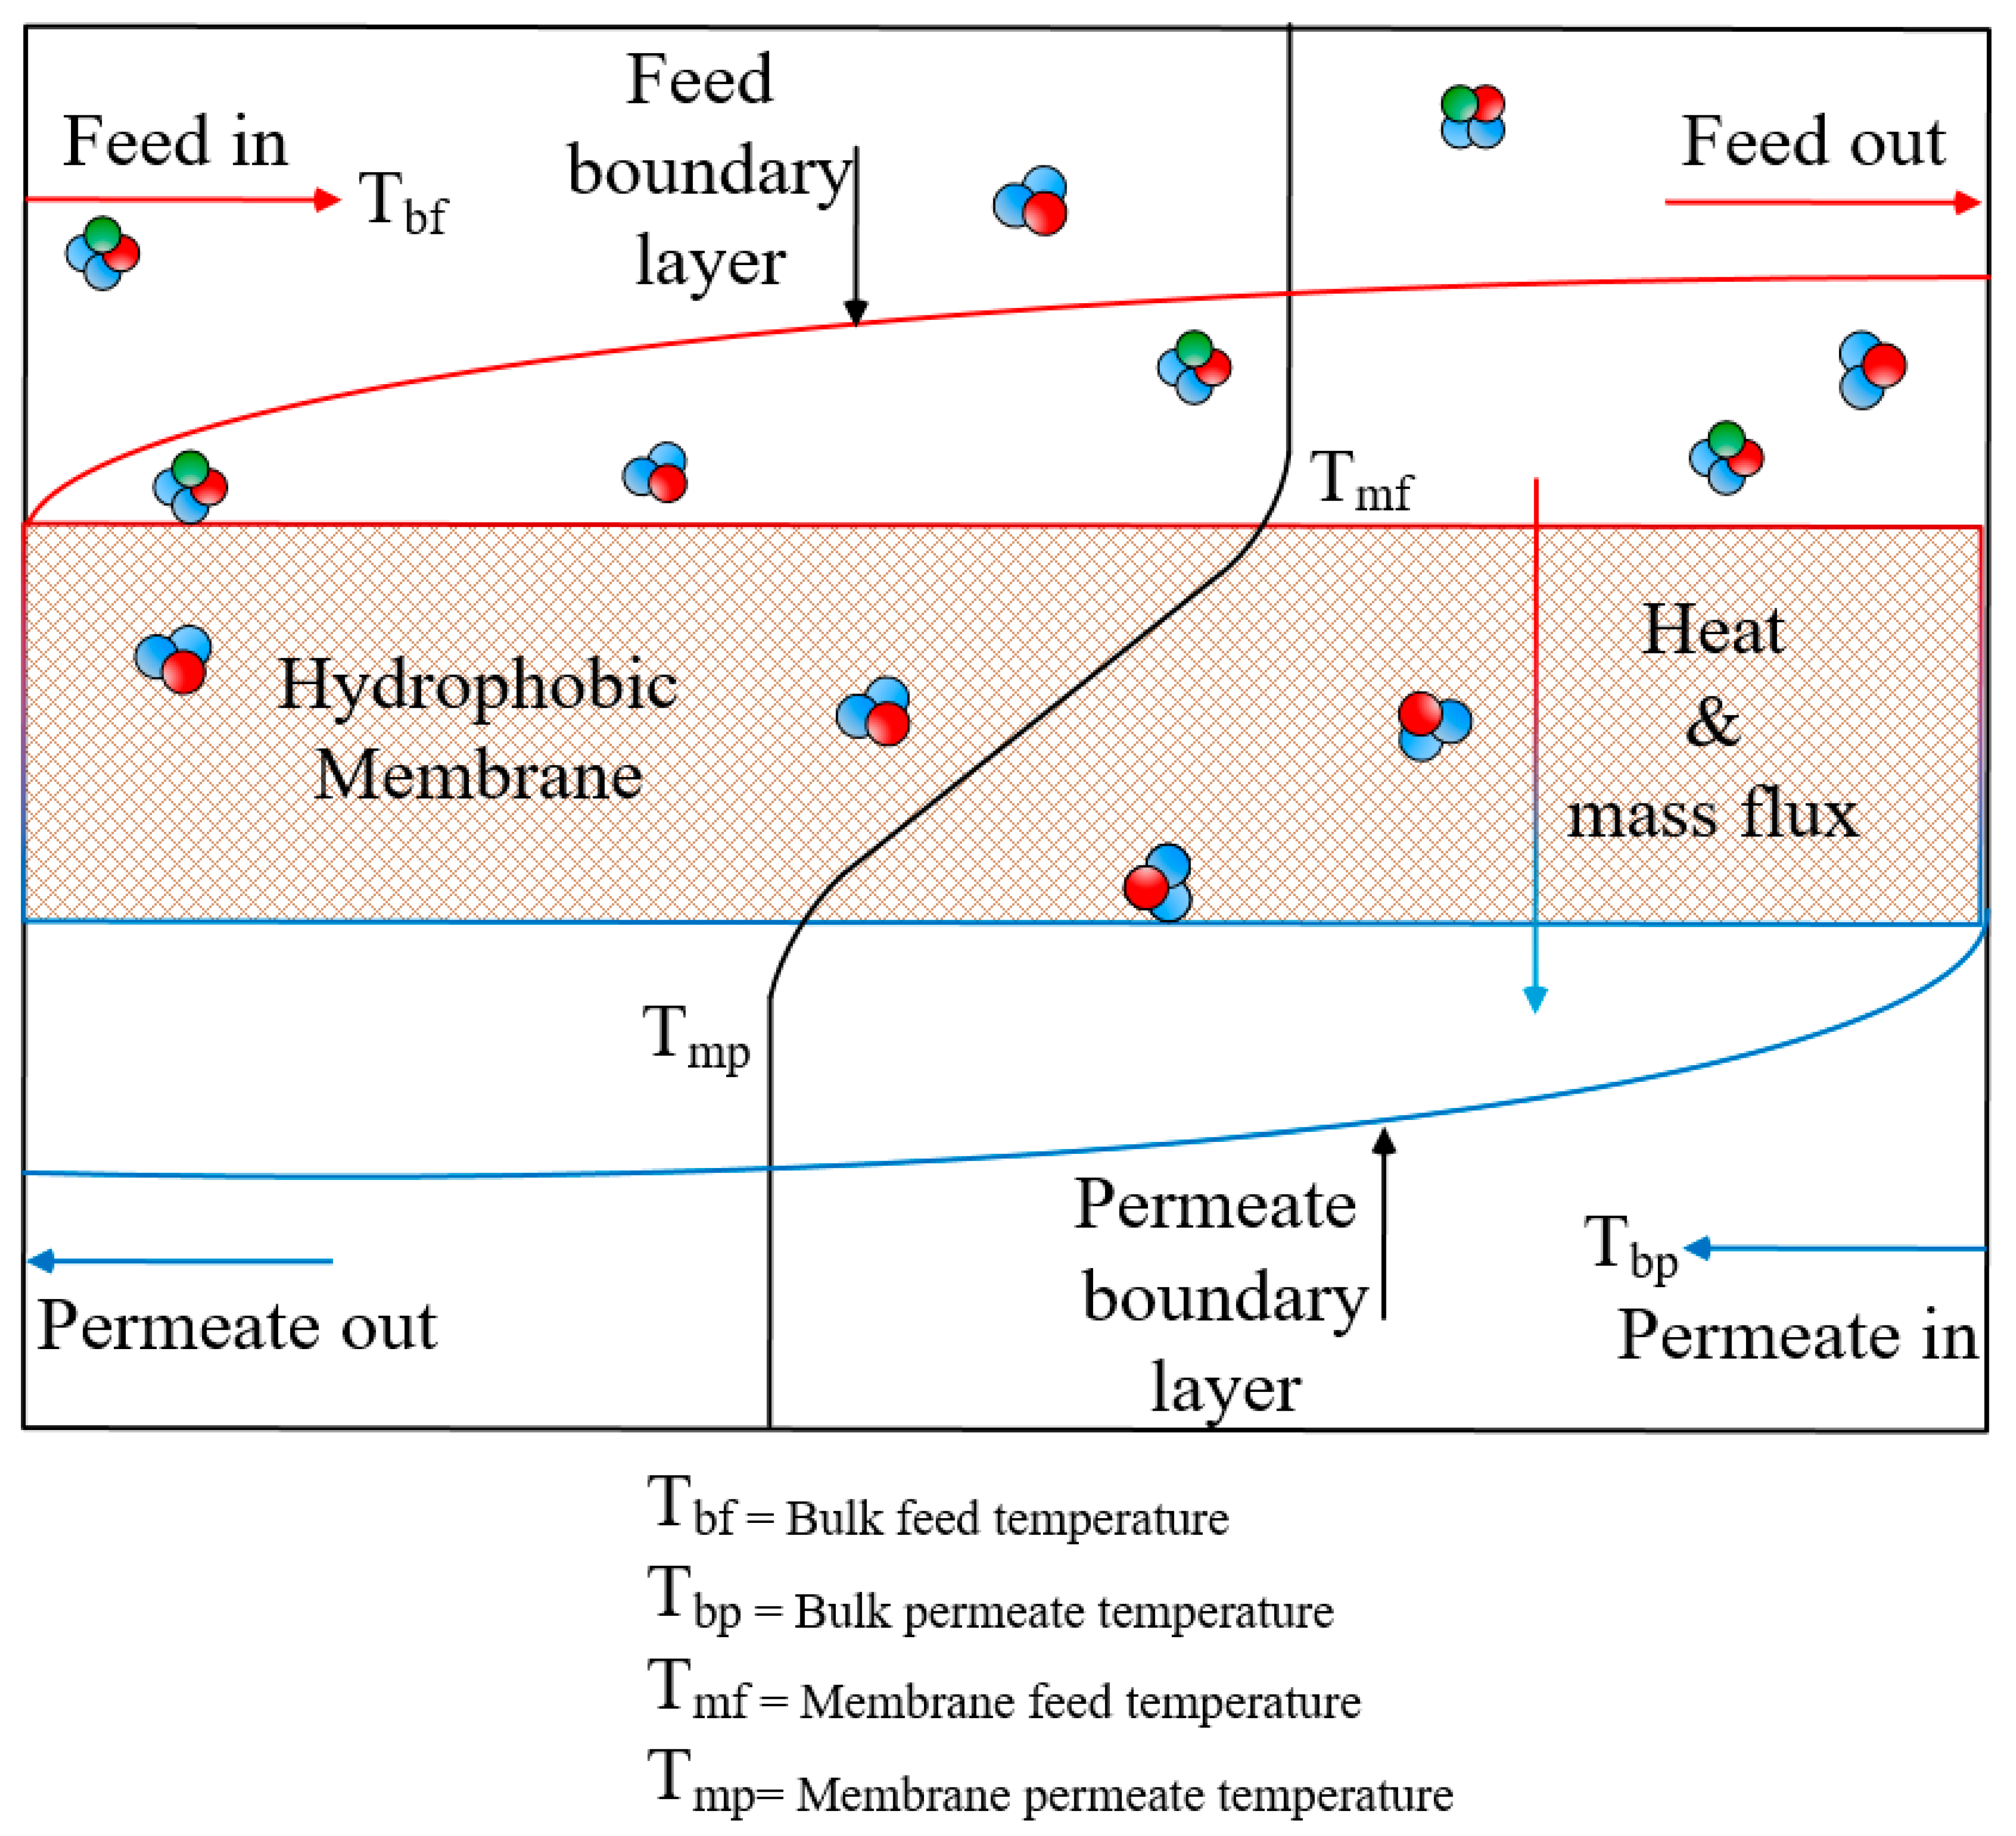
As discussed earlier in Section 1, the variation in temperature in both fluids across the membrane induces the pressure gradient between both sides, which results in permeation, as presented in Figure 9.
The permeate flux (Jm) can be calculated from the equation [23]:
J m = D m × ( P f v P p v )
where Pv is the pressure, f is the feed, and p denotes the permeate. Dm is used for denoting the membrane distillation coefficient. Water vapor pressure can be determined from the Antoine equation [23]:
P f v = exp ( ( 23.328 ) 3841 T m f 45 )
P p v = exp ( ( 23.328 ) 3841 T m p 45 )
It is important that the Tmf and Tmp cannot be determined experimentally. Therefore, these temperatures are calculated from the following expressions [23]:
T m f = k m × ( T b p + ( h f / h p ) × T b f ) + ( ( δ m × ( h f × T b f J m × Δ H v ) ) ) ( k m ) + ( h f × ( δ m + ( k m / h p ) ) )
T m p = k m × ( T b f + ( h p / h f ) × T b p ) + ( ( δ m × ( h p × T b p + J m × Δ H v ) ) ) ( k m ) + ( h p × ( δ m + ( k m / h f ) ) )
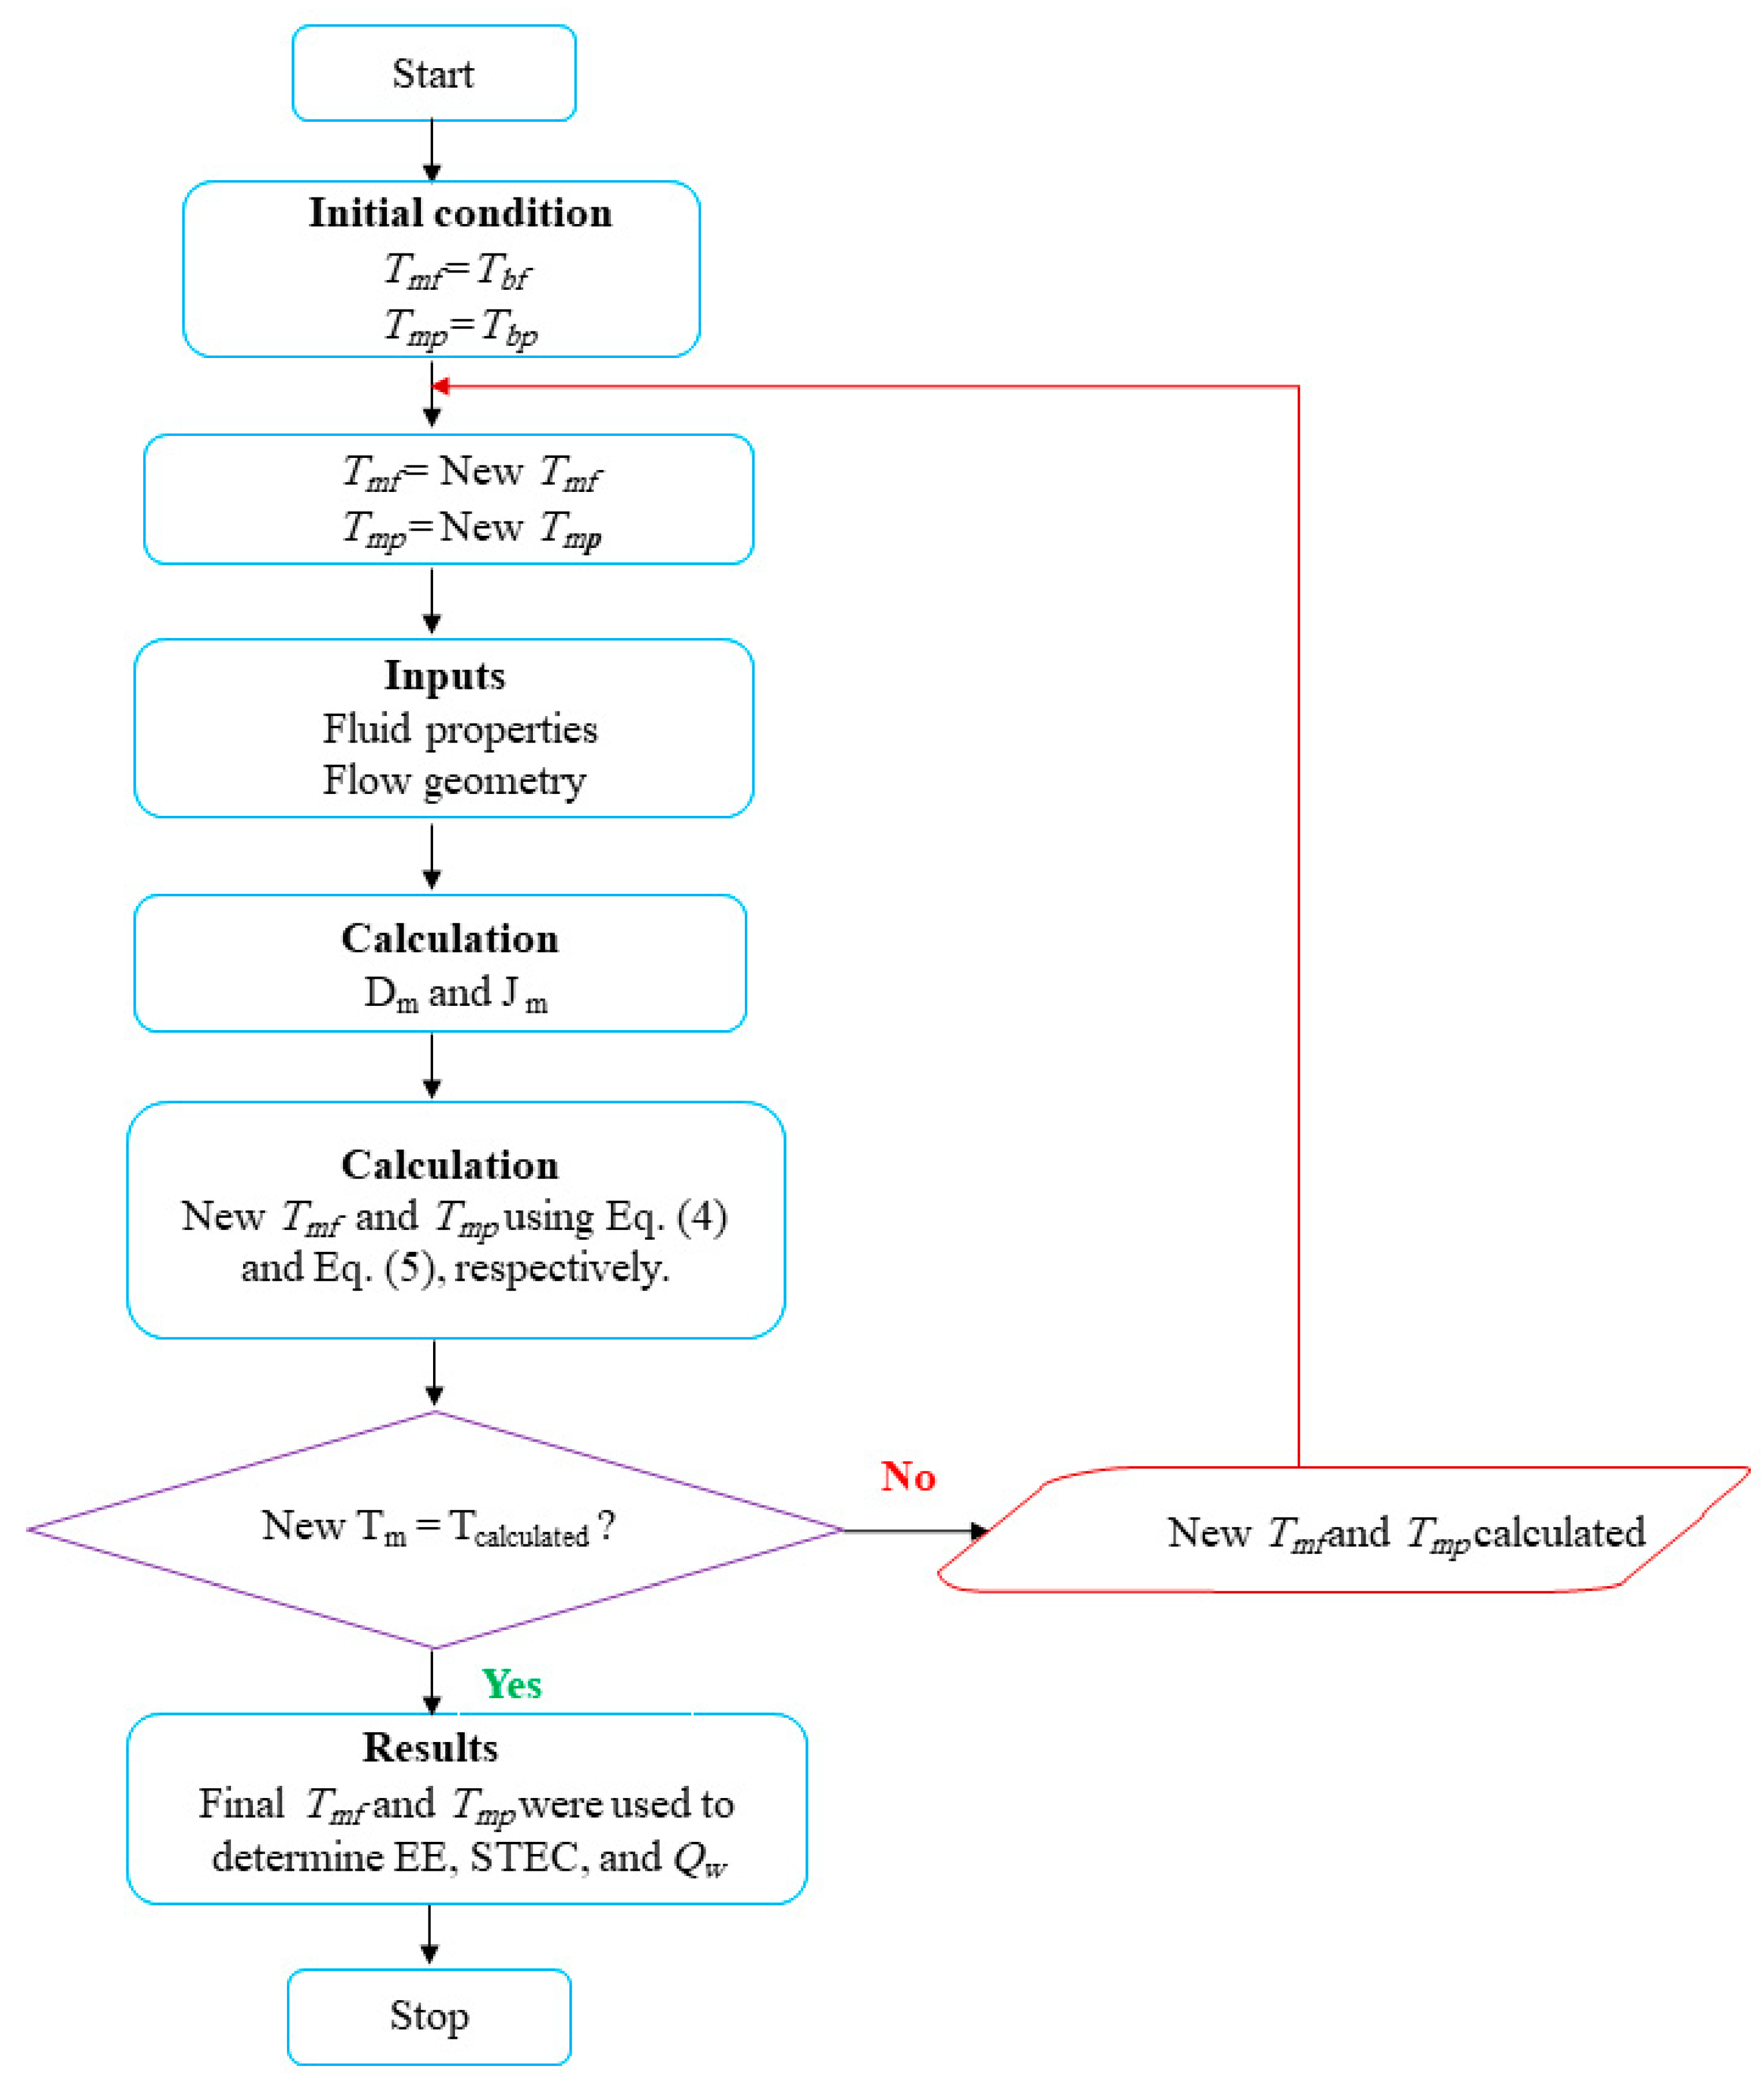
where K, δ, h, and ΔHv represent the thermal conductivity, thickness, heat transfer coefficient, and vaporization enthalpy, respectively. The subscripts b and m denote the bulk (inlet) and membrane, respectively. The flowchart for the solution of mathematical equations is presented in Figure 10. The mathematical model was validated by Lee et al. [24] and Gustafson et al. [25]. The operation condition was kept the same as in our published articles [14,15,16,17]. The model-simulated results are in agreement with Lee et al. [24] and Gustafson et al. [25]. Thus, the present proposed model is suitable for the study of production of fresh water. The details of this model validation are available in our published articles [14,15,16,17].
The DCMD system comprised a flat sheet module and a polytetrafluoroethylene (PTFE) membrane. The properties of the PTFE membrane include porosity of 80%, Km of 0.20 W/m-°C, and tortuosity of 1.25. The DCMD module specifications include a width of 0.2 m, length of 0.7 m, and thickness of 0.001 m. The module comprised four membrane sheets; therefore, the effective module area was 0.56 m2. The feed temperature for the DCMD system varied for each month based on the solar water heating system. However, other parameters include the permeate temperature (20 °C), the flow rate for both sides (10 L/min), feed salinity (35 g/L), and freshwater salinity (0 g/L).

5.3. DCMD System Performance

The DCMD’s performance was evaluated based on evaporation efficiency (EE), specific thermal energy consumption (STEC), and fresh water production. The EE can be calculated using the expression:
E E ( % ) = [ J m × H U × ( T b f T b p ) ] × 100
where U is used for the overall heat transfer coefficient. The STEC can be determined by:
S T E C = [ ( Q t / J m × ρ ) ] / 1000
where Qt is the overall heat transfer and ρ denotes the density.
Finally, fresh water production (Qw) through a DCMD system can be determined from:
Q w = ( J m × A D C M D / ρ )
where ADCMD represents the area of the DCMD module.

5.4. Water Cost Evaluation

The water cost evaluation of the DCMD system is presented in terms of levelized water cost (LWC). LWC is actually a unit cost calculation method in which the cost of fresh water production is evaluated. For the economic evaluation, the LWC model used is the same as that used in [14,15,16,17].

6. Results and Discussions

We evaluated the performance of solar-driven water heating and DCMD systems using a developed mathematical model. Evaporation efficiency (EE), specific energy consumption (STEC), and fresh water production are the performance parameters modeled and estimated using MATLAB software.

6.1. Solar Water Heating System (SWHS)

The solar water heating system’s performance was evaluated based on hot water temperature and solar fraction. The solar water heater performance varied with the water temperature.
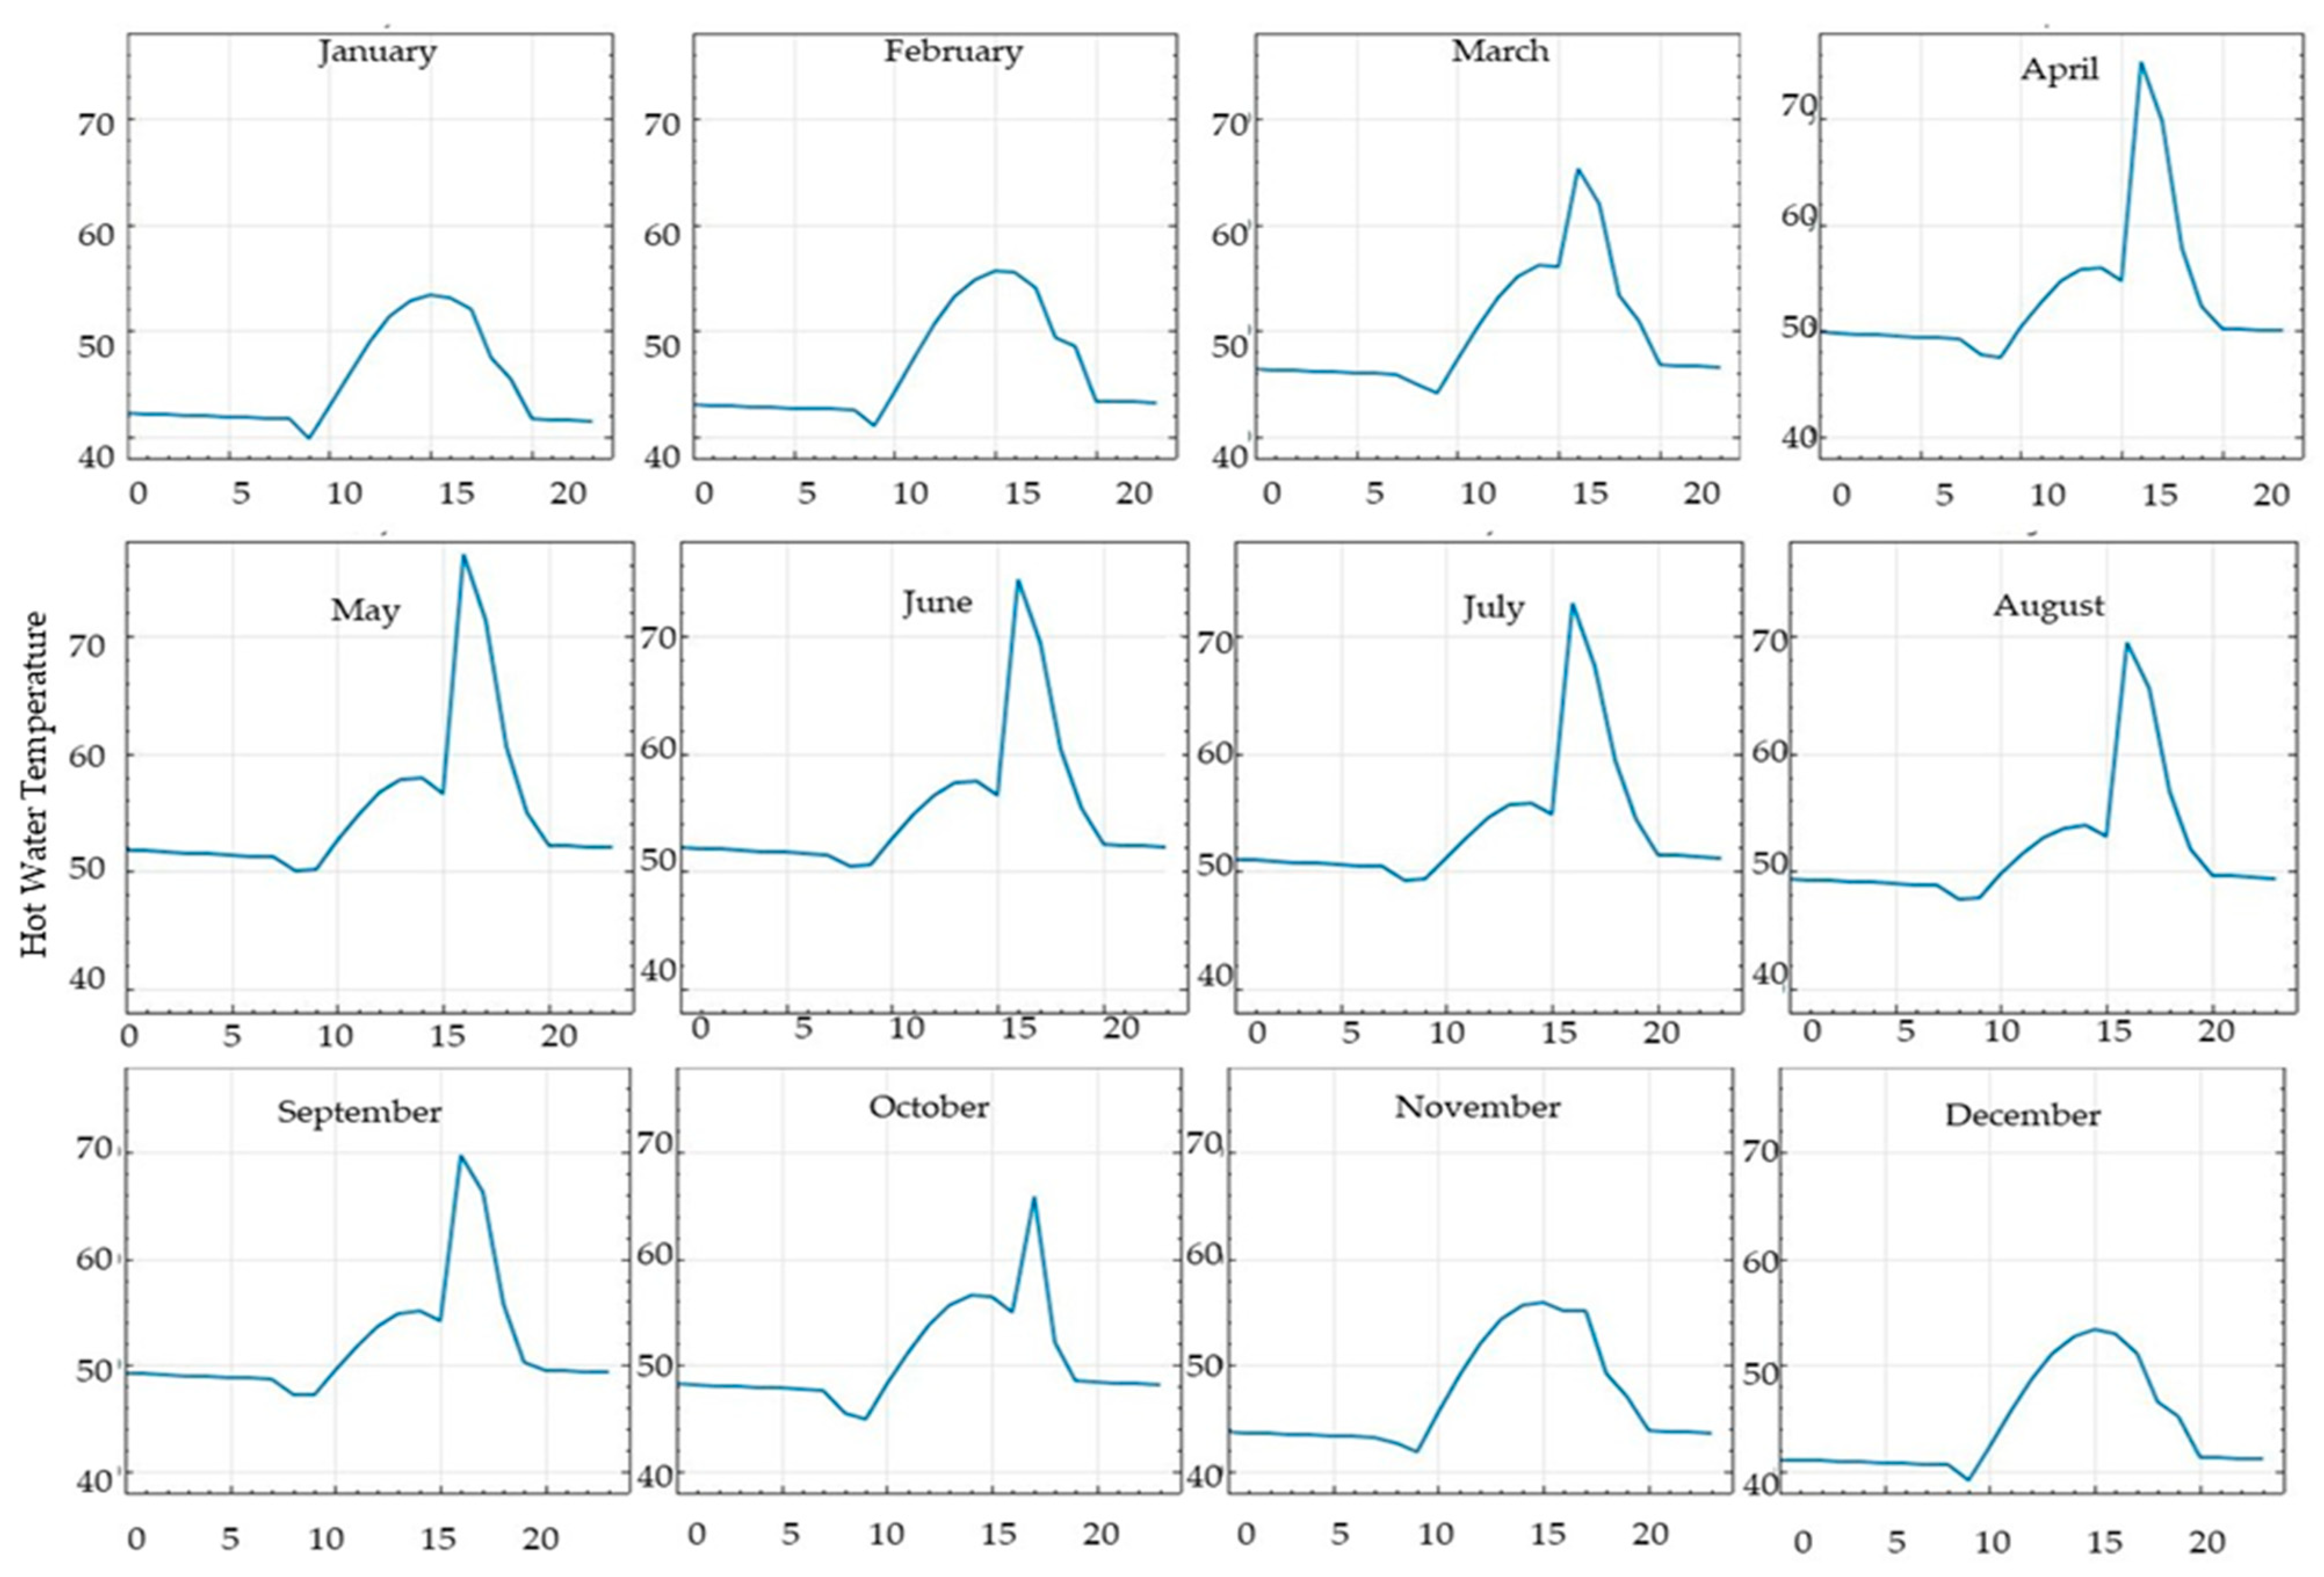
Figure 11 represents the hourly and monthly variation in hot water temperature from January to December. In January–February and November–December, the hot water temperature remains low, whereas it increases from the month of March to the month of September. The highest hot water temperature is obtained between 2 pm and 4 pm for all months (Figure 11). The maximum temperature of hot water was recorded as 76.91 °C in the month of May, whereas the minimum temperature of hot water was recorded as 53.44 °C in the month of January. This is because the peak solar irradiance directly strikes in the region in the month of May between 2 pm and 4 pm and the lowest solar irradiance falls in January, as illustrated in Figure 4. As the Earth’s temperature is increasing globally due to global warming and other environmental effects, the regional temperature is also increasing due to deforestation and implantation.
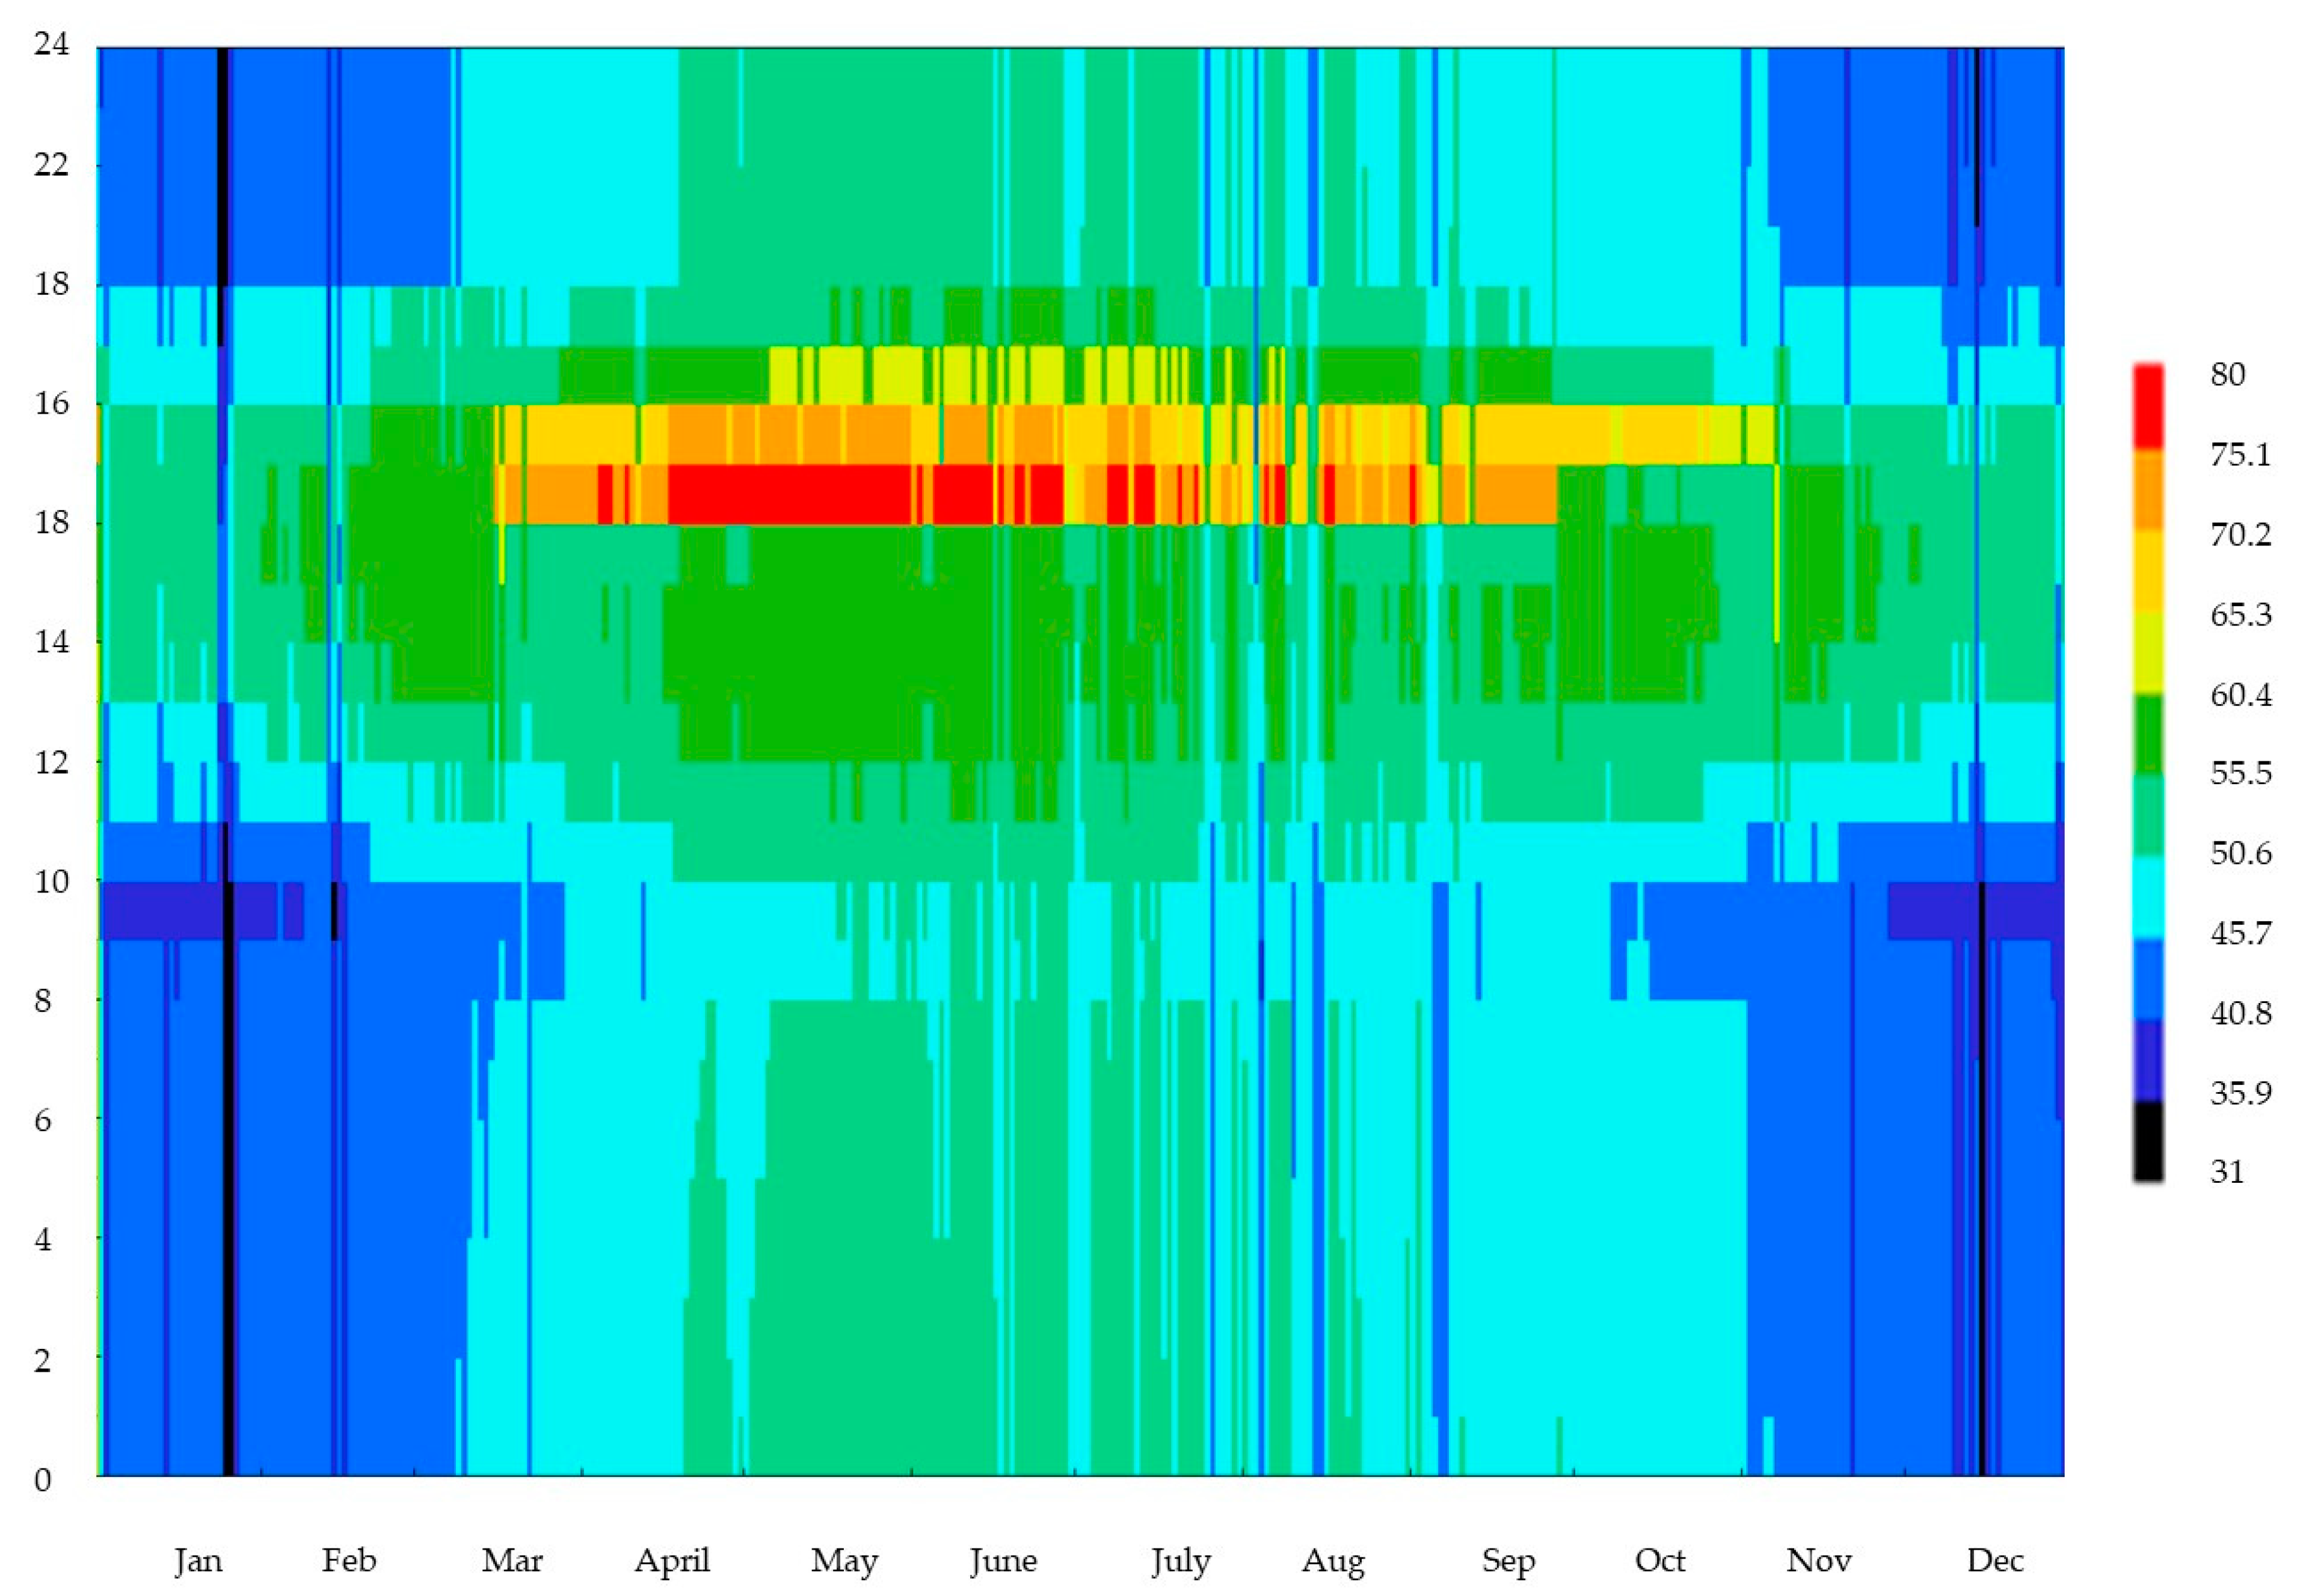
Figure 12 shows the heat map of hot water temperature for an entire year. The blue area indicates the lowest heat region, and green, yellow, and red areas indicate the highest heat region. It can be seen that the peak heat wave occurred from April to July, while the lowest heat wave occurred from November to February. Thus, the large heat wave indicates the high hot water temperature delivered. Additionally, the highest hot water temperature is observed from April to August, and the lowest from November to February.
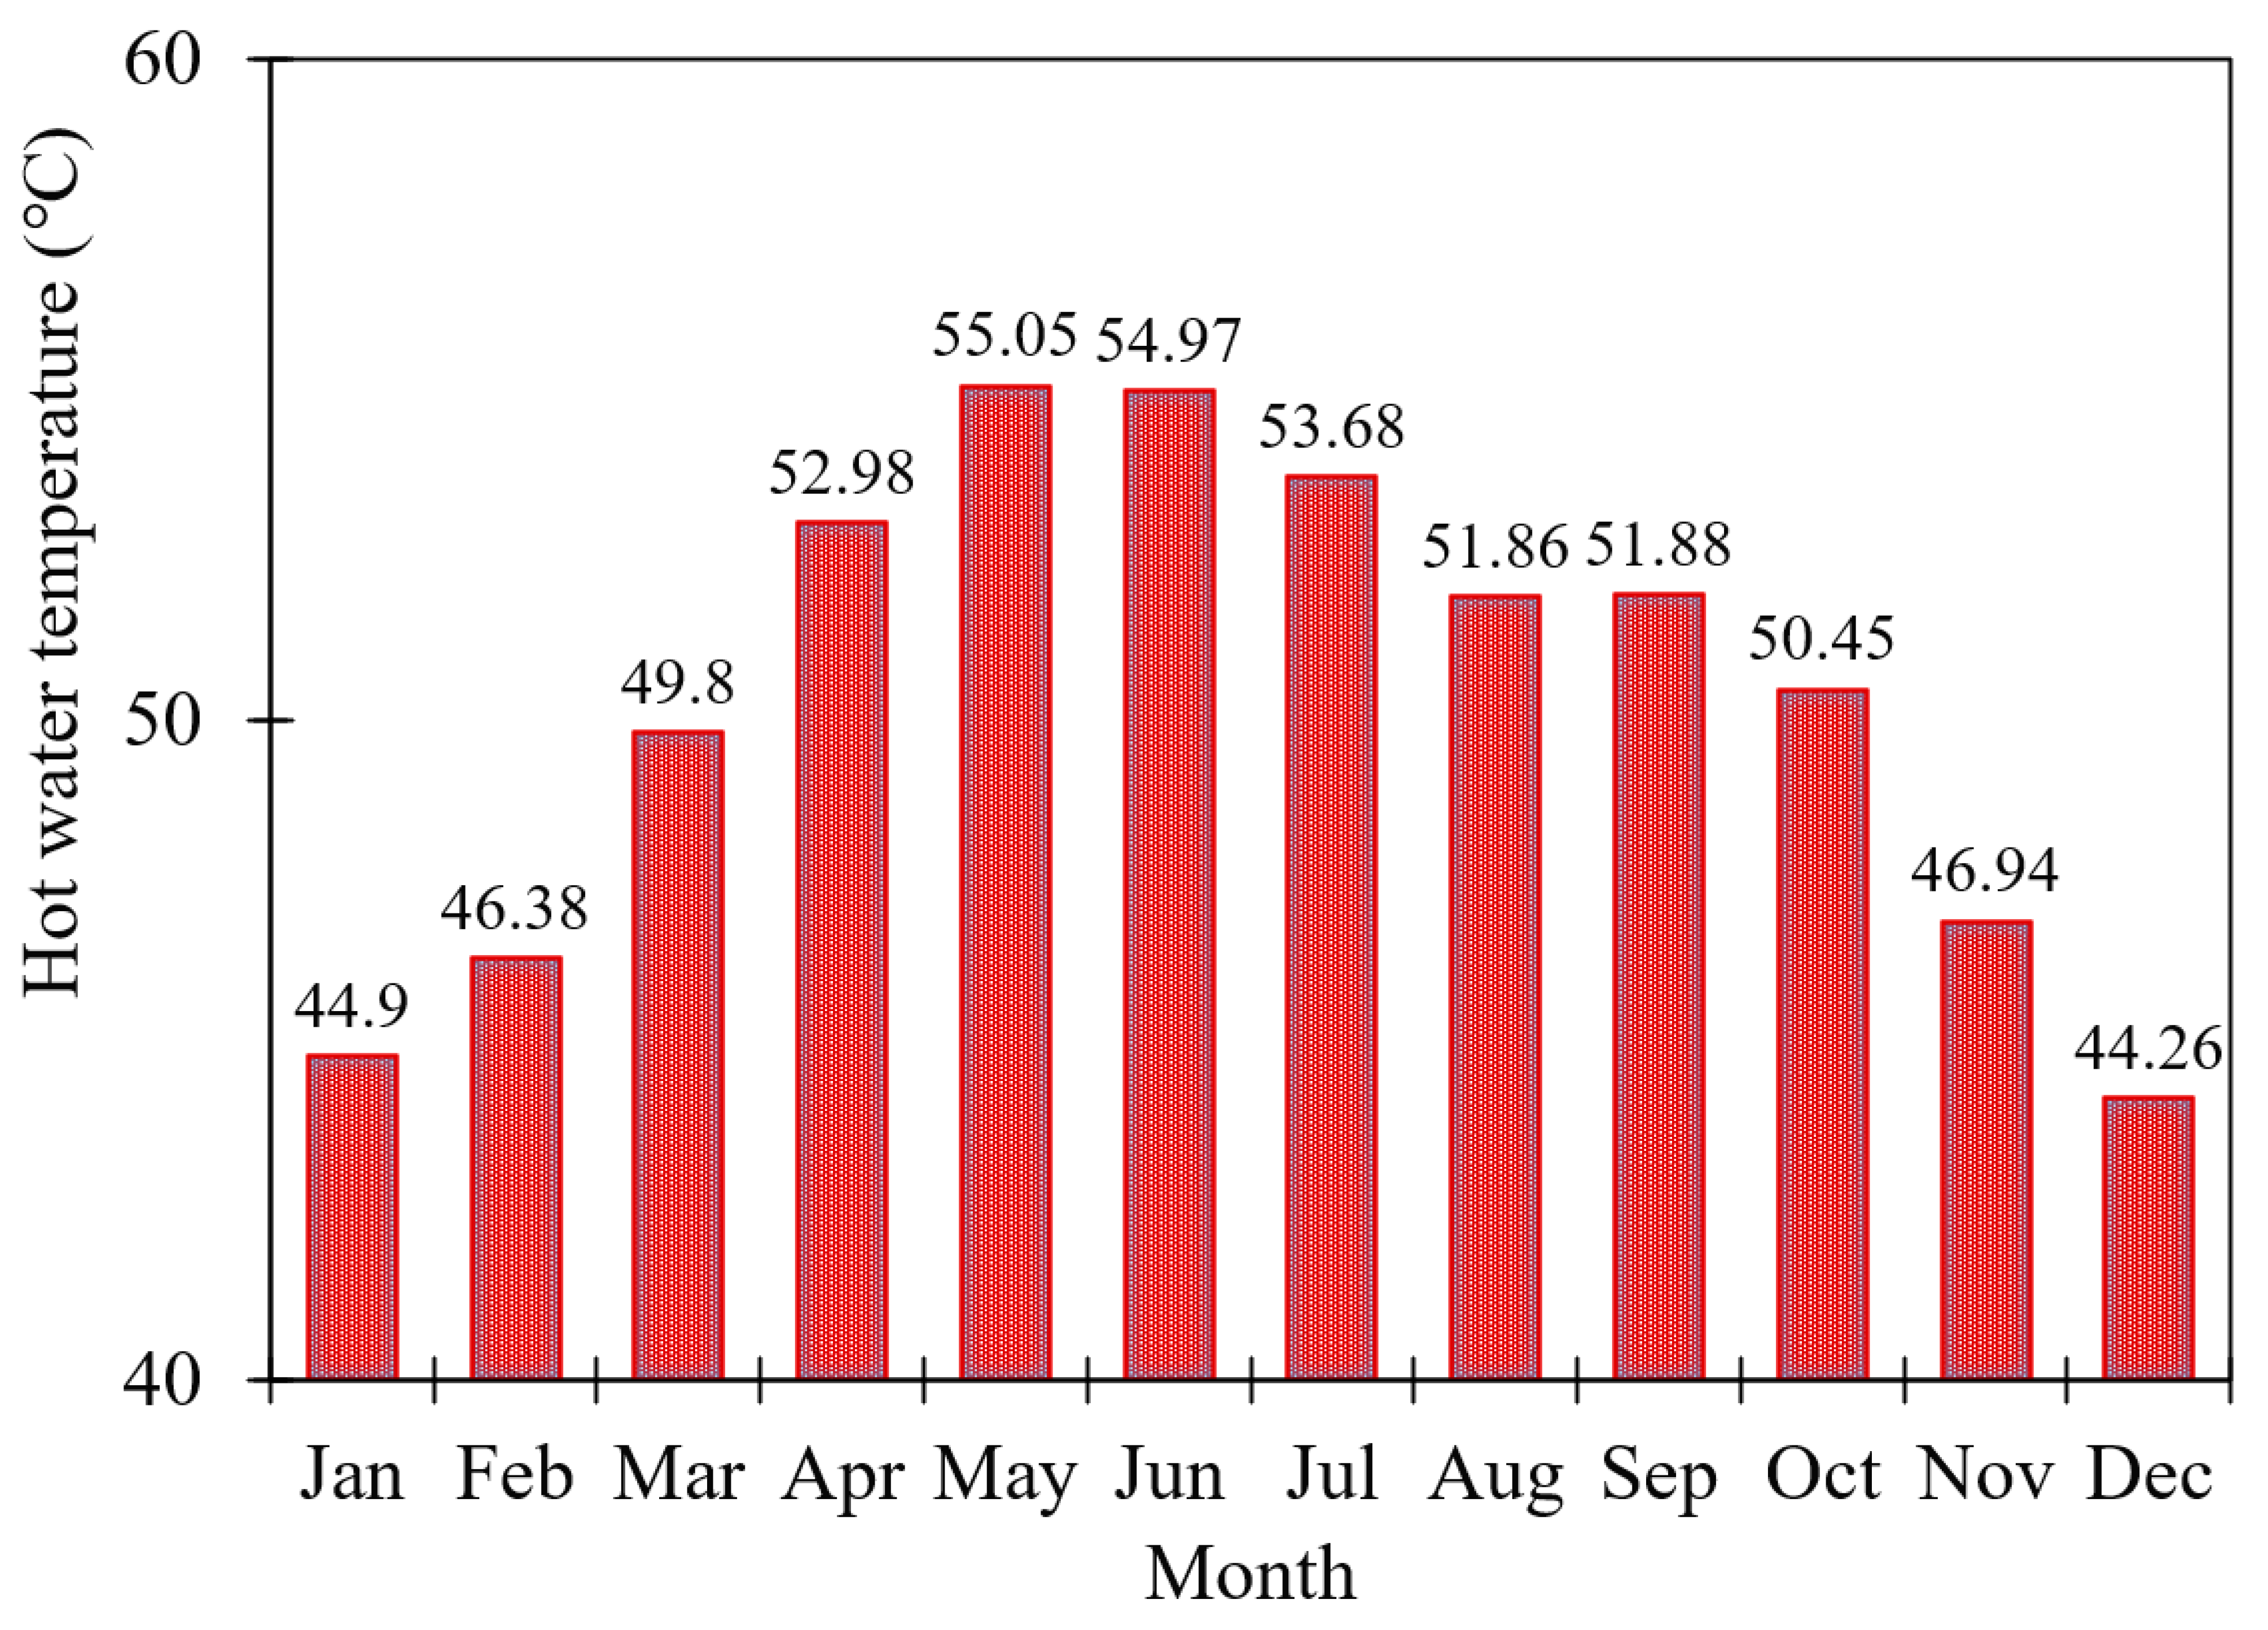
Figure 13 shows the monthly average hot water temperature delivered throughout the year. The average hot water temperature remained the lowest in the winter season and highest in the summer season. The average lowest temperature observed was about 44.26 °C in the month of December, which is the peak of the winter season in the region. The average highest temperature of the hot water was obtained at about 55.05 °C, which was observed in the month of May, which is the peak of the summer season in the region. Moreover, the observed monthly average hot water temperature values are consistent with Figure 12. The solar fraction, which is the ratio of solar energy to total energy delivered to the water storage tank, was found to be 87%.
In addition, the capacity factor of the water heating system was found to be 27.9%. Moreover, for the economic analysis, the total installed cost of the SWHS was calculated, comprising direct and indirect costs. Solar collector and storage costs are included in direct capital costs. Indirect costs include engineering, procurement, construction, land, miscellaneous, and taxes. In the present study, the unit cost of the collector (120 USD/m2) and the unit cost of the storage tank (1200 USD/m3) were adopted from [26], whereas land cost was assumed to be zero. Based on these considerations, the total installed cost of the solar water system was found to be USD 15,272.

6.2. DCMD System

The performance of the DCMD system was evaluated based on hot water temperature using performance parameters which include permeate flux, specific thermal energy consumption (STEC), evaporation efficiency (EE), and fresh water production. The hot water temperature varied from 44 °C to 56 °C with an increment of 3 °C because the SWHS-delivered hot water temperature was in the range of 44.26 °C to 55.06 °C.
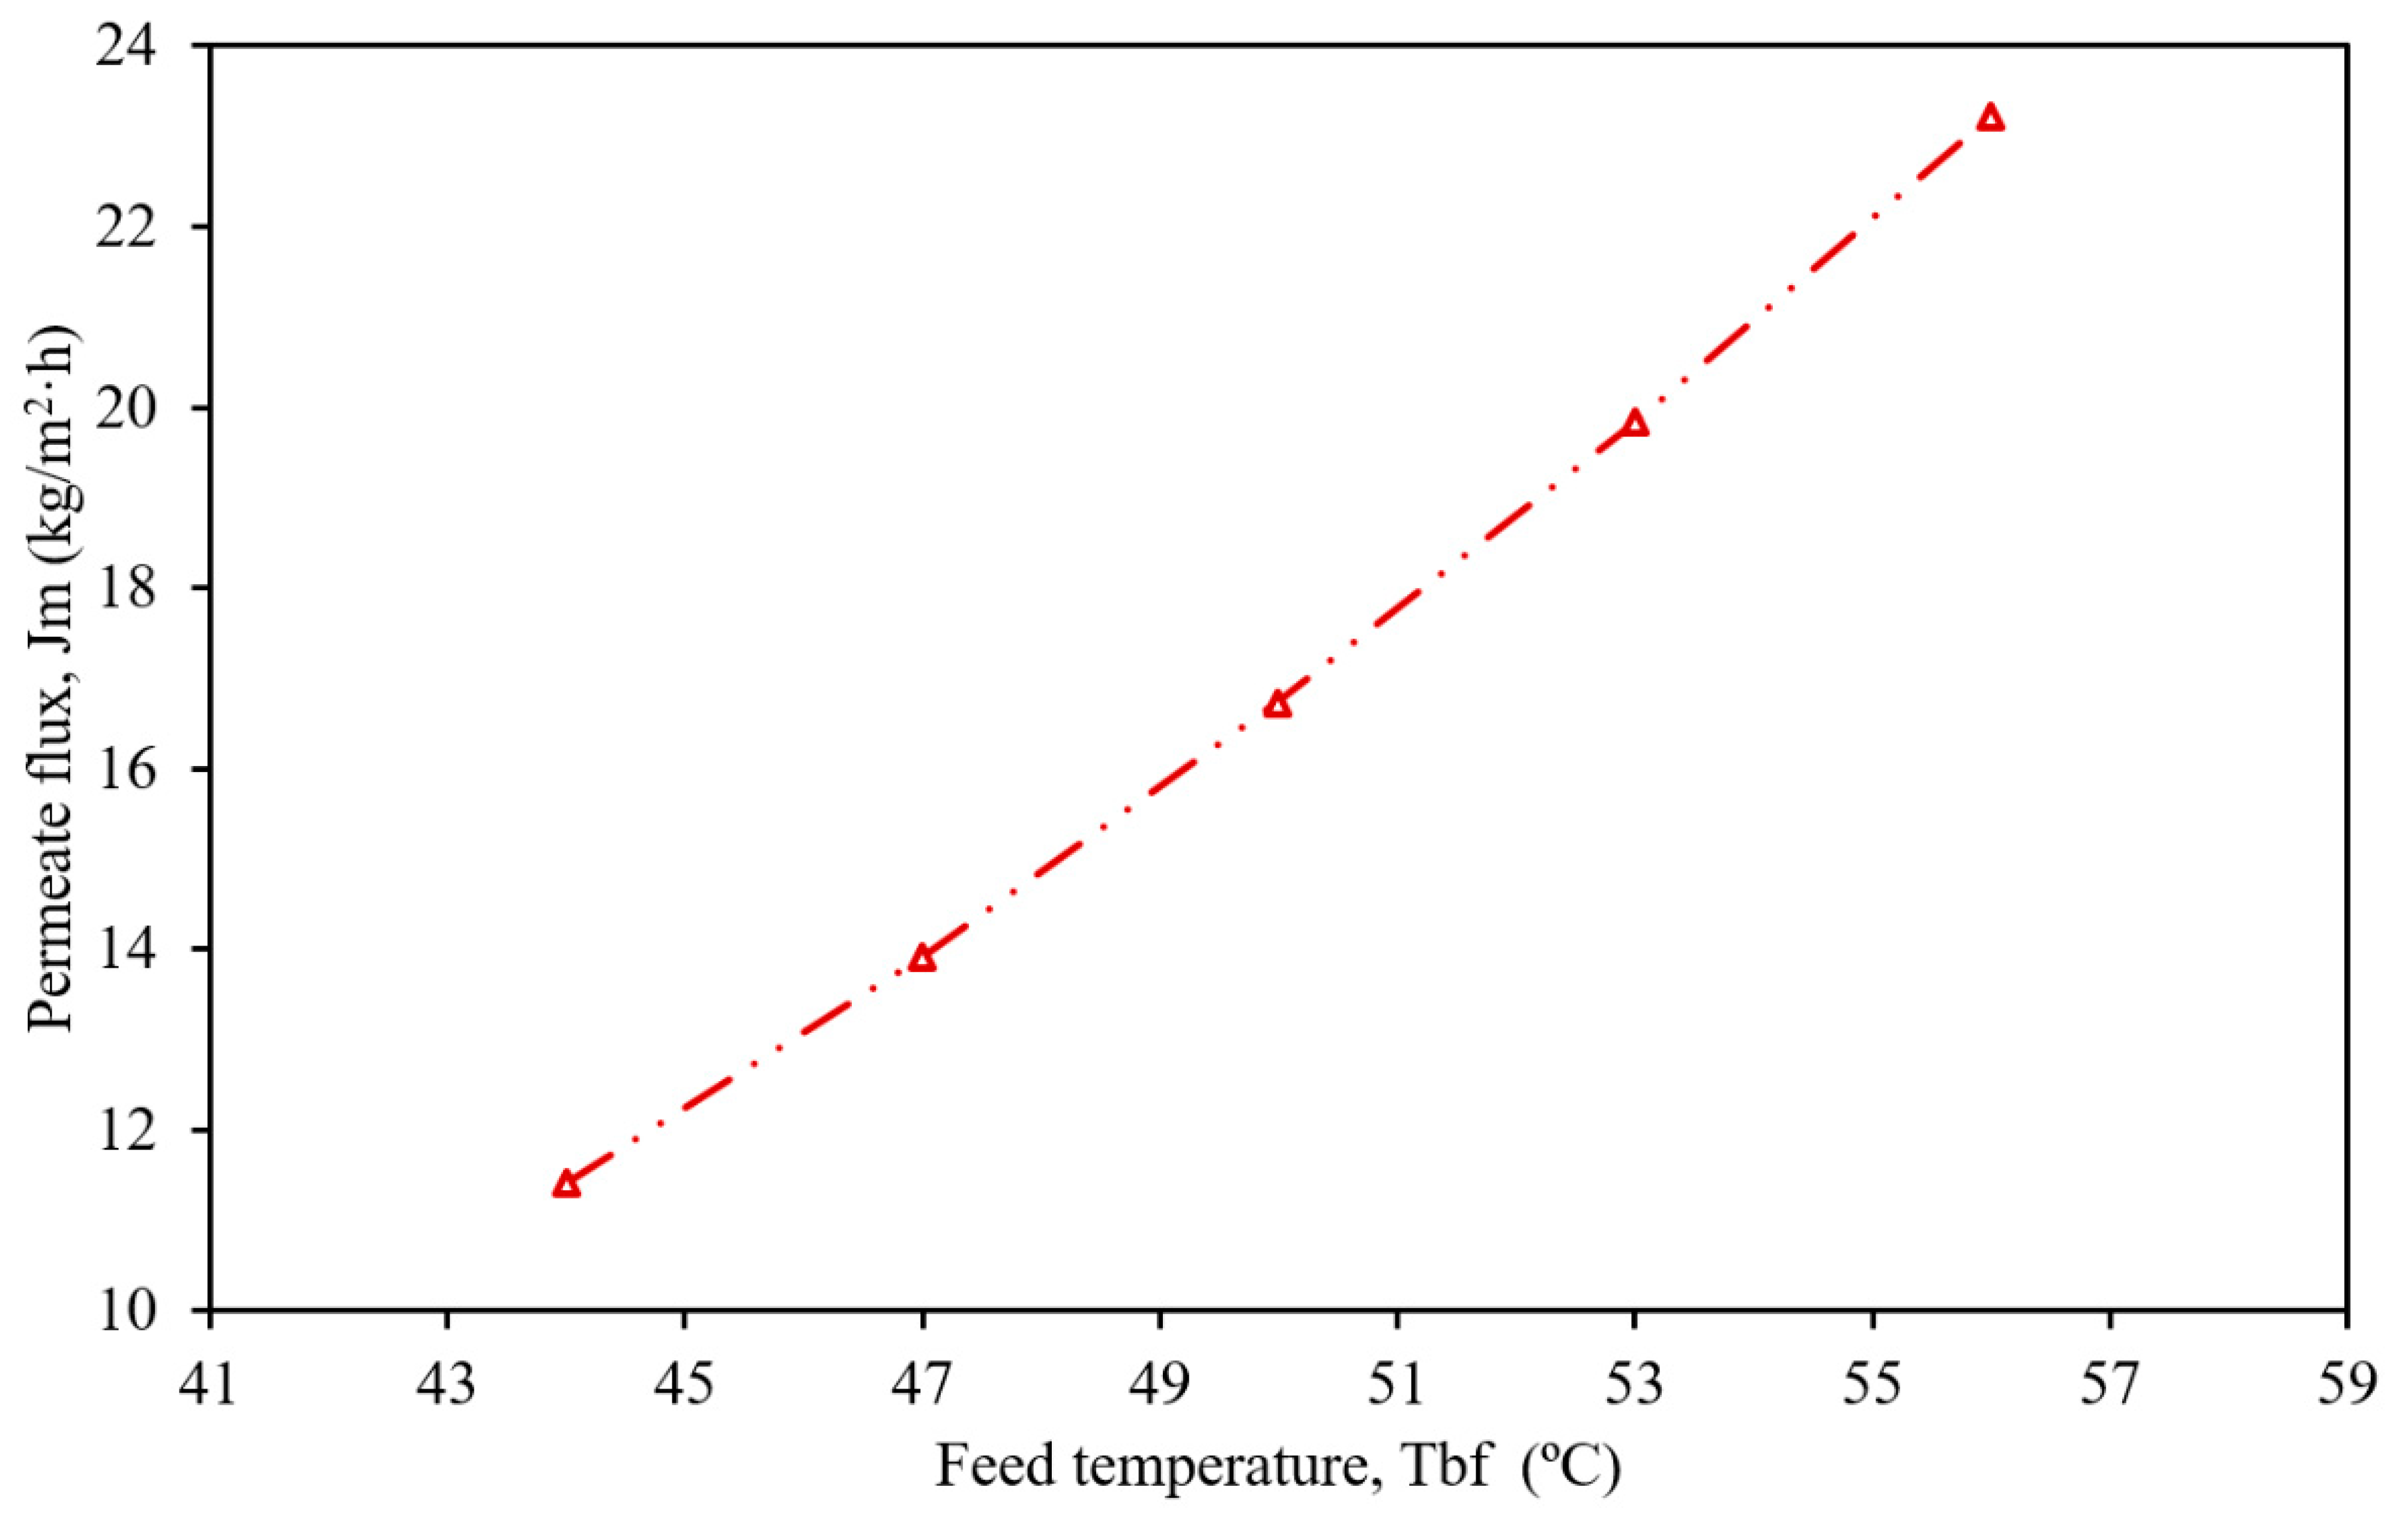
Figure 14 shows the effect of hot water temperature on the permeate flux. The permeate flux is defined as the amount of water vapor crossing the hydrophobic membrane per unit area per unit time. There is a significant surge of permeate flux with increasing hot water temperatures. The minimum value of permeate flux was recorded as 11.4 kg/m2.h at a low feed water temperature of 44 °C. It is evident that the permeate flux is gradually increasing with the rise in hot water temperature (with an increment of 3 °C). The peak value of permeate flux was recorded as 23.23 kg/m2·h, at a peak feed hot water temperature of 56 °C. This is because the higher feed hot water temperature produces more permeate flux, and this behavior is consistent with [27].
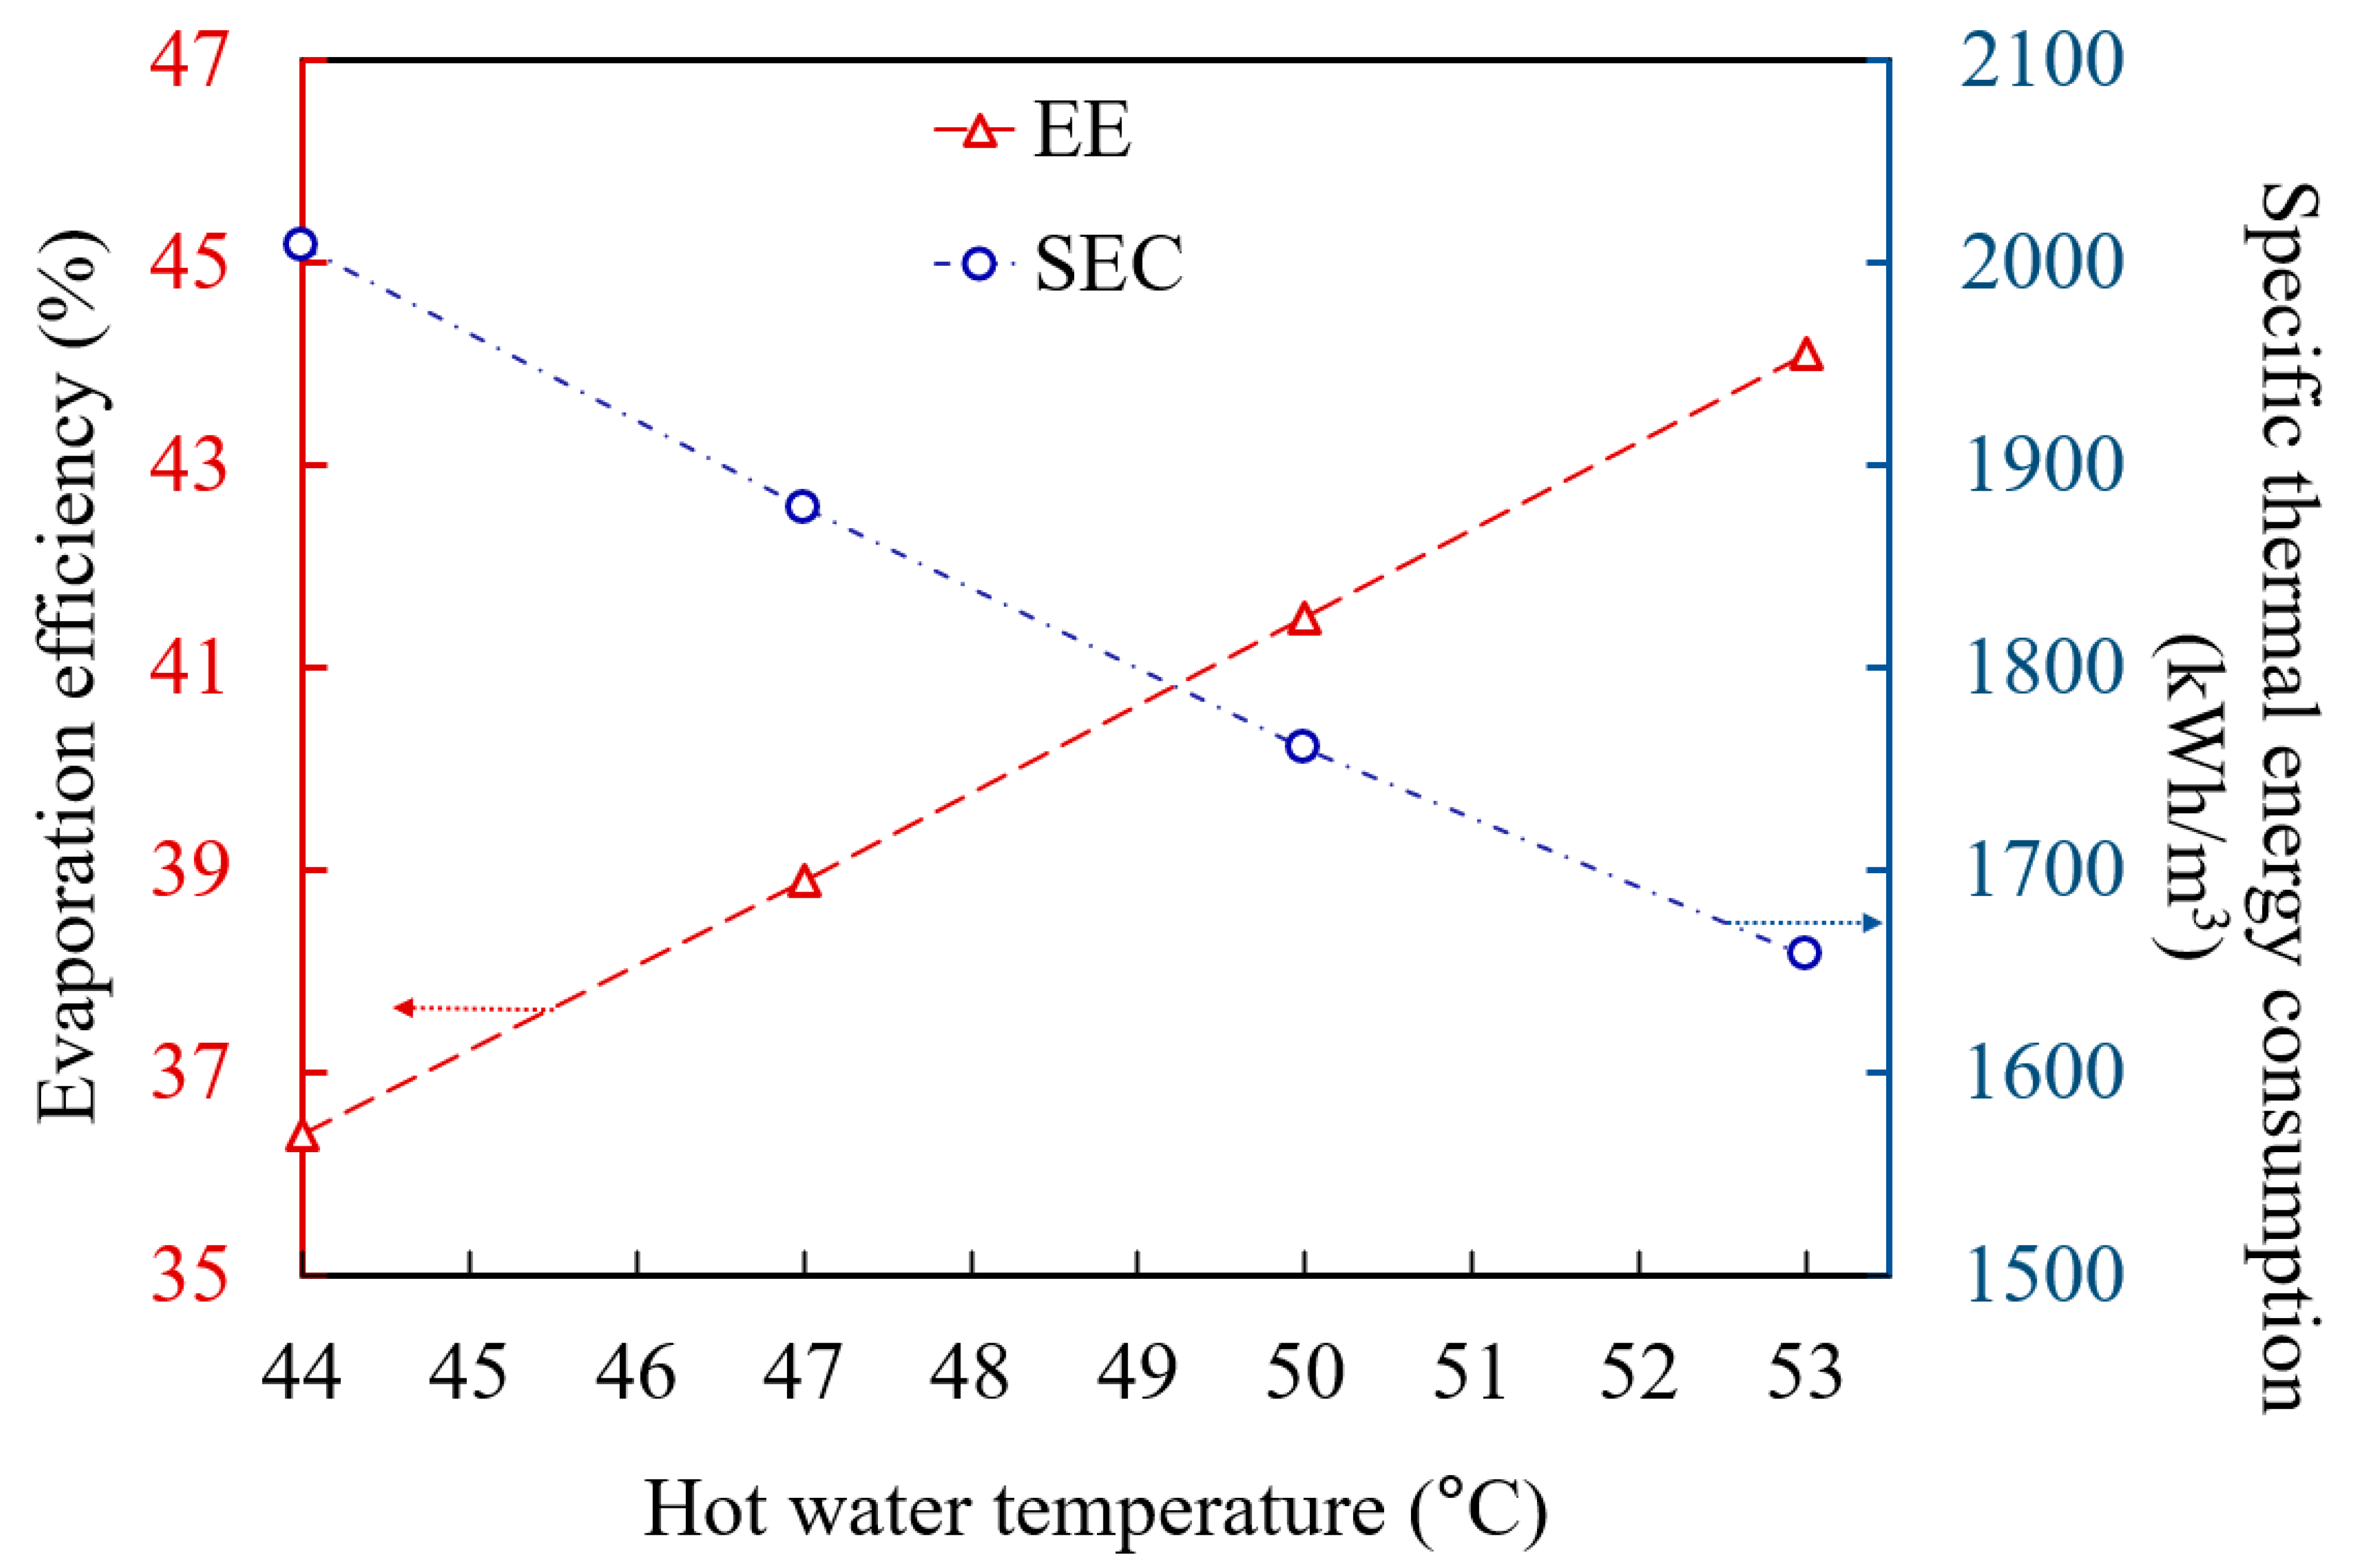
Figure 15 shows the effect of hot water temperature on evaporation efficiency (EE) and specific thermal energy consumption (STEC). The EE and STEC have been determined as the functions of hot water temperature ranging from 44 °C to 56 °C with an increment of 3 °C. The evaporation efficiency is increasing with hot water temperatures. For instance, at a hot water temperature of 44 °C, the evaporation efficiency was obtained as 36.4%. The EE increased linearly with the linear increase in hot water temperature and reached 46.65% at 56 °C. This is because an increase in hot water temperature raises the permeate flux (as shown in Figure 14); hence, EE increased. Furthermore, a decrease in STEC can be observed with the increasing hot water temperatures. The specific thermal energy consumption was 2008 kWh/m3, at a hot water temperature of 44 °C. It was decreased to 1567 kWh/m3 as the hot water temperature increased from 44 to 56 °C. Hence, one may conclude that the performance of a DCMD system is significantly affected by hot water temperature.
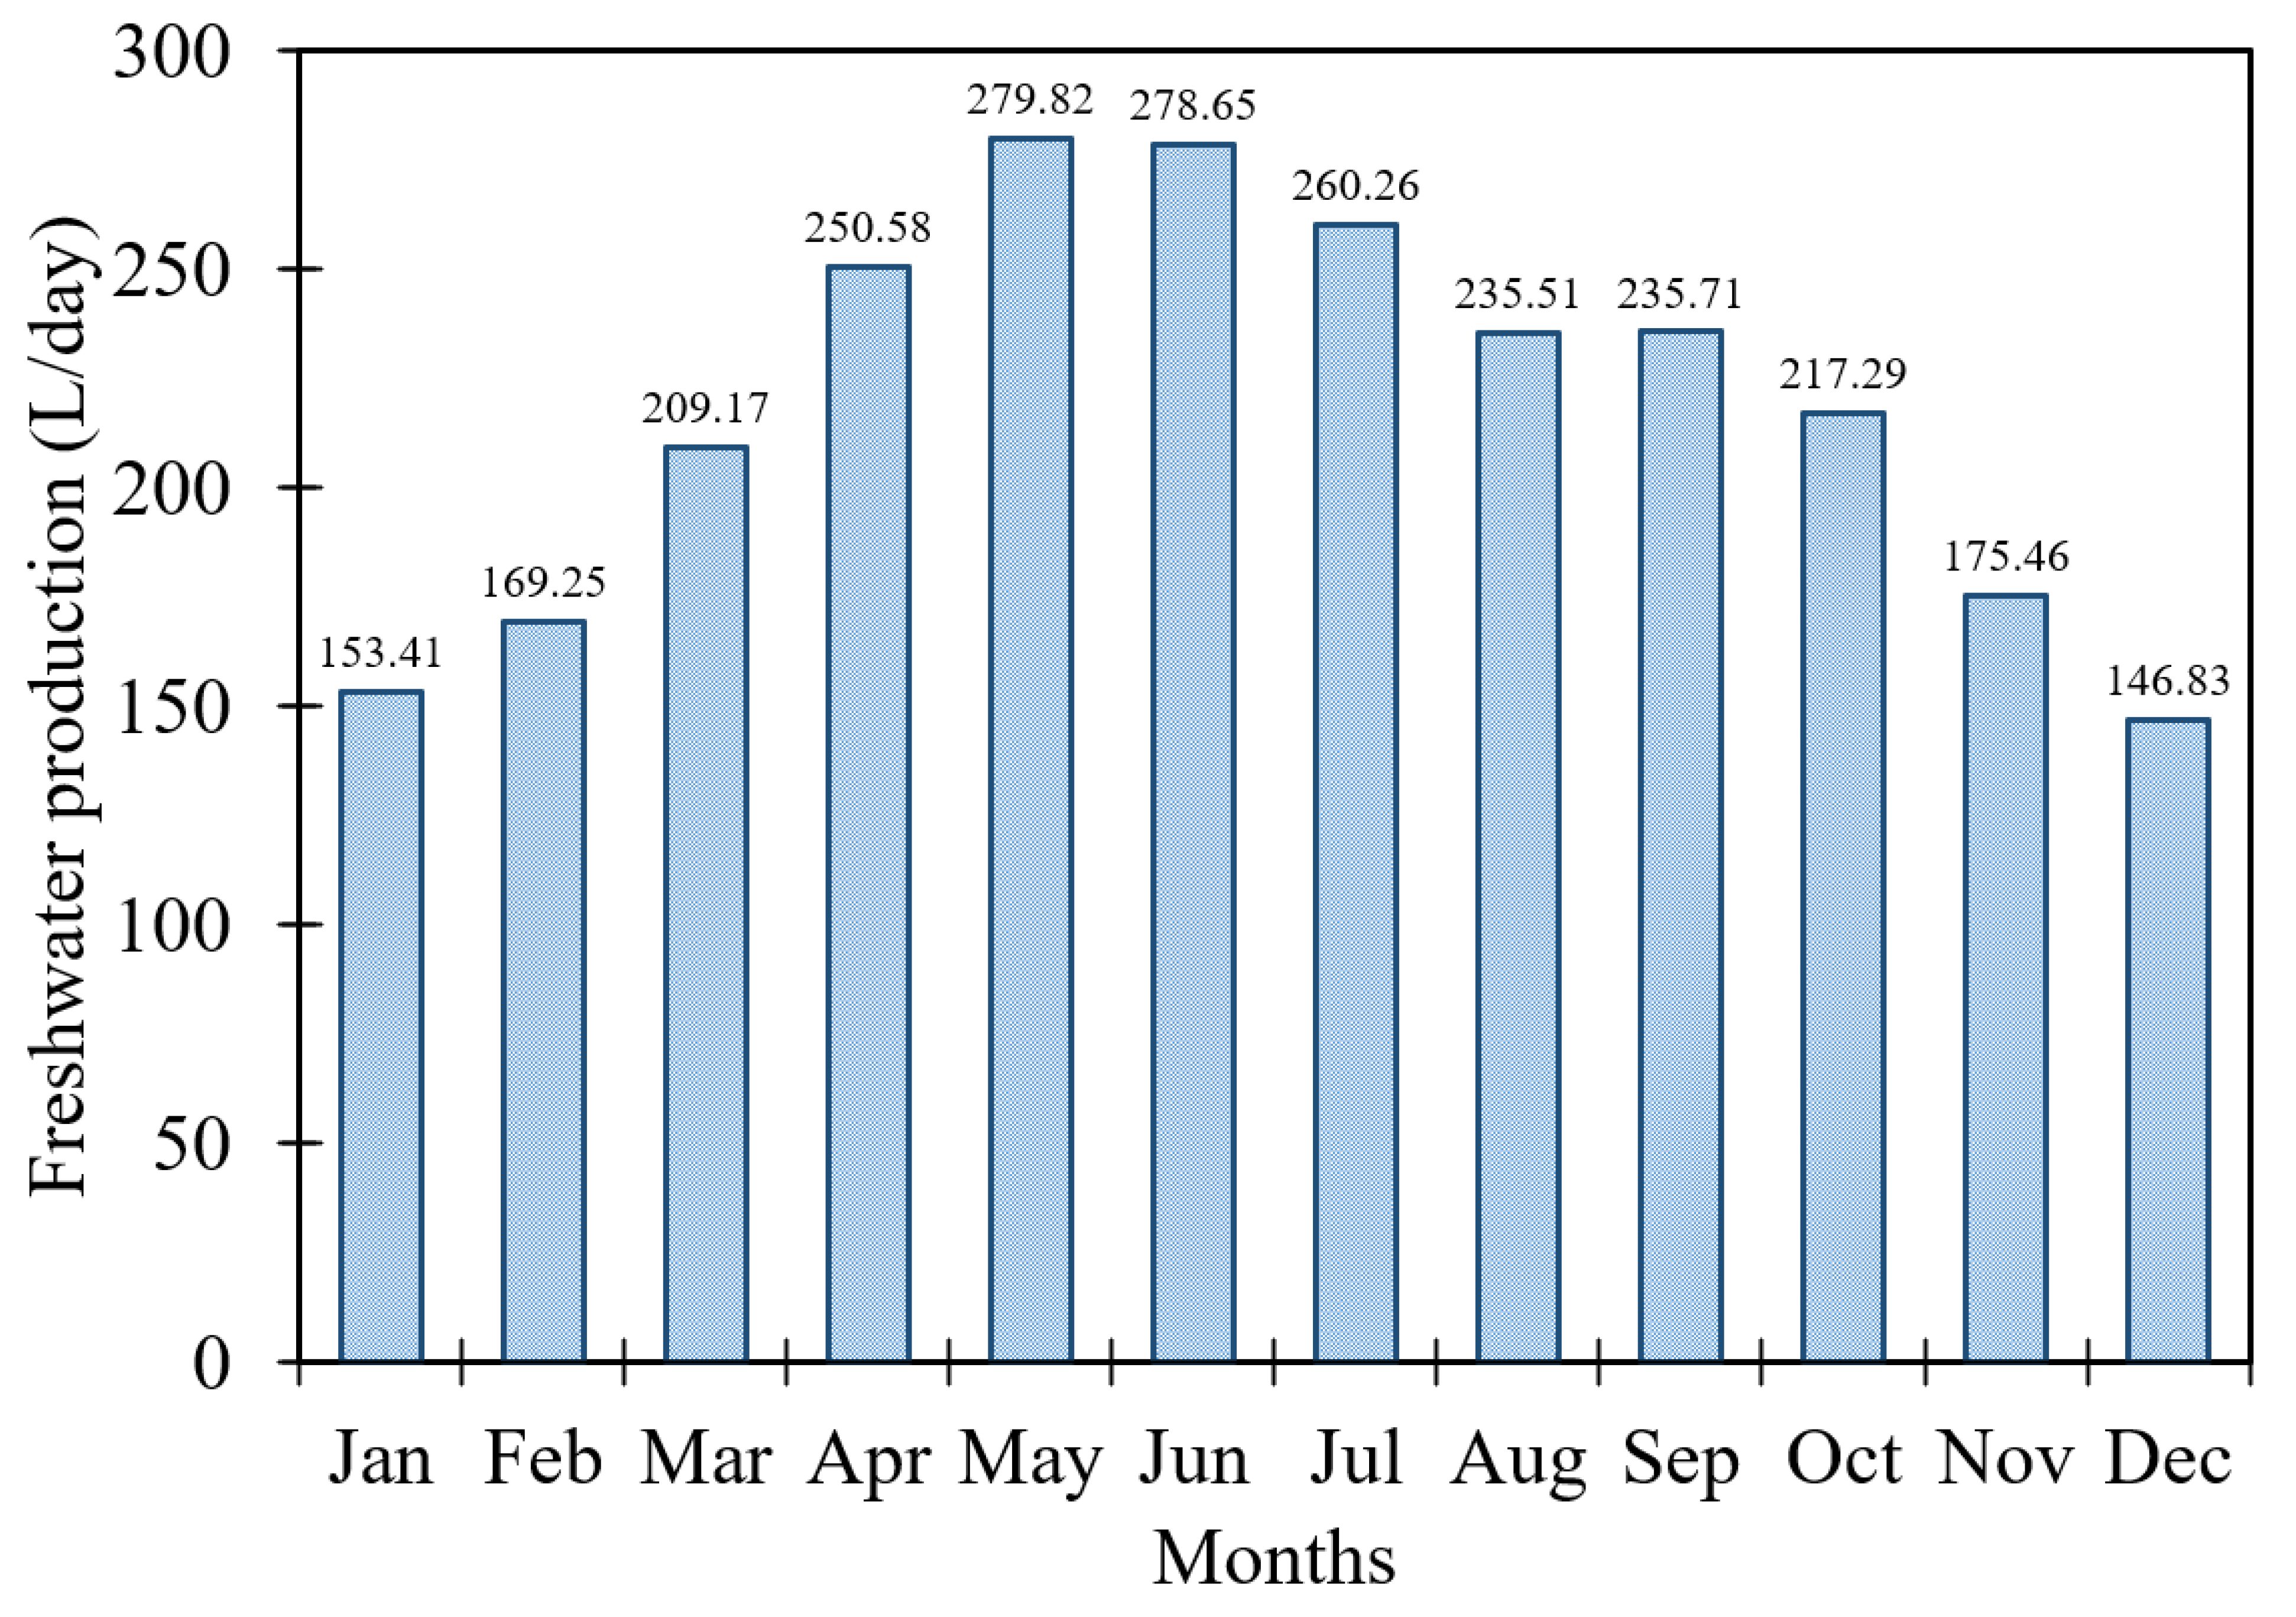
Figure 16 shows the fresh water production in L/day throughout the year. The fresh water production, which is the ultimate objective of this study, has been estimated for a whole year. The temperature of hot water varied for all the months in a year (as shown in Figure 13). The simulated results show that the fresh water production reaches its maximum in the summer and minimum in the winter. Specifically, fresh water production is at its maximum (279.82 L/day) in May and at its minimum (146.83 L/day) in December because the maximum temperature and solar irradiance are obtained in the month of May and the minimum in December. On average, the solar-powered DCMD system produced 217.66 L/day of fresh water. The amount of fresh water produced is enough to be supplied for drinking purposes to a large house/building. Thus, the proposed DCMD system is sufficient to provide drinking water to a house/building.

6.3. Water Cost Evaluation

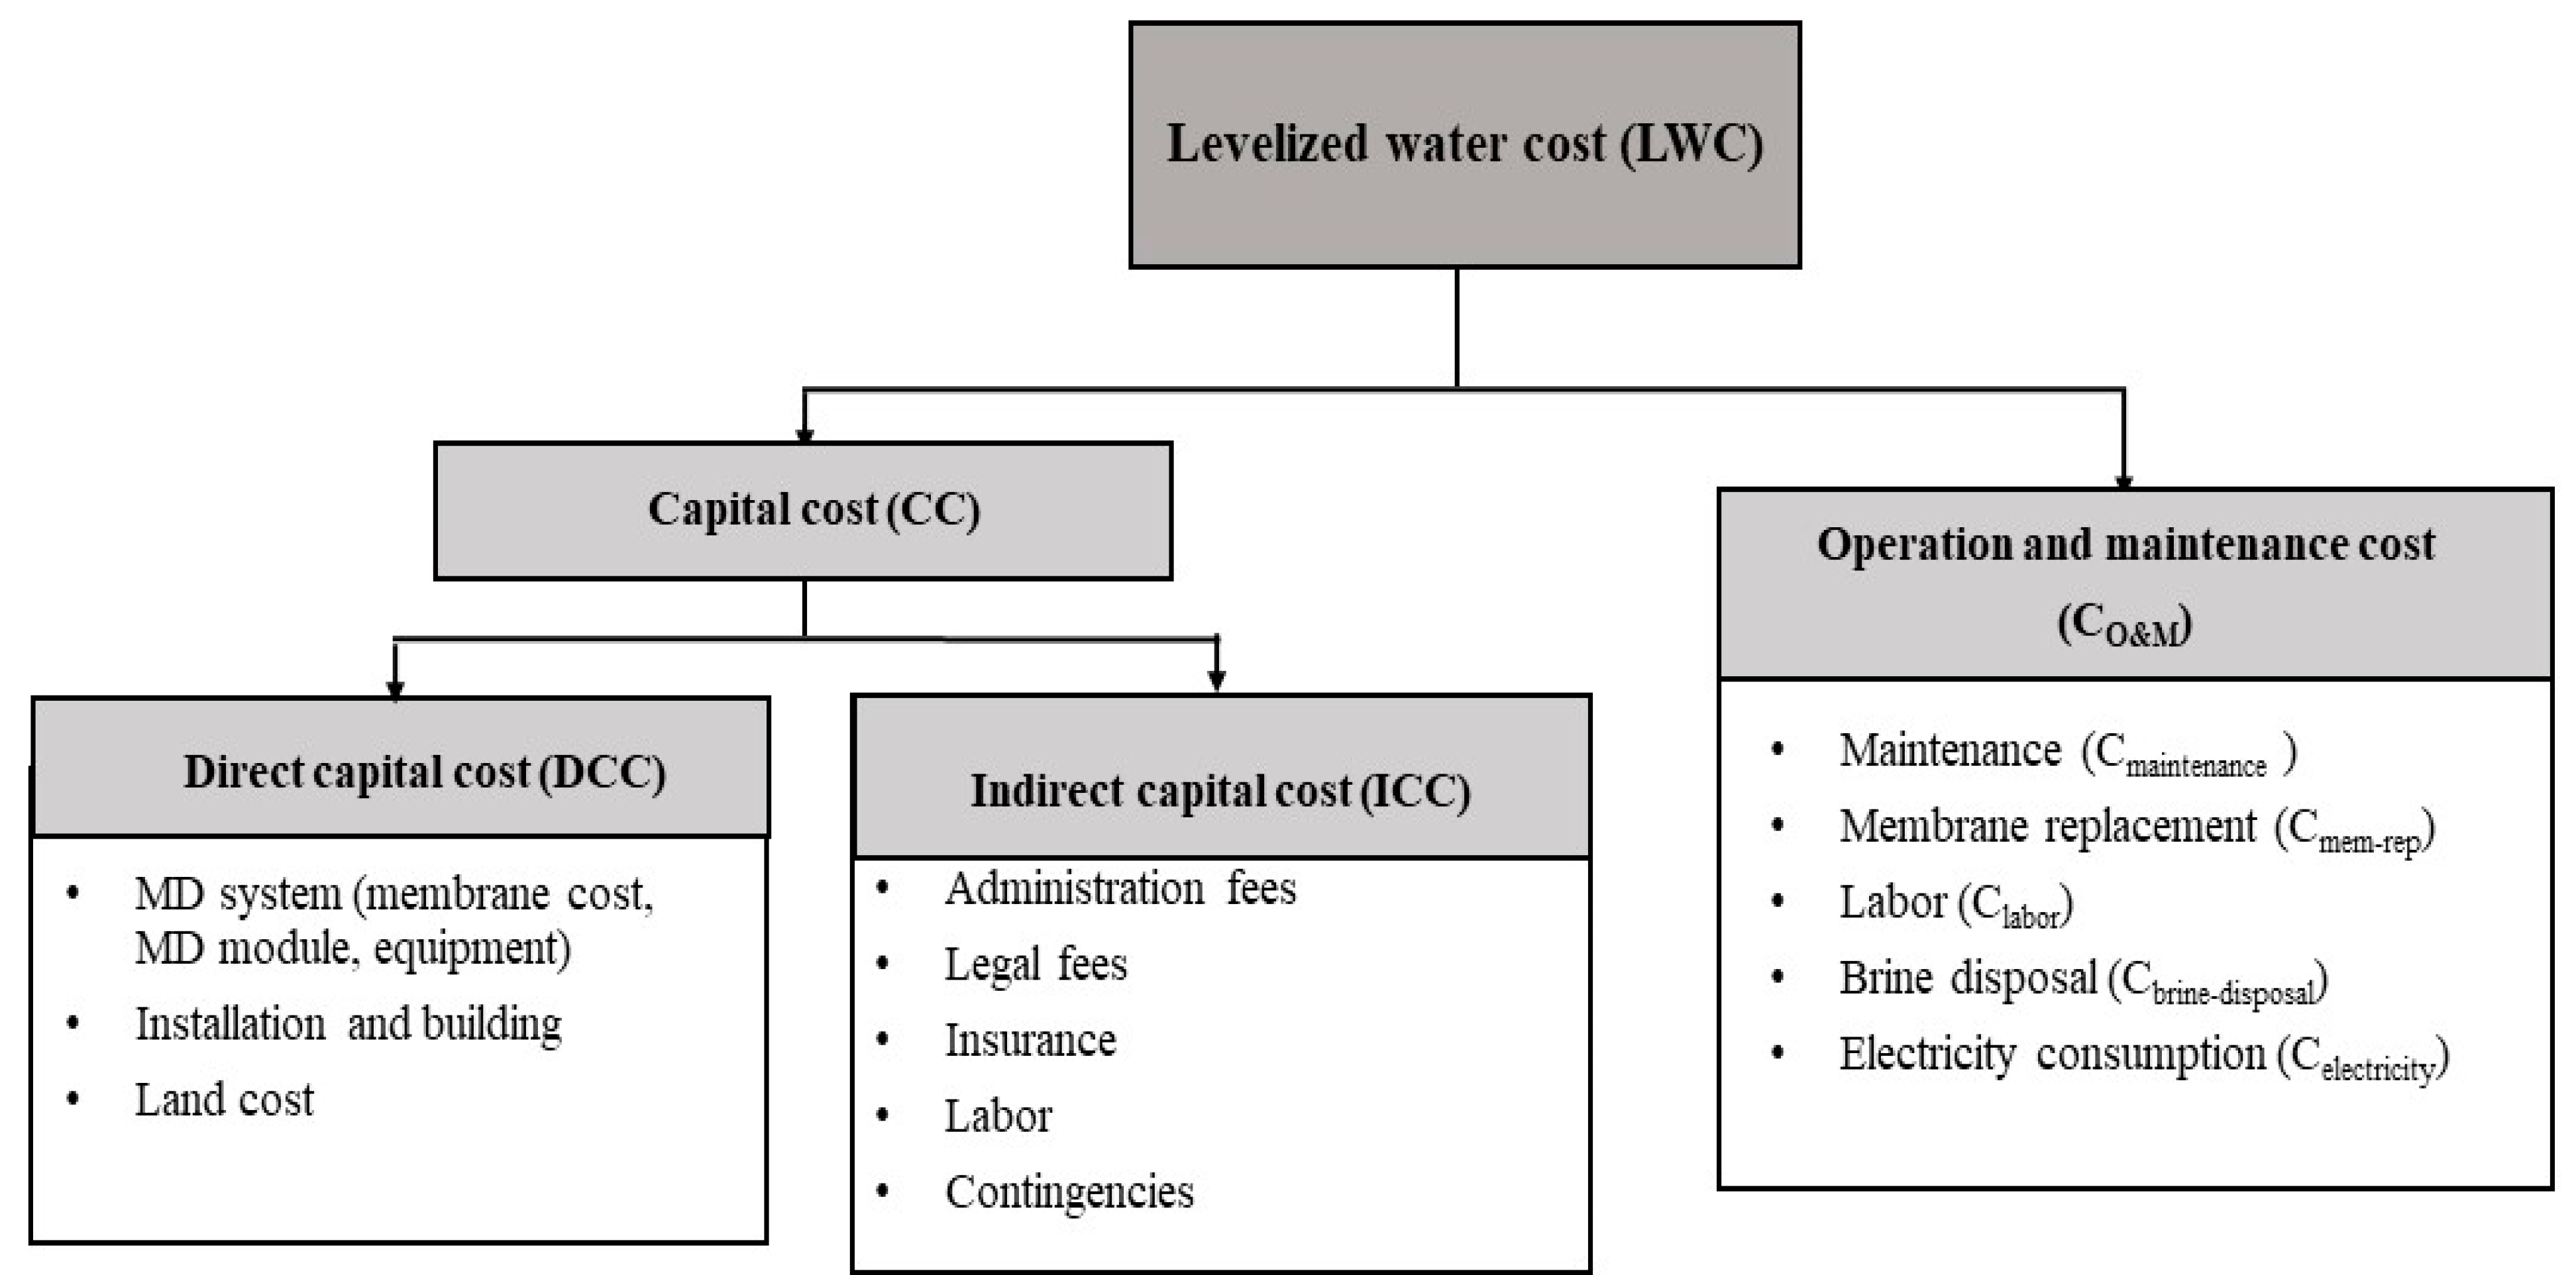
The water cost evaluation of the solar-powered DCMD system has been analyzed through levelized water cost (LWC). The LWC is the unit cost of fresh water production expressed in United States dollars per cubic meter (USD/m3). A breakdown of the LWC model is presented in Figure 17. The availability of the DCMD system (f) was assumed to be 90%, as suggested by [28,29]. The life of the DCMD system was projected to be 20 years [28,29]. The interest rate (i) was kept at 5%, as used by [28,29]. Based on these assumptions, the amortization factor (a) was calculated as 0.0824. Table 2 summarizes the calculations of LWC.
The capital cost (CC) includes direct capital cost (DCC) and the indirect capital cost (ICC). The direct capital cost DCC includes membrane cost, membrane equipment cost which is 77% of membrane cost, total MD module cost, and solar water heating system installation, estimated at about USD 15,434.5. The cost of the solar water heating system has a major share of the capital cost of the system. The indirect capital cost ICC was 10% of the DCC. Thus, the capital cost of the system was estimated as USD 16,977.95. The total annual maintenance cost ACtotal comprises annual operating and maintenance cost ACO&M and annual fixed cost ACfixed and was estimated as USD 1655.17. The LWC was found to be 23.01 USD/m3 for an average fresh water production of 0.217 m3/day, which is approximately 3.91 Pakistani rupees per liter. The LWC of the solar-powered DCMD system was found to be a bit higher. Nonetheless, it is justifiable for small-scale, isolated, and remote residential zones in order to fulfill the fresh water demand without affecting the environment, especially for water-stressed countries such as Pakistan. Moreover, the remaining hot feed water can be used for other purposes such as hot water for bathing in winters, dish washing, etc.

7. Conclusions

We evaluated the performance and cost of a solar-powered DCMD unit for fresh water production in Karachi, Pakistan. The evaluation of the solar water heating system (SWHS) was conducted with the help of a system advisor model (SAM) software tool, whereas the evaluation of the DCMD unit was performed by solving the DCMD mathematical model through a numerical iterative method in MATLAB software®. The following conclusions are made of the present study:
  • The maximum hot water temperature (76.91 °C) was obtained in May, whereas the minimum hot water temperature (53.44 °C) was achieved in January. In particular, the average highest hot water temperature (55.05 °C) was observed in May and the average lowest hot water temperature (44.26 °C) in December.
  • The capacity factor and solar fraction of the solar water heating system were found to be 27.9% and 87%, respectively. The economical evaluation showed that the net capital cost of the solar water system was 16,035 USD.
  • For the DCMD system, an exponential increase in permeate flux from 11.4 kg/m2·h to 23.23 kg/m2·h was observed with increasing hot water temperatures from 44 °C to 56 °C. In addition, the evaporation efficiency of the DCMD system improved from 36.4% to 46.65% when the hot water temperature was increased from 44 °C to 56 °C. In contrast, the specific thermal energy consumption of the DCMD system reduced from 2008 kWh/m3 to 1567 kWh/m3 when the hot water temperature was increased from 44 °C to 56 °C.
  • The fresh water production reached the maximum in summers and the minimum in winters. Specifically, fresh water production was at the maximum (279.82 L/day) in May, and it was at the minimum (146.83 L/day) in December. On average, the solar-powered DCMD system produced 217.66 L/day of fresh water with LWC of 23.01 USD/m3, which is approximately 3.91 Pakistani rupees per liter. The LWC of the solar-powered DCMD system was found to be higher. Nonetheless, it is justifiable for small-scale, isolated, and remote residential zones in order to fulfill the fresh water demand without affecting the environment, especially for water-stressed countries such as Pakistan.

Author Contributions

Study design, data curation, original draft, M.I.S.; methodology, review and editing, S.K., A.U., M.A.S. and A.A. All authors have read and agreed to the published version of the manuscript.

Funding

This research was funded by the Researcher’s Supporting Project Number (RSP-2021/269), King Saud University, Riyadh, Saudi Arabia.

Institutional Review Board Statement

Not applicable.

Informed Consent Statement

Not applicable.

Data Availability Statement

Not applicable.

Acknowledgments

The authors would like to acknowledge the Researcher’s Supporting Project Number (RSP-2021/269) King Saud University, Riyadh, Saudi Arabia, for their support in this work.

Conflicts of Interest

The authors declare no conflict of interest.

References

  1. Saleem, K.B.; Lounes, K.A.; Alshara, K.; Kolsi, L. Double-diffusive natural convection in a solar distiller with external fluid stream cooling. Int. J. Mech. Sci. 2020, 181, 105728. [Google Scholar] [CrossRef]
  2. Wichelns, D.; Nakao, M. Economic analysis of environmental issues regarding seawater desalination. Water Int. 2007, 32, 230–243. [Google Scholar] [CrossRef]
  3. World Health Organization. Available online: http://www.who.int/mediacentre/factsheets/fs391/en/ (accessed on 11 December 2020).
  4. Ali, A.; Ashu, T.R.; Francesca, M.; Efrem, C.; Enrico, D. Membrane technology in renewable-energy-driven desalination. Renew. Sustain. Energy Rev. 2018, 81, 1–21. [Google Scholar] [CrossRef]
  5. Ghaffour, N.; Bundschuh, J.; Mahmoudi, H.; Goosen, M.F.A. Renewable energy-driven desalination technologies: A comprehensive review on challenges and potential applications of integrated systems. Desalination 2015, 356, 94–114. [Google Scholar] [CrossRef] [Green Version]
  6. González, D.; Amigo, J.; Suárez, F. Membrane distillation: Perspectives for sustainable and improved desalination. Renew. Sustain. Energy Rev. 2017, 80, 238–259. [Google Scholar] [CrossRef]
  7. Qtaishat, M.R.; Banat, F. Desalination by solar powered membrane distillation systems. Desalination 2013, 308, 186–197. [Google Scholar] [CrossRef]
  8. Pal, P.; Manna, A.K. Removal of arsenic from contaminated groundwater by solar-driven membrane distillation using three different commercial membranes. Water Res. 2010, 44, 5750–5760. [Google Scholar] [CrossRef]
  9. Kim, Y.D.; Thu, K.; Ghaffour, N.; Ng, K.C. Performance investigation of a solar-assisted direct contact membrane distillation system. J. Membr. Sci. 2013, 427, 345–364. [Google Scholar] [CrossRef] [Green Version]
  10. Shim, W.G.; He, K.; Gray, I.S.; Moon, I.S. Solar energy assisted direct contact membrane distillation (DCMD) process for seawater desalination. Separ. Purifi. Technol. 2015, 143, 94–104. [Google Scholar] [CrossRef]
  11. Bouguecha, S.T.; Aly, S.E.; Al-Beirutty, M.H.; Hamdi, M.M.; Boubkari, A. Solar driven DCMD: Performance evaluation and thermal energy efficiency. Chem. Eng. Res. Des. 2015, 100, 331–340. [Google Scholar] [CrossRef]
  12. Lee, J.G.; Kim, W.S.; Choi, J.S.; Ghaffour, N.; Kim, Y.D. Dynamic solar-powered multi-stage direct contact membrane distillation system: Concept design, modeling and simulation. Desalination 2017, 435, 278–292. [Google Scholar] [CrossRef]
  13. Duong, H.C.; Xia, l.; Ma, Z.; Cooper, P.; Ela, W.; Nghiem, L.D. Assessing the performance of solar thermal driven membrane distillation for seawater desalination by computer simulation. J. Membr. Sci. 2017, 542, 133–142. [Google Scholar] [CrossRef]
  14. Soomro, M.I.; Kim, W.-S. Performance and economic investigations of solar power tower plant integrated with direct contact membrane distillation system. Energy Convers. Manag. 2018, 174, 626–638. [Google Scholar] [CrossRef]
  15. Soomro, M.I.; Kim, W.-S. Parabolic-trough plant integrated with direct-contact membrane distillation system: Concept, simulation, performance, and economic evaluation. Sol. Energy 2018, 173, 348–361. [Google Scholar] [CrossRef]
  16. Soomro, M.I.; Kim, W.-S. Performance and economic evaluation of linear Fresnel reflector plant integrated direct contact membrane distillation system. Renew. Energy 2018, 129, 561–569. [Google Scholar] [CrossRef]
  17. Soomro, M.I.; Kim, W.-S.; Kim, Y.-D. Performance and cost comparison of different concentrated solar power plants integrated with direct-contact membrane distillation system. Energy Convers. Manag. 2020, 221, 113193. [Google Scholar] [CrossRef]
  18. SOLARGIS. Available online: https://solargis.com/maps-and-gis-data/download/pakistan (accessed on 11 May 2018).
  19. System Advisor Model (SAM). National Renewable Energy Laboratory. Available online: https://sam.nrel.gov/weather (accessed on 7 June 2018).
  20. Annual Weather Averages. Sunshine hours in Karachi, Pakistan. Available online: https://www.holiday-weather.com/karachi/averages/ (accessed on 2 October 2018).
  21. World Resources Institute. Climate Impacts and Adaptation. Available online: https://www.wri.org/ (accessed on 20 May 2020).
  22. Sea Temperature Info. Water Temperature in Karachi. Available online: https://seatemperature.info/karachi-water-temperature (accessed on 3 June 2018).
  23. Khayet, M. Membranes and theoretical modeling of membrane distillation: A review. Adv. Colloid. Interface Sci. 2011, 164, 56–88. [Google Scholar] [CrossRef]
  24. Lee, J.G.; Kim, W.S.; Choi, J.S.; Ghaffour, N.; Kim, Y.D. A novel multi-stage direct contact membrane distillation module: Design, experimental and theoretical approaches. Water Res. 2016, 107, 47–56. [Google Scholar] [CrossRef]
  25. Gustafson, R.D.; Murphy, J.R.; Achilli, A. A stepwise model of direct contact membrane distillation for application to large-scale systems: Experimental results and model predictions. Desalination 2016, 378, 14–27. [Google Scholar] [CrossRef]
  26. Zhang, L.-Z.; Li, G.-P. Energy and economic analysis of a hollow fiber membrane-based desalination system driven by solar energy. Desalination 2017, 404, 200–214. [Google Scholar] [CrossRef]
  27. Khalifa, A.; Ahmad, H.; Antar, M.; Laoui, T.; Khayet, M. Experimental and theoretical investigations on water desalination using direct contact membrane distillation. Desalination 2017, 404, 22–34. [Google Scholar] [CrossRef]
  28. Zuo, G.; Wang, R.; Field, R.; Fane, A.G. Energy efficiency evaluation and economic analyses of direct contact membrane distillation system using Aspen Plus. Desalination 2011, 283, 237–244. [Google Scholar] [CrossRef]
  29. Banat, F.; Jwaied, N. Economic evaluation of desalination by small-scale autonomous solar-powered membrane distillation units. Desalination 2008, 220, 566–573. [Google Scholar] [CrossRef]
  30. Macedonio, F.; Curcio, E.; Drioli, E. Integrated membrane systems for seawater desalination: Energetic and exergetic analysis, economic evaluation, experimental study. Desalination 2007, 203, 260–276. [Google Scholar] [CrossRef]
  31. Al-Obaidani, S.; Curcio, E.; Macedonio, F.; Profio, G.D.; Alhinai, H.; Drioli, E. Potential of membrane distillation in seawater desalination: Thermal efficiency, sensitivity study and cost estimation. J. Membr. Sci. 2008, 323, 85–98. [Google Scholar] [CrossRef]
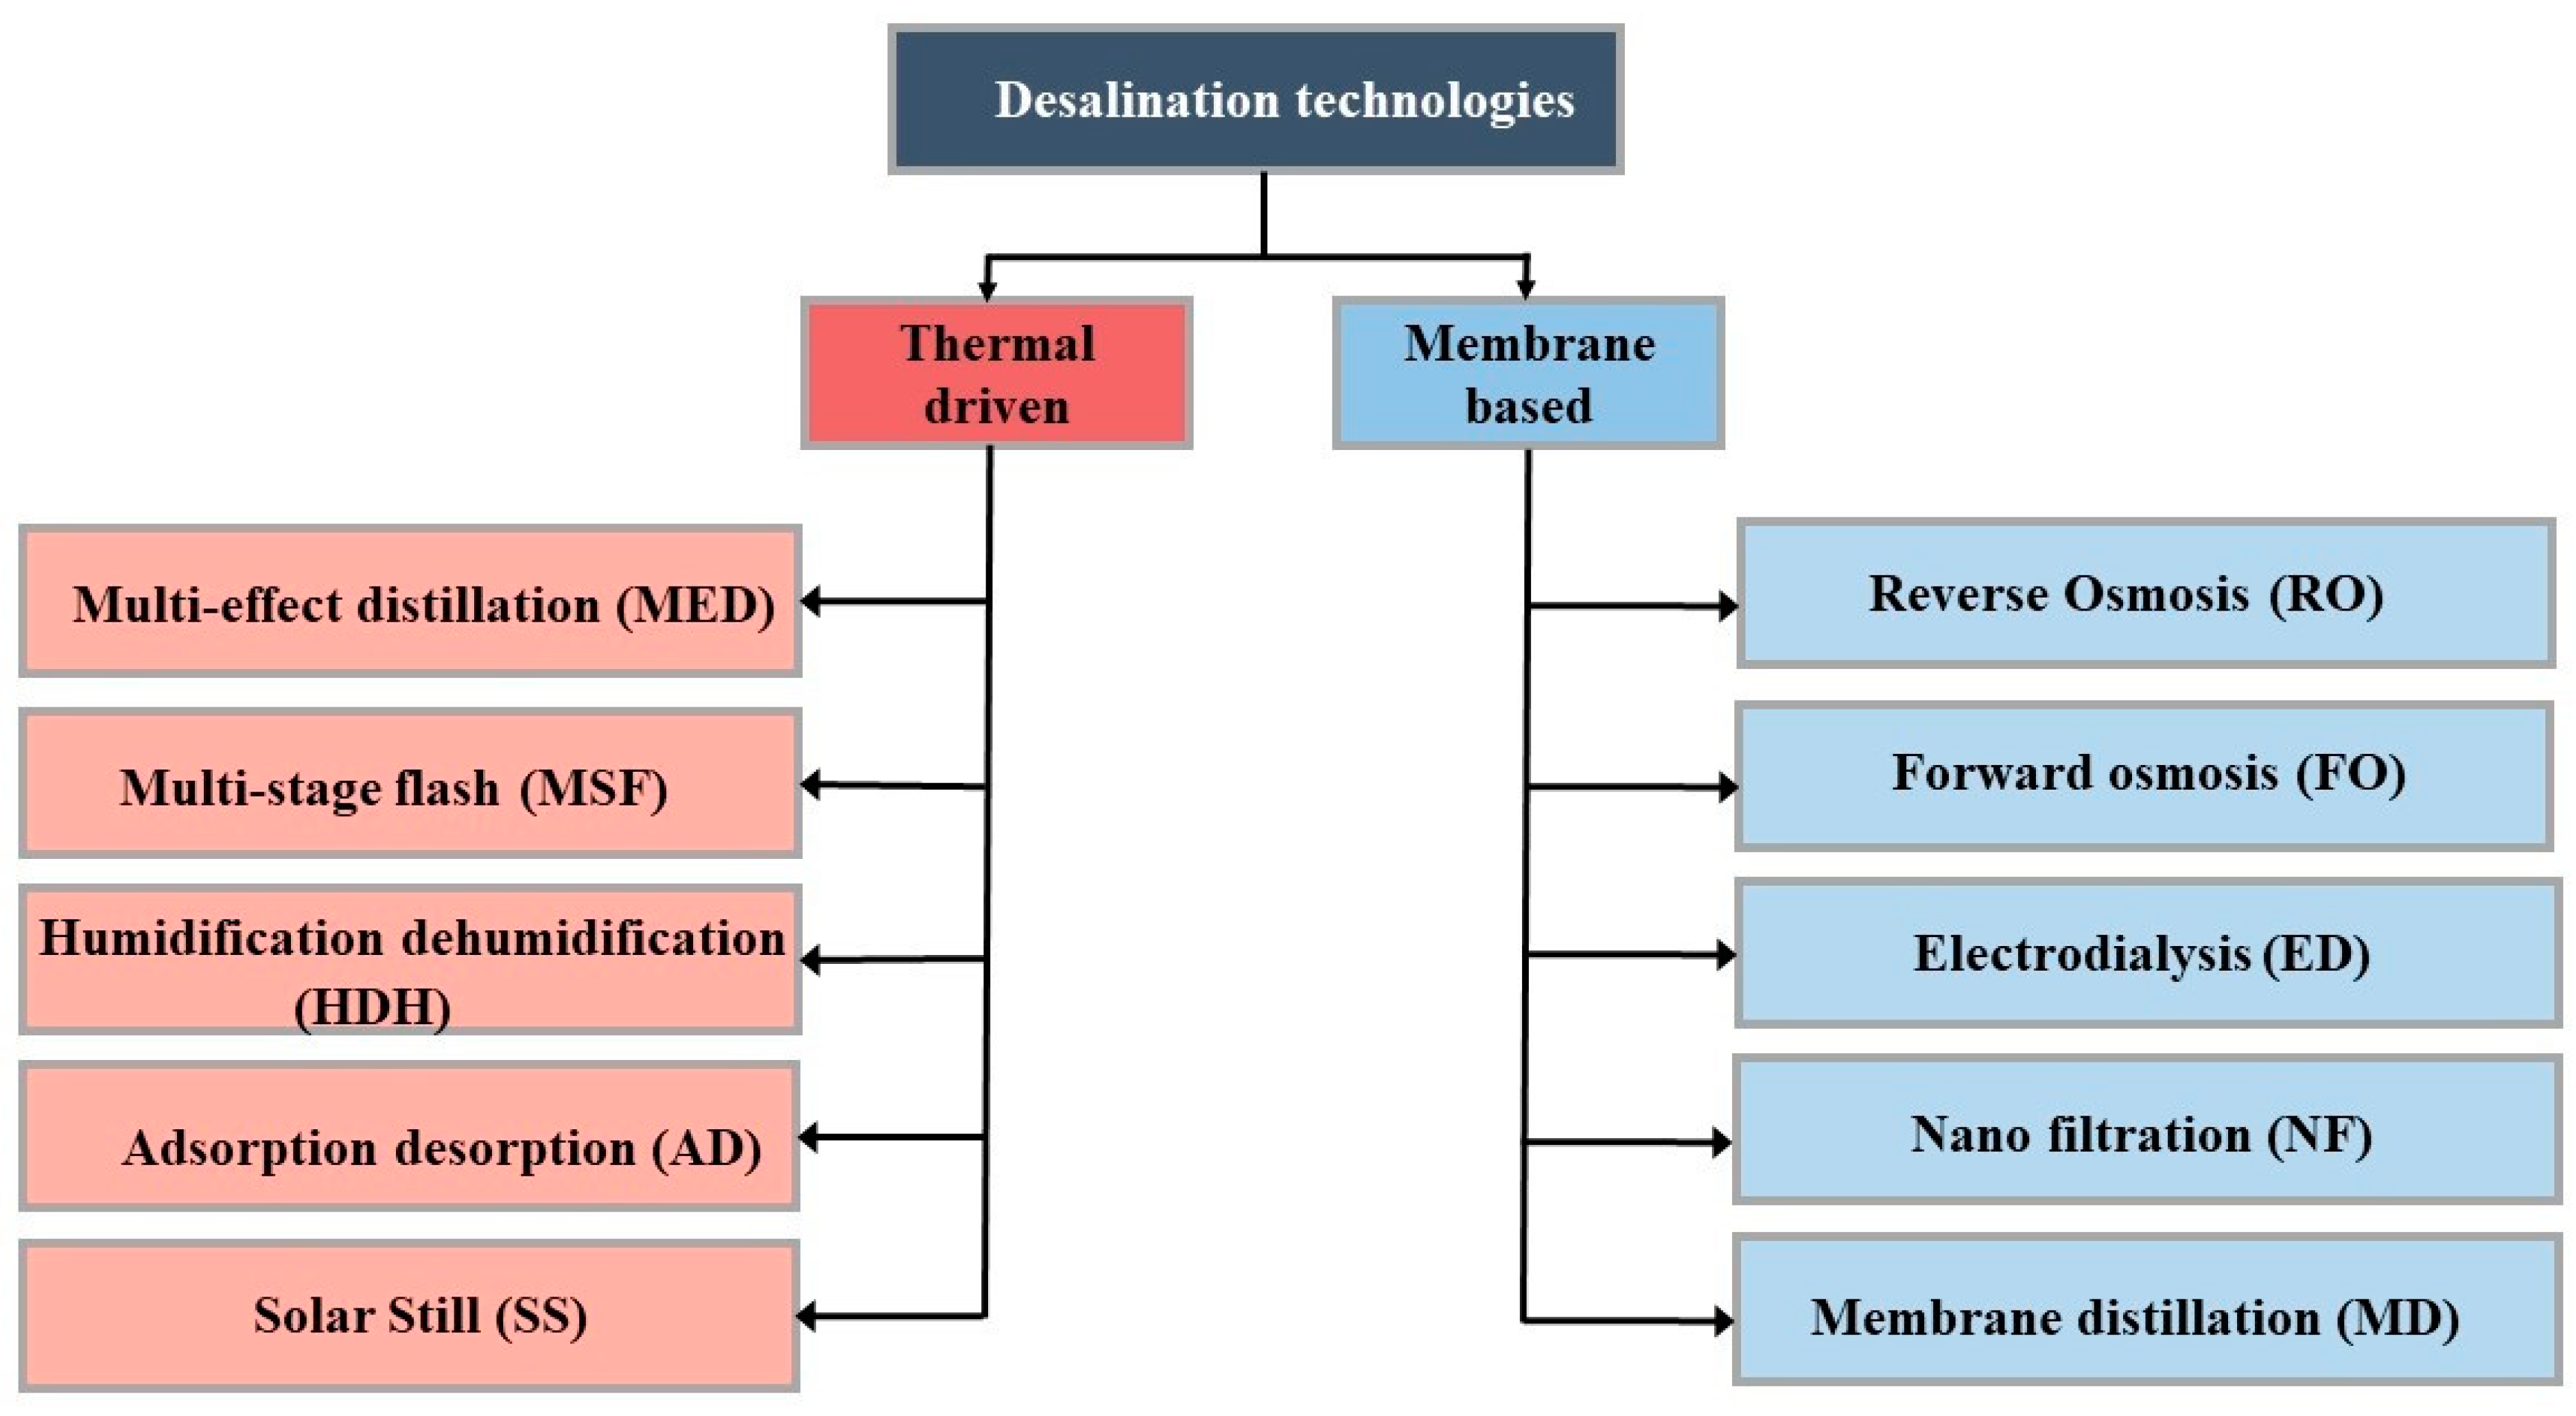
Figure 1. Categorization of desalination technology.
Sustainability 14 16616 g001
Figure 2. Configurations of MD.
Sustainability 14 16616 g002
Figure 3. Direct normal irradiance in Pakistan [18].
Sustainability 14 16616 g003
Figure 4. Direct normal irradiance in Karachi [19].
Sustainability 14 16616 g004
Figure 5. Average daily sunshine hours in Karachi.
Sustainability 14 16616 g005
Figure 6. Water stress countries by 2040 [21].
Sustainability 14 16616 g006
Figure 7. Solar-powered membrane distillation system.
Sustainability 14 16616 g007
Figure 8. Average temperature of seawater in Karachi.
Sustainability 14 16616 g008
Figure 9. A schematic of the DCMD system.
Sustainability 14 16616 g009
Figure 10. Flowchart of DCMD mathematical equations.
Sustainability 14 16616 g010
Figure 11. The hourly and monthly hot water temperature.
Sustainability 14 16616 g011
Figure 12. Heat map of hot water temperature delivered.
Sustainability 14 16616 g012
Figure 13. Monthly hot water temperature delivered.
Sustainability 14 16616 g013
Figure 14. Effects of hot water temperature on permeate flux as a function.
Sustainability 14 16616 g014
Figure 15. Effect of hot water temperature on EE and STEC.
Sustainability 14 16616 g015
Figure 16. Fresh water production.
Sustainability 14 16616 g016
Figure 17. LWC model breakdown.
Sustainability 14 16616 g017
Table 1. Summarized literature on DCMD systems.
AuthorsLocationSystemWater Production Cost
Pal and Manna (2010) [8]IndiaSolar-driven MD49.80 kg/m2/hN/A
Kim et al. (2013) [9]Jeddah, Saudi ArabiaSolar-assisted DCMD51.4 kg/m2/h
(31 m3/day)
N/A
Shim et al. (2015) [10]Suncheon, South KoreaSolar energy-assisted DCMD 40.9 L/m2/hN/A
Bouguecha et al. (2015) [11]Jeddah, Saudi ArabiaSolar-driven DCMD3.91–4.59 L/h per moduleN/A
Lee et al. (2017) [12]Busan, South KoreaSolar-powered MD N/A
Duong et al. (2017) [13]New South Wales, AustraliaSolar power-driven MD19.7 kg/m2 of solar thermal collectorN/A
Soomro and Kim (2018) [14]South KoreaSolar power tower plant
integrated with DCMD
40,759 L/dayUSD 0.392/m3
Soomro and Kim (2018) [15]Abu
Dhabi, United Arab Emirates.
Parabolic trough plant integrated with DCMD14.33 m3/dayUSD 0.64/m3
Soomro and Kim (2018) [16]South KoreaLinear Fresnel reflector plant integrated with DCMD31,844.6 L/dayUSD 0.425/m3
Soomro et al. (2020) [17]South KoreaConcentrated solar power plants integrated38.9 m3/day0.314 m3
Table 2. Calculations of LWC.
ItemUnit CostQuantityEstimated Cost
Capital Cost (CC)
Direct capital cost (DCC)
Membrane cost36 USD/m2 [29]0.56 m220.16 USD
MD equipment cost [29] 61.09 USD
Total cost of MD Module 81.25 USD
Solar collector cost120 USD/m248.1 m25772 USD
Heat storage tank1200 USD/m35 m36000 USD
SWHS installation cost 3500 USD
Total DCC 15,434.5 USD
Indirect capital cost (ICC) [30] 1543.4 USD
CC = DCC + ICC 16,977.95 USD
ACfixed = a × CC 1362.355 USD
Annual operating and maintenance cost (ACO&M)
Annual maintenance cost (ACMT) [29] 272.47 USD
Membrane replacement cost (ACMR) [29] 16.25 USD
Annual labor cost (AClabor)0.05 USD/m3 [30] 3.56 USD
Annual brine disposal cost (ACBD)0.0015 USD/m3 [31] 0.10 USD
Annual electric cost (ACelectricity)0.06 kWh/m3 [28] 0.427 USD
ACO&M 292.82 USD
ACtotal = ACfixed + ACO&M 1655.17 USD
LWC 23.21 USD/m3
Publisher’s Note: MDPI stays neutral with regard to jurisdictional claims in published maps and institutional affiliations.