
Carbon Footprint of Single-Use Plastic Items and Their Substitution

 ,
,  and
and
Abstract
1. Introduction
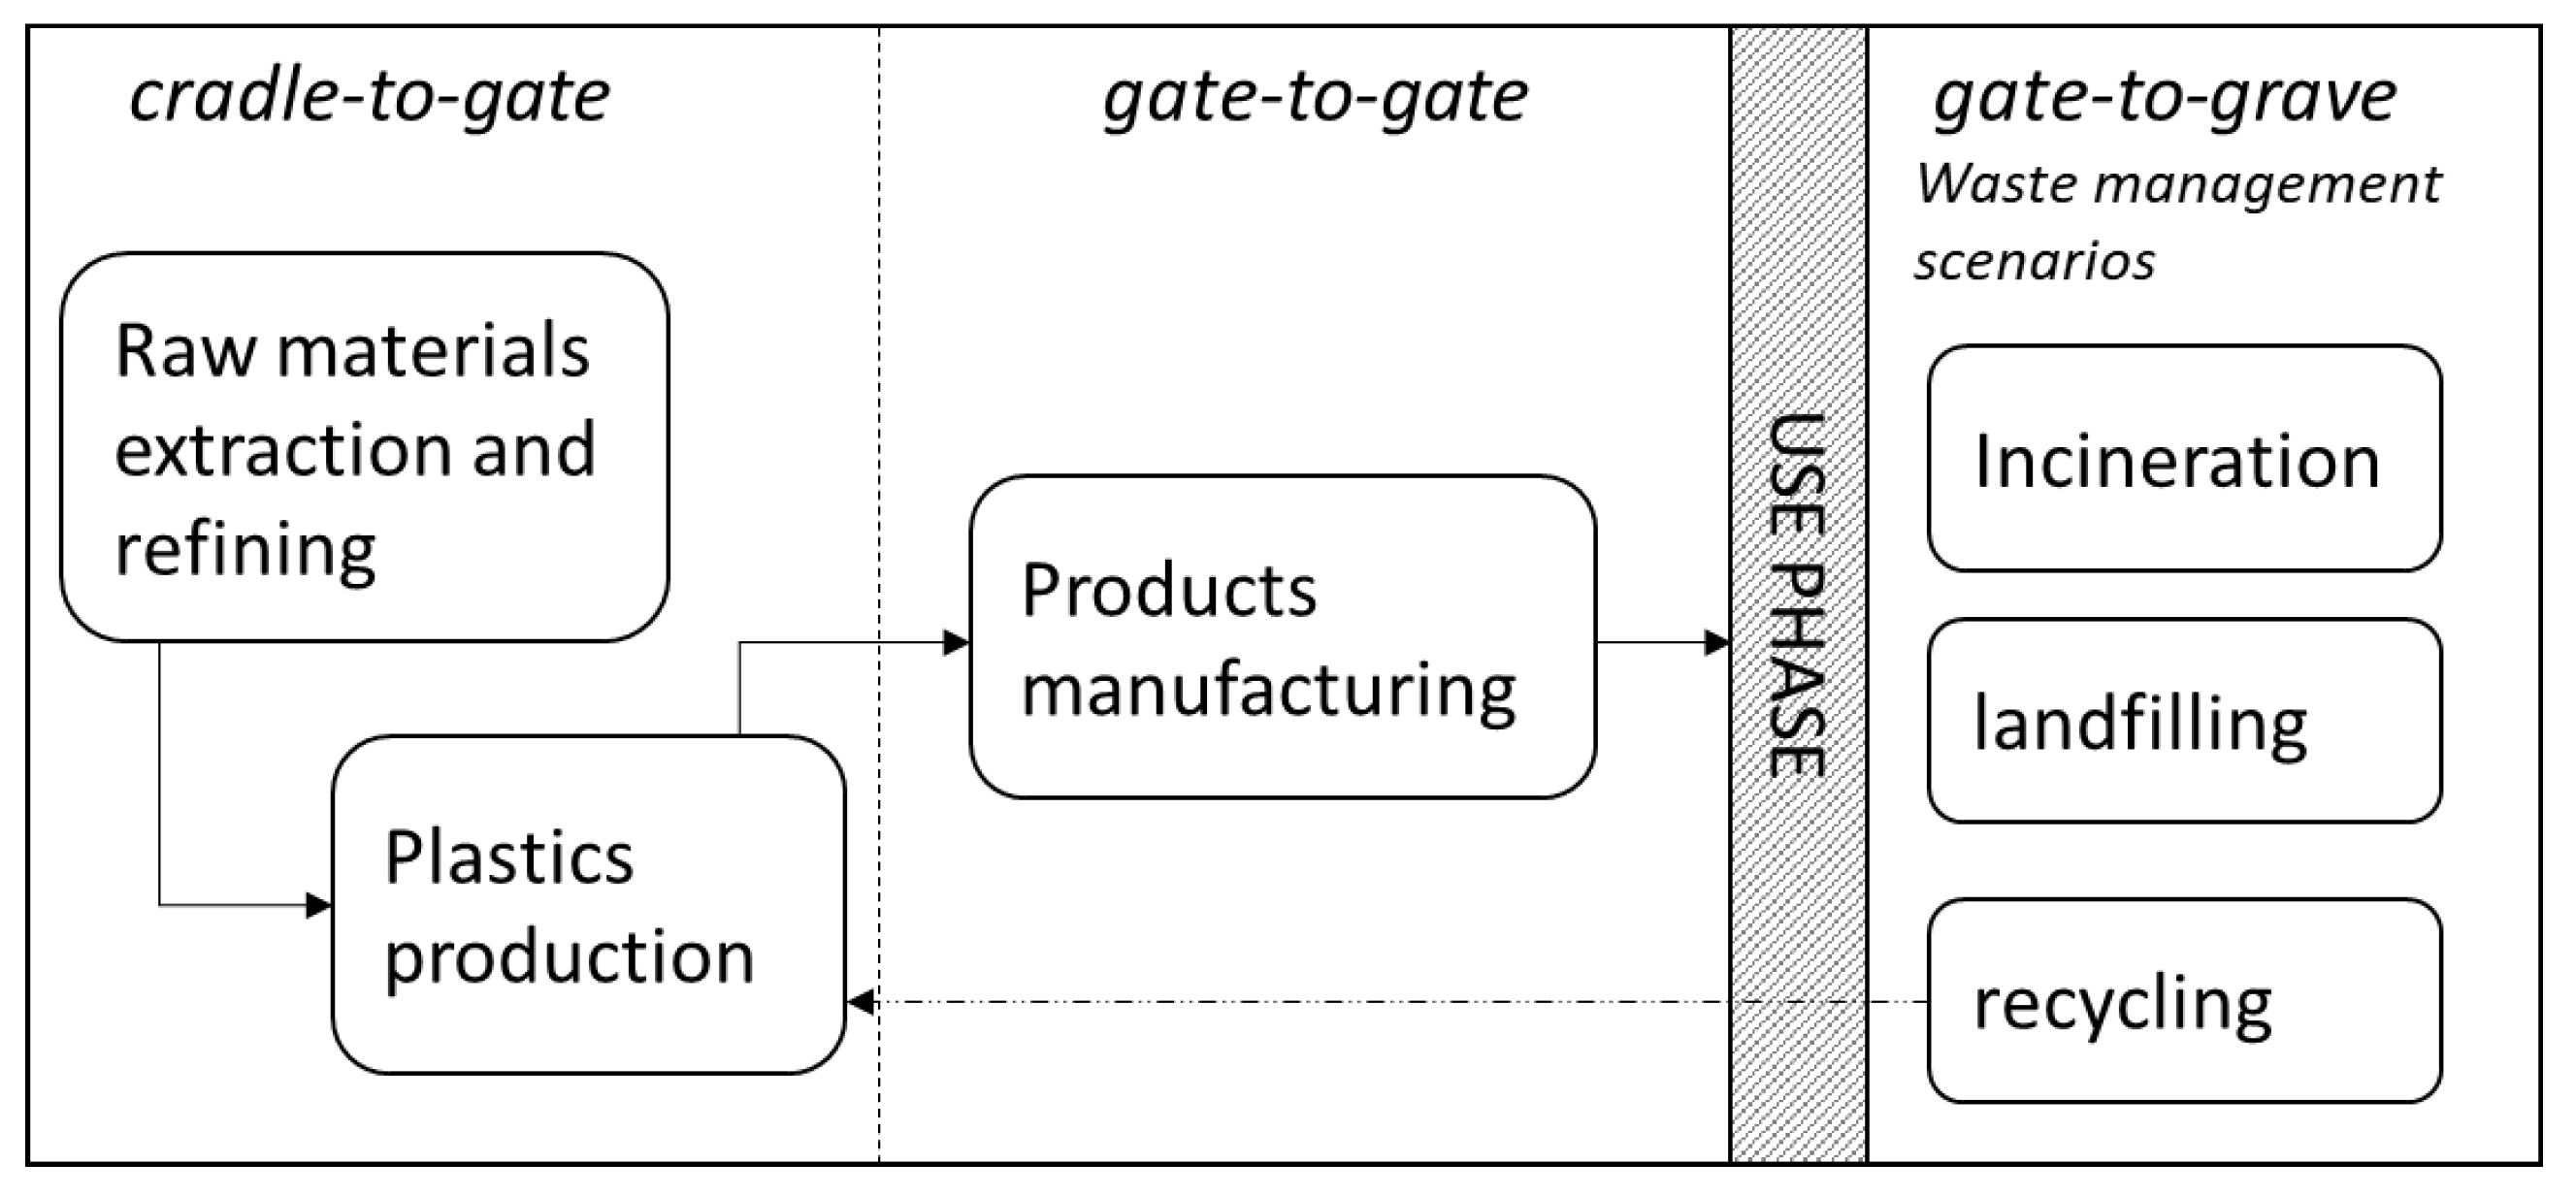
2. Materials and Methods
2.1. Plastic Films
2.2. Garbage Bags
2.3. Bottles
2.4. Packaging
2.5. Detergent Bottles
2.6. Cutlery
2.7. Generic Plastic
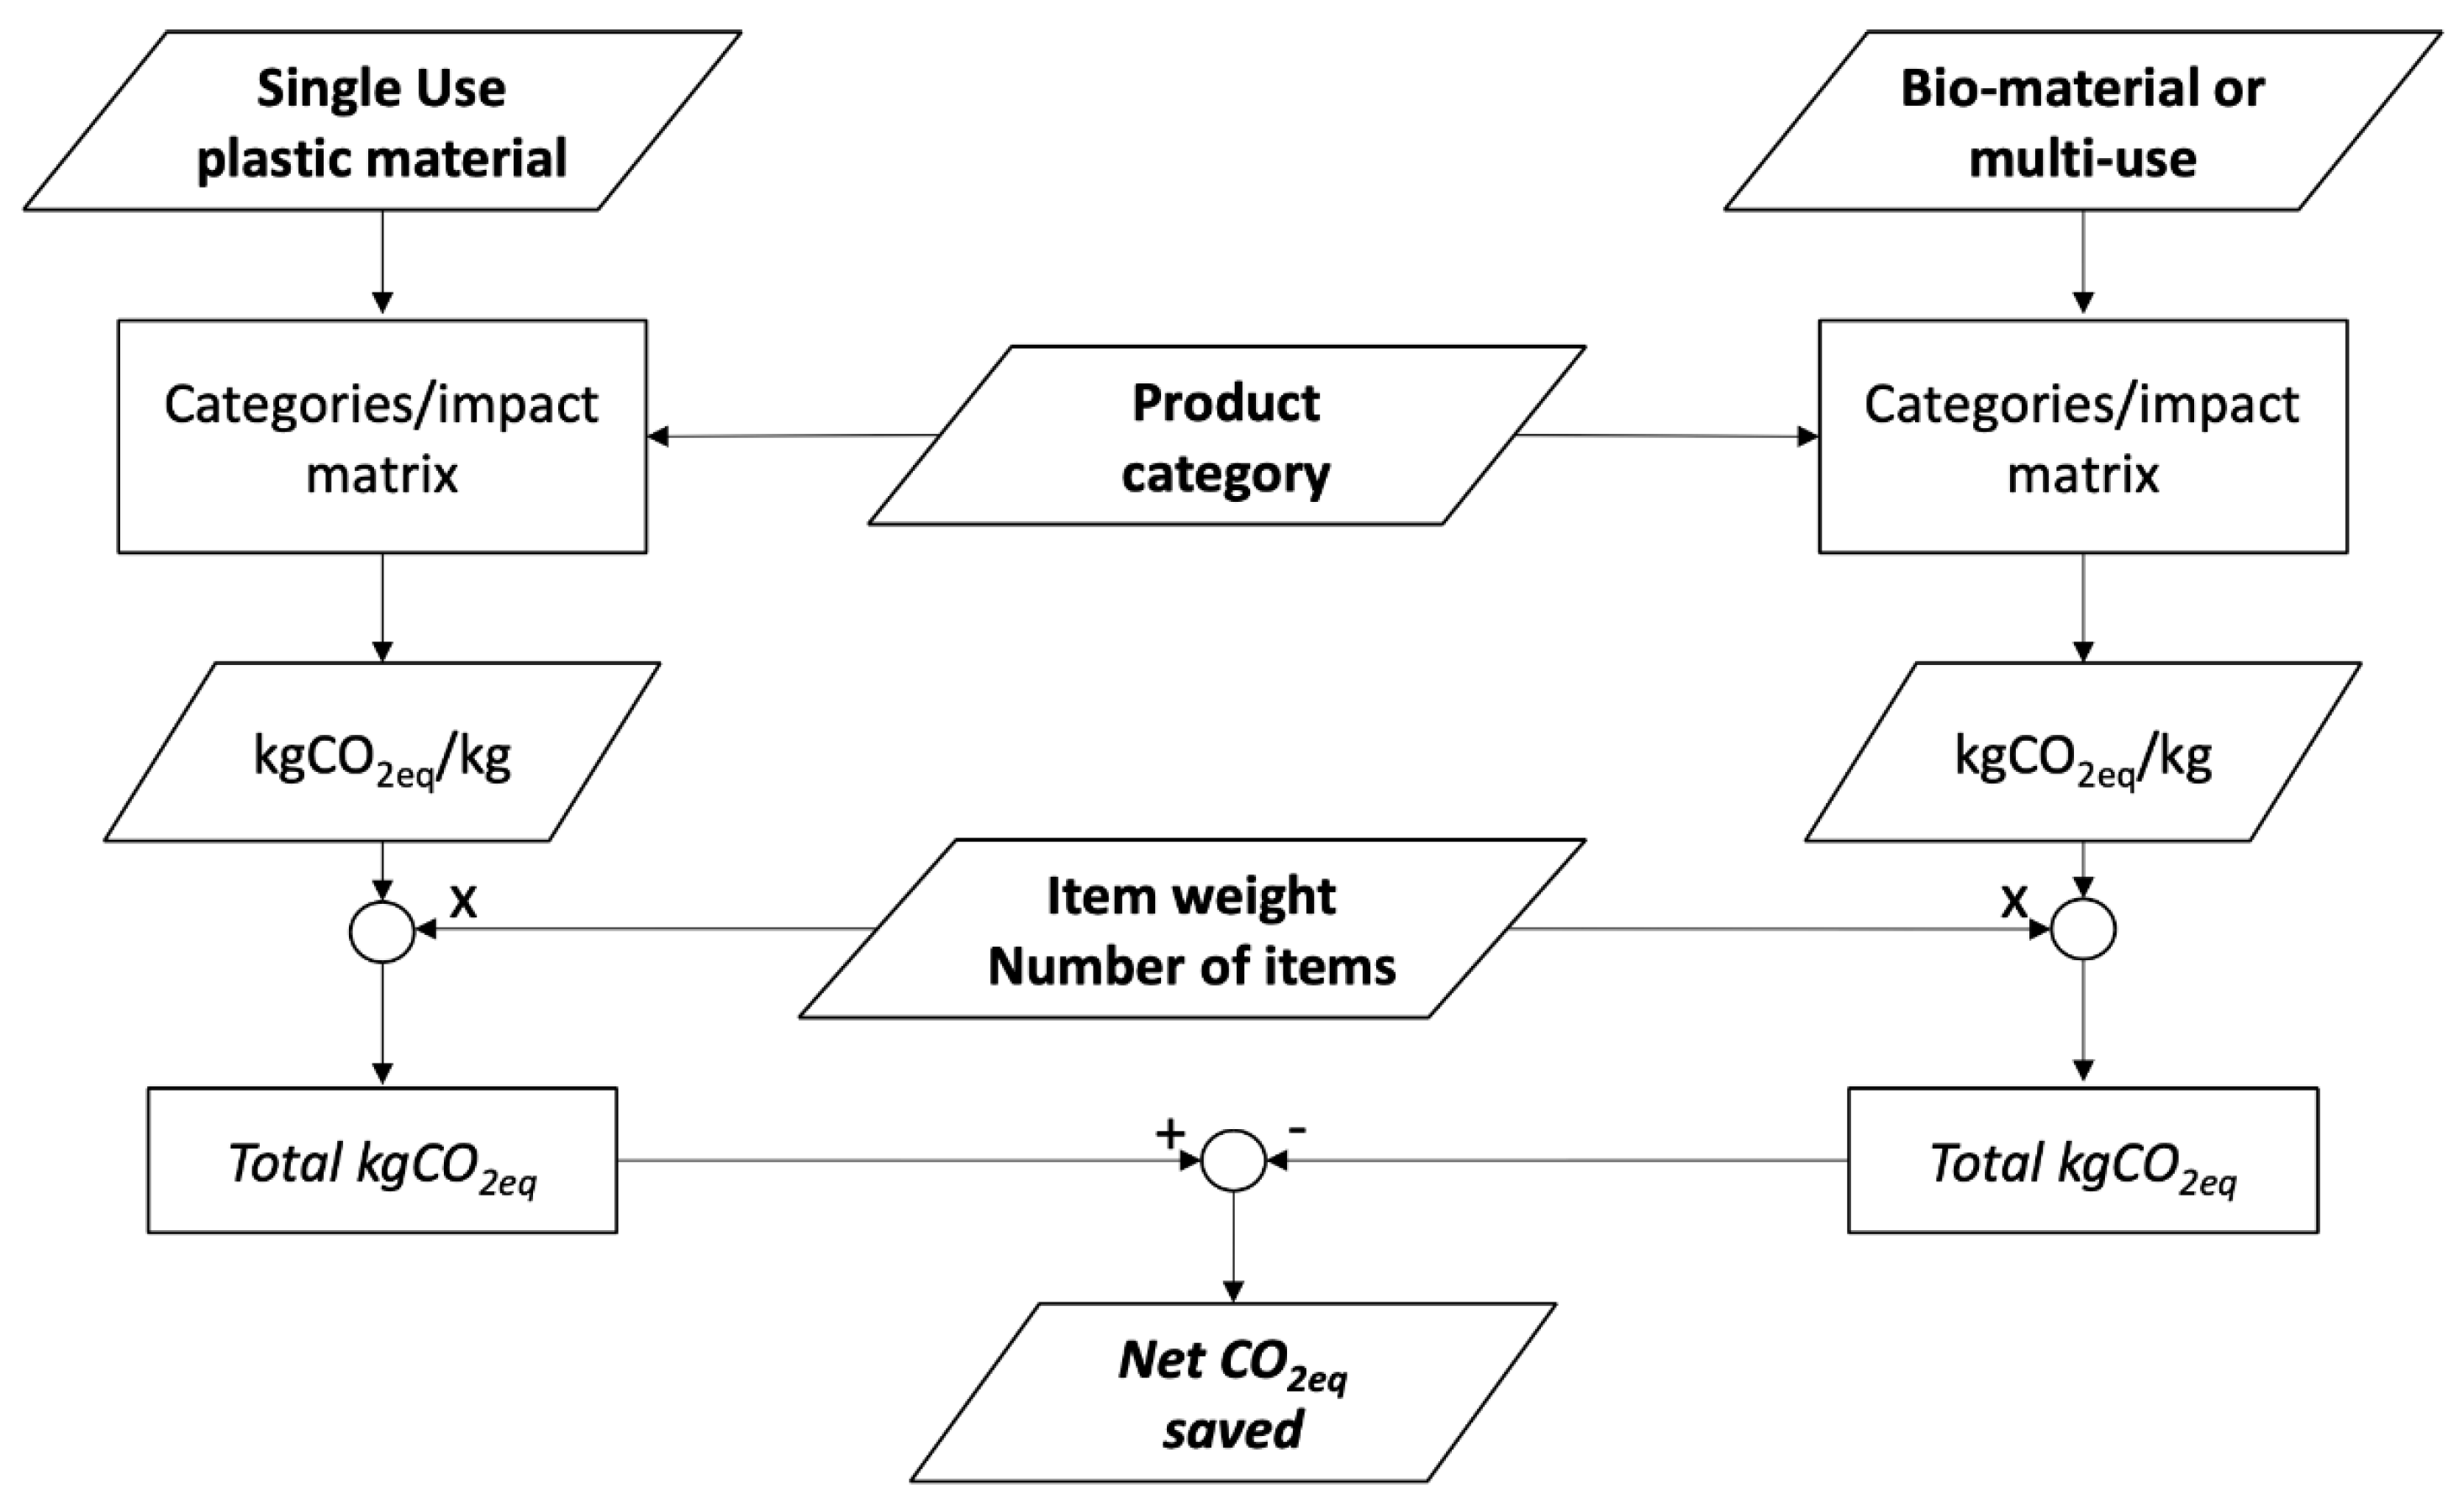
2.8. Single-Use Plastic Substitution
- (a)
- A specific literature review was performed in order to merge the carbon footprint values (kgCO2eq) of several studies of single-use plastic items and their substitution (Section 2.1, Section 2.2, Section 2.3, Section 2.4, Section 2.5, Section 2.6 and Section 2.7);
- (b)
- The items individuated were categorized (Table 1);
- (c)
- For each category, an average value of specific carbon footprint (kgCO2eq/kg item) was calculated depending on the material used (conventional fossil-based plastic or sustainable alternatives—bio-based material or multi-use item);
- (d)
- Specific two-dimensional matrixes were constructed using the carbon footprint values calculated, where product categories and material are the input elements;
- (e)
- Collecting simple primary data (i.e., product to be substituted, weights, number of items and materials), it is possible to use the matrixes to directly evaluate the carbon footprint of the initial items and their sustainable substitution, comparing each to assess the possible benefits in terms of CO2eq saved.
2.9. Main Influence Parameters
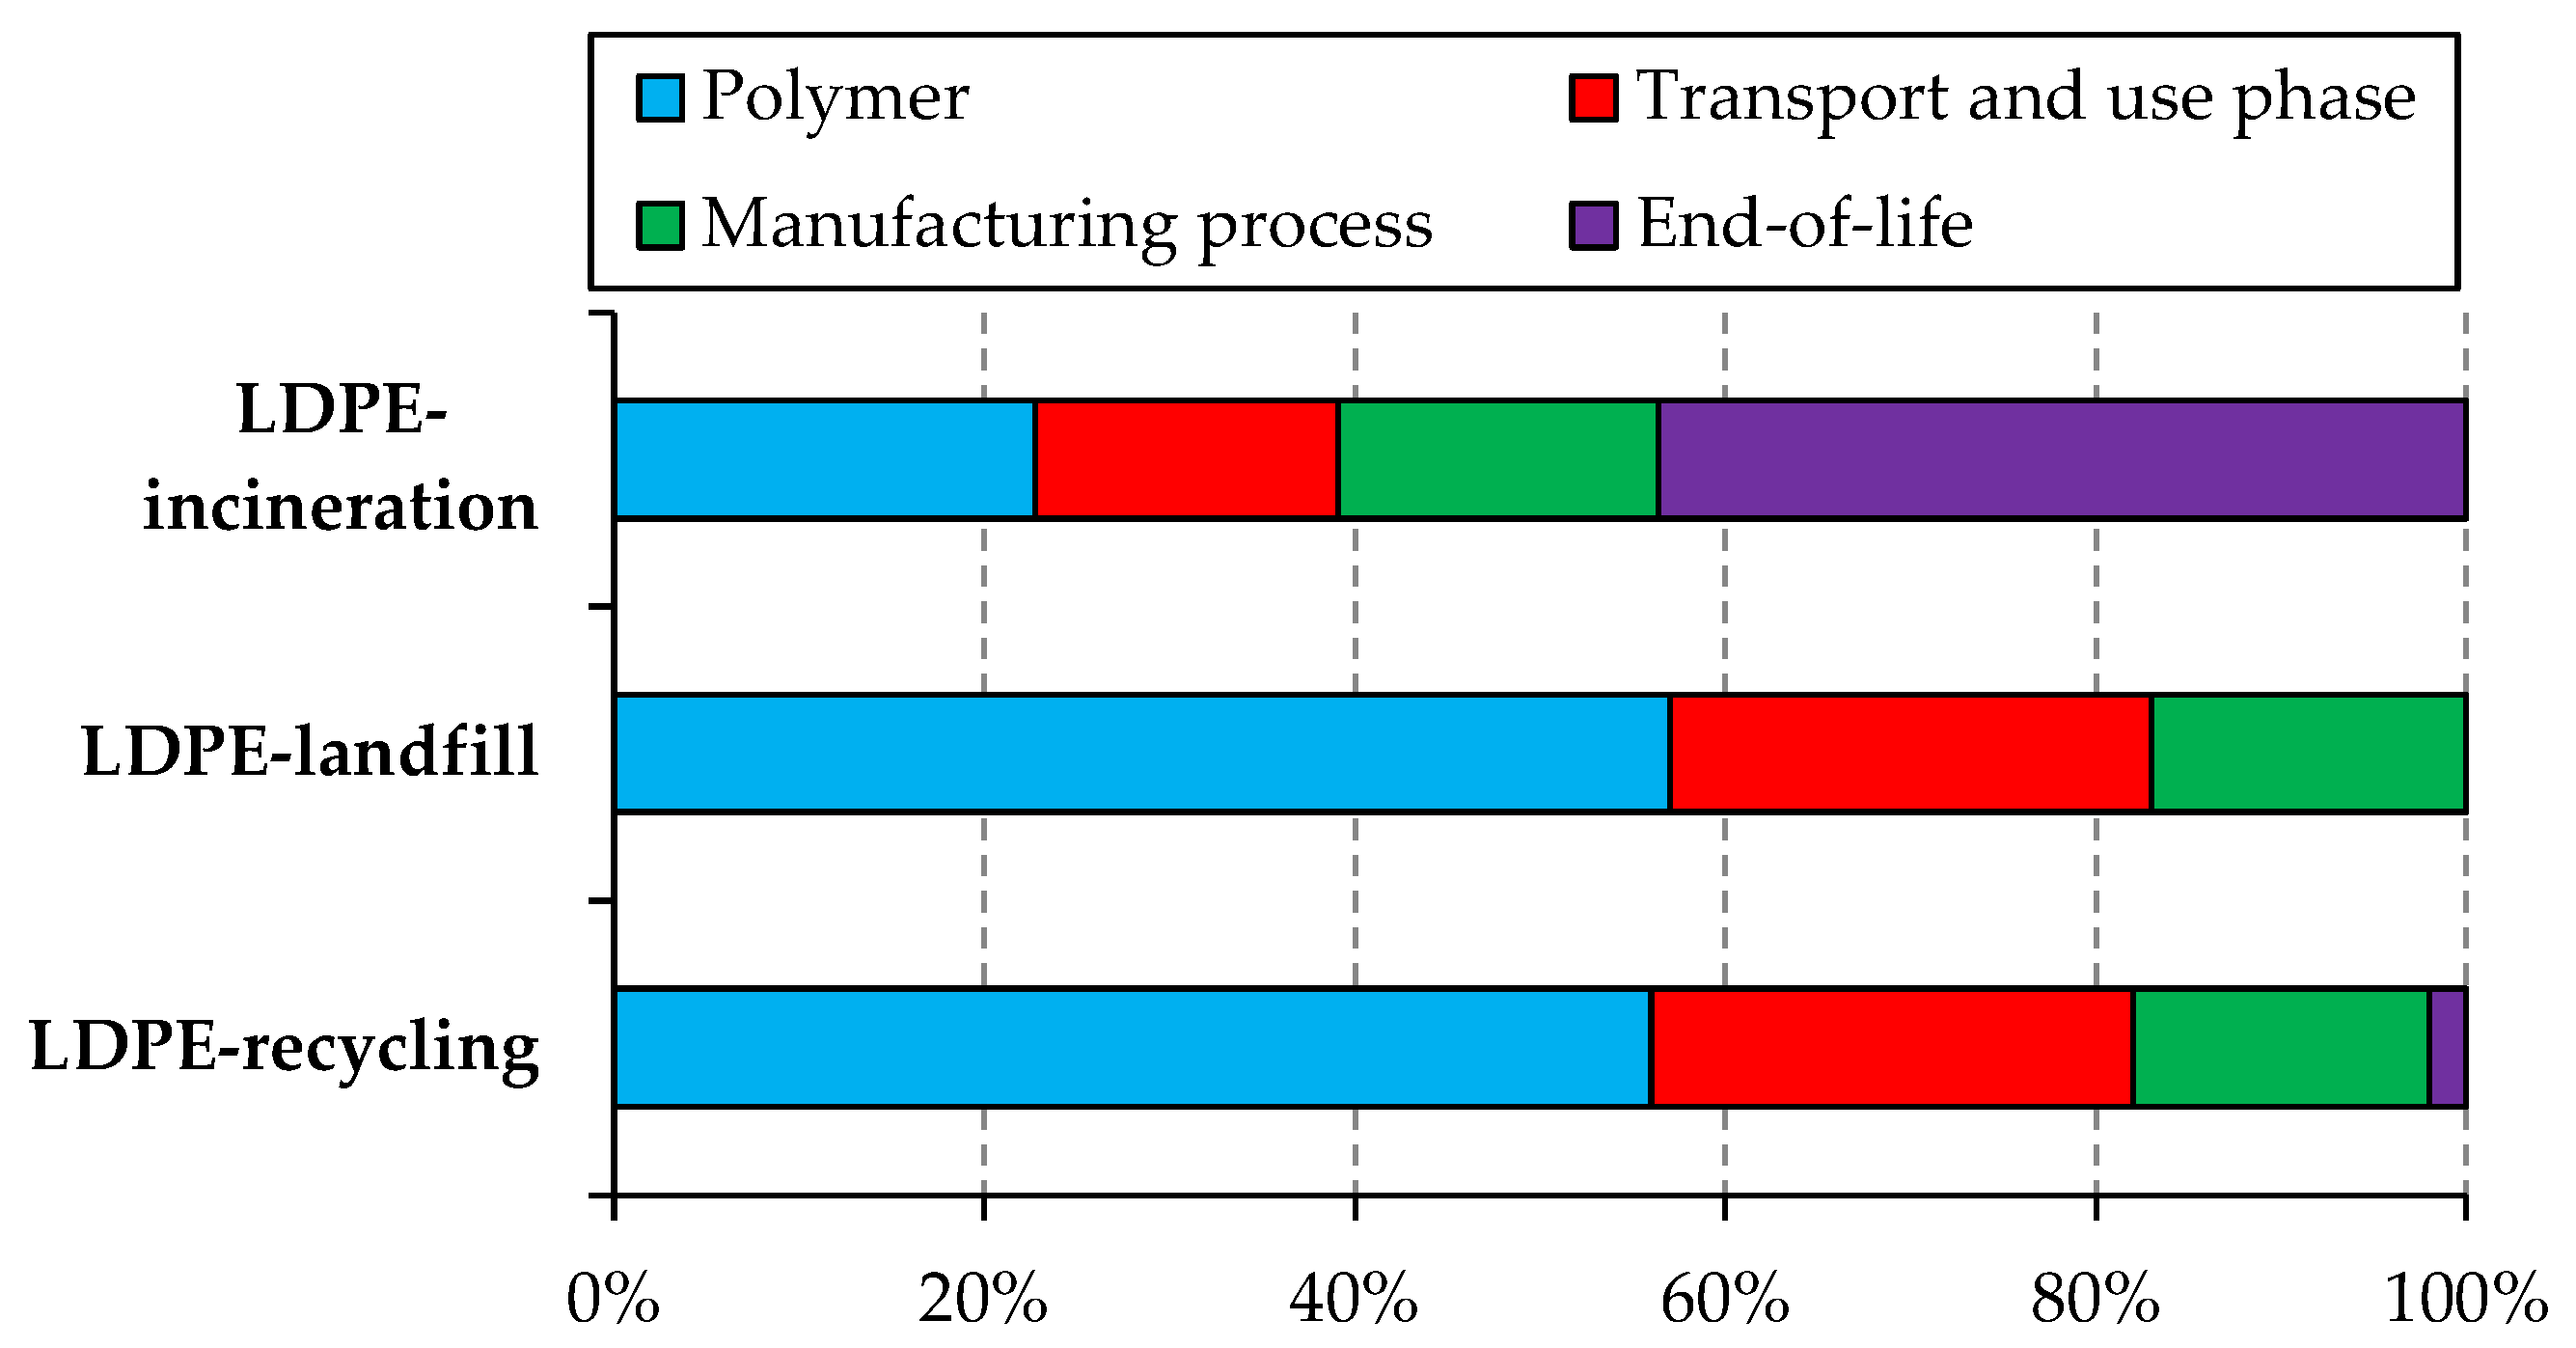
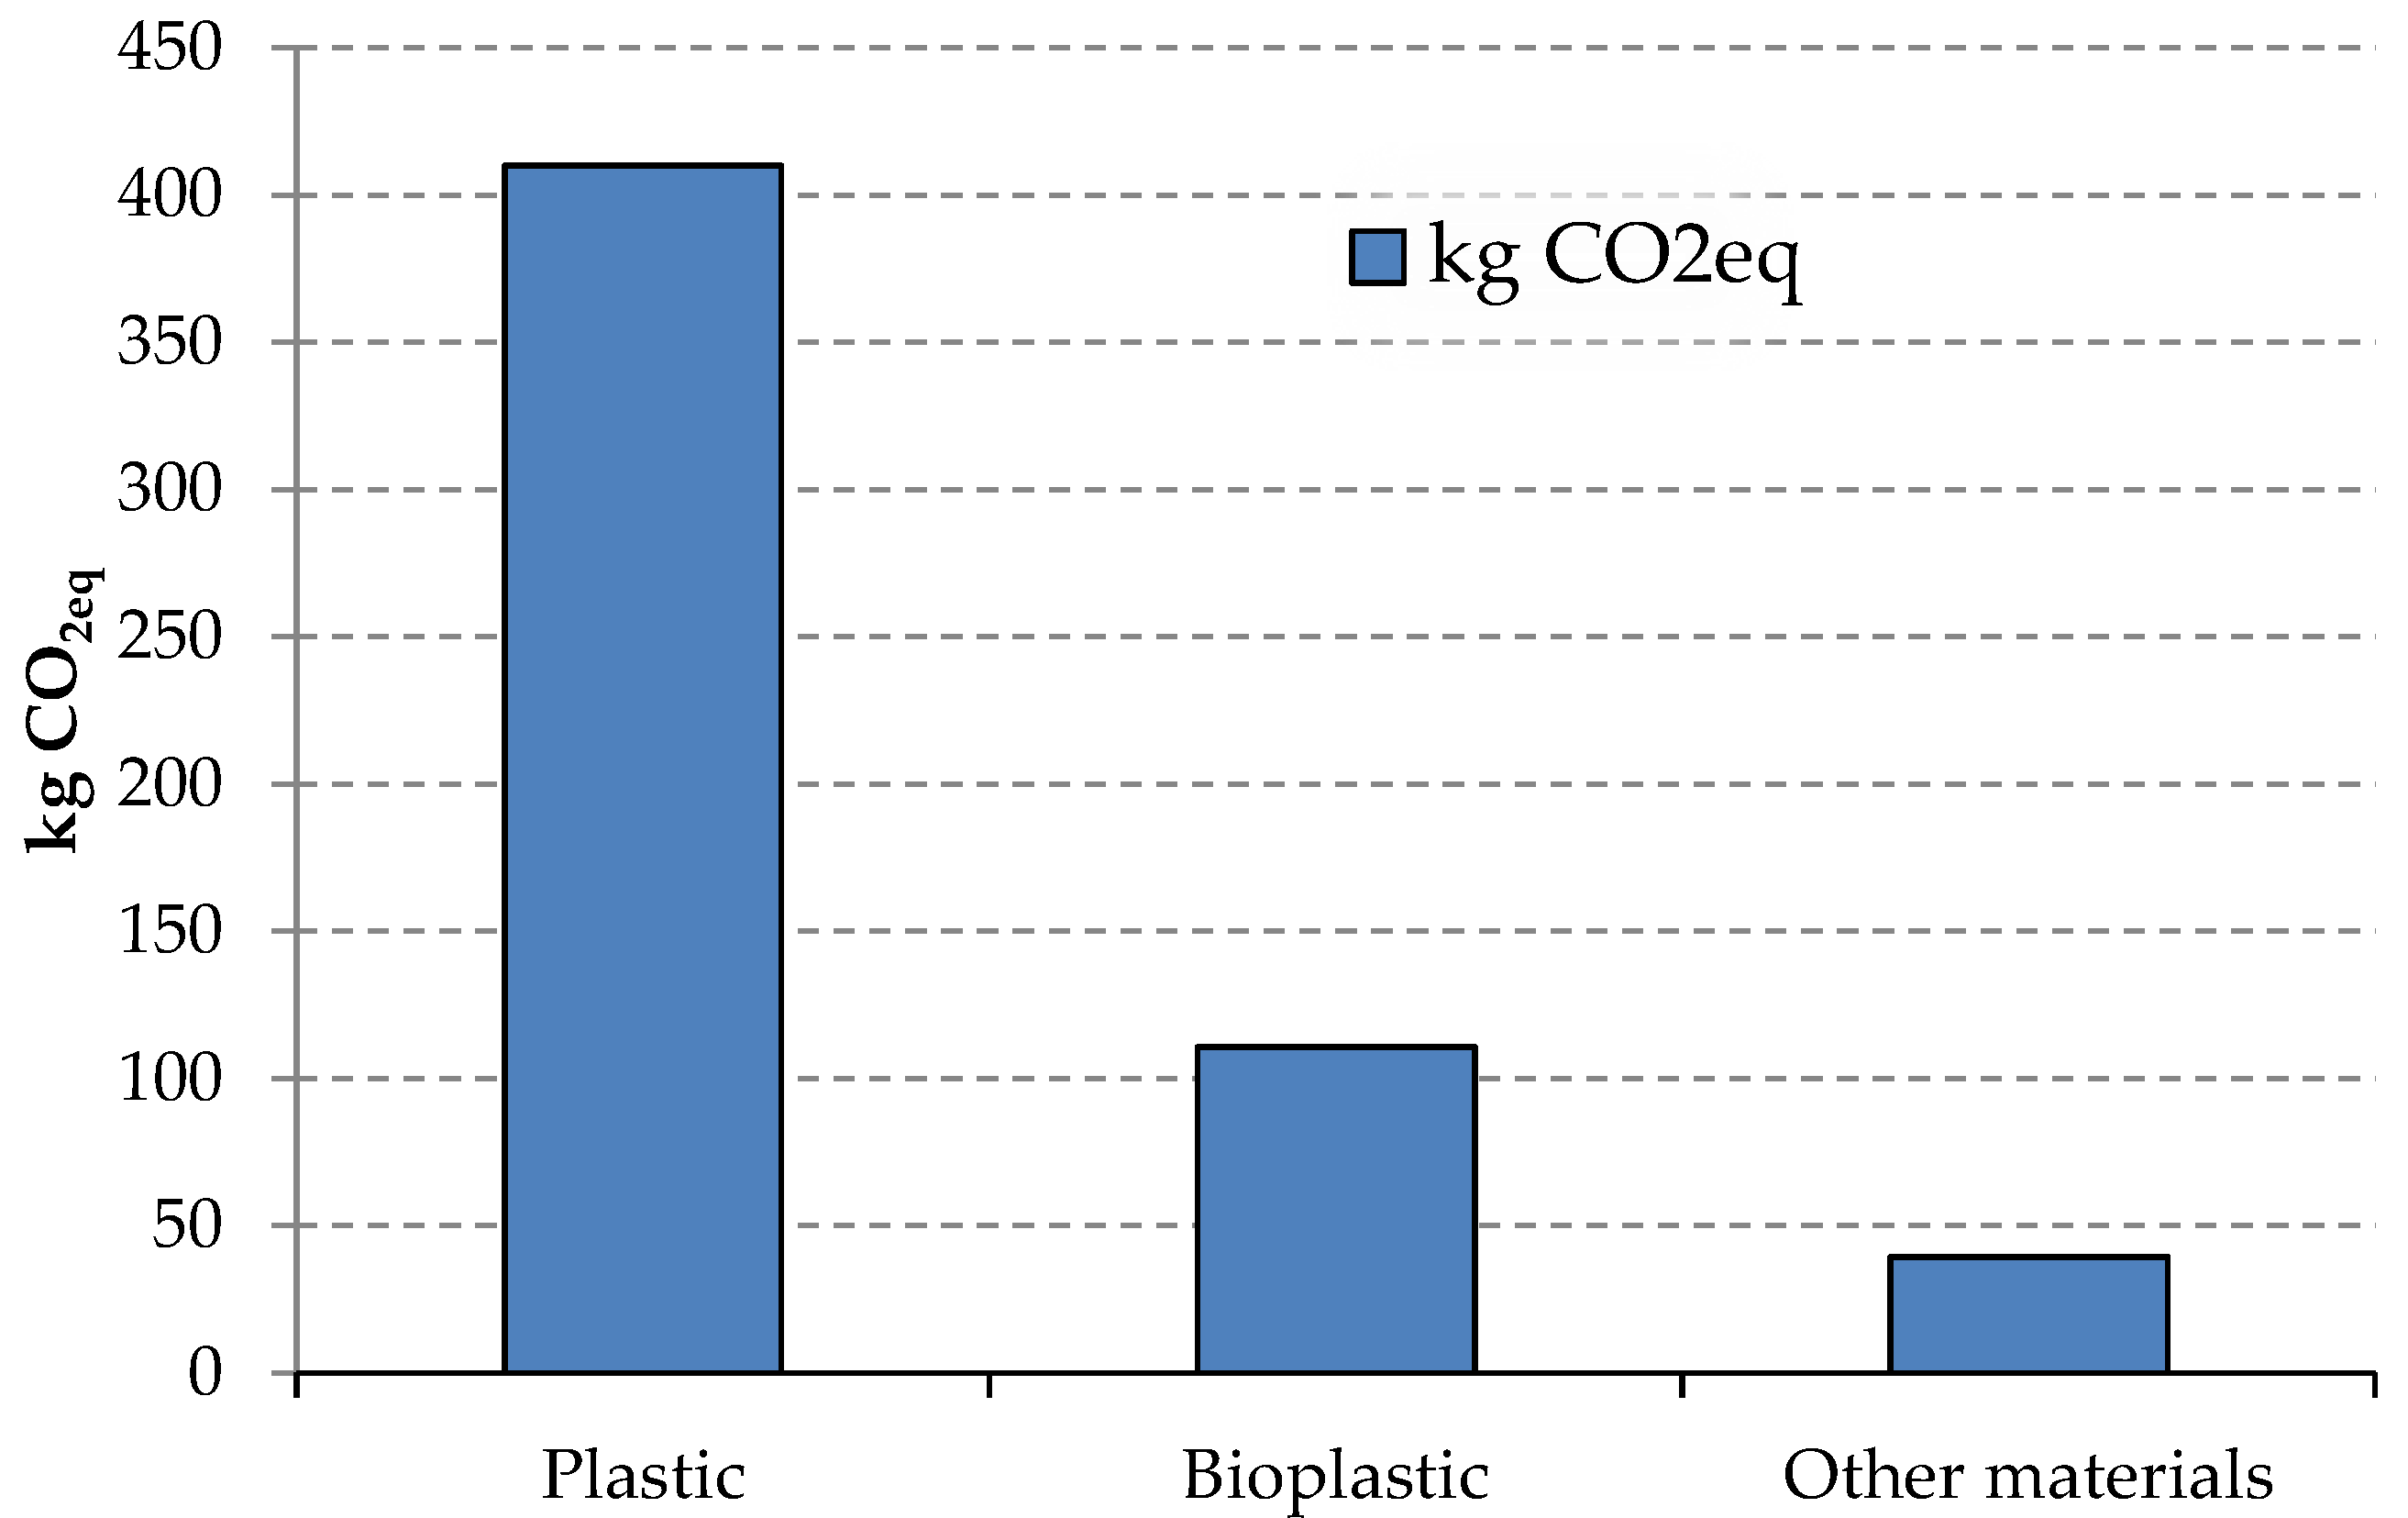
3. Results and Discussion
Application to a Case Study
- Primary data collection referring to single-use plastic items to be replaced: product, material, weight, annual consumption;
- Identification of alternative items: materials and weight;
- Calculation of carbon footprint using the substitution matrix, both for plastic items and their alternatives.
4. Conclusions
Author Contributions
Funding
Institutional Review Board Statement
Informed Consent Statement
Data Availability Statement
Acknowledgments
Conflicts of Interest
Nomenclature
| APET | Amorphous-PET |
| EVOH | Ethylene vinyl alcohol |
| LDPE | Low-density polyethylene |
| HDPE | High-density polyethylene |
| PA | Polyamide |
| PBS | Polybutylene succinate |
| PE | Polyethylene |
| PEF | Polyethylene Furanoate |
| PET | Polyethylene terephthalate |
| PHA | Polyhydroxyalkanoates |
| PHB | Polyhydroxybutyrate |
| PLA | Polylactic acid |
| PP | Polypropylene |
| PS | Polystyrene |
| PUR | Polyurethane |
| PVC | Polyvinyl chloride |
| TPS | Thermoplastic Starch |
References
- Gross, M. Our planet wrapped in plastic. Curr. Biol. 2017, 27, R785–R788. [Google Scholar] [CrossRef]
- Urbanek, A.K.; Rymowicz, W.; Mirończuk, A.M. Degradation of plastics and plastic-degrading bacteria in cold marine habitats. Appl. Microbiol. Biotechnol. 2018, 102, 7669–7678. [Google Scholar] [CrossRef] [PubMed]
- Geyer, R.; Jambeck, J.R.; Law, K.L. Production, use, and fate of all plastics ever made. Sci. Adv. 2017, 3, 3–8. [Google Scholar] [CrossRef] [PubMed]
- Raynaud, J. Valuing Plastics: The Business Case for Measuring, Managing and Disclosing Plastic Use in the Consumer Goods Industry, 2014. Available online: https://wedocs.unep.org/bitstream/handle/20.500.11822/25302/Valuing_Plastic_ES.pdf?sequence=1&isAllowed=y%0Awww.gpa.unep.org%0Awww.unep.org/pdf/ValuingPlastic/ (accessed on 11 September 2022).
- Eriksen, M.; Lebreton, L.C.M.; Carson, H.S.; Thiel, M.; Moore, C.J.; Borerro, J.C.; Galgani, F.; Ryan, P.G.; Reisser, J. Plastic Pollution in the World’s Oceans: More than 5 Trillion Plastic Pieces Weighing over 250,000 Tons Afloat at Sea. PLoS ONE 2014, 9, 1–15. [Google Scholar] [CrossRef] [PubMed]
- Cesarini, G.; Secco, S.; Battisti, C.; Questino, B.; Marcello, L.; Scalici, M. Temporal changes of plastic litter and associated encrusting biota: Evidence from Central Italy (Mediterranean Sea). Mar. Pollut. Bull. 2022, 181, 113890. [Google Scholar] [CrossRef]
- Lebreton, L.; Slat, B.; Ferrari, F.; Sainte-Rose, B.; Aitken, J.; Marthouse, R.; Hajbane, S.; Cunsolo, S.; Schwarz, A.; Levivier, A.; et al. Evidence that the Great Pacific Garbage Patch is rapidly accumulating plastic. Sci. Rep. 2018, 8, 1–15. [Google Scholar] [CrossRef]
- Cooper, D.A.; Corcoran, P.L. Effects of mechanical and chemical processes on the degradation of plastic beach debris on the island of Kauai, Hawaii. Mar. Pollut. Bull. 2010, 60, 650–654. [Google Scholar] [CrossRef]
- Turner, A.; Holmes, L. Occurrence, distribution and characteristics of beached plastic production pellets on the island of Malta (central Mediterranean). Mar. Pollut. Bull. 2011, 62, 377–381. [Google Scholar] [CrossRef]
- Eriksson, C.; Burton, H. Origins and Biological Accumulation of Small Plastic Particles in Fur Seals from Macquarie Island. AMBIO J. Hum. Environ. 2003, 32, 380–384. [Google Scholar] [CrossRef]
- Barnes, D.K.A.; Galgani, F.; Thompson, R.C.; Barlaz, M. Accumulation and fragmentation of plastic debris in global environments. Philos. Trans. R. Soc. B Biol. Sci. 2009, 364, 1985–1998. [Google Scholar] [CrossRef]
- Rakib, M.R.J.; Hossain, M.B.; Kumar, R.; Ullah, M.A.; al Nahian, S.; Rima, N.N.; Choudhury, T.R.; Liba, S.I.; Yu, J.; Khandaker, M.U.; et al. Spatial distribution and risk assessments due to the microplastics pollution in sediments of Karnaphuli River Estuary, Bangladesh. Sci. Rep. 2022, 12, 1–15. [Google Scholar] [CrossRef]
- Gregory, M.R. Environmental implications of plastic debris in marine settings-entanglement, ingestion, smothering, hangers-on, hitch-hiking and alien invasions. Philos. Trans. R. Soc. B Biol. Sci. 2009, 364, 2013–2025. [Google Scholar] [CrossRef] [PubMed]
- Winton, D.; Marazzi, L.; Loiselle, S. Drivers of public plastic (mis)use—New insights from changes in single-use plastic usage during the COVID-19 pandemic. Sci. Total Environ. 2022, 849, 157672. [Google Scholar] [CrossRef] [PubMed]
- Rivas, M.L.; Albion, I.; Bernal, B.; Handcock, R.N.; Heatwole, S.J.; Parrott, M.L.; Piazza, K.A.; Deschaseaux, E. The plastic pandemic: COVID-19 has accelerated plastic pollution, but there is a cure. Sci. Total Environ. 2022, 847, 157555. [Google Scholar] [CrossRef] [PubMed]
- EU Commission. Single-Use Plastics: New EU Rules to Reduce Marine Litter; Ip/18/3927; European Commission: Brussels, Belgium, 2018; pp. 1–3. Available online: http://europa.eu/rapid/press-release_IP-18-3927_en.htm (accessed on 15 September 2022).
- D’Ambrosio, C. Microplastiche e Nanoparticelle Nel Corpo Umano: Tutto Quello che c’è da Saper e. 2022. Available online: https://economiacircolare.com/microplastiche-nel-corpo-umano/?fbclid=IwAR1d1OH3P5OId29JqMvX4x-5rTKm_Gp6LGyFPOpPU_2QNP8OrSWSeDUZMF8 (accessed on 14 September 2022).
- Leslie, H.A.; van Velzen, M.J.M.; Brandsma, S.H.; Vethaak, A.D.; Garcia-Vallejo, J.J.; Lamoree, M.H. Discovery and quantification of plastic particle pollution in human blood. Environ. Int. 2022, 163, 107199. [Google Scholar] [CrossRef] [PubMed]
- Arbinolo, R.; EU Agrees Unprecedented Cuts to Single-Use Plastics. Rethinkplasticalliance.Eu. 2018. Available online: https://www.breakfreefromplastic.org/2018/12/19/eu-agrees-unprecedented-cuts-to-single-use-plastics/ (accessed on 15 September 2022).
- Siracusa, V.; Rosa, M.D.; Romani, S.; Rocculi, P.; Tylewicz, U. Life Cycle Assessment of multilayer polymer film used on food packaging field. Procedia Food Sci. 2011, 1, 235–239. [Google Scholar] [CrossRef]
- L’Assemblée Nationale et le Sénat Ont Adopté, LOI no 2020-105 du 10 Février 2020 Relative à la Lutte Contre le Gaspillage et à L’économie Circulaire. 2020. Available online: https://www.legifrance.gouv.fr/jorf/id/JORFTEXT000041553759/ (accessed on 14 September 2022).
- Lima, L.R.; Gutierrez, R.F.; Cruz, S.A. Challenges in the context of single-use plastics and bioplastics in Brazil: A legislative review. Waste Manag. Res. J. A Sustain. Circ. Econ. 2022, 40, 5548. [Google Scholar] [CrossRef]
- Springle, N.; Li, B.; Soma, T.; Shulman, T. The complex role of single-use compostable bioplastic food packaging and foodservice ware in a circular economy: Findings from a social innovation lab. Sustain. Prod. Consum. 2022, 33, 664–673. [Google Scholar] [CrossRef]
- Symbola. Certificare per Competere. Dalle Certificazioni Ambientali Nuova Forza al Made in Italy. 2016. Available online: https://www.symbola.net/approfondimento/certificare-per-competere/ (accessed on 15 September 2022).
- Santucci, S. Analisi LCA: Cosa è, a Cosa Serve e Come Combatte il Greenwashing. Economia Circolare. Available online: https://economiacircolare.com/analisi-lca-life-cycle-assessment/ (accessed on 5 December 2022).
- Iema.net. IEMA Reports 8% Growth in Global ISO 14001 Data. 2017, pp. 3–7. Available online: https://www.iema.net/resources/news/2017/09/26/iema-reports-8-growth-in-global-iso-14001-data/ (accessed on 15 September 2022).
- Alessi, D.Z.R.; Cesare, G.; D’Amico, M.; Nisi, A.; Nizzero, F.; Patriarca, M.; Rizzitiello, F.; Tropea, V.; Ubaldini, S. Certificazione Ambientale-Ecolabel ISPRA; Annual Environmental reporting data, Rome; 2015; pp. 1–24. Available online: https://www.isprambiente.gov.it/files2019/pubblicazioni/stato-ambiente/annuario-2018/18_Certificazione_ambientale.pdf (accessed on 5 December 2022).
- EPD. The International EPD System. 2022. Available online: https://www.environdec.com/home (accessed on 20 September 2022).
- Ecolabelling Denmark. EU Ecolabel Key Figures. 2022. Available online: https://www.ecolabel.dk/en/about/ecolabels-in-figures (accessed on 15 September 2022).
- Civancik-Uslu, D.; Puig, R.; Hauschild, M.; Fullana-i-Palmer, P. Life cycle assessment of carrier bags and development of a littering indicator. Sci. Total Environ. 2019, 685, 621–630. [Google Scholar] [CrossRef]
- Abbate, S.; di Paolo, L.; Carapellucci, R.; Cipollone, R. Urban context and neighbouring lands: How reforestation could have a role in the implementation of Sustainable Energy and Climate Action Plans. E3S Web Conf. 2021, 312, 10002. [Google Scholar] [CrossRef]
- di Battista, D.; Barchiesi, C.; di Paolo, L.; Abbate, S.; Sorvillo, S.; Cinocca, A.; Carapellucci, R.; Ciamponi, D.; Cardone, D.; Corroppolo, S.; et al. The reporting of sustainable energy action plans of municipalities: Methodology and results of case studies from the abruzzo region. Energies 2021, 14, 5932. [Google Scholar] [CrossRef]
- Alhazmi, H.; Almansour, F.H.; Aldhafeeri, Z. Plastic waste management: A review of existing life cycle assessment studies. Sustainability 2021, 13, 5340. [Google Scholar] [CrossRef]
- Barlow, C.Y.; Morgan, D.C. Polymer film packaging for food: An environmental assessment. Resour. Conserv. Recycl. 2013, 78, 74–80. [Google Scholar] [CrossRef]
- Dahlgren, L.; Stripple, H. A Comparative LCA Study of Various Concepts for Shopping Bags and Cement Sacks; IVL Swedish Environmental Research Institute: Stockholm, Sweden, 2016; p. 78. [Google Scholar]
- Horodytska, O.; Valdés, F.J.; Fullana, A. Plastic flexible films waste management—A state of art review. Waste Manag. 2018, 77, 413–425. [Google Scholar] [CrossRef] [PubMed]
- Scaffaro, R.; Sutera, F.; Botta, L. Biopolymeric bilayer films produced by co-extrusion film blowing. Polym. Test. 2018, 65, 35–43. [Google Scholar] [CrossRef]
- Mistretta, M.C.; Botta, L.; Arrigo, R.; Leto, F.; Malucelli, G.; la Mantia, F.P. Bionanocomposite blown films: Insights on the rheological and mechanical behavior. Polymers 2021, 13, 1167. [Google Scholar] [CrossRef]
- Label!, LA MULTIETICHETTA ELABEL ! Regolamento. 2020. Available online: https://www.multietichetta.it/website/wp-content/uploads/2020/05/eLabel-REGOLAMENTO_v3-1-rev.-20-gennaio-2020.pdf (accessed on 1 October 2022).
- PlasticEurope. Eco-Profiles Program and Methodology PlasticsEurope, Version 3; PlasticEurope: Bruxelles, Belgium, 2019; pp. 1–39. [Google Scholar]
- Papong, S.; Malakul, P.; Trungkavashirakun, R.; Wenunun, P.; Chom-In, T.; Nithitanakul, M.; Sarobol, E. Comparative assessment of the environmental profile of PLA and PET drinking water bottles from a life cycle perspective. J. Clean. Prod. 2014, 65, 539–550. [Google Scholar] [CrossRef]
- Ahamed, A.; Vallam, P.; Iyer, N.S.; Veksha, A.; Bobacka, J.; Lisak, G. Life cycle assessment of plastic grocery bags and their alternatives in cities with confined waste management structure: A Singapore case study. J. Clean. Prod. 2021, 278, 123956. [Google Scholar] [CrossRef]
- Tamburini, E.; Costa, S.; Summa, D.; Battistella, L.; Fano, E.A.; Castaldelli, G. Plastic (PET) vs bioplastic (PLA) or refillable aluminium bottles—What is the most sustainable choice for drinking water? A life-cycle (LCA) analysis. Environ. Res. 2021, 196, 110974. [Google Scholar] [CrossRef]
- Voulvoulis, V.; Kirkman, N.; Giakoumis, R.; Metivier, T.; Kyle, P.; Midgley, C. Examining Material Evidence. The Carbon Fingerprint; Imperial College London: London, UK, 2020; pp. 1–15. [Google Scholar]
- Kan, M.; Miller, S.A. Environmental impacts of plastic packaging of food products. Resour. Conserv. Recycl. 2022, 180, 106156. [Google Scholar] [CrossRef]
- Leejarkpai, T.; Mungcharoen, T.; Suwanmanee, U. Comparative assessment of global warming impact and eco-efficiency of PS (polystyrene), PET (polyethylene terephthalate) and PLA (polylactic acid) boxes. J. Clean. Prod. 2016, 125, 95–107. [Google Scholar] [CrossRef]
- Verghese, K.; Lockrey, S.; Clune, S.; Sivaraman, D. Life Cycle Assessment (LCA) of Food and Beverage Packaging; Woodhead Publishing Limited: Sawston, UK, 2012. [Google Scholar] [CrossRef]
- Finkbeiner, M. Towards Life Cycle Sustainability Management; Springer: Dordrecht, The Netherlands, 2011; pp. 359–370. [Google Scholar] [CrossRef]
- Johansson, M.; Löfgren, C. Comparing the Environmental Profile of Innovative FibreForm® Food Trays against Existing Plastic Packaging Solutions (2017–2019); RISE-Research Institutes of Sweden: Gothenburg, Sweden, 2019; p. 87. [Google Scholar]
- Weththasinghe, K.K.; Akash, A.; Harding, T.; Subhani, M.; Wijayasundara, M. Carbon footprint of wood and plastic as packaging materials—An Australian case of pallets. J. Clean. Prod. 2022, 363, 132446. [Google Scholar] [CrossRef]
- Choi, B.; Yoo, S.; Park, S.I. Carbon footprint of packaging films made from LDPE, PLA, and PLA/PBAT blends in South Korea. Sustainability 2018, 10, 2369. [Google Scholar] [CrossRef]
- Madival, S.; Auras, R.; Singh, S.P.; Narayan, R. Assessment of the environmental profile of PLA, PET and PS clamshell containers using LCA methodology. J. Clean. Prod. 2009, 17, 1183–1194. [Google Scholar] [CrossRef]
- Post, L. Life Cycle Analysis of Three Polystyrene Waste Scenarios Biodegradation by Mealworms as an Alternative to Incineration or Recycling. Bachelor’s Thesis, Mid Sweden University, Sundsvall, Sweden, 2020. [Google Scholar]
- European Comission. Revision of European Ecolabel Criteria for Soaps, Shampoos and Hair Conditioners Preliminary results from the technical analysis. Oper. Theory Adv. Appl. 2012, 274, 17–44. [Google Scholar]
- Leissner, S.; Ryan-Fogarty, Y. Challenges and opportunities for reduction of single use plastics in healthcare: A case study of single use infant formula bottles in two Irish maternity hospitals, Resour. Conserv. Recycl. 2019, 151, 104462. [Google Scholar] [CrossRef]
- Sandrine, P.; Jérôme, P. Product Environmental Footprint Category Rules Guidance; PEFCR Guid. Doc.; European Commission: Brussels, Belgium, 2018; p. 238. Available online: https://ec.europa.eu/environment/eussd/smgp/pdf/PEFCR_guidance_v6.3.pdf (accessed on 7 October 2022).
- Sphera. Sphera Solutions GmbH. (n.d.) Available online: http://lcdn.thinkstep.com/Node/login.xhtml?stock=default&stock=default (accessed on 7 October 2022).
- OECD. Case Study on Detergent Bottles. Available online: https://www.oecd.org/chemicalsafety/risk-management/sustainable-plastic-products-detergent-bottles.pdf (accessed on 12 September 2022).
- Herberz, T.; Barlow, C.Y.; Finkbeiner, M. Sustainability assessment of a single-use plastics ban. Sustainability 2020, 12, 3746. [Google Scholar] [CrossRef]
- Franklin Associates. Life Cycle Inventory of Foam Polystyrene, Paper-Based, and PLA Foodservice Products; Franklin Associates: Prairie Village, KA, USA, 2011; p. 149. [Google Scholar]
- Moretti, C.; Hamelin, L.; Jakobsen, L.G.; Junginger, M.H.; Steingrimsdottir, M.M.; Høibye, L.; Shen, L. Cradle-to-grave life cycle assessment of single-use cups made from PLA, PP and PET. Resour. Conserv. Recycl. 2021, 169, 105508. [Google Scholar] [CrossRef]
- Dils, E. ETC/WMGE Report 3/2021: Greenhouse Gas Emissions and Natural Capital Implications of Plastics (Including Biobased Plastics). 2021. Available online: https://www.eionet.europa.eu/etcs/etc-wmge/products/etc-wmge-reports/greenhouse-gas-emissions-and-natural-capital-implications-of-plastics-including-biobased-plastics (accessed on 31 July 2022).
- United States Environmental Protection Agency. Plastics. EPA’s Waste Reduction Model; 2015. Available online: https://www.epa.gov/warm/versions-waste-reduction-model-warm (accessed on 5 December 2022).
- Maga, D.; Hiebel, M.; Aryan, V. A comparative life cycle assessment of meat trays made of various packaging materials. Sustainability 2019, 11, 5324. [Google Scholar] [CrossRef]
- Brandt, B.; Pilz, H. The Impact of Plastic Packaging on Life Cycle Energy Consumption and Greenhouse Gas Emissions in Europe. Executive Summary. 2011, pp. 1–7. Available online: https://plasticseurope.org/wp-content/uploads/2021/10/2011-Denkstatt-Summary-E-GHG_Packaging.pdf (accessed on 5 December 2022).
- Bishop, G.; Styles, D.; Lens, P.N.L. Environmental performance comparison of bioplastics and petrochemical plastics: A review of life cycle assessment (LCA) methodological decisions. Resour. Conserv. Recycl. 2021, 168, 105451. [Google Scholar] [CrossRef]
- Bohlmann, G.M. Biodegradable packaging life-cycle assessment. Environ. Prog. 2004, 23, 342–346. [Google Scholar] [CrossRef]
- Cappiello, G.; Aversa, C.; Genovesi, A.; Barletta, M. Life cycle assessment (LCA) of bio-based packaging solutions for extended shelf-life (ESL) milk. Environ. Sci. Pollut. Res. 2022, 29, 18617–18628. [Google Scholar] [CrossRef] [PubMed]
- Ferrara, C.; de Feo, G.; Picone, V. Lca of glass versus pet mineral water bottles: An italian case study. Recycling 2021, 6, 50. [Google Scholar] [CrossRef]
- Dilkes-Hoffman, L.S.; Lane, J.L.; Grant, T.; Pratt, S.; Lant, P.A.; Laycock, B. Environmental impact of biodegradable food packaging when considering food waste. J. Clean. Prod. 2018, 180, 325–334. [Google Scholar] [CrossRef]
- Albrecht, S.; Brandstetter, P.; Beck, T.; Fullana-I-Palmer, P.; Grönman, K.; Baitz, M.; Deimling, S.; Sandilands, J.; Fischer, M. An extended life cycle analysis of packaging systems for fruit and vegetable transport in Europe. Int. J. Life Cycle Assess. 2013, 18, 1549–1567. [Google Scholar] [CrossRef]
- Zheng, J.; Suh, S. Strategies to reduce the global carbon footprint of plastics. Nat. Clim. Chang. 2019, 9, 374–378. [Google Scholar] [CrossRef]
- Plastics Europe. An Analysis of European Plastics Production, Demand and Waste Data. 2021. Available online: https://plasticseurope.org/knowledge-hub/plastics-the-facts-2021/ (accessed on 2 October 2022).
- Plastics Europe. Plastics—The Facts 2020. 2020. Available online: https://plasticseurope.org/wp-content/uploads/2021/09/Plastics_the_facts-WEB-2020_versionJun21_final.pdf (accessed on 5 December 2022).
- UNEA. Issues and Concerns. Engl. J. 2022, 83, 76. [Google Scholar] [CrossRef]


| Categories |
|---|
| Films |
| Garbage bags |
| Bottles |
| Detergent bottles |
| Cutlery |
| Other (general cases and packaging) |
| Fossil-Based Plastics | Equivalent or Approximate Bio-Based Alternatives |
|---|---|
| PP | Bio-PP, Bio-PPT, PLA, PHA, PHB, TPS, cellulose based |
| PE | Bio-PE, PLA, PHB, PHA, starch- and cellulose-based polymers, PBS |
| PS | PLA, PHA, TPS, cellulose-based polymers |
| PET | Bio-PET, PEF |
| PVC | Bio-PVC, PHA, starch- and cellulose-based polymers |
| PUR | Bio-PUR |
| Stage | % Contribution to Global Warming |
|---|---|
| Polymer | 45–60% |
| Transport of the polymer | 1–2% |
| Manufacturing process | 10–20% |
| Distribution and use phase | 3–5% |
| End-of-life | 20–25% |
| Geographical Context | % Contribution End-of-Life Managment | ||
|---|---|---|---|
| Incineration | Recycling | Landfill | |
| U.S. | 14% | 6% | 80% |
| Italy | 36% | 31% | 33% |
| Spain | 19% | 42% | 39% |
| France | 43% | 24% | 33% |
| Germany | 61% | 38% | 1% |
| U.K. | 45% | 32% | 23% |
| Categories | PVC | PP | PET | HDPE | LDPE | PS | PU | PE |
|---|---|---|---|---|---|---|---|---|
| Films | 3.000 | |||||||
| Garbage bags | 3.200 | 4.130 | ||||||
| Bottles | 6.400 | |||||||
| Detergent bottles | 4.268 | 5.298 | 4.478 | 4.528 | 4.503 | |||
| Cutlery | 2.638 | 2.670 | 3.800 | 4.018 | ||||
| Other (general cases and packaging) | 4.438 | 4.268 | 5.298 | 4.478 | 4.528 | 5.608 | 7.628 | 4.503 |
| CATEGORIES | PLA | PHA | Compostable | Paper | Wood | Tetrapak | Glass | Kraftpaper |
|---|---|---|---|---|---|---|---|---|
| Films | 2.300 | - | 2.798 | - | - | - | ||
| Garbage bags | 3.500 | 1.310 | 0.420 | |||||
| Bottles | 2.480 | 2.000 | 0.0087 | |||||
| Detergent bottles | 2.703 | 1.903 | 3.058 | |||||
| Cutlery | 3.762 | 1.270 | 1.400 | 1.623 | ||||
| Other (general cases and packaging) | 2.703 | 1.903 | 3.058 | 3.940 | 3.250 | 0.570 |
| Other (General Cases and Packaging) | PVC | PP | PET | HDPE | LDPE | PS | PU | PE | |
|---|---|---|---|---|---|---|---|---|---|
| kgCO2/kg | 4.438 | 4.268 | 5.298 | 4.478 | 4.528 | 5.608 | 7.628 | 4.503 | |
| PLA | 2.703 | 1.735 | 1.565 | 2.595 | 1.775 | 1.825 | 2.905 | 4.925 | 1.8 |
| PHA | 1.903 | 2.535 | 2.365 | 3.395 | 2.575 | 2.625 | 3.705 | 5.725 | 2.6 |
| compostable (bio-PET, bio-PP, bio-PE) | 3.058 | 1.38 | 1.21 | 2.24 | 1.42 | 1.47 | 2.55 | 4.57 | 1.445 |
| paper | 3.94 | 0.498 | 0.328 | 1.358 | 0.538 | 0.588 | 1.668 | 3.688 | 0.563 |
| wood | 3.25 | 1.188 | 1.018 | 2.048 | 1.228 | 1.278 | 2.358 | 4.378 | 1.253 |
| tetrapak | 0.57 | 3.868 | 3.698 | 4.728 | 3.908 | 3.958 | 5.038 | 7.058 | 3.933 |
| Product | Category | Annual Consumption | Weight (kg) | Material | Initial CO2 Value (kg) | Substituting Material | New Weight (kg) | New CO2 Value (kg) | Delta CO2 (kg) |
|---|---|---|---|---|---|---|---|---|---|
| Water bottle 0.5 L | Bottles | 2252 | 0.0191 | PET | 275.2 | Glass | 0.0573 | 1.1 | −274.1 |
| Tetrapak | 0.015 | 67.6 | −207.6 | ||||||
| PLA | 0.01 | 55.8 | −219.4 | ||||||
| Garbage Bags 30 L | Garbage Bags | 70 | 0.043 | LDPE | 12.4 | Paper | 0.055 | 5 | −7.4 |
| Compostable | 0.012 | 2.9 | −9.5 | ||||||
| Kraftpaper | 0.15 | 4.4 | −8 | ||||||
| Plate | Cutlery | 1500 | 0.015 | LDPE | 77.9 | Compostable | 0.011 | 21 | −56.9 |
| Paper | 0.011 | 16.5 | −61.4 | ||||||
| Spoons, forks and knives | Cutlery | 1500 | 0.004 | PP | 18 | Compostable | 0.005 | 17.9 | −0.1 |
| Wood | 0.0025 | 4.8 | −13.2 | ||||||
| Pouch | Other packaging | 1500 | 0.004 | PP | 26.6 | Paper | 0.0021 | 12.4 | −14.2 |
| Compostable | 0.003 | 13.8 | −12.8 |
Publisher’s Note: MDPI stays neutral with regard to jurisdictional claims in published maps and institutional affiliations. |
© 2022 by the authors. Licensee MDPI, Basel, Switzerland. This article is an open access article distributed under the terms and conditions of the Creative Commons Attribution (CC BY) license (https://creativecommons.org/licenses/by/4.0/).
Share and Cite
Di Paolo, L.; Abbate, S.; Celani, E.; Di Battista, D.; Candeloro, G. Carbon Footprint of Single-Use Plastic Items and Their Substitution. Sustainability 2022, 14, 16563. https://doi.org/10.3390/su142416563
Di Paolo L, Abbate S, Celani E, Di Battista D, Candeloro G. Carbon Footprint of Single-Use Plastic Items and Their Substitution. Sustainability. 2022; 14(24):16563. https://doi.org/10.3390/su142416563
Chicago/Turabian StyleDi Paolo, Luca, Simona Abbate, Eliseo Celani, Davide Di Battista, and Giovanni Candeloro. 2022. "Carbon Footprint of Single-Use Plastic Items and Their Substitution" Sustainability 14, no. 24: 16563. https://doi.org/10.3390/su142416563
APA StyleDi Paolo, L., Abbate, S., Celani, E., Di Battista, D., & Candeloro, G. (2022). Carbon Footprint of Single-Use Plastic Items and Their Substitution. Sustainability, 14(24), 16563. https://doi.org/10.3390/su142416563