Article

Experimental Study of Deformation Measurement of Bored Pile Using OFDR and BOTDR Joint Optical Fiber Sensing Technology

1
Key Laboratory of Ministry of Education for Geomechanics and Embankment Engineering, Hohai University, Nanjing 210098, China
2
Electronic Integrated Survey and Research Institute, Ministry of Information Industry, Xi′an 710054, China
3
School of Automation, Nanjing University of Aeronautics and Astronautics, Nanjing 210000, China
*
Author to whom correspondence should be addressed.
Sustainability 2022, 14(24), 16557; https://doi.org/10.3390/su142416557
Submission received: 20 November 2022 / Revised: 5 December 2022 / Accepted: 8 December 2022 / Published: 9 December 2022
(This article belongs to the Special Issue Structural Health Monitoring in Civil Infrastructure)

Abstract

:
Pile foundation is the most common foundation form in geotechnical engineering; it is very important for engineering safety. In order to accurately grasp the deformation of pile foundation, OFDR (optical frequency domain reflectometer) and BOTDR (Brillouin optical time domain reflectometer) optical fiber sensing technologies are used to measure the strain variation of pile foundation. The measurement results of the two technologies are analyzed, and different data processing methods are used. The ability of the two methods to measure the strain of pile foundation is evaluated. The results show that OFDR technology can achieve high-precision and distributed measurement of strain of pile; BOTDR technology can achieve the monitoring effect of OFDR to a certain extent using appropriate data processing methods; the combination of the two methods can make up for the shortcomings of the short monitoring distance of the OFDR technique and the low accuracy of the BOTDR technique; by comparing the application effect with the two technologies in geotechnical engineering, the application prospect of OFDR–BOTDR joint optical fiber sensing technology in geotechnical engineering is discussed.

1. Introduction

Distributed optical fiber monitoring technology can continuously measure the physical parameters of the external medium distributing along the geometric path over the entire length of the optical fiber. Through the relationship between the measured parameter and the optical spectrum shift, real-time data on the temporal and spatial changes of the measured physical parameter can be obtained [1]. The optical fiber is both the transmission channel and the sensing medium. It has many advantages such as small size, good waterproof performance, good corrosion resistance, anti-electromagnetic interference, distributed measurement, etc. Optical fiber sensing technology makes up for its shortcomings with traditional resistance strain gauges and thermometers. It is very suitable for geotechnical engineering safety monitoring [2,3,4,5].
Pile foundation is an important part of geotechnical engineering. Its deformation characteristics affect the safety and stability of the superstructure directly. The development of pile foundation deformation monitoring is of great significance for optimizing the design of the pile foundation and ensuring the safe operation of the pile foundation. At present, the distributed optical fiber monitoring technologies applied to pile foundation monitoring mainly include Optical Frequency Domain Reflectometer (OFDR) technology, Brillouin Optical Time Domain Reflectometer (BOTDR) technology, Brillouin Optical Time Domain Analysisoptical time domain analysis (BOTDA) technology, Brillouin Optical Frequency Domain Analysisoptical frequency domain analysis (BOFDA) technology, Fiberfiber Bragg Gratinggrating (FBG) technology, etc. Among these technologies, OFDR technology has received extensive attention from scholars due to its high spatial resolution and high sensing accuracy. Scholars have achieved some beneficial results; Cao Yang [6] carried out an indoor model pile test using OFDR technology, and the pile deformation distribution under horizontal load was obtained. The results of theoretical calculation and numerical simulation proved the feasibility of OFDR technology for monitoring pile foundation horizontal deformation. Bersan et al. [7] used OFDR to monitor the strain of CFA pile in a static load test. Gao et al. [8] carried out research on the deformation characteristics of PCC piles. OFDR technology was used in model tests to obtain the deformation characteristics of PCC piles. Boujia et al. [9] designed the bridge pile model to simulate water erosion, and OFDR technology was applied to monitor the strain distribution of this bridge pile model. BOTDR technology has become the most widely used distributed optical fiber sensing technology in geotechnical engineering due to its long-distance advantage, especially in pile foundation engineering. Seo [10] combined BOTDR technology with 3D laser scanning technology to measure the strain distribution of the CFA pile foundation, and the causes of the negative friction resistance of the pile side were analyzed. Xiao et al. [11] realized the monitoring of the hydration heat of cast-in-place piles with BOTDR technology based on actual engineering and studied the strain of pile affected by hydration temperature. BOTDA and BOFDA technologies require double-ended measurement. FBG technology is point measurement; its degree of refinement in measurement is not high enough. BOTDA, BOFDA and FBG technologies are little used in pile foundation projects.
In the face of massive optical fiber data, many scholars have carried out research on processing problems. In recent years, the commonly used denoising methods in the optical fiber monitoring of geotechnical engineering include the wavelet transform method, feature point compression denoising method, multi-wavelet denoising method and so on. Gao et al. [10] used the wavelet transform method to process the optical fiber data and obtained the deformation of the cast-in-place pile. Miao et al. [12] proposed a feature point compression denoising method for optical fiber data denoising; a good data processing effect was obtained. Yue et al. [13] improved the multi-wavelet denoising method to process the data of optical fiber temperature sensing. The wavelet transform method has the advantages of simple processing, fast speed and good processing effect; it has been applied widely in the optical fiber monitoring of geotechnical engineering.
The maximum measuring range of the OFDR instrument is 100 m, which is less than the pile length in some projects. The BOTDR measuring range is more than 100 m, but the strain sensing precision of it is ±20 με. OFDR technology is little used in geotechnical engineering. In order to make up for the shortcomings of the lower accuracy of BOTDR and the limited sensing range of OFDR, a test of the deformation monitoring of pile using optical fiber sensors is carried out; OFDR and BOTDR technologies are used together in this paper.

2. Optical Fiber Sensing Principle

2.1. OFDR Sensing Technology Principle

There are three main types of scattering when light propagates inside an optical fiber: Rayleigh scattering, Brillouin scattering and Raman scattering. OFDR technology is strain and temperature measurement technology based on measuring the changes in the Rayleigh scattering. When the OFDR distributed sensing system is working, the laser source can be tuned to generate sweeping light, which is divided into the signal arm and reference arm after passing through the optical fiber coupler. After the optical signal in the signal arm enters the sensing fiber through the circulator, backward Rayleigh scattering occurs. The backward Rayleigh scattering light signal carrying strain information returns along the original path. The signal light in the reference arm is used for the subsequent beat frequency. The light source continuously emits linear frequency sweeping light. The optical path of the signal arm and the reference arm is different, which causes different frequency of the two output lights. Then, coherence of light occurs, and the Information relating to the light is converted into a beat frequency electrical signal in the photodetector. The strain can be calculated according to the wavelength shift of the backward Rayleigh scattering. According to the frequency of the beat signal, the strain can be located [14,15,16,17]. Equation (1) is the relationship among the shift of the Rayleigh scattering spectrum and the temperature and strain:
Δ t = k ε Δ ε + kT Δ T
In the equation, Δ t is the shift of the Rayleigh scattering spectrum when the temperature changes and the strain changes; k ε is the calibrated strain sensitivity coefficient of the optical fiber; k T is the spectrum shift corresponding to the initial temperature T0 when the strain is 0. Δ T is the temperature variation; Δ ε is the strain variation.
According to Equation (1), the strain and temperature variation of the measured object can be obtained according to the measured shift of the Rayleigh scattering spectrum.

2.2. BOTDR Sensing Technology Principle

BOTDR is Brillouin optical time domain reflectometer technology [18,19]. Its working principle is as follows: the pulsed light of a certain frequency is injected into the fiber medium; the pulsed light enters the fiber and interacts with the elastic acoustic wave to produce the backward Brillouin scattering. The stress and temperature variation of the fiber cause the shift of Brillouin scattering. The shift of Brillouin scattering can be measured, and the external physical parameters can be obtained by calculating the relationship between the external physical parameters and the strain or temperature of the fiber sensor [19]. BOTDR technology uses the characteristic shift of Brillouin scattering, which has a linear relationship with the strain and temperature of the optical fiber, to monitor the strain and temperature of the measured object. Equation (2) is the relationship between the shift of Brillouin scattering and strain as well as temperature [20,21,22]:
Δ υ B ( Δ T , Δ ε ) = C T ( T T 0 ) + C ε ( ε ε 0 )
In the equation, Δ υ B ( Δ T , Δ ε ) is the shift of Brillouin scattering when temperature changes and strain changes; C T is the calibrated temperature coefficient of the optical fiber; C ε is the calibrated strain coefficient of the optical fiber; T 0 is the initial temperature; ε is the actual strain of the optical fiber; ε 0 is the initial strain of the optical fiber.

3. Field Test

3.1. Project Overview

The test object was a bored cast-in-place pile in the field of geotechnical engineering; the pile length was 30 m, the diameter was 600 mm and the concrete strength grade was C35. According to previous research results and engineering experience [8], the U-shaped symmetrical optical fiber sensor was placed on the bored cast-in-place pile reinforcement cage. After the pile foundation was cured and formed, it was subjected to a static compression test. In the process of the static load test, the pile deformation was monitored with the BOTDR and OFDR data demodulators. The OFDR data demodulator was used immediately after the BOTDR data demodulator was used. The monitoring was processed when the settlement of pile was completely stable to eliminate the data error caused by different measurement times. The schematic diagram of the test device is shown in Figure 1.
The optical fiber sensor in this test adopted a metal-based, cable-shaped strain optical fiber sensor produced by Suzhou Nanzhi Sensing Technology Co., Ltd., Suzhou, China; the strain coefficient was 0.0478 MHz/με, and the temperature coefficient was 2.39 MHz/°C. The structure of the optical fiber sensor is shown in Figure 2a. The optical fiber sensor is shown in Figure 2b.
The OSI-S high-precision, high-resolution OFDR data demodulator was produced by Hong Kong Donglong Technology, and the AV6419 BOTDR data demodulator was produced by Suzhou Nanzhi Sensing Technology Co., Ltd. Table 1 shows the basic parameters of the OFDR technology and BOTDR technology used in the test. It can be seen from Table 1 that the OFDR technology and BOTDR technology are both single-ended distributed optical fiber sensing technologies. The sensing range of both technologies met the need of this test. The resolution and strain sensing precision of OFDR technology is far superior to those of BOTDR technology. OFDR technology is very suitable for refined research. BOTDR technology has absolute advantages in terms of sensing range. BOTDR technology can achieve measurement within 80 km, while the maximum sensing range of OFDR technology is 100 m.

3.2. Original Test Results

The middle part of the optical fiber monitoring data of the pile foundation was selected for research because the length of the pile was relatively long, and the stratum where the pile was located was well distributed. The data range was within 10–25 m of the pile buried depth. The soil layer within this range was mainly clay. Gray muddy clay was within 10–12 m; the water content was 40%; the density was 1.79 g/cm3; the specific gravity of the soil mass was 2.73; the void ratio was 1.13. Gray clay was within 12–18 m; the water content was 42%; the density was 1.77 g/cm3; the specific gravity of the soil mass was 2.75; the void ratio was 1.20. Gray silty clay was within 18–25 m; the water content was 32.6%; the density was 1.88 g/cm3; the specific gravity of soil mass was 2.73; the void ratio was 0.93. Because the sensors were symmetrically arranged on both sides of the pile, the original strain data were axisymmetric with the position of the pile bottom. The strain on both sides of the pile was ε 1 and ε 2 . The average strain of pile can be calculated as ε 1 + ε 2 2 . The monitoring data curve is shown in Figure 2. Figure 2a is the effective data obtained by the OFDR technology, and Figure 3b is the effective data obtained by the BOTDR technology. The changes of pile temperature were not considered, because the total time in the test was short; some studies have shown that it is unnecessary to consider the changes of temperature in this situation [23,24,25,26]. It can be seen from Figure 3a,b that, as the load was applied, the pile was gradually compressed in the axial direction; the optical fiber sensor placed inside the pile presented a compressive strain state, and the compressive strain at the same position increased with the load. The compressive strain of the pile presented a distribution law which had a large upper part and small lower part in the axial direction. Combining Table 1 with the monitoring data in Figure 3a,b, the trends of the data measured with the two technologies were basically the same. The number of sampling points of OFDR was much higher than that of BOTDR, but the noises of the data measured with OFDR were more obvious than those measured with BOTDR; the test repeatability of OFDR was better than that of BOTDR. Because of the high resolution and sensing accuracy of OFDR, the OFDR monitoring data were more regular than the BOTDR monitoring data. OFDR monitoring data can be regarded as the standard strain of the pile; BOTDR data should be processed close to the OFDR data. However, the noise in the monitoring results of the two technologies cannot be ignored, and the data need to be further processed.

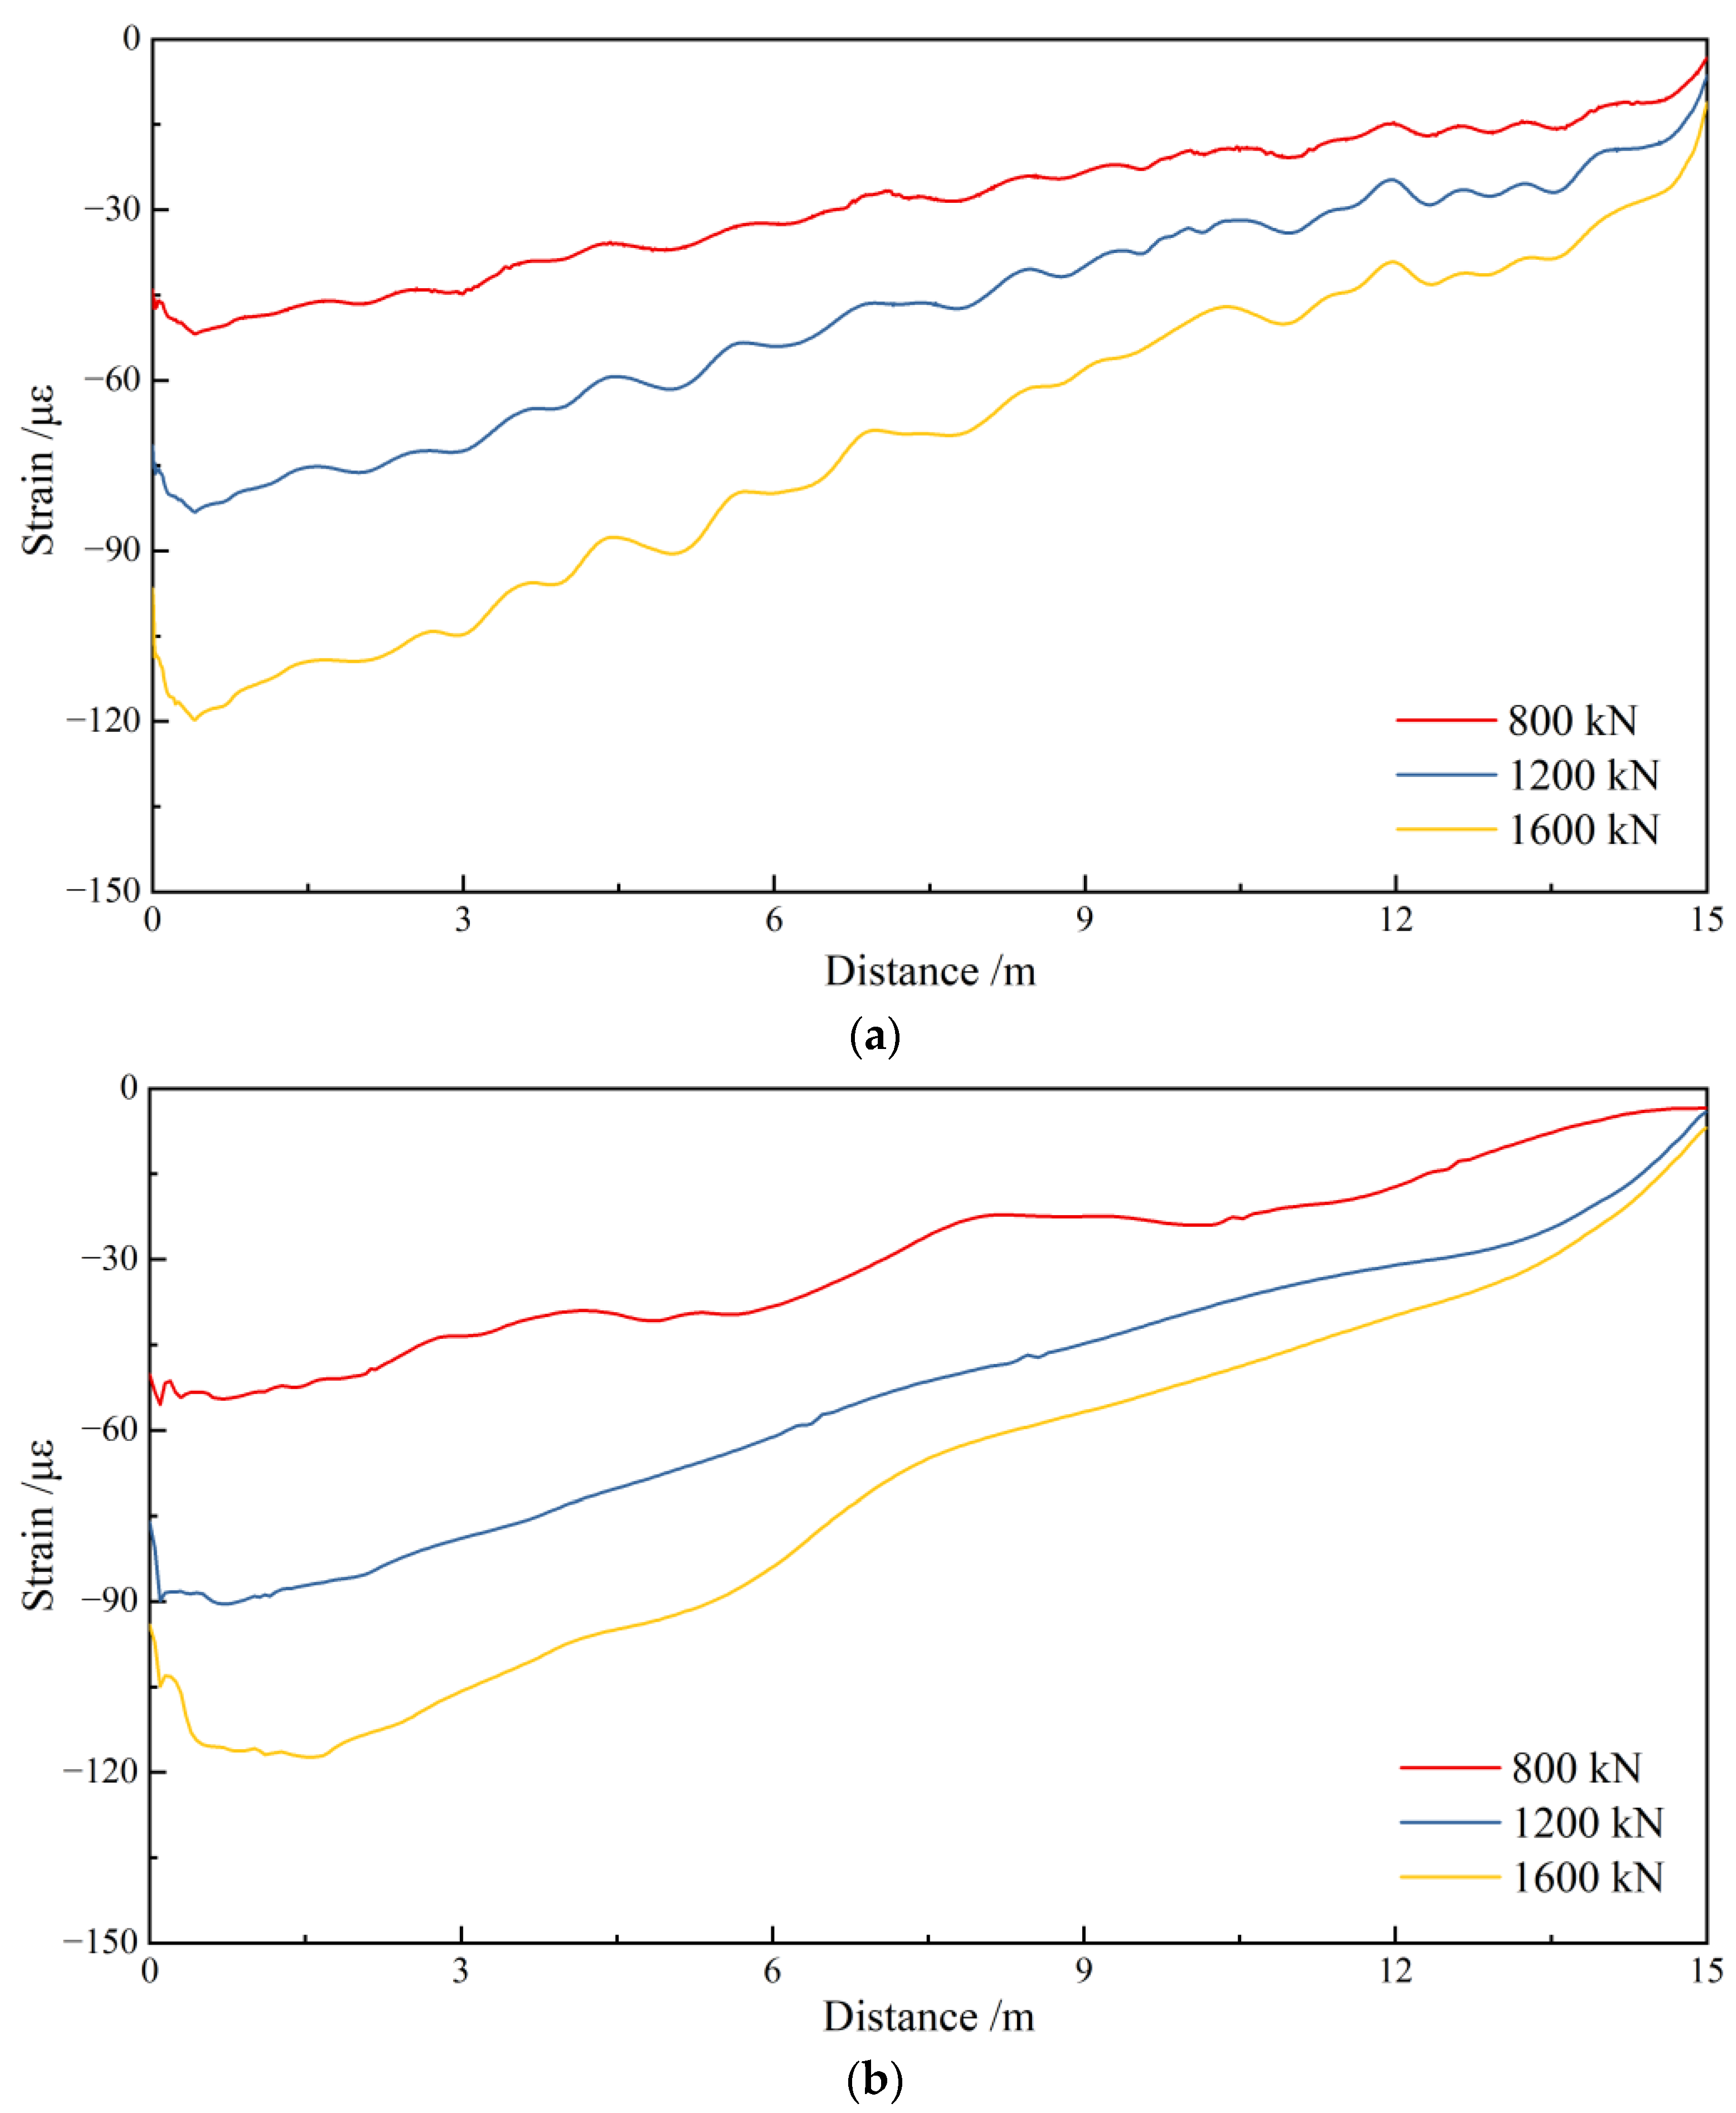
3.3. Data Denoising and Smoothing

There were a lot of noise signals mixed in with the original monitoring data. In practical applications, in order to obtain effective signals and realize the deformation analysis of the measured object, it is necessary to denoise the original data. According to the results of previous studies, the db wavelet function is often used to denoise the BOTDR data in engineering applications [12,23]. In order to compare the monitoring effects of BOTDR and OFDR, the db wavelet function was selected to denoise the two groups of monitoring data; the different db wavelet functions were used to denoise the monitoring data under a 1200 kN load. The number of decomposition layers was set to five, and the threshold was set to 40% according to the experience obtained from past practical applications. The root-mean-square error (RMSE), signal-to-noise ratio (SNR) and the smoothness r were used as the standard for evaluating the denoising effect. The denoising effects of the different db wavelet functions are shown in Table 2. It can be seen from Table 2 that db4 had the best data denoising processing effect, so the db4 wavelet function was used to denoise the two sets of data monitored with OFDR and BOTDR technologies in the following research.
Due to the influence of external factors, such as the non-uniformity of the concrete and the soil around the pile and the error existing in the installation of the optical fiber sensor, there will still be some fluctuating signals after data denoising processing; these fluctuating signals will bring difficulties to the data analysis. Therefore, it is necessary to use data smoothing methods such as the adjacent-average method, FFT filter method, etc., to process denoised data [8,24,25]. The appropriate smoothing method can make the deformation trend of the pile easier to analyze. The number of sampling points measured with OFDR technology was far greater than that measured with BOTDR technology; the signal fluctuation phenomenon using OFDR technology was more obvious. The strain distribution curve measured with OFDR after denoising under the load of 1200 kN was used as the typical research data for smoothing. The adjacent-average method and FFT filter method were used to smooth the data, and the smoothing effects were compared to determine the appropriate data smoothing method. Figure 4 is the smoothing effect on optical fiber monitoring data. Figure 4a is the smoothing effect using the adjacent-average method, and Figure 4b is the smoothing effect using the FFT filter method.
It can be seen from Figure 4a that the main parameter of the adjacent-average method was the points of window. The smoothing effect when the points of window were 20, 30, 40, 50 and 60 was compared. It can be seen that the strain curve gradually tended to become smooth with the increase in the window points, and the peak and valley amplitude of the curve gradually decreased. Smoothing with too many points of window caused the curve to shift and cause data distortion. In this test, the strain was relatively small; in order to ensure the smoothness of data and avoid the distortion, the adjacent-average method with 40 points was selected to process the data. It can be seen from Figure 4b that the main parameter of the FFT filter method that affected the smoothing effect was also the points of the window. The smoothing effects were compared when the points of the window were 20, 30, 40, 50 and 60; it can be seen that, with the increase in the window points, the strain curve became gradually smooth. By comparing the smoothing effect in Figure 4b, the FFT filter method with 40 points of the window was selected; it was the best method for obtaining the smooth data and relatively moderate peak shift among other points of the window. Table 3 is the comparison of different smoothing methods. The smoothing effects using the adjacent-average method and the FFT filter method with 40 points of the window were compared in terms of signal-to-noise ratio, mean square error and smoothness. According to Table 3, the application of the adjacent-average method (40 points) could obtain better smoothed data with a lower adjacent-average method and a higher signal-to-noise ratio. Although smoothed data with lower smoothness value could be obtained by using FFT filter method (40 points), and the smoothing effect with FFT filter method was better than that with adjacent-average method when the points of window were the same, the smoothed data showed a certain distortion, which caused the loss of important data. Based on the above analysis, the adjacent-average method with 40 points of the window was selected.
On the whole, the adjacent-average method had a low degree of smoothing and distortion. While reflecting the overall trend of the data, it could retain the details of high-precision monitoring. Therefore, the adjacent-average method was selected for data smoothing after denoising, and the points of the window were set to 40. The data after denoising and smoothing are shown in Figure 5.
It can be seen from Figure 5 that, after data processing, the influence of noise was eliminated, and the changing law of strain was more intuitively reflected, which was convenient for data analysis. The processed data showed that the axial compressive strain of the pile increased with the increase in the load and decreased with the increase in the pile length. The monitoring results of the two technologies showed the same change law; it indicates that both technologies can meet the needs of pile deformation monitoring in practical applications. Due to the influence of noise, there were more small-scale data fluctuations in the OFDR monitoring data compared to in the BOTDR monitoring data. The main cause for the larger fluctuations was the poor strain sensing accuracy of BOTDR, which reached ±20 με under the acquisition parameters set in this experiment. At the same time, these large fluctuations occurred randomly and irregularly. Large fluctuations bring certain difficulties to the refined analysis of the data. Especially in small strain monitoring, these data fluctuations have a great impact on real strain monitoring results.

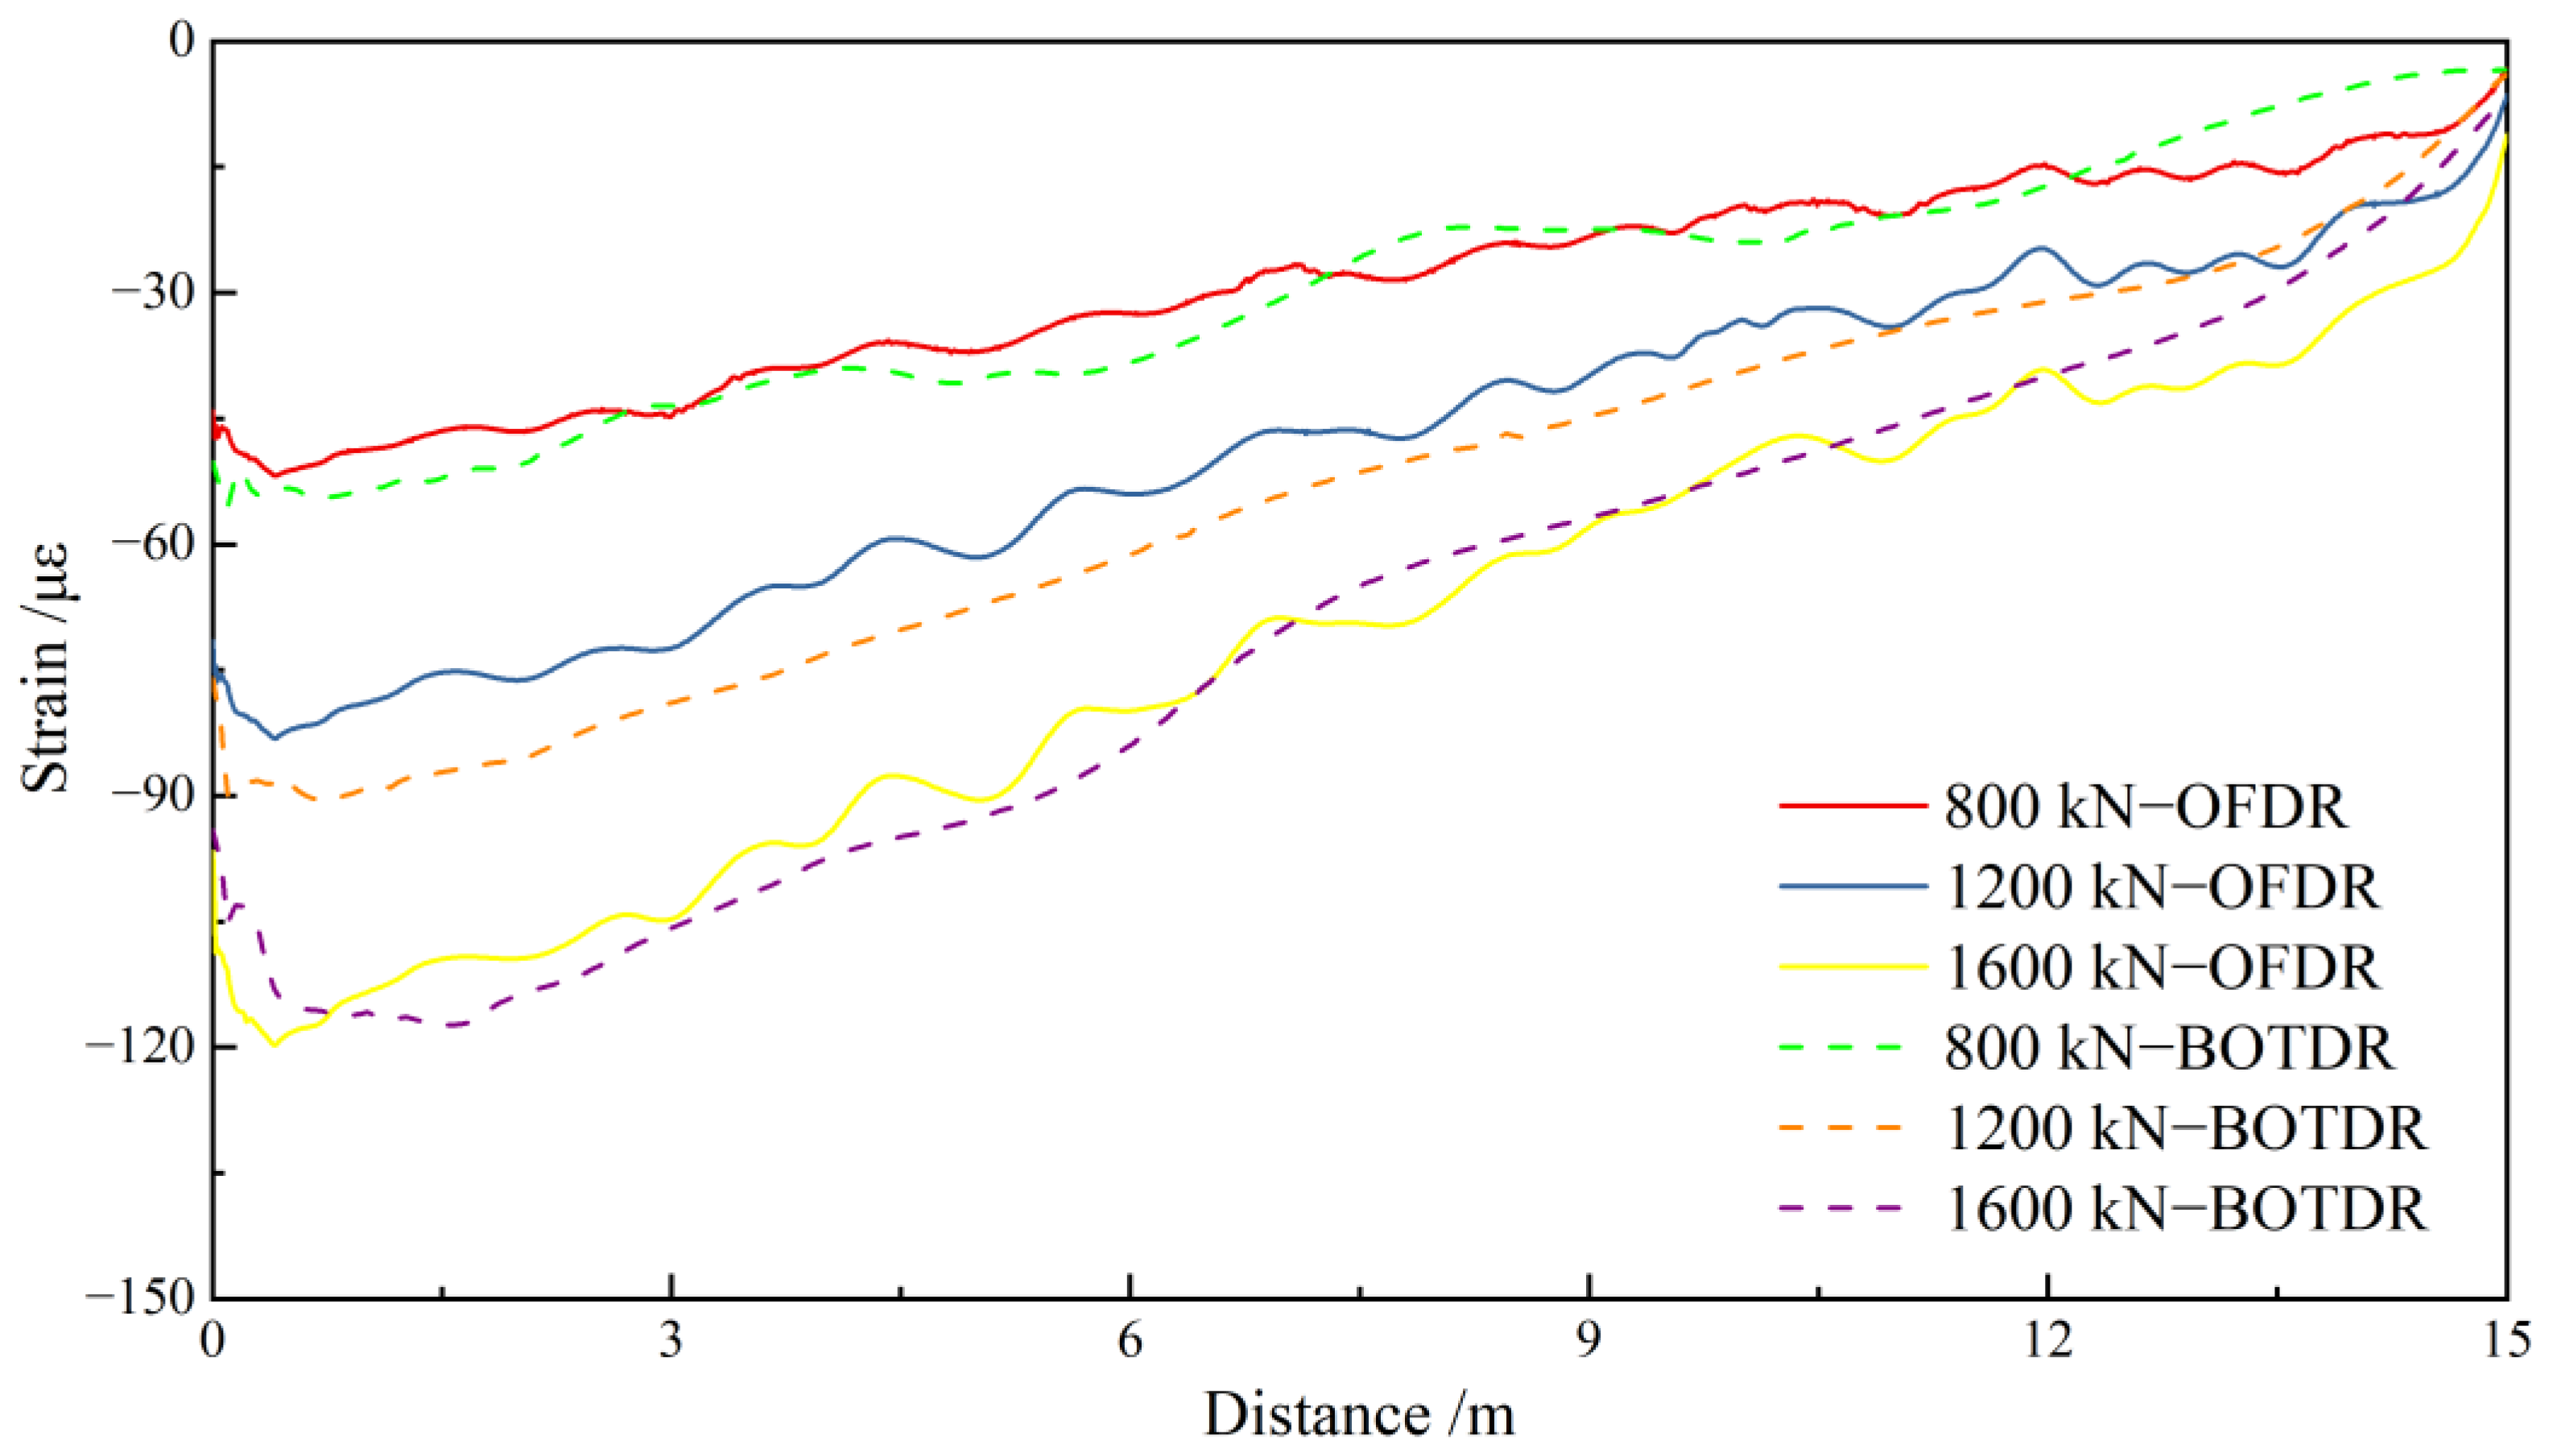
3.4. Comparison of Monitoring Results

In order to compare the data processing effect and the monitoring results of OFDR and BOTDR, the monitoring data of each load stage were drawn as shown in Figure 6. The data fluctuation and noise were eliminated to a certain degree after denoised and smoothed. The results show the approximate trend of the real deformation of pile. It can be seen from Figure 6 that both OFDR and BOTDR comprehensively reflected the change law of pile strain. The OFDR monitoring data were more accurate; OFDR technology reflected the strain situation of the details, which was conducive to refined analysis. From the perspective of positioning accuracy, the data monitored by BOTDR and OFDR at the corresponding locations were basically the same, and both can achieve precise positioning in actual projects.
In order to further analyze the monitoring data error of OFDR and BOTDR, the trend of the BOTDR and OFDR technologies was proved to be basically the same; the representative points on the curve in Figure 6 were selected for collation and comparison. Due to the difference in sensing precision between OFDR and BOTDR technologies, the deformation detail of pile was obtained with OFDR technology, while the overall strain change trend was obtained with BOTDR technology. Additionally, the strain trend was almost a straight line; four points were enough to prove that the data of the BOTDR and OFDR technologies were basically the same. The comparison results are shown in Table 4. It can be seen from Table 4 that, in the monitoring data of this experiment, the absolute value of compressive strain was smaller as the load was smaller and the length of the pile was longer. The maximum errors of BOTDR and OFDR monitoring data were within 10 με; most of the monitoring data errors were within 5%, and the minimum relative data error was within 1% (9 m, 1600 kN; 12 m, 1600 kN). This error can be basically ignored in the field of geotechnical engineering.
The monitoring data with the two technologies on the same cross-section were selected for curve fitting; the fitting results are shown in Figure 7. It can be seen from Figure 7 that the slopes of the fitting curves of the monitoring results of the two technologies on the four cross-sections of 3 m, 6 m, 9 m and 12 m were all close to 1, and the intercept was close to 0, which is similar to the curve of the proportional function. The result of curve fitting indicates that the data of the BOTDR and OFDR technologies were basically the same.
According to Figure 7 and Table 4, the BOTDR monitoring data were close to the OFDR monitoring data with appropriate data processing methods. In actual projects, this OFDR and BOTDR joint optical fiber sensing technology can be used for working conditions where the length of the object to be measured exceeds the sensing range of OFDR and high sensing precision is needed. The appropriate data processing methods can be obtained in the same sensing range of OFDR and BOTDR technologies. These processing methods can be applied to a large sensing range with BOTDR technology, which can achieve better monitoring data at a much larger sensing length.

3.5. OFDR–BOTDR Joint Sensing Method Engineering Application

In addition to pile foundation engineering, geotechnical engineering also includes slope engineering, road engineering, dam engineering and other projects. In order to compare the application effects of OFDR and BOTDR in actual engineering in the field of geotechnical engineering, the two technologies were evaluated in terms of operational stability and environmental applicability. Because OFDR technology is highly sensitive to strain and temperature changes, there is much more noise in long-term operation, which influences the data analysis. The low operating temperature affects the normal operation of the OFDR data demodulator. So, the OFDR technology is more often used in laboratory tests. The evaluation results are shown in Table 5.
According to the application effect of OFDR and BOTDR in actual projects, it can be seen that BOTDR is better than OFDR in terms of operational stability and environmental adaptability, especially when the monitoring period is long and the environment is harsh (such as an environment with a high temperature or low temperature, direct sunlight and flying dust). In many projects, data monitored by BOTDR are better than those monitored by OFDR. In the face of the shortcomings of large fluctuations in BOTDR data, through appropriate data processing methods, the monitoring result of BOTDR can be close to those of OFDR. Especially in geotechnical engineering, the length of the monitored object is often longer than the sensing range of OFDR; BOTDR can achieve the monitoring effect of OFDR under certain conditions.
Compared with BOTDR, OFDR shows the advantages of easy judgment of effective data segments, low data volatility, high precision, accurate positioning, etc. The data acquisition speed of OFDR especially is much faster than that of BOTDR. OFDR sensing technology has unique advantages in some engineering tests such as the bolt rapid pull test. It also shows powerful functions for some small-scale geotechnical engineering tests such as short pile testing. With its advantages of high precision and accurate positioning, it is used in the fine research of geotechnical engineering. However, a OFDR data demodulator has high environmental requirements, i.e., in high temperatures, low temperatures, dust, sunlight, etc., which affect its operation to varying degrees. In severe cases, they may even cause damage to the instrument. OFDR data demodulators are inferior to BOTDR in terms of environmental adaptability. The OFDR sensing distance is only 100 m, which also is not enough for some large projects.
From the above, BOTDR technology can achieve long-distance measurement in large-scale projects and achieve high-precision monitoring results with appropriate data processing methods. OFDR technology can be used for monitoring the key and dangerous parts of the project to achieve high-precision monitoring, but the OFDR data demodulator is very expensive. OFDR and BOTDR joint optical fiber sensing technology can make up for the shortcomings of the lower accuracy of BOTDR and limited sensing range of OFDR. The reusability of optical fiber sensors makes this method simple and feasible, and it has broad prospects in large-scale project monitoring.

4. Conclusions

This paper used OFDR technology and BOTDR technology to realize high-precision distributed monitoring in pile foundation engineering; the applicability of the OFDR and BOTDR joint optical fiber sensing technology in the field of geotechnical engineering was discussed. The results show that:
(1)
OFDR technology and BOTDR technology can realize distributed monitoring of the deformation of bored cast-in-place pile foundation. Data monitored with the two technologies show the same change trend. OFDR has higher accuracy and less data volatility, enabling refined measurement and analysis;
(2)
The combined processing method of db wavelet function and adjacent-average method was used to denoise and smooth the monitoring data; the appropriate processing parameters were selected. BOTDR technology can achieve the certain sensing effect of the OFDR technology in strain sensing with this method, which makes up for the shortcoming of the low sensing accuracy of BOTDR technology;
(3)
For large-scale geotechnical engineering, BOTDR technology can be used to conduct distributed sensing to determine the deformation characteristics and force law; OFDR technology can be applied to achieve refined research of small-scale key engineering parts. OFDR and BOTDR joint optical fiber sensing technology can make up for the shortcomings of the lower accuracy of BOTDR and the limited sensing range of OFDR. It has broad prospects in large-scale project monitoring.

Author Contributions

L.G.: conceptualization, methodology, validation, resources, data curation, writing—original draft, writing—review and editing, supervision, project administration, funding acquisition. J.Q.: validation, formal analysis, investigation, writing—original draft, writing—review and editing. C.H.: supervision, writing—review and editing. S.Q.: writing—review and editing. K.F.: writing—review and editing. All authors have read and agreed to the published version of the manuscript.

Funding

Financial support comes from the National Natural Science Foundation of China (grant no. 52027812), the Fundamental Research Funds for the Central Universities of Hohai University (no. B210202047) and the Shaanxi Key Research and Development Program (2021SF-465) and is gratefully appreciated.

Data Availability Statement

Not applicable.

Conflicts of Interest

The authors declare no conflict of interest. The authors declare that they have no known competing financial interests or personal relationships that could have influenced the work reported in this paper.

References

  1. Zhu, Y.; Zhu, H.H.; Zhang, W.; Shi, B. Parametric analysis of influencing factors of slope stability strengthened by anti-sliding pile. J. Eng. Geol. 2017, 25, 833–840. [Google Scholar]
  2. Shi, B.; Xu, H.Z.; Zhang, D.; Ding, Y.; Cui, H.L. Feasibility study on application of BOTDR strain monitoring technology in health diagnosis of large-scale foundation engineering. Chin. J. Rock Mech. Eng. 2004, 23, 493–499. [Google Scholar]
  3. Gao, L.; Chen, H.D.; Yu, X.J.; Zhou, B. Research progress of distributed optical fiber sensing technology in geotechnical and geological engineering. J. Hydraul. Waterw. Eng. 2013, 2, 93–99. [Google Scholar]
  4. Zhu, H.H.; Shi, B.; Zhang, C.C. FBG-based monitoring of geohazards: Current status and trends. Sensors 2017, 17, 452. [Google Scholar] [CrossRef] [Green Version]
  5. Ferraro, P.; De Natale, G. On the possible use of optical fiber Bragg gratings as strain sensors for geodynamical monitoring. Opt. Lasers Eng. 2002, 37, 115–130. [Google Scholar] [CrossRef]
  6. Cao, Y.; Sun, Y.J.; Hu, X.F.; Xu, H.Z.; Gao, L. Experimental study on distributed deformation detection model of foundation pile under horizontal load. Chin. J. Undergr. Space Eng. 2021, 17, 107–116. [Google Scholar]
  7. Bersan, S.; Bergamo, O.; Palmieri, L.; Schenato, L.; Simonini, P. Distributed strain measurements in a CFA pile using high spatial resolution fibre optic sensors. Eng. Struct. 2018, 160, 554–565. [Google Scholar] [CrossRef]
  8. Gao, L.; Gong, Y.H.; Liu, H.L.; Ji, B.Q.; Xuan, Y.N.; Ma, Y. Experiment and numerical study on deformation measurement of cast-in-place concrete large-diameter pipe pile using optical frequency domain reflectometer technology. Appl. Sci. 2018, 8, 1450. [Google Scholar] [CrossRef] [Green Version]
  9. Boujia, N.; Schmidt, F.; Chevalier, C.; Siegert, D.; van Bang, D.P. Distributed optical fiber-based approach for soil–structure interaction. Sensors 2020, 20, 321. [Google Scholar] [CrossRef] [Green Version]
  10. Seo, H. Monitoring of CFA pile test using three dimensional laser scanning and distributed fiber optic sensors. Opt. Lasers Eng. 2020, 130, 106089. [Google Scholar] [CrossRef]
  11. Xiao, H.L.; Liu, Y.L.; Huang, S.L.; Li, L.H.; Ma, Q. Influence of temperature on BOTDR used to monitor stabilizing piles. J. Test. Eval. 2021, 49, 1004–1019. [Google Scholar] [CrossRef]
  12. Miao, P.Y.; Wang, B.J.; Shi, B.; Zhang, Q.Q. Application of feature point compression algorithm in distributed fiber optic pile foundation inspection. Rock Soil Mech. 2017, 38, 911–917. [Google Scholar]
  13. Yue, J.P.; Xi, G.Y.; Li, N. Processing of monitoring data from distributed optical fiber temperature sensor based on multi-wavelet. J. Hohai Univ. Nat. Sci. 2008, 36, 675–678. [Google Scholar]
  14. Zhang, Z.L.; Gao, L.; Sun, Y.Y.; Zhang, Q.H.; Zeng, P. Study on strain transfer law of distributed fiber optic sensor. Chin. J. Lasers 2019, 46, 0410001. [Google Scholar] [CrossRef]
  15. Luo, M.M.; Liu, J.F.; Tang, C.J.; Wang, X.F.; Lan, T.; Kan, B.X. 0.5 mm spatial resolution distributed fiber temperature and strain sensor with position-deviation compensation based on OFDR. Opt. Express 2019, 27, 35823–35829. [Google Scholar] [CrossRef]
  16. Zhang, Z.P.; Fan, X.Y.; He, Z.Y. Long-range distributed static strain sensing with <100 nano-strain resolution realized using OFDR. J. Light. Technol. 2019, 37, 4590–4596. [Google Scholar]
  17. Weng, Y.; Ip, E.; Pan, Z.; Wang, T. Singlend simultaneous temperature and strain sensing techniques based on Brillouin opticaltime domain reflectometry in fewmode fibers. Opt. Express 2015, 23, 9024–9039. [Google Scholar] [CrossRef]
  18. Fabien, R.; Bao, X.; Li, Y.; Yu, Q.; Yale, A.; Kalosha, V.P.; Chen, L. Signal processing technique for distributed Brillouin sensing at centimeter spatial resolution. Light. Technol 2007, 25, 3610–3618. [Google Scholar]
  19. Zhang, D.; Xu, H.Z.; Shi, B.; Sui, H.B.; Wei, G.Q. Brillouin power spectrum analysis for partially uniformly strained optical fiber. Opt. Lasers Eng. 2009, 47, 976–981. [Google Scholar] [CrossRef]
  20. Kee, H.H.; Lees, G.P.; Newson, T.P. All-fiber system for simultaneous interrogation of distributed strain and temperature sensing by spontaneous Brillouin scattering. Opt. Lett. 2000, 25, 695–697. [Google Scholar] [CrossRef]
  21. Horiguchi, T.; Shimizu, K.; Kurashima, T.; Tateda, M.; Koyamada, Y. Development of a distributed sensing technique using Brillouin scattering. J. Light. Technol. 1995, 13, 1296–1302. [Google Scholar] [CrossRef]
  22. Sakairi, Y.; Uchiyama, H.; Li, Z.M.; Adachi, S. System for measuring temperature and strain separately by BOTDR and OTDR. Adv. Sens. Syst. Appl. 2002, 4920, 274–284. [Google Scholar]
  23. Hong, C.Y.; Zhang, Y.F.; Li, G.W.; Zhang, M.X.; Liu, Z.X. Recent progress of using Brillouin distributed fiber optic sensors for geotechnical health monitoring. Sens. Actuators A Phys. 2017, 258, 131–145. [Google Scholar] [CrossRef]
  24. Qiu, W.W.; Sui, Q.M.; Zhang, G.T.; Wei, B. Research on noise removal of BOTDR fiber temperature sensing system based on wavelet transform. Laser Optoelectron. Prog. 2004, 11, 26–29. [Google Scholar]
  25. Piao, C.D.; Shi, B.; Wei, G.Q.; Zhu, Y.Q.; Zhang, D. Application of distributed optical fiber sensing technology in borehole pile detection. Chin. J. Geotech. Eng. 2008, 30, 976–981. [Google Scholar]
  26. Gao, L.; Zhou, L.; Liu, H.L.; Huang, J.; Wang, Y. Field experimental study on high precision measurement of pile deformation of cast-in-place pile. Geotech. Mech. 2021, 42, 2004–2014. [Google Scholar]
Figure 1. Schematic diagram of the test device.
Sustainability 14 16557 g001
Figure 2. Metal-based, cable-shaped strain optical fiber sensor: (a) structure of the optical fiber sensor; (b) optical fiber sensor.
Sustainability 14 16557 g002
Figure 3. Curve of original monitoring data: (a) OFDR monitoring data, (b) BOTDR monitoring data.
Sustainability 14 16557 g003
Figure 4. Smoothing effect on optical fiber monitoring data: (a) smoothing effect using the adjacent-average method; (b) smoothing effect using the FFT filter method.
Sustainability 14 16557 g004aSustainability 14 16557 g004b
Figure 5. Data curve after processing: (a) processed OFDR data; (b) processed BOTDR data.
Sustainability 14 16557 g005
Figure 6. Comparison of OFDR and BOTDR monitoring data.
Sustainability 14 16557 g006
Figure 7. Fitting curve of OFDR and BOTDR monitoring data.
Sustainability 14 16557 g007
Table 1. Basic parameters of OFDR and BOTDR technologies.
NameTest ItemSpatial ResolutionMaximum Spatial ResolutionStrain Sensing PrecisionSensing Range
OFDRTemperature, strain1 mm1 mm±1 με100 m
BOTDRTemperature, strain1 m5 cm±20 με0.5–80 km
Table 2. Denoising effect of different db wavelet functions.
Wavelet FunctionOFDRBOTDR
RMSESNRrRMSESNRr
db27.521216.89950.197810.132315.38380.2872
db37.667016.73270.120310.177415.34520.2322
db47.498516.92570.16639.579915.87080.2972
db57.657116.74380.043410.223115.30630.0955
db67.683716.71380.075810.665914.93800.1720
db77.641016.76220.072210.583815.00510.1620
db87.624216.78130.07639.932015.55720.1543
db97.649616.75240.159110.029115.47270.3124
db107.674416.72430.154610.790914.83680.1546
Table 3. Comparison of different smoothing methods.
Smooth WayRMSESNRr
Adjacent-average method (40 points)7.617516.78890.0291
FFT filter method (40 points)7.698716.69680.0058
Table 4. Comparison of monitoring results between OFDR and BOTDR.
Distance/mLoad/kNOFDR Monitoring Results /μεBOTDR Monitoring Results /μεAbsolute Value of Data Error/με
3800−44−431
1200−72−797
1600−105−1061
6800−32−386
1200−54−617
1600−80−844
9800−23−221
1200−40−455
1600−58−571
12800−15−172
1200−25−316
1600−39−401
Table 5. Application effects of OFDR and BOTD in projects.
Technology NameSensing SpeedOperational StabilityEnvironmental AdaptabilityData Volatility
OFDRFastPoor stability, prone to a lot of noise in long-term operationPoor environmental adaptability and high requirements for operating temperatureSmall
BOTDRSlowGood stability, long-term continuous operationGood environmental adaptabilityBig
Publisher’s Note: MDPI stays neutral with regard to jurisdictional claims in published maps and institutional affiliations.

