Article

Competency-Based E-Learning Systems: Automated Integration of User Competency Portfolio

1
Department of Information Technology, Vilnius Gediminas Technical University, 10223 Vilnius, Lithuania
2
Department of Creative Communication, Vilnius Gediminas Technical University, 10223 Vilnius, Lithuania
3
Department of Information Systems, Vilnius Gediminas Technical University, 10223 Vilnius, Lithuania
*
Author to whom correspondence should be addressed.
Sustainability 2022, 14(24), 16544; https://doi.org/10.3390/su142416544
Submission received: 7 November 2022 / Revised: 4 December 2022 / Accepted: 8 December 2022 / Published: 9 December 2022
(This article belongs to the Topic Big Data and Artificial Intelligence)

Abstract

:
In today’s learning environment, e-learning systems are becoming a necessity. A competency-based student portfolio system is also gaining popularity. Due to the variety of e-learning systems and the increasing mobility of students between different learning institutions or e-learning systems, a higher level of automated competency portfolio integration is required. Increasing mobility and complexity makes manual mapping of student competencies unsustainable. The purpose of this paper is to automate the mapping of e-learning system competencies with student-gained competencies from other systems. Natural language processing, text similarity estimation, and fuzzy logic applications were used to implement the automated mapping process. Multiple cases have been tested to determine the effectiveness of the proposed solution. The solution has been shown to be able to accurately predict the coverage of system course competency by students’ course competency with an accuracy of approximately 77%. As it is not possible to achieve 100% mapping accuracy, the competency mapping should be executed semi-automatically by applying the proposed solution to obtain the initial mapping, and then manually revising the results as necessary. When compared to a fully manual mapping of competencies, it reduces workload and increases resource sustainability.

1. Introduction

To provide an effective learning experience in the learning process, the balance between a student’s already-known material and newly developed skills must be taken into account. Learning programs are oriented to build sequential competencies between different courses. It is designed in a generalized way, assuming all students will achieve the planned level of dedicated competencies. However, different students’ abilities, learning experiences, and other factors affect the variance of competencies. Therefore, personalized competency level tracking and learning path planning are preferred to provide a high user learning experience and effectiveness.
Long-term studies and competency-based e-learning allow the system to collect a student’s competency portfolio and tailor the learning path to meet the student’s needs. For students who lack the required competencies and additional material, consultations may be provided, while students with higher-developed competencies can follow an adapted learning path to skip some topics and avoid repetitively learning already mastered competencies. Additionally, if a student joins only one course or transfers from another learning institution to the study program, his or her competency portfolio must be mapped to the competencies in the learning system. In student mobility programs (such as Erasmus+), this is a problem. The need for administrative and mapping documents led to the “Erasmus without papers” project [1], where student and course data are shared in one linking system between different institutions. It simplified the administration but additional manual work is needed for credit transfer anyway [2]. Therefore, automated credit transfer solutions, based on natural language processing applications that analyse course overlap, were proposed during the last year [3]. Based on topic overlap analysis, this solution ignores competency or outcome mapping. Competency mapping is needed to implement reverse credit transfer [4] and assure that the study process is focused on students’ competencies, not just coverage of students’ knowledge topics. But this task is not easy as no common standard for competencies definition exists and each educational institution’s e-learning system uses its preferred, individually selected competencies. As well, the landscape of the competencies in each area might change over time.
There are two main methods of mapping student competencies: testing the students’ competencies at the time of admission, and mapping each competency between the used competency system and the one shown in students’ past course descriptions or exported from e-learning systems. Both methods are time-consuming. A formative assessment requires effort for preparation (many tasks need to be completed to evaluate all inspected competencies), students are required to take many tests to evaluate different competencies, and the results of the tests must be reviewed by the testing institution because not all competencies can be evaluated by automated testing. Methods to reduce the formative assessment test size for the student by applying adaptive knowledge testing exist [5]. This is helpful in formative testing during the course, however, in the case of long-term study programs where students from other institutions are taking part later in the program, it is still too messy for a full mapping of students and program competencies. Additionally, mapping student and study program or e-learning system competencies based on formal documents and defining students’ already gained competencies eliminates the need for testing but requires document analysis. Multiple persons, representing different study areas, capable of understanding the differences and similarities between study outcomes, which sometimes are expressed in relatively short texts, usually must do the analysis.
Both of these two methods for mapping student competencies to study programs or e-learning system competencies are complicated to apply and time-consuming. Moreover, student mobility, convergence, and retraining are becoming more prevalent, and a simplified solution for integrating student competencies portfolios is needed. Therefore, the objective of the paper is to simplify the mapping of students’ competency portfolio-related course competencies to e-learning system-used competencies by proposing an automated tool for mapping text-written competencies. This requires answering the question of how efficient automated text processing can be for automatic mapping of student-gained and e-learning system-used competencies as well as estimating the possible workload reduction for manual mapping.
To find out how effective automated competency mapping can be, the paper is structured in the following order. Section 2 examines existing methods for text and competency similarity estimation. Section 3 proposes a method for automated competency mapping. Section 4 presents the estimated automatic mapping accuracy metrics and defines its application effectiveness in comparison to the manual mapping of competencies. Section 5 will provide conclusions, generated based on the achieved results.

2. Related Works

2.1. Competencies Evaluation and Mapping

Education and industry organizations are investigating the need for a competency evaluation method and mapping it to market needs. Only employees and students with the appropriate matching competencies can achieve the most optimal performance and resource usage balance [6]. However, competency estimation is difficult. Knowledge and skills are just the tip of the iceberg [7], while self-image, behavior, and motivation are equally relevant. Some authors also mention a person’s attitude and values as significant factors of competencies [8]. Therefore, competencies are mostly associated with “the range of skills that are satisfactorily performed”, while competencies refer to “the behavior adopted in competent performance” [9]. The summarized course marks or study outcomes usually are not enough to express students’ competencies [10]. For competency evaluation, different aspects (knowledge, skills and attributes) are measured and a sum of those is associated with a competency level or score [11]. Numeric metrics enable easy estimation and statistical comparison of needed and acquired competencies [12].
To evaluate student or employee competencies, different methods are used. They cover interviews, group works, workshops, questionnaires, performance appraisal formats etc. [11]. For competency mapping to a specific employment position, it is imperative to take into account the specifics of the position [13] or even a process [14] on which the employee is working. Trends for different competencies can be observed over time [15]. Competency maps of specific areas are therefore generated before evaluating the competencies of students or employees [16]. In some areas, the competency maps can be used as a standard for competency development or evaluation [17,18]. While constant updates are needed, integration of market needs based on data in online systems [19] is needed to get up-to-date competency maps.
Persons’ competency evaluation results are usually expressed in text form, defining the competency and/or its level, and score. If a reference competency map with detailed competency descriptions and specifications is used, mapping between two competency evaluation documents is easy. However, standardized competency maps are rarely used. Many organizations, studies, and employment areas have their own competency maps or provide unstructured data in the form of text, defining the current vision for needed and acquired skills. Therefore, text comparison-based methods are useful for automated competency mapping.

2.2. Text-Written Competency Mapping

Among the most useful tools for comparing text-written competencies is the competency title verb association with Bloom’s taxonomy [20]. As keywords for each Bloom’s taxonomy level are defined, the keywords can be found in the competency description and associated with the associated competency level. Text-written keywords and competency verbs can be matched using different text distance or representation methods [21].
The competency level estimation method is suitable for analysis of student competency level growth within study years, employee growth, etc. However, it does not concentrate on the competency area or topic. To implement a full mapping between different competencies, text comparison methods can be used. A. Garman et al. [22] used cosine distance with different cutoff values to implement automated mapping of study program objectives to the Health Leadership Competency Model, a reference model for study program objectives. This approach does not distinguish between competency levels and topics. It compares the competency text as a whole. Meanwhile, P. R. Kowligi [23] separates the verbs to define the level in Bloom’s taxonomy and nouns for competency topics. However, the topics are summarized with the list of noun keywords, but competency mapping to competency is not performed. The results of this research are mostly used for comparison of competency framework coverage, rather than building associations between competencies of different competency frameworks.
The analysis of related works indicates there are similar research works, concentrating on text-written competency analysis. However, the solved problem and application area of the proposed method is different, and not adaptable to an automated mapping of student and e-learning system competencies.

3. Automation of Text-Written Competency Mapping

Competencies in e-learning environments, education systems, and student profiles are usually stored in text format. Formal structures for competency descriptions are not popular. Text-based descriptions are more flexible and allow a better presentation of competency for human beings. Linking student-passed courses and descriptions of the courses can be automated with the help of data extraction methods, existing programming technologies or even APIs, designed in the “Erasmus without papers” system [1]. While reading and comparing one competency to another from the analyzed course and the one student passes, gathered from other systems, additional interpretations might be needed. Therefore, to replace human work for competency mapping, automated text analysis solutions are needed.
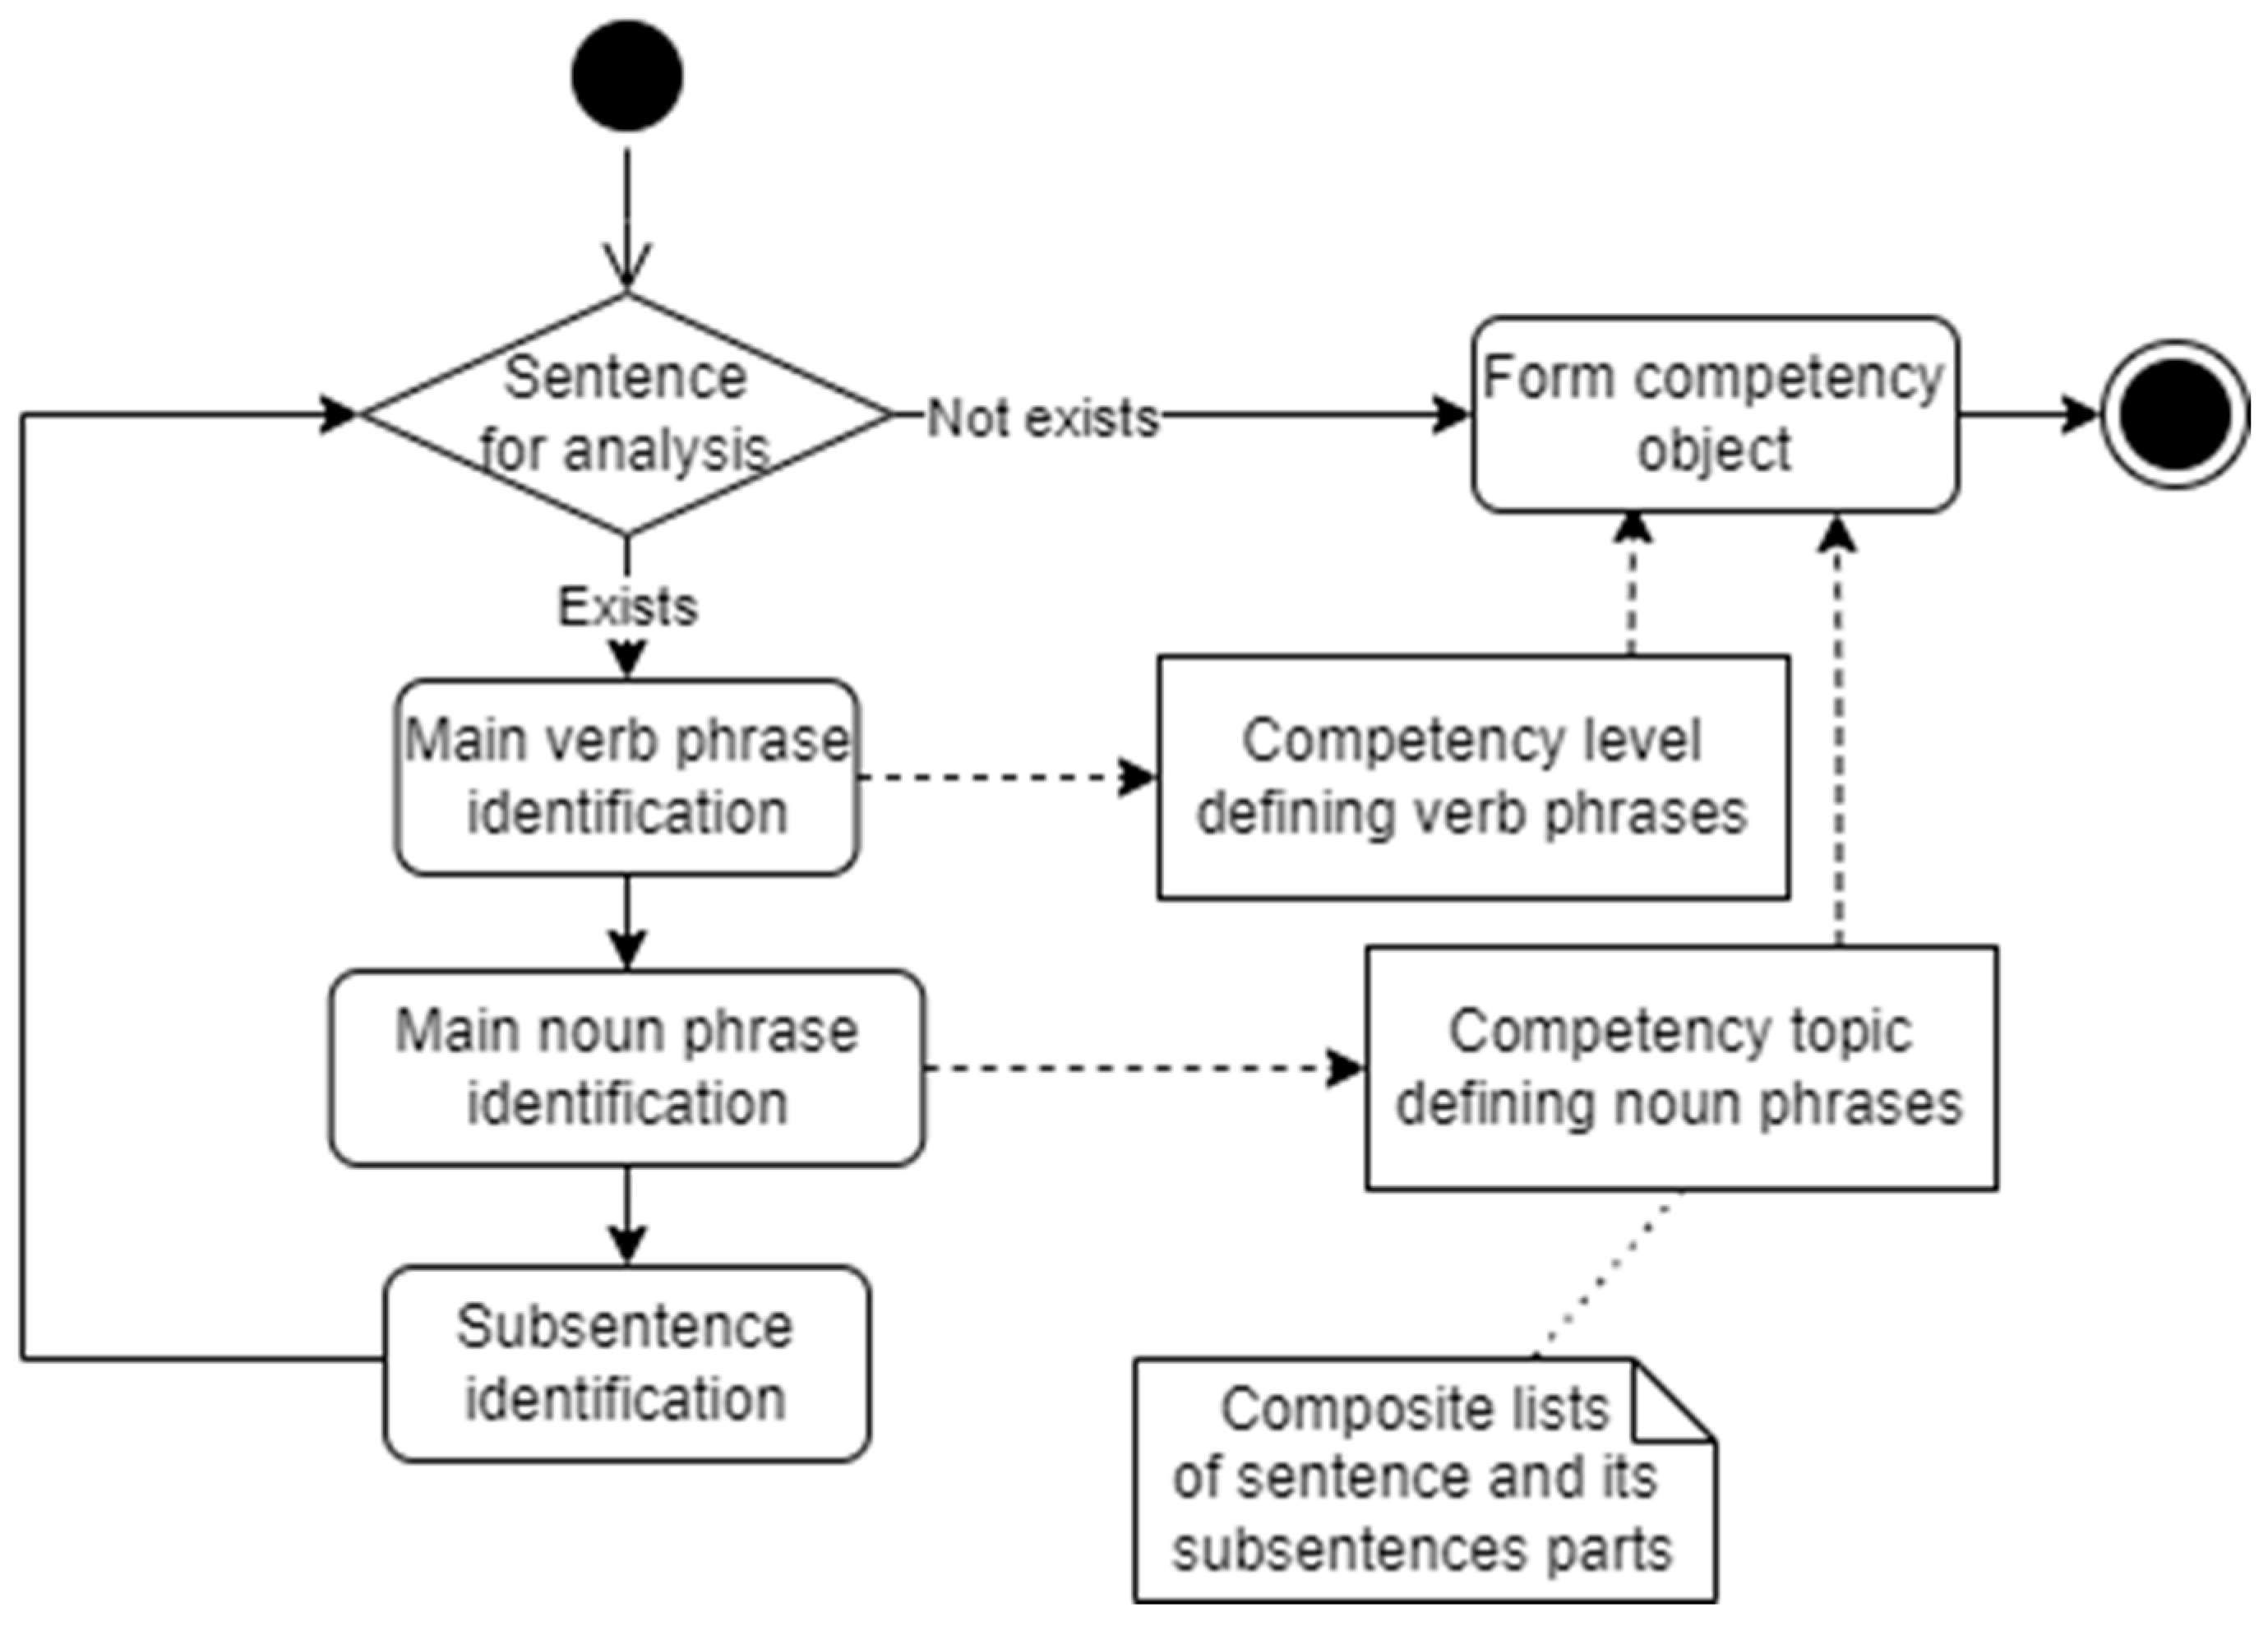
For competency comparison, we express each competency text as a list of competency levels and competency topics (see Figure 1). The competency level is associated with verb phrases in the sentence and its matching to Bloom’s taxonomy. The Bloom taxonomy defines the key verbs, indicating different levels of proficiency. The use of this metric can also be applied to numerical comparisons. Meanwhile, topic extraction is associated with noun phrases. The list of noun phrases is extracted from the sentence for later text similarity estimation to understand the topic similarity of different competencies. As each sentence can have internal sub-sentences inside of it, the sentence is analyzed recursively for each sub-sentence as part of the initial sentence. For simplification, the verb and noun phrases of the main and sub-sentences are stored in the same lists, regardless of whether they are in the main sentence or not.
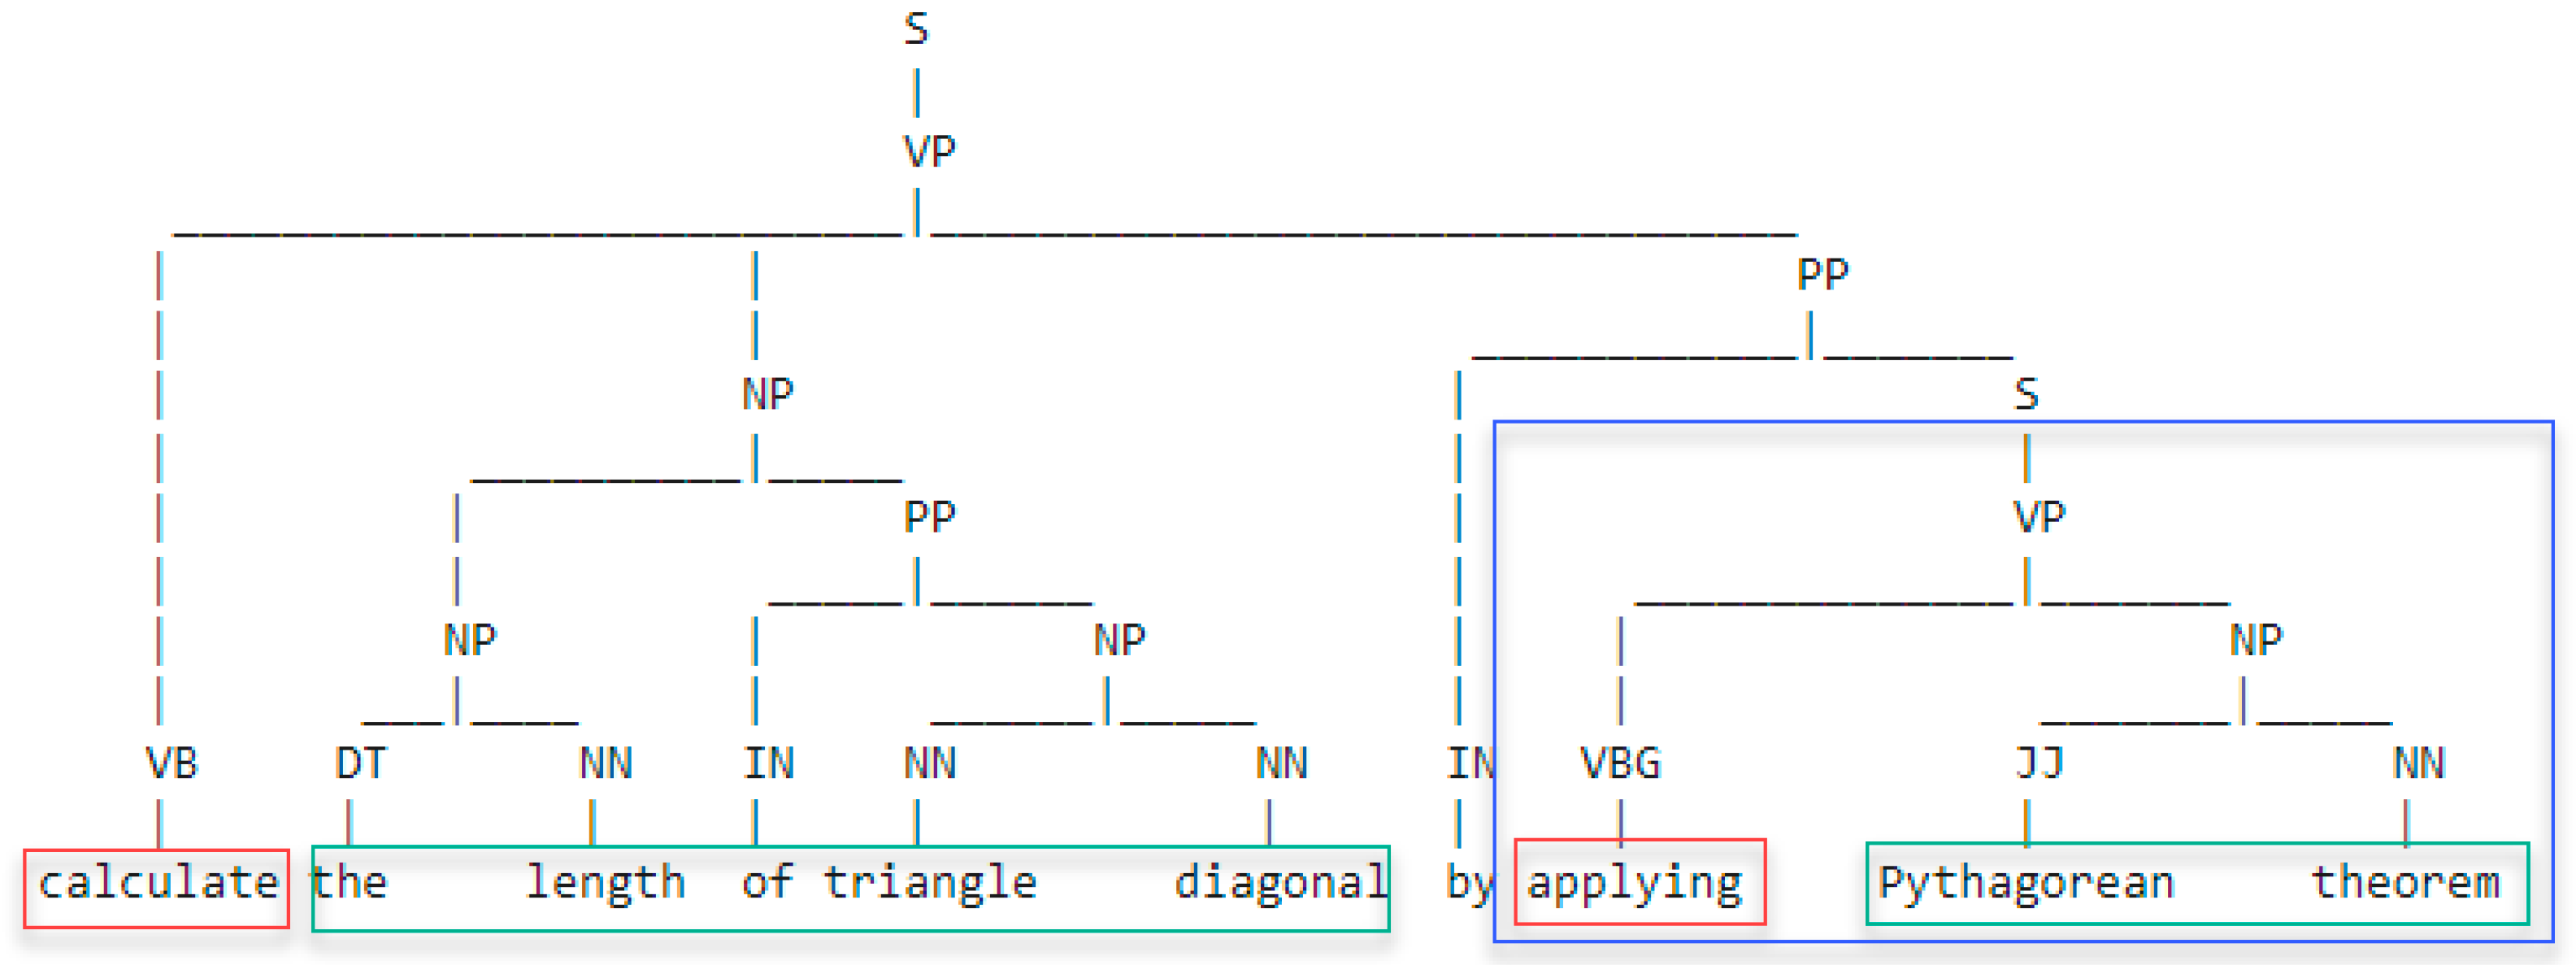
The verb and noun phrases are extracted from the sentence using natural language processing methods. The existing corpus and model are used to label the sentence so that it can be expressed as a tree of parts-of-speech (POS) elements (see Figure 2). The tree structure allows easier identification of related parts of the sentence. The verb phrases are identified in the sentence and marked in multiple labels (all starting with the letter V—VP, VB, VBG, etc.), depending on the form of the verb. However, different verb forms can be taken into account. Any form of the verb will be searched in the sentence, while for further usage it will be converted into the standard form. For noun phrase identification, the highest-level noun phrase element (marked with a label NP) is used, combining multiple words as a composite topic. Sub-sentences are marked with the label S. The text of the sub-sentence is analyzed recursively with the same idea as described above.
The same verb and noun phrase identification principle is applied to building a competency tree from a list of competencies [24]. Compared to the existing solution that used data clustering and similarity to estimate competency relationships, in this paper fuzzy logic is employed for mapping competencies.
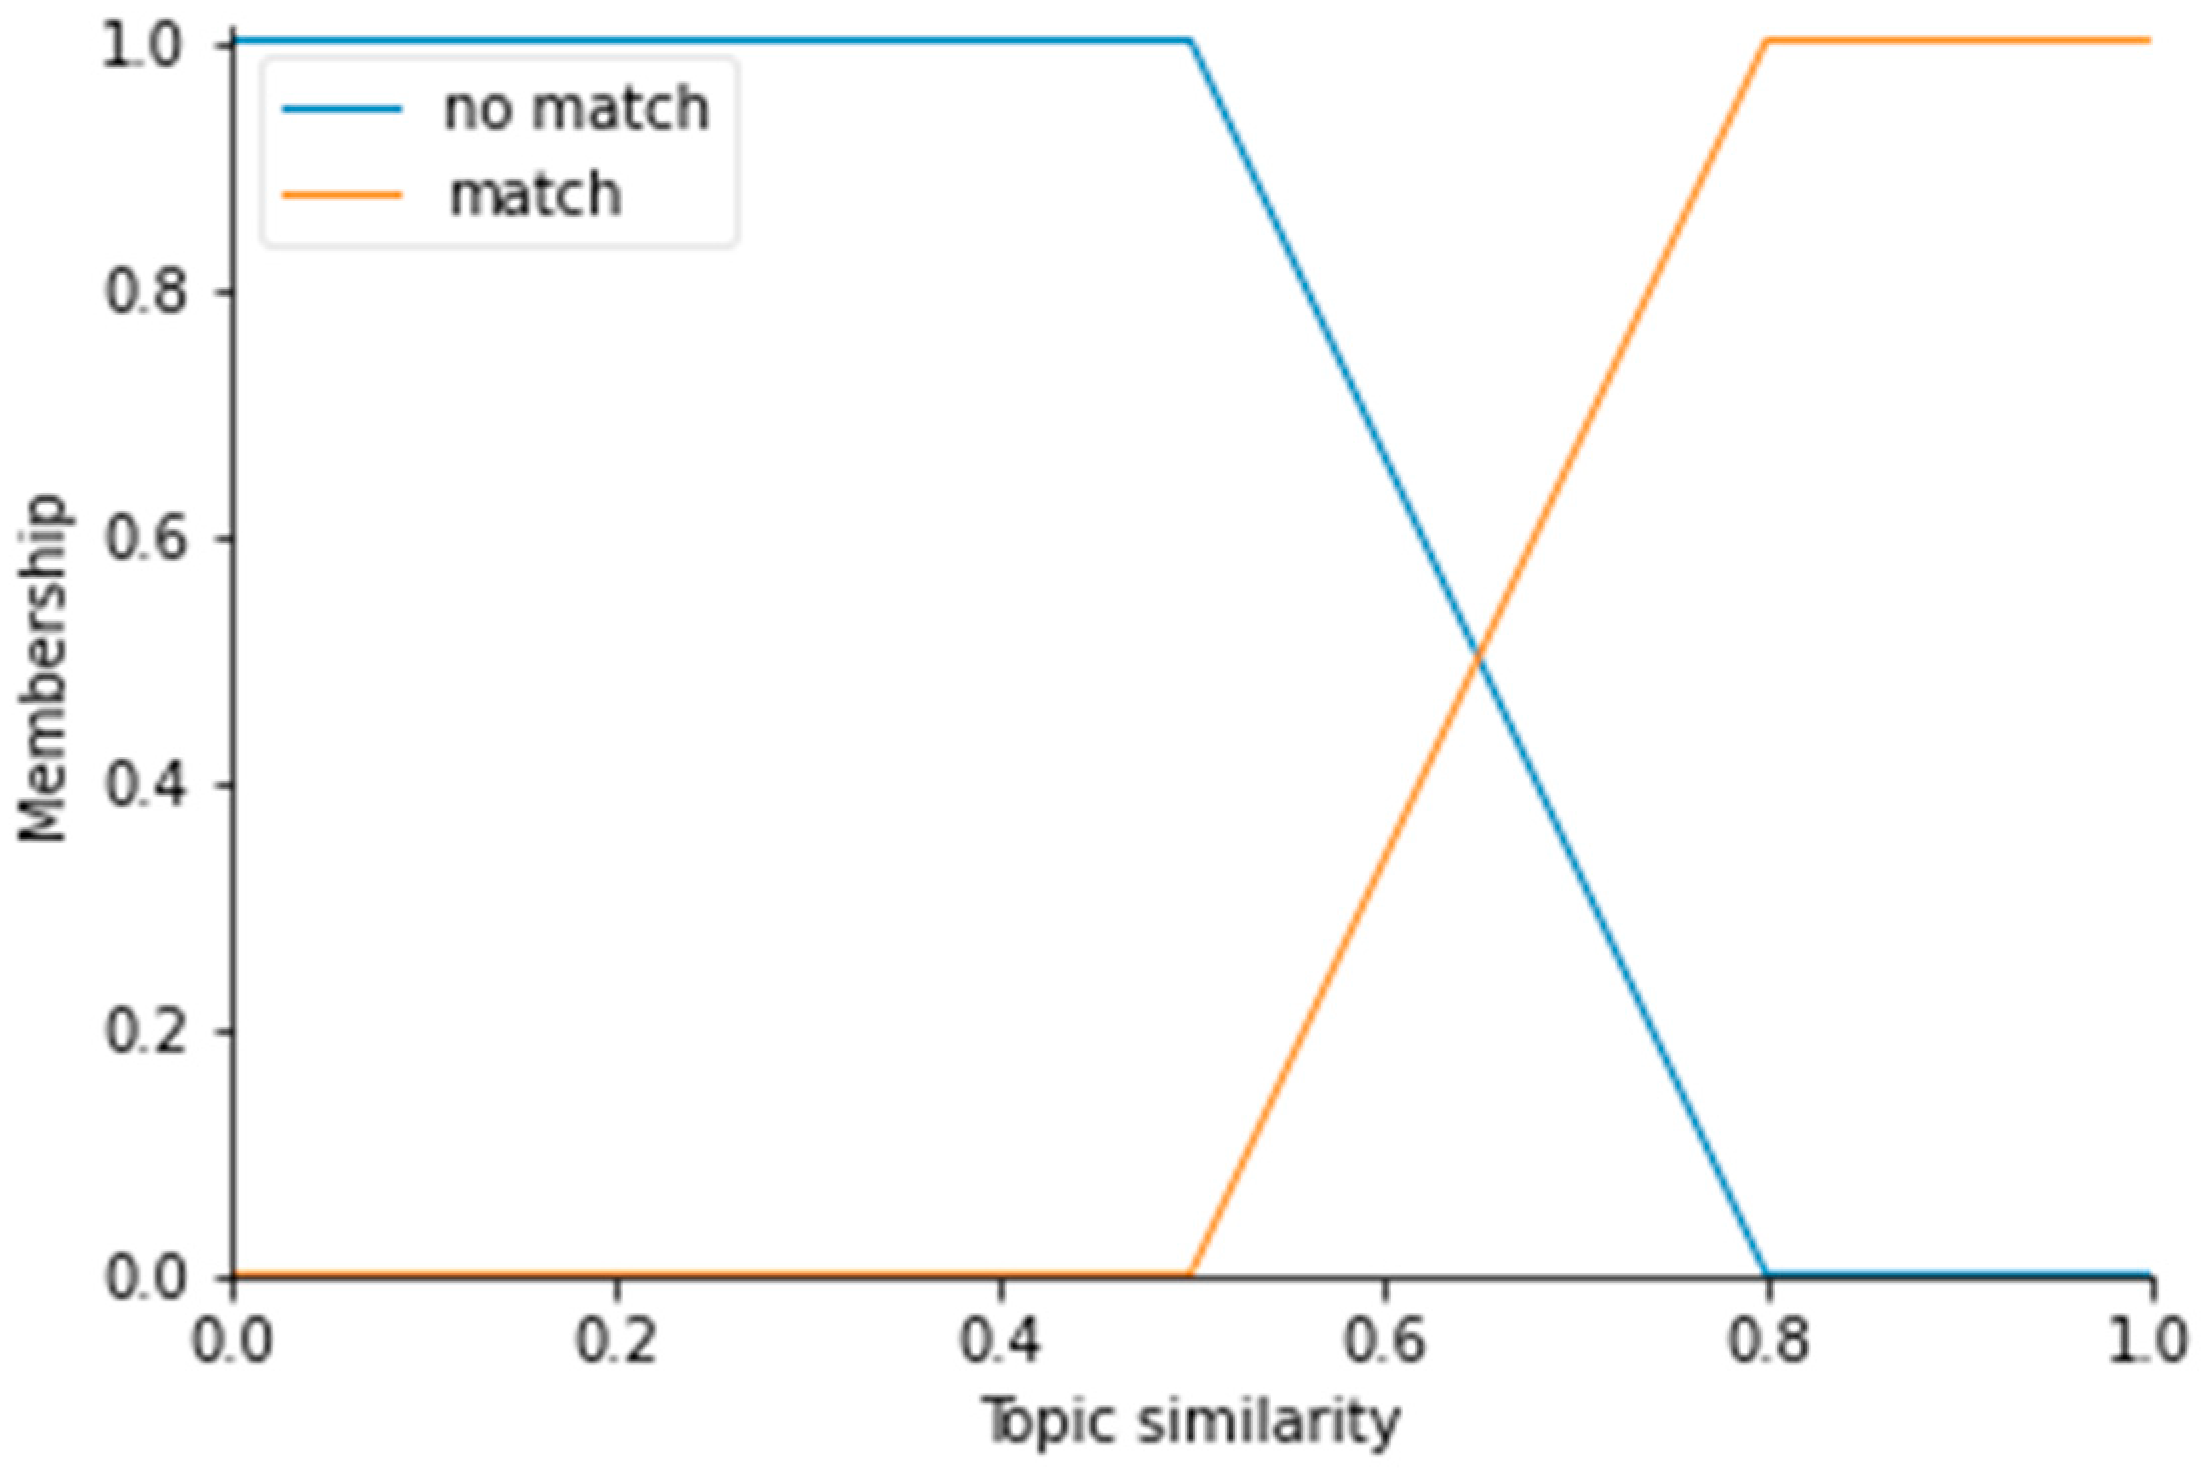
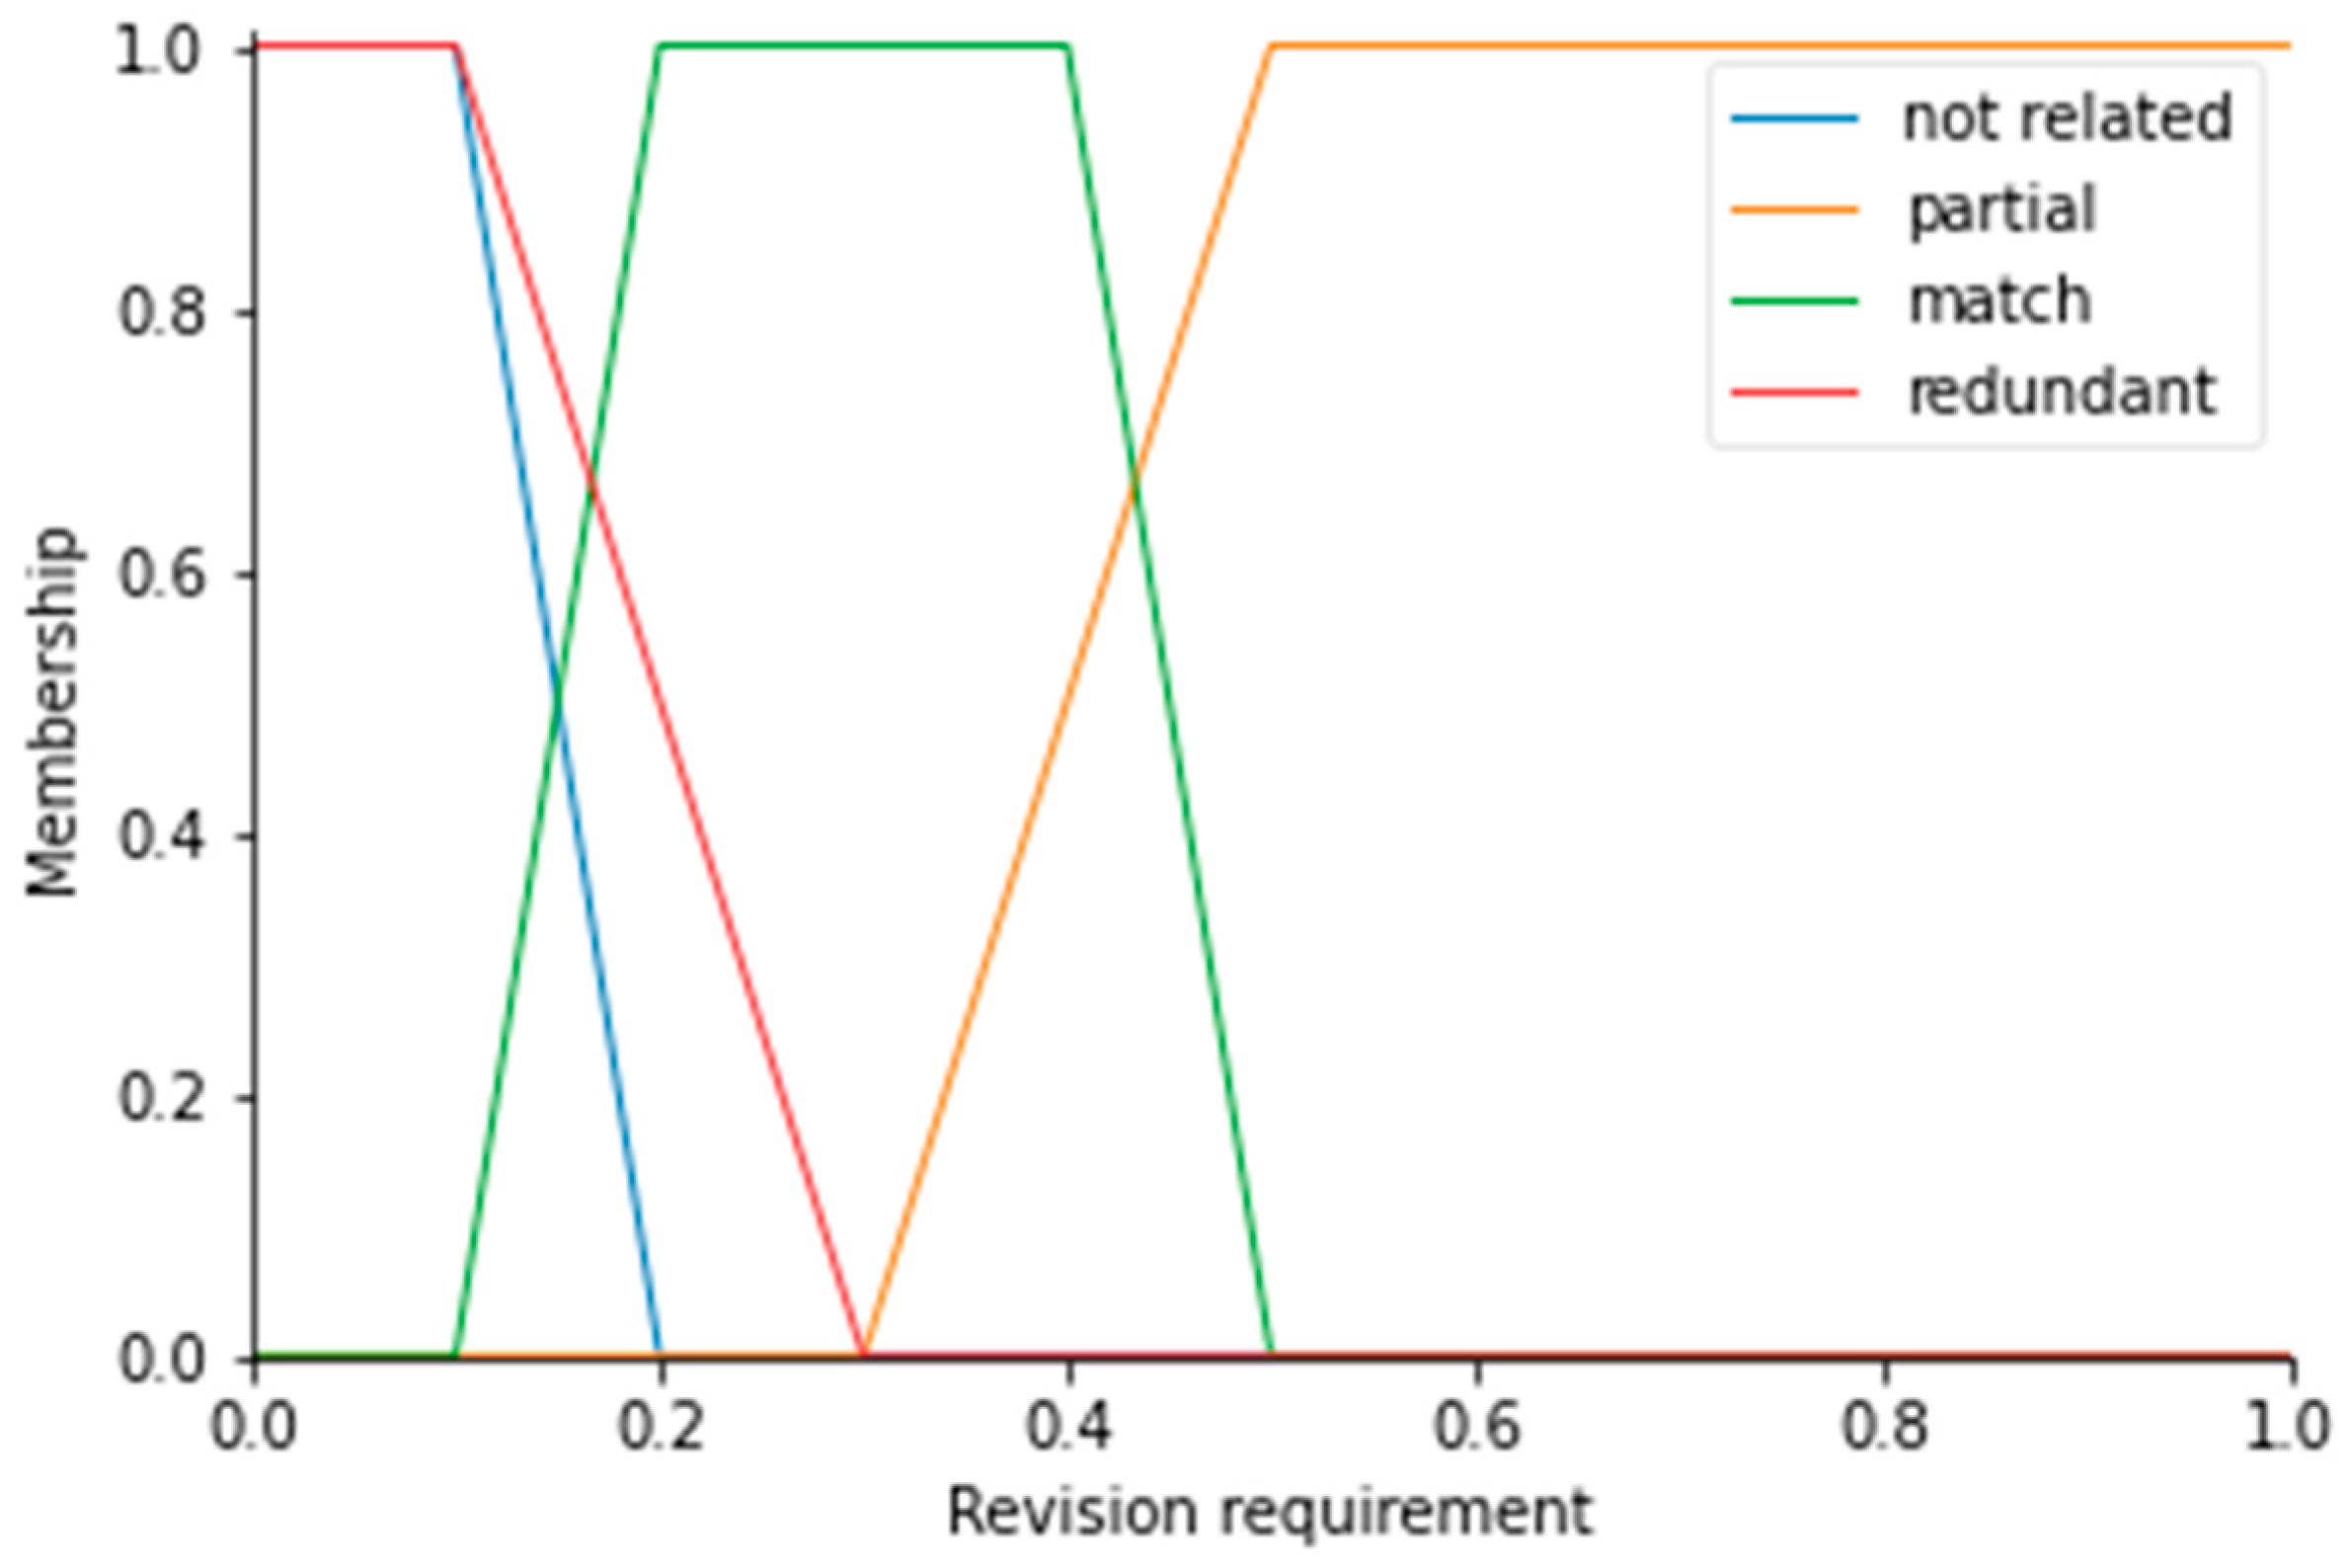
Fuzzy logic is useful when discrete rules are not easy to express, and ranges between different categories might vary. In the case of competency mapping, one discrete threshold for competency level and topic similarity could cause issues and inconsistency between similar situations. Therefore, after experimenting with Bloom taxonomy level difference and text similarity metrics, experts defined fuzzy, which was applied for fuzzification of those two metrics. The sets for input data are presented in Figure 3 and Figure 4. According to the text similarity method (which involves embedding the noun phrases within one sentence utilizing SentenceTransformer “all-MiniLM-L6-v2“ model and applying a cosine search to measure the similarity between two embedded datasets), a similarity below 50% was considered insufficient to estimate the topic matching. By contrast, an 80% similarity was identified as adequate for topic matching. The range between those two ranges is used for the transition between the sets. The linear transition was used to build trapezoid member functions. Those values were estimated by analyzing a separate dataset, containing a list of topics the computer science study programs should cover (defined by governmental institutions). The dataset for fuzzy function definitions was not the same as the validation data but is partly related since the examples for the validation of the model are mostly from computer science study programs.
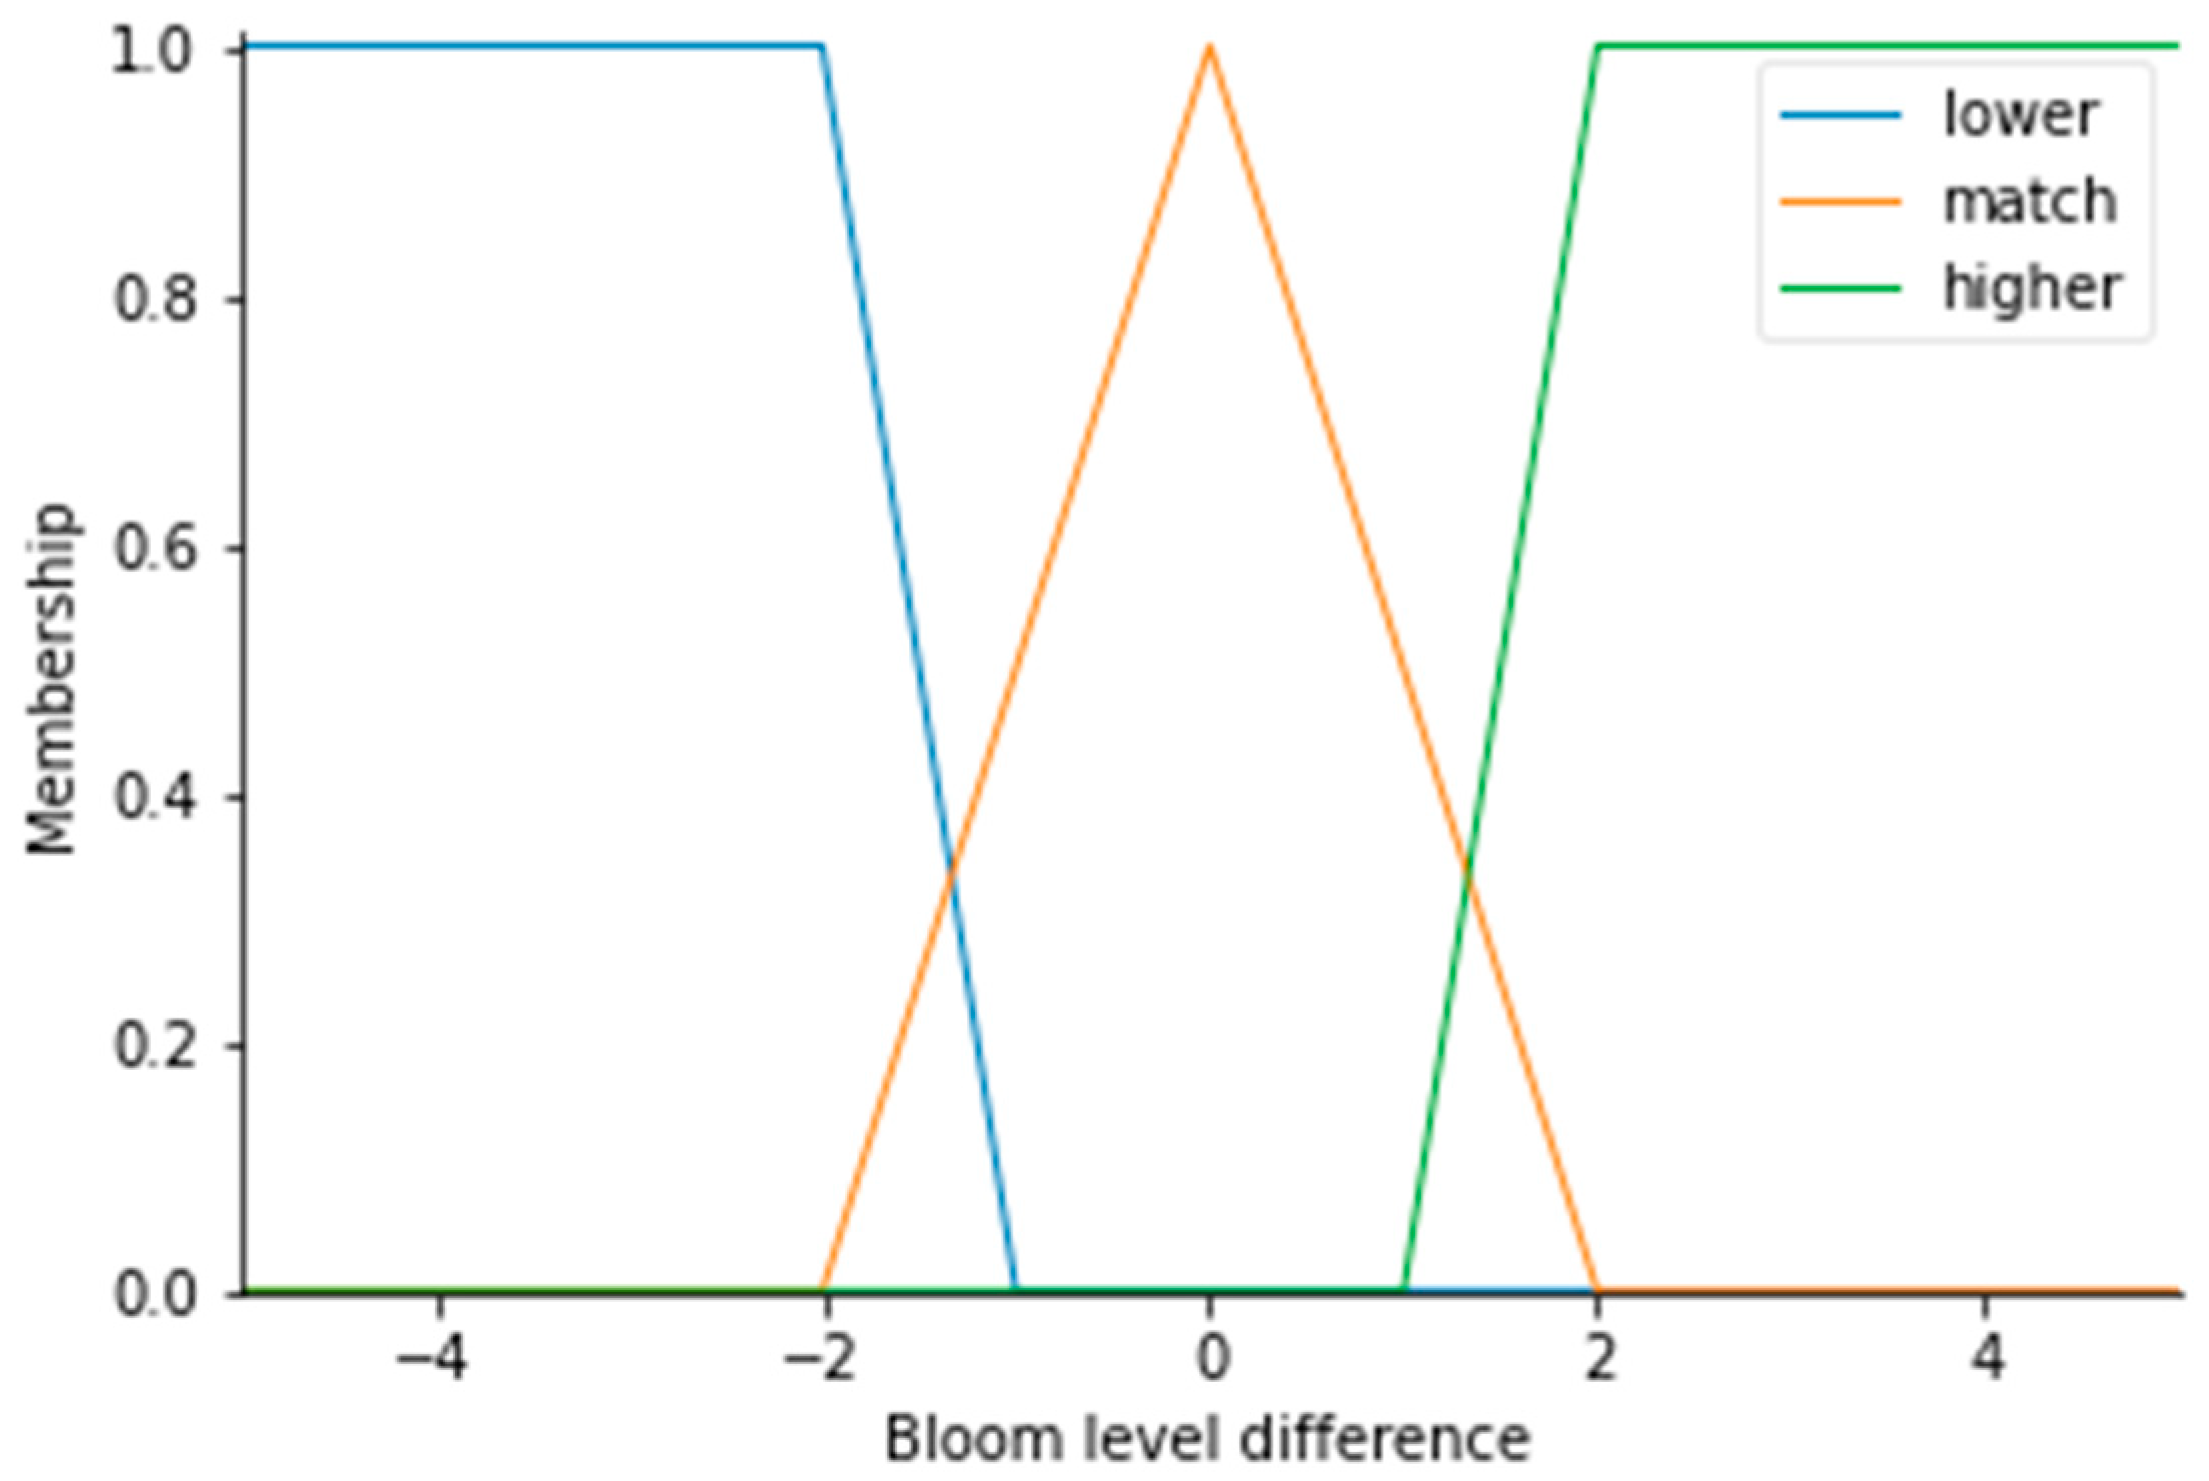
Meanwhile, the Bloom taxonomy verb level difference should be equal to 0 if it is matching, but a variation of 2 levels below and above is possible. Therefore, the fuzzy sets, expressed in Figure 4, were used to define the ranges for three possible sets. Lower and higher competency levels are expressed as trapezoid member functions while matching competency levels are presented as triangle member functions.
The fuzzy variable values can be estimated using Bloom’s taxonomy verb level difference, topic similarity, and fuzzy sets. To get the output, six fuzzy rules were used to define all possible combinations of inputs and present the associated output value. The fuzzy rules and their rationality are presented in Table 1.
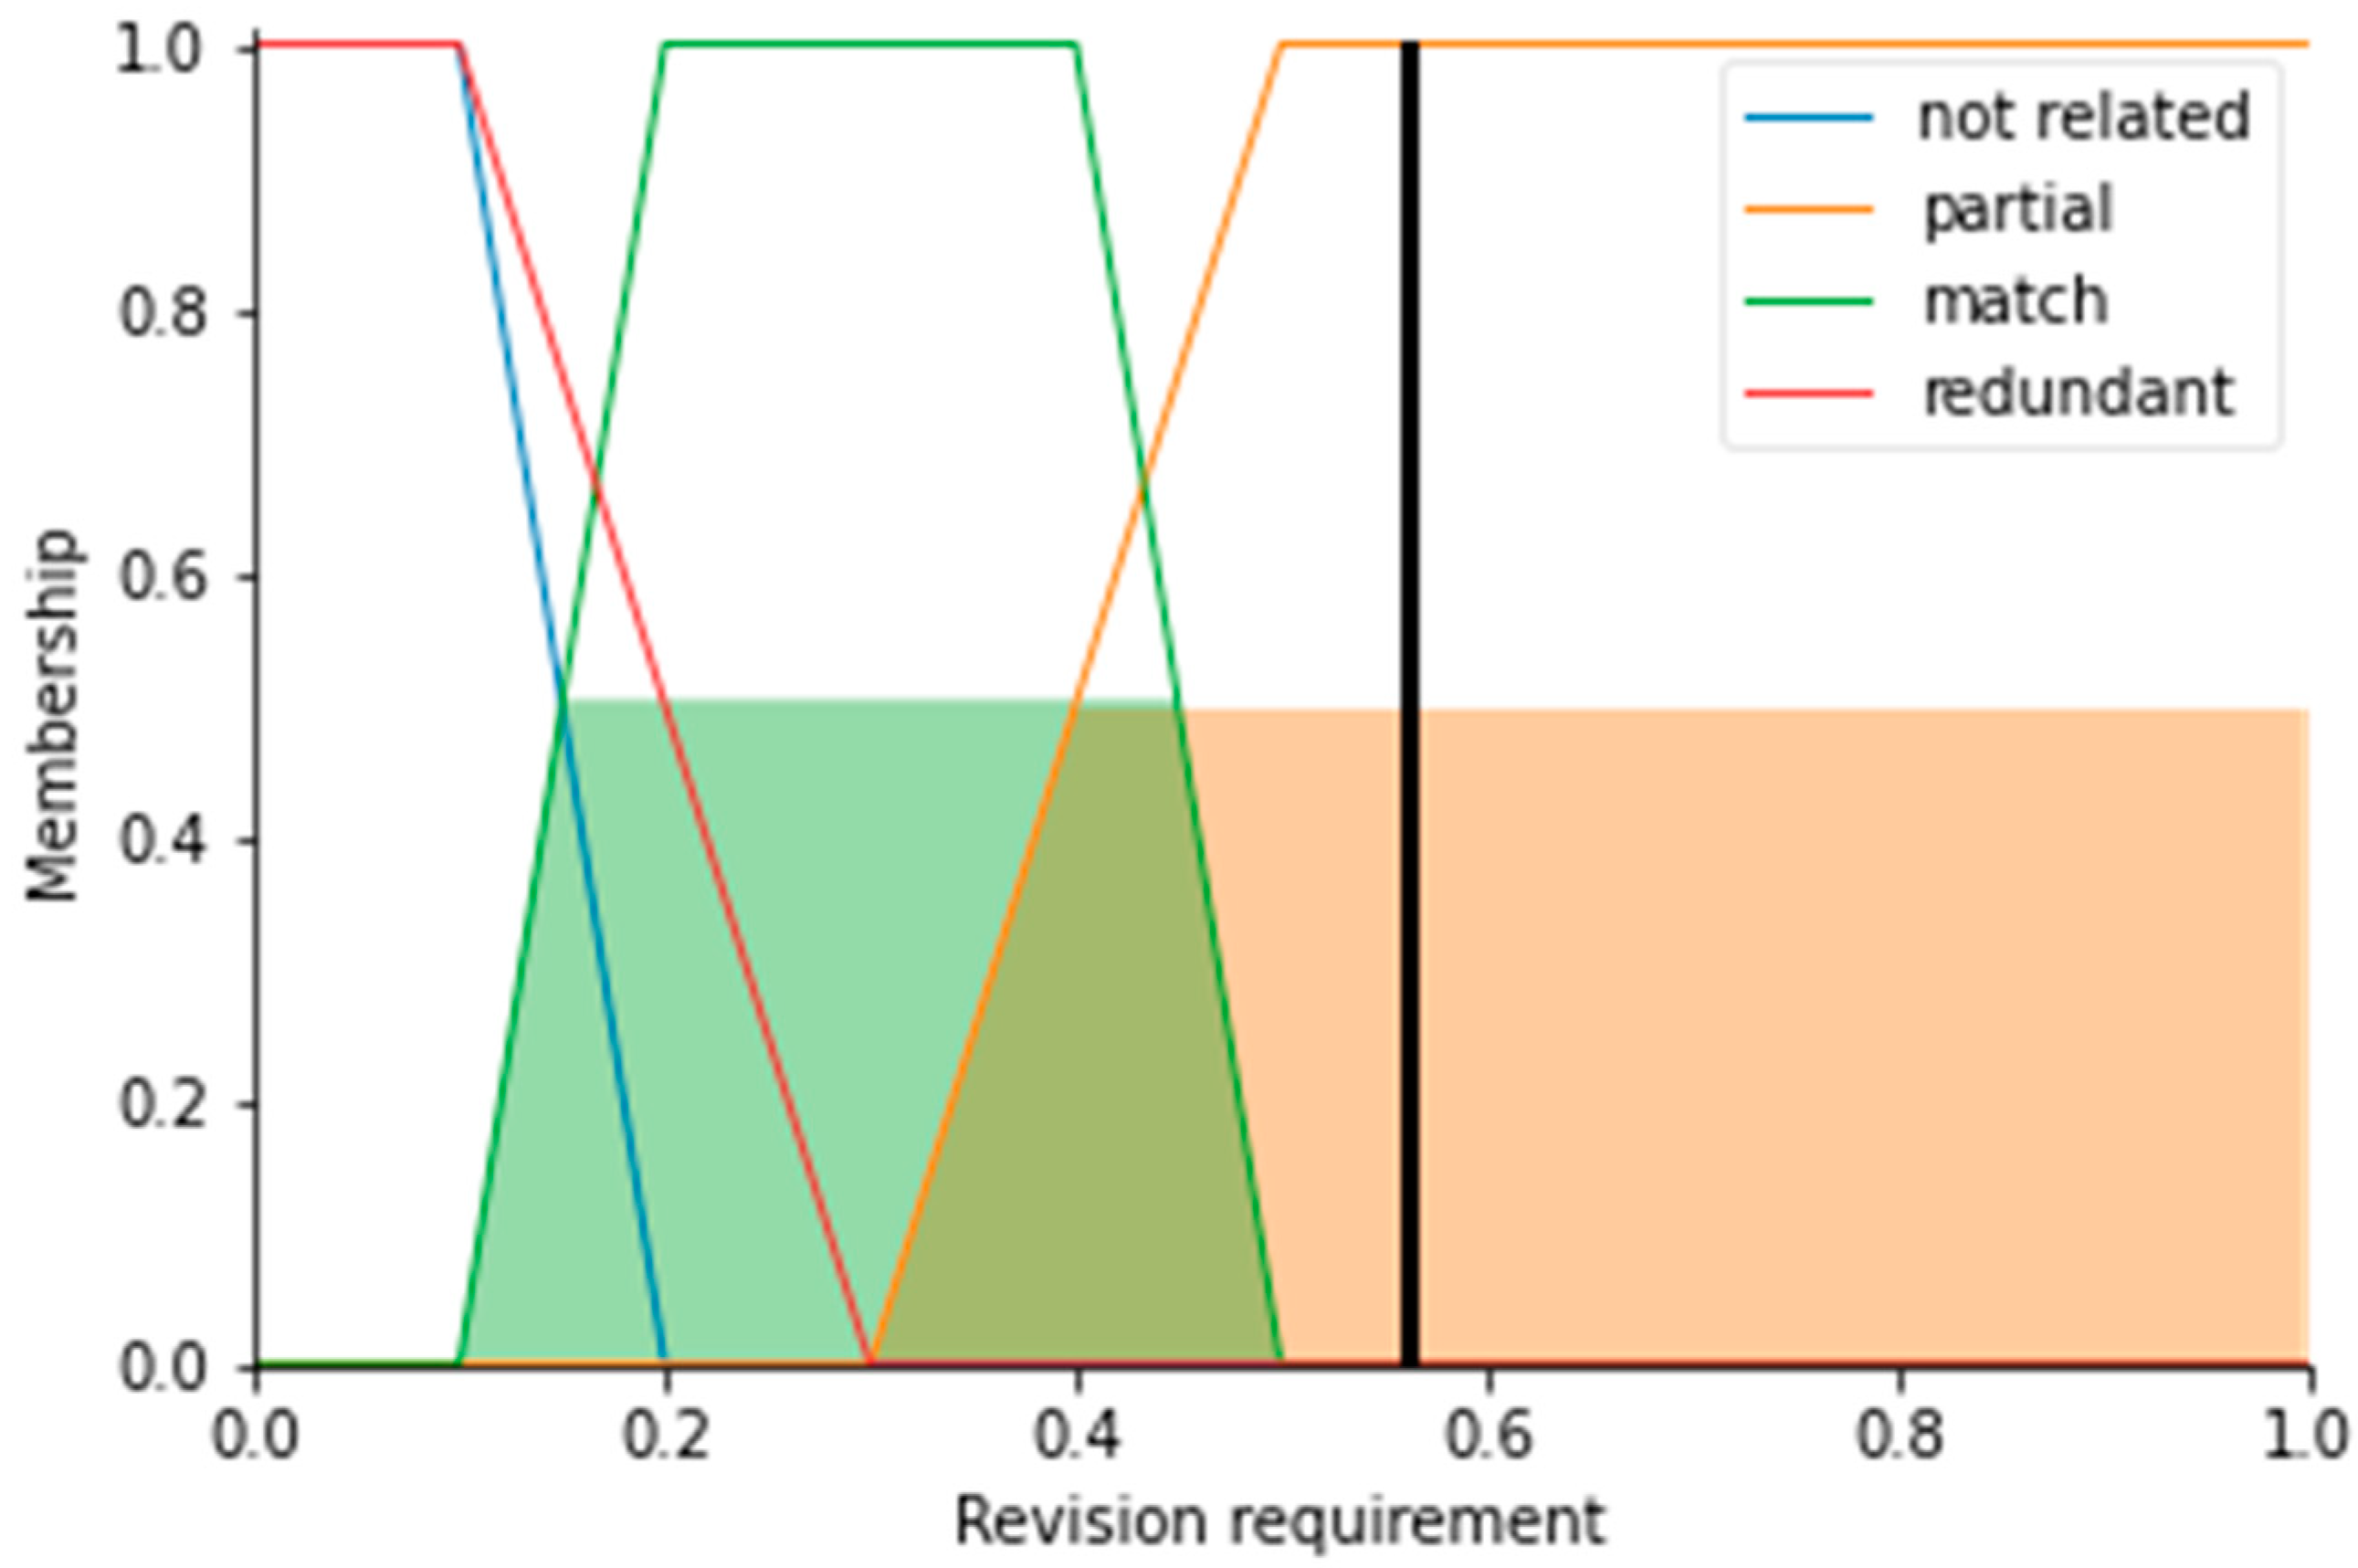
Accurate mapping of study program/course competencies to students’ competencies can vary. In e-learning systems used for self-study, the accuracy of the mapping may be less critical than the student’s behavior, which may reveal missing competencies and enable the student to demonstrate mastery of unmapped competencies. Meanwhile, for formal education, more accurate mapping might be required, to assure the needed competencies are already achieved. Therefore, for defuzzification, fuzzy output classes are expressed as fuzzy sets, reflecting the need for revision priority (see Figure 5).
The received metric (revision requirement) defines a score, illustrating the need for manual revision. Taking into account the need for mapping accuracy, the metric can be ignored, or it can be used to order the automated mapping results for manual revision. Mapping results of partial matches are given the highest priority. The level of matching should be manually determined. The second factor in revision is matching cases. Those are used to make sure some inaccuracies are not present, whereas redundant and not related competencies have the lowest need for manual revision. In the defuzzification phase, all the rules and centroid methods are applied to determine a crisp value. In comparison to other methods (smallest of maximum, mean of maximum, largest of maximum, bisector of area), the Center of Gravity method was selected because it affected the crisp value and proportion of the sets as well.
For example, if we have two competencies, “Use Boolean algebra knowledge and circuit design skills” and “Understand the basics of logical operators”, the Bloom level difference is 0, as “use” and “understand” belong to the same level of Bloom’s taxonomy. Therefore, the Bloom level value falls into the “match” set with a score of 1.0. Meanwhile the similarity score of the topics “boolean algebra knowledge and circuit design skills” and “basics of logical operators” is 0.651. Based on the similarity value, it gains the fuzzy values of 0.504 for “match” and 0.496 for “no match”. Based on the fuzzy logic, the “match” class should be assigned to the mapping of those two competencies. However, it is very close to a “partial” match, as the topic match was not equal to 100%. Fuzzy logic brings more details to the final outcome as opposed to discrete division into classes. At the same time, the revision requirements score for this mapping can be estimated and, in this case, is equal to 0.561 as the center of the fuzzy sets “match” and “partial” is distributed close to this value (black line in Figure 6).

4. Application of the Proposed Competency Mapping Method

4.1. Validation Methodology

To test the performance of the proposed automated competency mapping solution, competency sets from different courses were analyzed. Five sets of competencies belonging to different courses were assumed to be e-learning competencies. Each of these cases was tested with at least one other course and its competencies. On the Internet, we searched for courses for automated mapping. The criteria were: a similar title to the course; a list of course competencies provided in text format. When analyzing courses and their competencies, we included cases where students came from another institution with certificates for passed courses and links to course descriptions with lists of competencies.
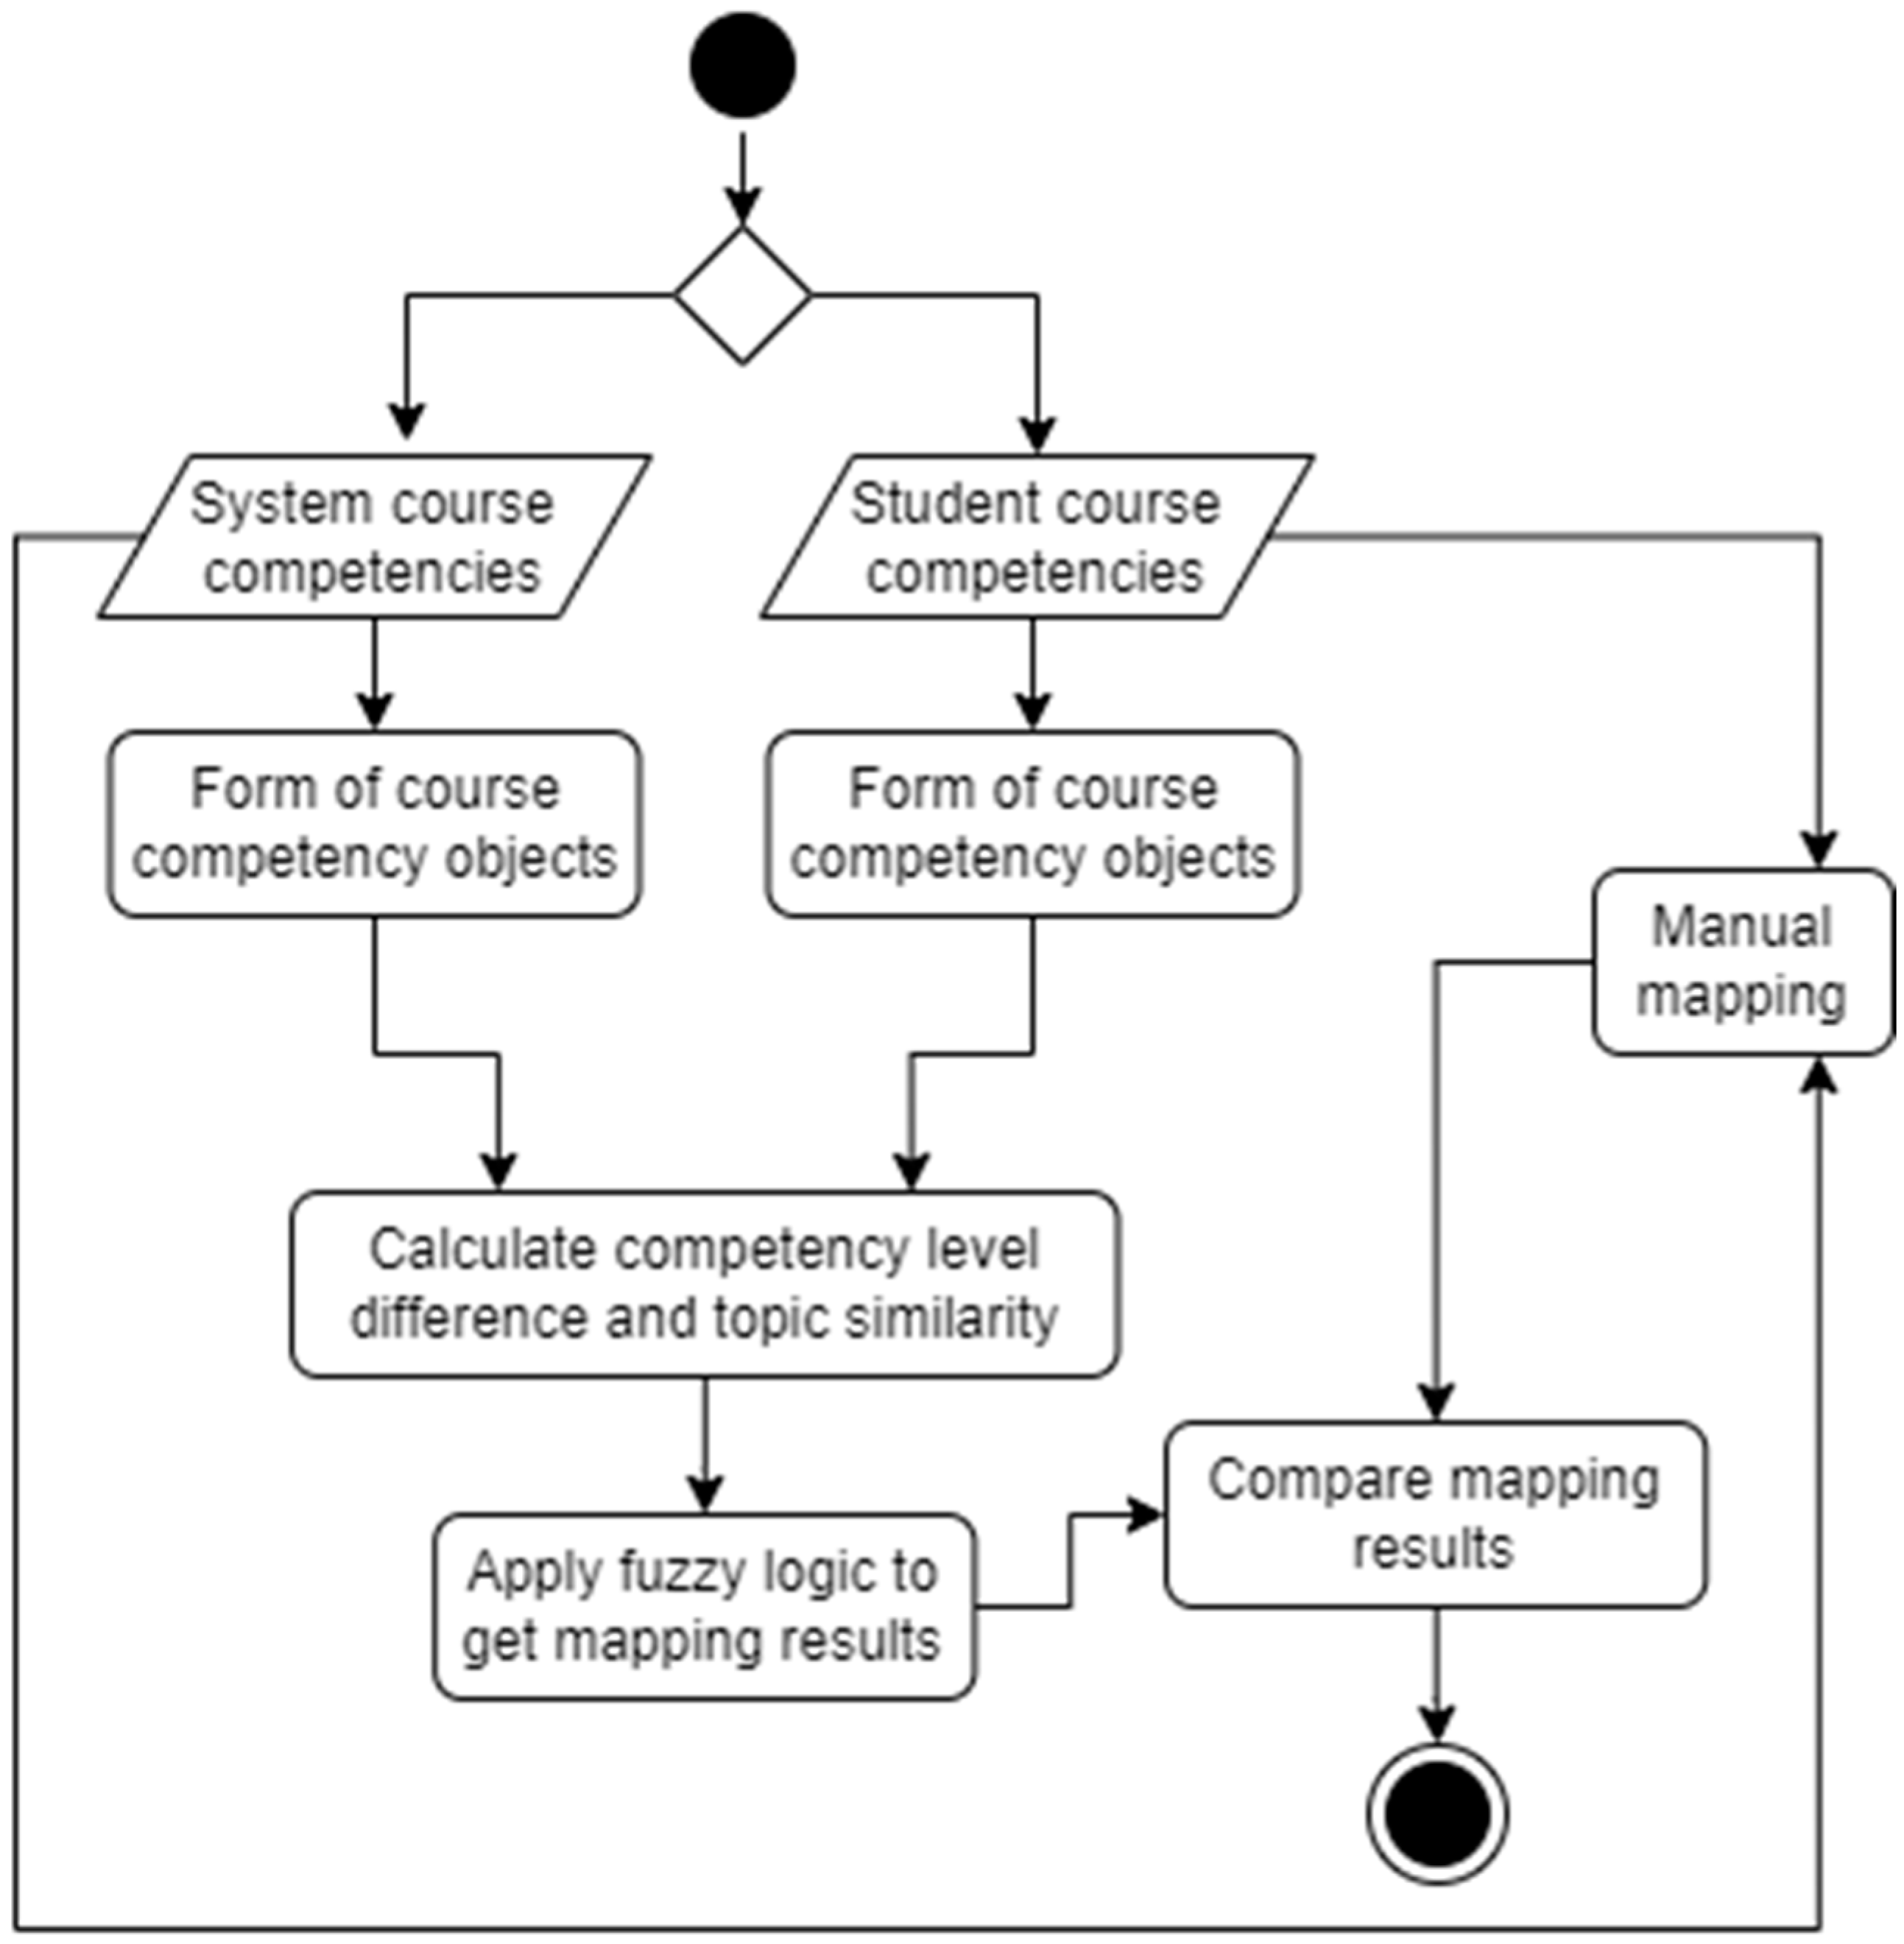
In the analysis, our competencies are named system course competencies, while the competencies from the Internet are called student course competencies. Those two lists were taken as input for the analysis. The principal schema of the analysis is presented in Figure 7.
The competency lists were transferred to each course owner to do the mapping between those competencies. Each competency of system course competency had to be evaluated against each competency of student course competency. The professor had to define competency similarity by selecting one of four possible values:
  • Redundant—the student course competency is higher than the study course competency.
  • Match—the student course competency is the same as study course competency.
  • Partial—the student course competency is not fully equal to the study course competency but is similar.
  • Not related—the student course competency is not related to the study course competency or it is not possible to tell the similarity level from the competency description.
Separately from the professors’ manual mapping, researchers created a tool for automated mapping of the same four classes. All competencies were transformed into competency objects, containing Bloom taxonomy levels (summarized into the maximum achieved level number) and text defining the topic of the competency (composed by concatenating all identified noun phrases of the competency sentence). The formed competency objects were compared with each other to get Bloom’s taxonomy level differences and similarity scores between the topics. Based on those two numeric values, we were able to estimate the mapping class between two competencies within the system and student courses. The results of automated and manual mapping were compared to determine the accuracy and other metrics of the automated mapping.
To compare the results, two comparison matrices were constructed. One was generated to estimate the match between manual and automated mapping, using four classes. While another one was generated to reflect only two classes. “Redundant” and “Match” were grouped into one class to represent the coverage of needed competencies, while “Partial” and “Not related” were grouped into another category, to indicate that the competency cannot be evaluated as sufficient to cover needed competencies. Those matrixes were used to estimate the accuracy of the automated mapping both in the case of the four and two classes.
In addition to each of the system course competencies, the coverage of students’ course competencies was estimated. It was marked as covered if at least one student course competency was mapped as “match” or “redundant”. This applies to both manual as well as automated mapping. Consequently, a second metric was estimated—coverage accuracy.

4.2. Results of the Automated Competency Mapping

In total, seven cases were analyzed as two system courses were compared to two, not one, student course. The competencies used for the comparison of automated competency mapping results are presented in Appendix A, Table A1. The number of competencies in each course varies from 3 to 13. This indicates differences that are affected not only by institution requirements or practices but also by the course itself (audience, duration, level, etc.).
The summary of the validation experiments with the seven used cases is presented in Table 2. The table shows the number of competencies in the system and the student course. The number of each class for manual and automated mapping between system and student courses is listed. The coverage of the system course competencies by student course competencies in the case of manual and automatic mapping is calculated. In summary, accuracy is measured using covered competencies in the manual and automated mapping (competency coverage), four possible categories for competency mapping (four-class), and grouped classes to show competency coverage or not (two-class).
The results of all three accuracy scores from automated competency mapping are visualized in 
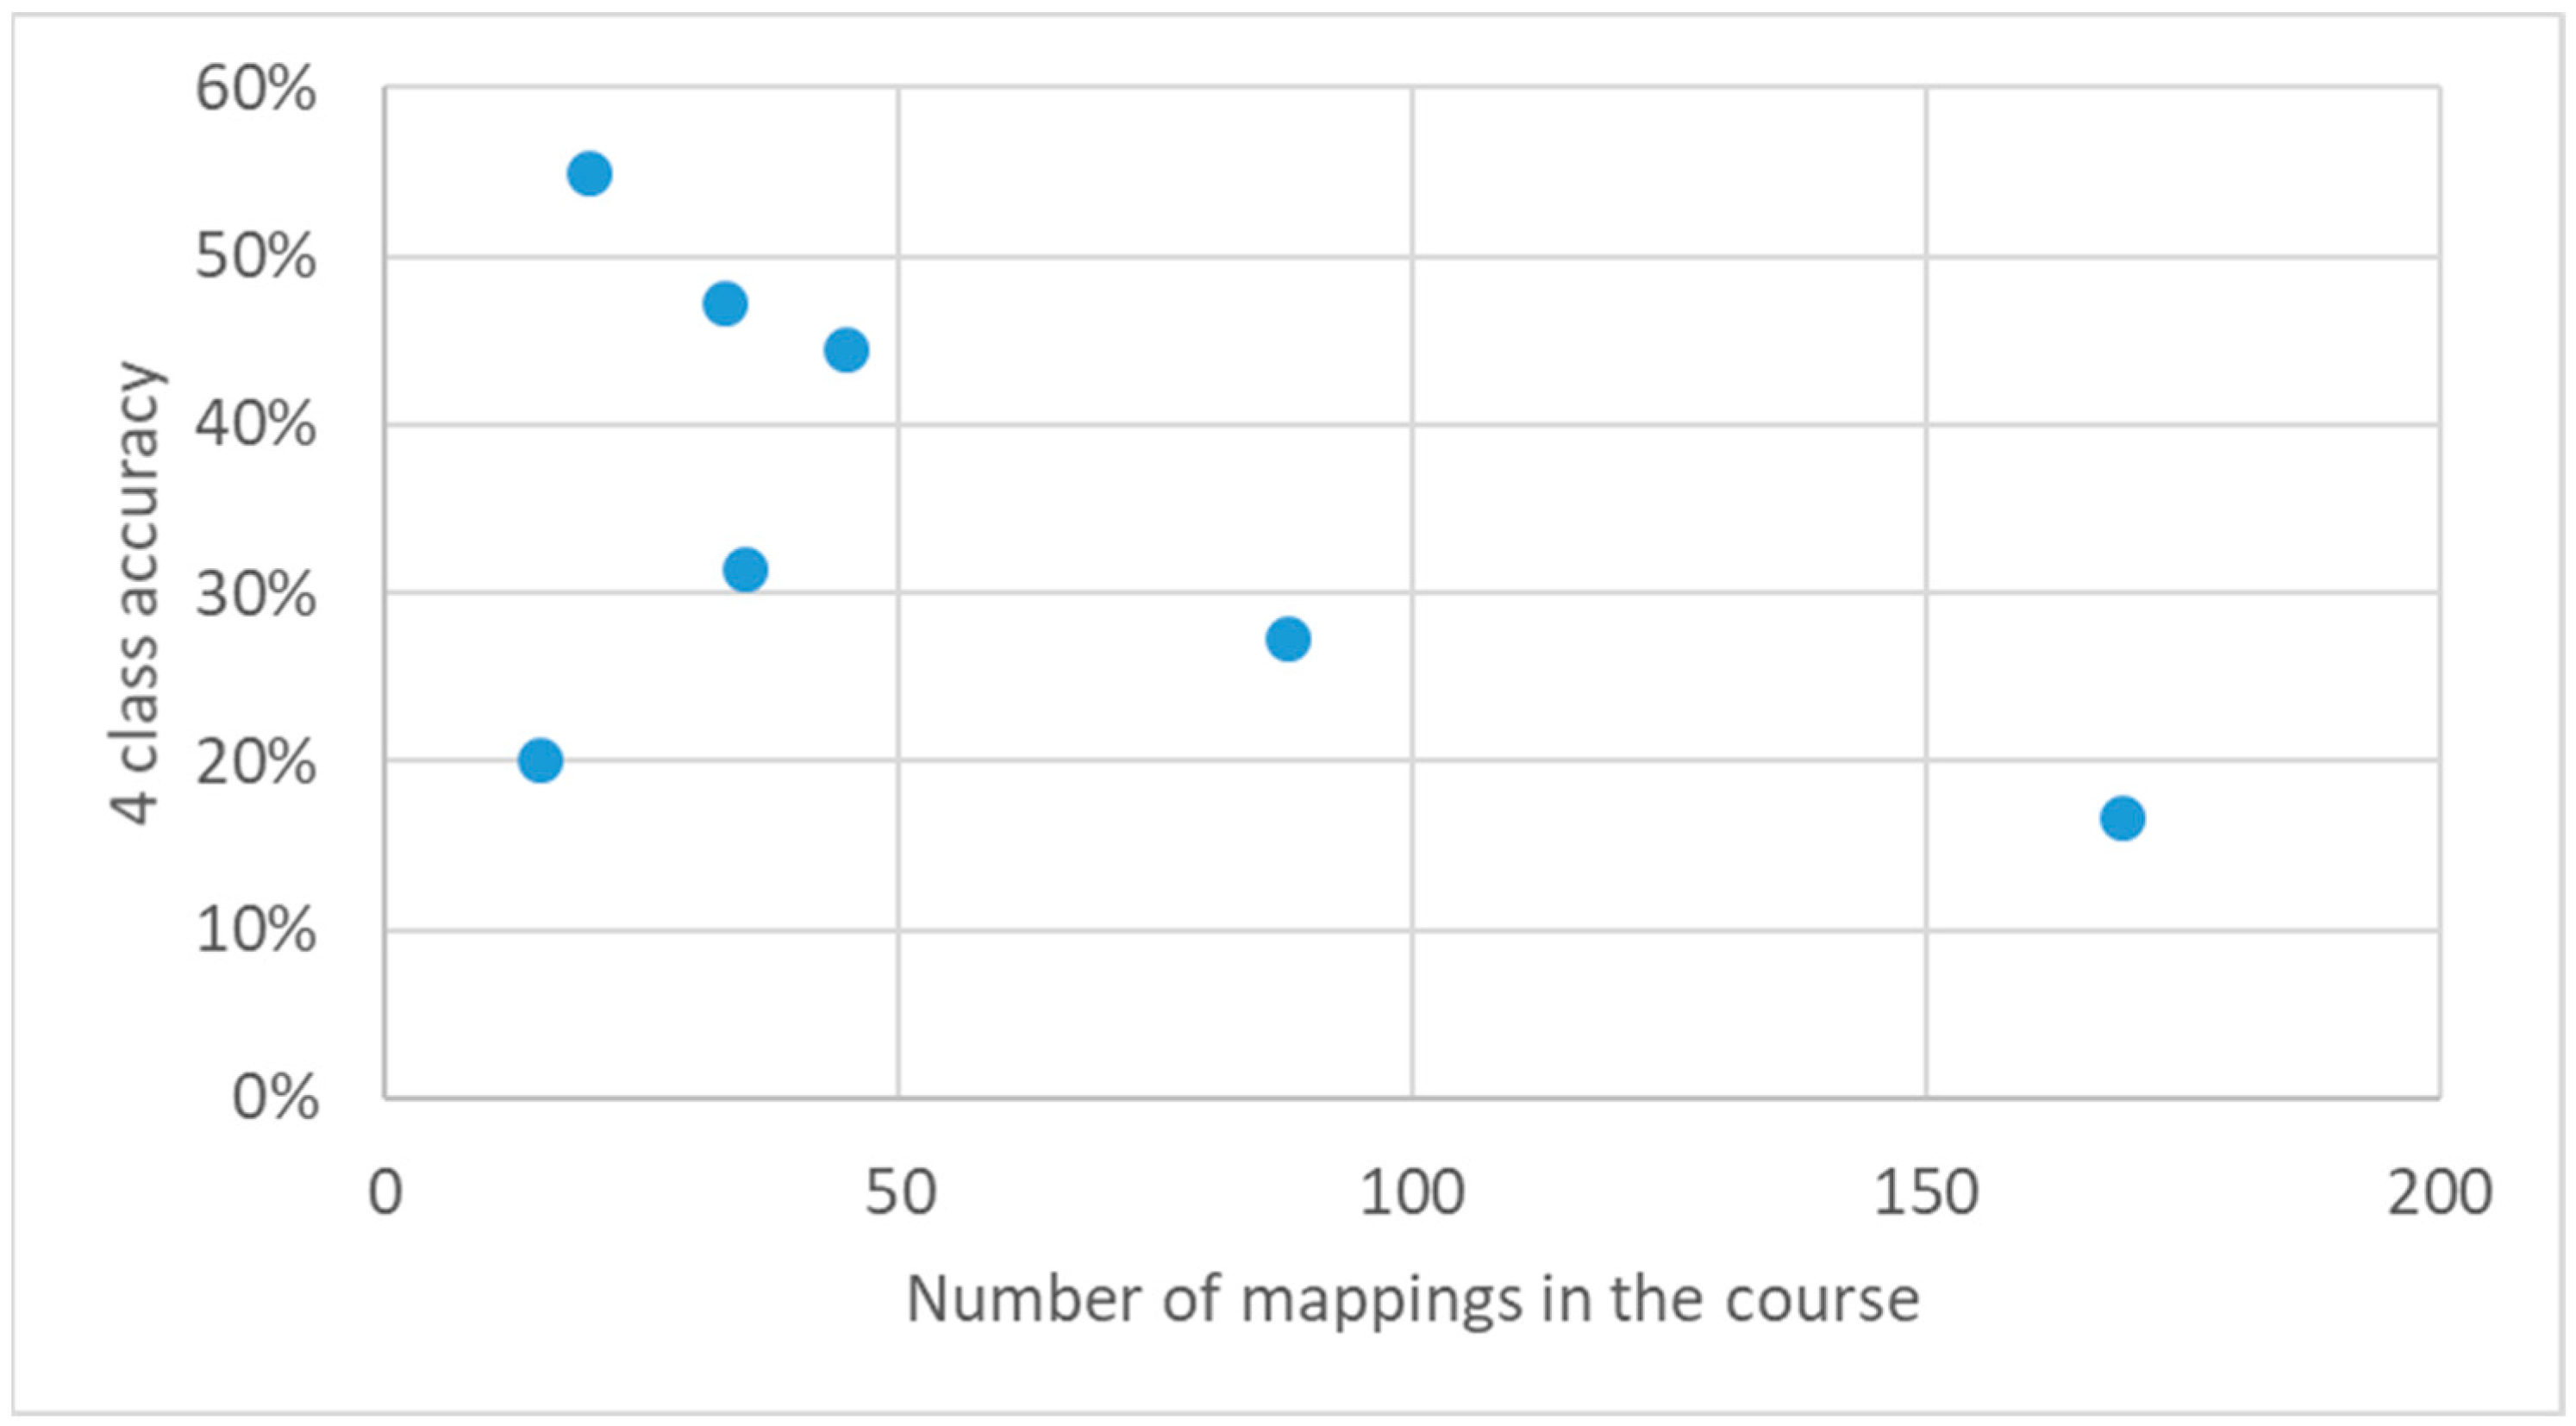
Figure 8. The four-class accuracy does not exceed 60% and on average is 35% (standard deviation is 0.15). As there are four classes, the achieved score is higher than the random distribution of the classes (~25% accuracy), however, the difference is not statistically significant. Additionally, this does not depend on the number of mappings between the system and student course competencies (see Figure 9).
Analysis of two classes (accepted or not accepted student course competency for system course competency) compares significantly better to random results. The average accuracy is 77% with a standard deviation of 0.07. It never got below 70% and reached up to 90%. This shows statistically significant results when compared to random two-class prediction.
Similar accuracy is achieved for system course competency coverage. On average, 64% (standard deviation 0.24) of the system course competencies coverage by the student course competencies were estimated correctly. This is not a statistically significant difference in comparison to the random results. Accordingly, we can conclude that automated competency mapping is better suited to support manual mapping by agreeing on a possible match between the system and student course competencies. However, it is not fully automated as it requires human revision.
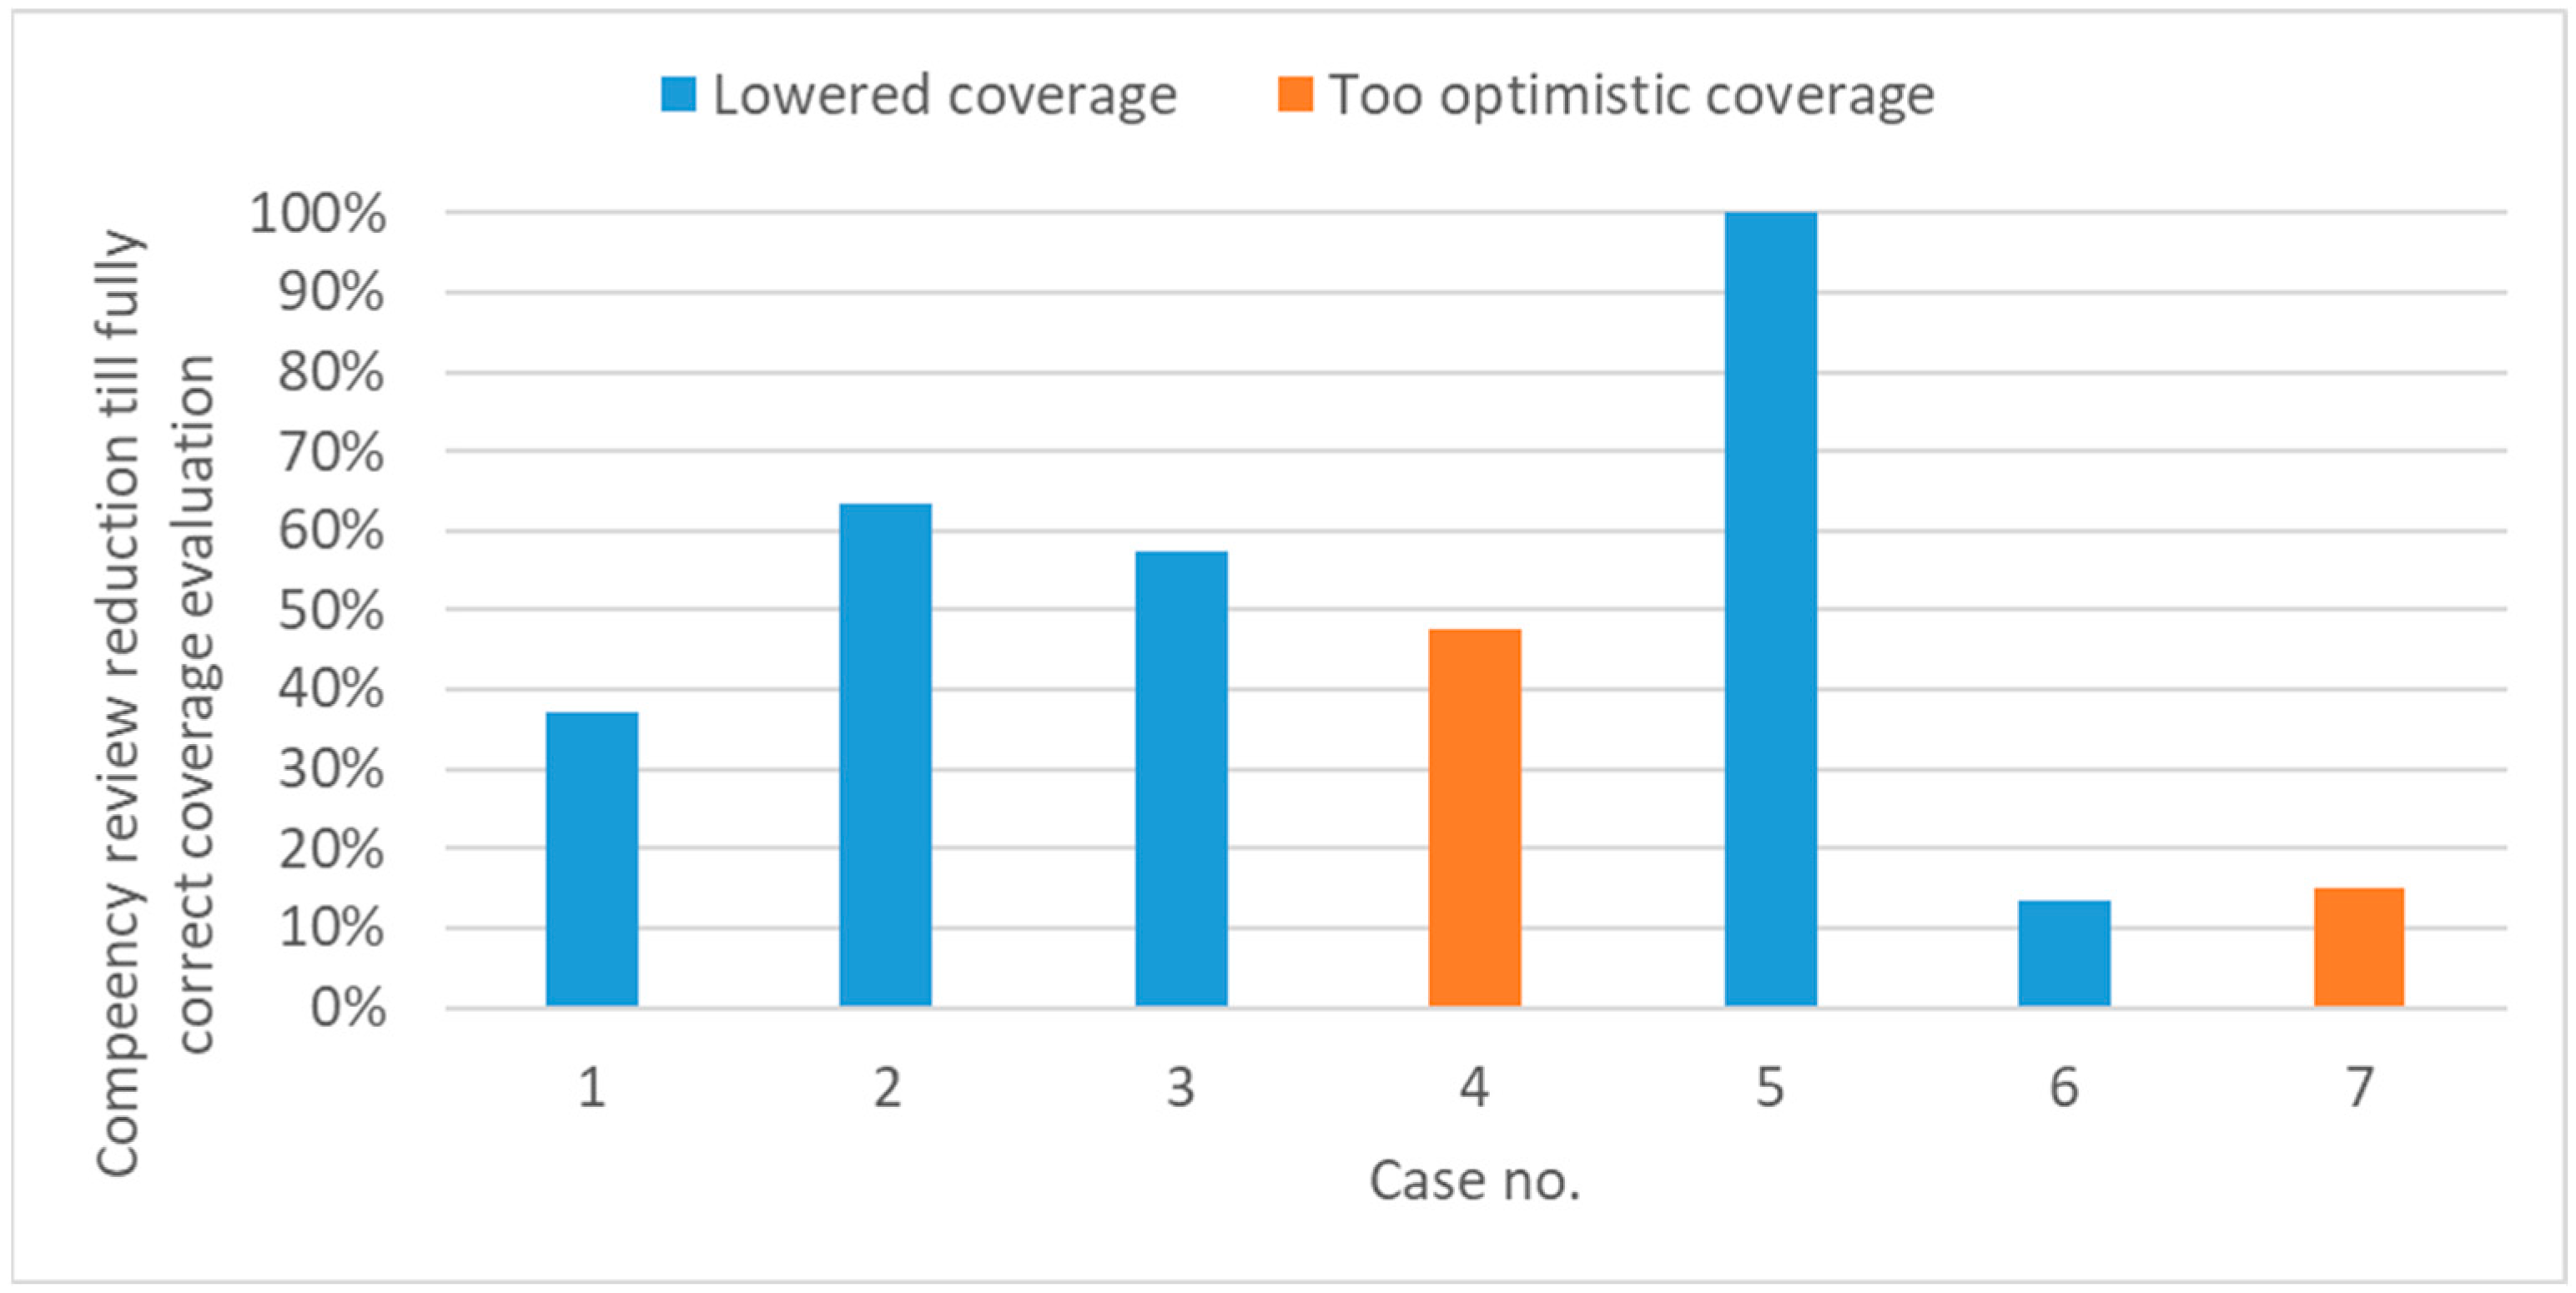
Upon reviewing the mapping based on the generated review priority score, the average reduction in review needs is 48% (standard deviation 0.30). The review reduction percentage varies significantly in the analyzed cases and has no statistically significant difference comparing the underestimated and over-estimated system course competency coverage (see Figure 10).

5. Discussion, Conclusions, and Future Work

Based on the review of related works, competency mapping is a topic that deserves attention from researchers. Attention is now paid to the evaluation of the student, employee, and market-need competencies. Research into written competency mapping is just getting underway. A majority of the results in this area are focused only on some documents or only on competency levels rather than a full mapping between different competency documents. This can be explained by the achieved results—existing written competency mapping solutions do not achieve high levels of accuracy (more than 70%). Therefore, manual mapping is still relevant.
The proposed solution analyzes text-written competencies to extract the competency level and topic. Competency levels are extracted using discrete output—Bloom taxonomy levels. Meanwhile, the competency topics could not be categorized into discrete classes. The limitation is the absence of an overall competency map. Therefore, topic extraction from the text defines the topic. For competency mapping, text comparison methods are used. This software compares a whole phrase to a language corpus to identify related terms, which allows it to identify similarities in content, rather than words.
While comparing the manually and automatically executed mapping between analyzed competencies, a lack of accuracy was noticed for the four class mapping. The proposed solution is not capable of defining the coverage level of the compared competencies. However, the two class mapping, indicating whether the student is competent enough to cover system competency, shows a relatively high 77% accuracy (standard deviation 0.07). The result is promising, as it allows for a reduction in manual mapping efforts. With this accuracy score, manual mapping efforts can be reduced almost by half.
To increase accuracy, the research could be extended to examine the effect of different text processing and comparison methods. For example, the impact of stop word elimination, standard form or stemming usage, and application of different text similarity methods could be analyzed to increase mapping accuracy.

Author Contributions

Conceptualization, A.M., S.R. and P.S.; methodology, S.R.; software, A.M. and S.R.; validation, A.M., S.R., J.N., P.S. and A.Č.; formal analysis, S.R. and A.Č.; investigation, A.M. and S.R.; resources, S.R.; data curation, S.R.; writing—original draft preparation, A.M. and S.R.; writing—review and editing, J.N., P.S. and A.Č.; visualization, S.R.; supervision, S.R. All authors have read and agreed to the published version of the manuscript.

Funding

This research received no external funding.

Institutional Review Board Statement

Not applicable.

Informed Consent Statement

Not applicable.

Data Availability Statement

The data can be requested from the corresponding author.

Conflicts of Interest

The authors declare no conflict of interest.

Appendix A

Data used for the proposed model validation and summary of the obtained results.
Table A1. List of cases analyzed to map study course and student course competencies.
Case NumberStudy Course CompetenciesStudent Course Competencies
1.
  • Understand the application principles of arithmetical operations for solving math tasks.
  • Know the principles of addition and subtraction.
  • Know the order of arithmetic operations.
  • Know the principles of multiplication and division.
  • Distinguish decimal numbers by understanding their values.
  • Use English and local systems to count, read, write, and compare whole numbers up to 200.
  • Understanding base-ten by identifying the place value of numbers up to hundreds.
  • Demonstrate an understanding of the basic operations (+, −, ×, ÷), and how they relate to each other.
  • Represent whole numbers and operations in a variety of ways using physical models, diagrams, and number expressions.
  • Use the basic operations to add and subtract 2- and 3-digit numbers.
  • Use the basic operations to multiply and divide 1-, 2-, and 3-digit numbers by a single digit number.
  • Use a variety of strategies including the understanding of number and operations to solve problems and explain the reasoning used to reach the solution.
2.
  • Select the suitable data type for the number and string variables.
  • Assign a data type for the numeric variable.
  • Assign integer data type to numbers.
  • Assign float type to numbers.
  • Assign double type for numbers.
  • Assign string type to a variable.
  • Form a different output to the screen.
  • Write text symbol.
  • Write special symbol.
  • Write value of a variable.
  • Apply arithmetic and assignment operators.
  • Apply arithmetic operators.
  • Apply the main assignment operators.
  • Demonstrate problem-solving skills by developing and implementing algorithms to solve problems.
  • Derive problem specifications from problem statements.
  • Develop algorithms using modular design principles to meet stated specifications.
  • Create code to provide a solution to problem statements ranging from simple to complex.
  • Test and debug programs and program modules to meet specifications and standards.
  • Create programs that contain clear and concise program documentation.
  • Implement programs that use data types and demonstrate an understanding of numbering systems.
  • Incorporate both basic and advanced control structures appropriately into algorithms.
  • Demonstrate an understanding of structure design by implementing programs with functions, including parameter passing and value returning.
  • Implement programs using classes, including strings and files.
  • Implement algorithms using one-dimensional and indexed data structures.
  • Demonstrate an understanding of array searching and sorting algorithms by desk-checking and/or modifying algorithm implementations.
  • Design and implement simple classes.
3.
  • Understand different color models.
  • Know the CMY color model.
  • Know the RGB color model.
  • Know the CMYK color model.
  • Convert colors from one color model to another.
  • Convert the color from RGB to the CMY model.
  • Convert the color from CMY to RGB model.
  • Convert the color from CMY to CMYK model.
  • Convert the color from CMYK to the CMY model.
  • Convert the color from RGB to the CMYK model.
  • Convert the color from CMYK to the RGB model.
  • Understand the basics of color theory.
  • Explain the ways in which color is used to create a sense of depth in a two-dimensional space.
  • Identify the ways in which the artist uses color to draw the viewer’s attention to points within the composition.
4.
  • Know the history of color usage, from print to digital.
  • Working with the color wheel.
  • Use color Formats and Tools: CMYK, RGB, Pantone, and beyond.
  • See through color: opaque, translucent, and transparent.
  • Creating color contrast.
  • Developing effective color palettes.
  • Managing color across applications.
  • Calibrate color with software and hardware tools.
5.
  • Understand the core concepts and mathematical foundations of computer graphics.
  • Know fundamental computer graphics algorithms and data structures.
  • Know an overview of different modeling approaches and methods.
  • Understand basic shading and texture mapping techniques.
  • Know light interaction with 3D scenes.
  • Understand the fundamentals of the modern GPU programming pipeline.
  • Understand essential mathematics in computer graphics.
  • Apply mathematics to graphics systems.
  • Understand common data structures to represent and manipulate geometry.
  • Understand common approaches to model light and materials.
  • Understand basic shading techniques.
  • Understand basic image-processing techniques.
  • Understand how the human visual system plays a role in interpretation of graphics.
  • Understand color and light representation and manipulation in graphics systems.
6.
  • Organize public relations activities from the perspectives of individual, organizational, and mass communication.
  • Plan the impact of information on certain groups of society.
  • Prepare information for dedicated society groups.
  • Evaluate the results achieved by linking them with certain groups or organizations in society.
  • Select appropriate communication channels for the specific group and dedicated information.
  • Learn strategic and tactical communications skills necessary for the practice of corporate communications and public relations in business, organizational, and non-profit settings.
  • Know the history and theory of public relations, strategic communications processes, stakeholder analysis, and issues management.
  • Understand communications tactics such as media relations, publications, community relations, consumer relations, employee communications, and online internet communications.
7.
  • Differentiate the professional field from related areas such as advertising, marketing, journalism, or propaganda and explain its historical development critically in relation to the present.
  • Know various professional and application fields of public relations (e.g., internal communication, press and media work, strategic communication management) and can differentiate between these fields of action.
  • Define and delimit PR parameters such as image, reputation, legitimacy.
  • Know various theoretical approaches to the field of PR and can apply them to a case as an example.

References

  1. Leys, P.; Mincer-Daszkiewicz, J. Erasmus Without Paper: Dream becoming reality. EPiC Ser. Comput. 2022, 86, 66–73. [Google Scholar]
  2. Cheung, K.; Li, B.; Benz, P.; Chow, K.M.; Ng, J.T.D.; Kwok, W.Y.Y.; Tsang, H.; Leung, D.N.H.; Lui, J.K.Y.; Na Li, Y.; et al. Prototype development of a cross-institutional credit transfer information system for community college transfer students. Sustainability 2021, 13, 9398. [Google Scholar] [CrossRef]
  3. Heppner, A.; Pawar, A.; Kivi, D.; Mago, V. Automating articulation: Applying natural language processing to post-secondary credit transfer. IEEE Access 2019, 7, 48295–48306. [Google Scholar] [CrossRef]
  4. Giani, M.S.; Taylor, J.L.; Kauppila, S. Examining the educational and employment outcomes of reverse credit transfer. AERA Open 2021, 7, 1–15. [Google Scholar] [CrossRef]
  5. Melesko, J.; Ramanauskaite, S. Time Saving Students’ Formative Assessment: Algorithm to Balance Number of Tasks and Result Reliability. Appl. Sci. 2021, 11, 6048. [Google Scholar] [CrossRef]
  6. Kumar, N. Managing skill gaps through competency mapping—A strategic tool for competitive edge. Int. J. Manag. 2014, 3, 134–139. [Google Scholar] [CrossRef]
  7. Anisha, N. Competency mapping of the employees. Int. J. Adv. Res. Technol. 2012, 1, 713–720. [Google Scholar]
  8. Uddin, M.I.; Tanchi, K.R.; Alam, M.N. Competency mapping: A tool for HR excellence. Eur. J. Bus. Manag. 2012, 4, 90–98. [Google Scholar]
  9. Sanghi, S. The Handbook of Competency Mapping: Understanding, Designing and Implementing Competency Models in Organizations; SAGE Publications: New Delhi, India, 2016. [Google Scholar]
  10. Mäses, S.; Maennel, O.; Sütterlin, S. Using competency mapping for skills assessment in an introductory cybersecurity course. In Proceedings of the International Conference on Interactive Collaborative Learning, Tallinn, Estonia, 23–25 September 2020. [Google Scholar]
  11. Jain, V.K. Competency Mapping in Indian Industries-A Case Study. Int. J. Emerg. Res. Manag. Technol. 2013, 2, 10–21. [Google Scholar]
  12. Kansal, J.; Jain, N. Development of competency model and mapping of employees competencies for organizational development: A new approach. J. Sci. Ind. Res. 2019, 78, 22–25. [Google Scholar]
  13. Kaur, J.; Kumar, V. Competency mapping: A gap Analysis. Int. J. Educ. Res. 2013, 1, 1–9. [Google Scholar]
  14. Russo, D. Competency measurement model. In Proceedings of the European Conference on Quality in Official Statistics, Madrid, Spain, 31 May 2016–3 June 2016. [Google Scholar]
  15. Kipper, L.M.; Iepsen, S.; Dal Forno, A.J.; Frozza, R.; Furstenau, L.; Agnes, J.; Cossul, D. Scientific mapping to identify competencies required by industry 4.0. Technol. Soc. 2021, 64, 101454. [Google Scholar] [CrossRef]
  16. Breen, D.; Shorten, G.; Aboulafia, A.; Zhang, D.; Hockemeyer, C.; Albert, D. Defining a competency map for a practical skill. Clin. Teach. 2014, 11, 531–536. [Google Scholar] [CrossRef]
  17. Perera, S.; Babatunde, S.O.; Zhou, L.; Pearson, J.; Ekundayo, D. Competency mapping framework for regulating professionally oriented degree programmes in higher education. Stud. High. Educ. 2017, 42, 2316–2342. [Google Scholar] [CrossRef]
  18. Shankararaman, V.; Gottipati, S. Mapping information systems student skills to industry skills framework. In Proceedings of the 2016 IEEE Global Engineering Education Conference (EDUCON), Abu Dhabi, United Arab Emirates, 11–13 April 2016. [Google Scholar]
  19. Ozyurt, O.; Gurcan, F.; Dalveren, G.G.M.; Derawi, M. Career in Cloud Computing: Exploratory Analysis of In-Demand Competency Areas and Skill Sets. Appl. Sci. 2022, 12, 9787. [Google Scholar] [CrossRef]
  20. Gottipati, S.; Shankararaman, V. Competency analytics tool: Analyzing curriculum using course competencies. Educ. Inf. Technol. 2018, 23, 41–60. [Google Scholar] [CrossRef]
  21. Wang, J.; Dong, Y. Measurement of text similarity: A survey. Information 2020, 11, 421. [Google Scholar] [CrossRef]
  22. Garman, A.N.; Standish, M.O.; Kim, D.H. Enhancing efficiency, reliability, and rigor in competency model analysis using natural language processing. J. Competency Based Educ. 2018, 3, e01164. [Google Scholar] [CrossRef] [Green Version]
  23. Kowligi, P.R.; Prajapati, P.; Jones, F.R.; Mardis, M.A. Comparing Florida’s advanced manufacturing curriculum framework to the department of labor competency model. In Proceedings of the 2020 ASEE Virtual Annual Conference Content Access, Virtual, 22 June 2020–26 June 2021. [Google Scholar]
  24. Margienė, A.; Ramanauskaitė, S.; Nugaras, J.; Stefanovič, P. Automated Transformation from Competency List to Tree: Way to Competency-Based Adaptive Knowledge E-Evaluation. Appl. Sci. 2022, 12, 1582. [Google Scholar] [CrossRef]
Figure 1. Main schema of competency text expression for structured competency object.
Sustainability 14 16544 g001
Figure 2. Example of a competency sentence, where red labeled word indicates the verbs, green labeled set of words—noun phrases, and blue labeled block—sub-sentence, which will be recursively analyzed to extract the internal verb and noun phrases.
Sustainability 14 16544 g002
Figure 3. Fuzzy sets for topic similarity definition to matching (labeled as “match”) and not matching (labeled as “not match”).
Sustainability 14 16544 g003
Figure 4. Fuzzy sets for Bloom taxonomy verb level difference definition to matching lower or higher level between the study/course competency and the student competency.
Sustainability 14 16544 g004
Figure 5. Fuzzy sets for defuzzification to estimate the priority of mapping manual revision.
Sustainability 14 16544 g005
Figure 6. Example of fuzzy logic application for two selected example competencies.
Sustainability 14 16544 g006
Figure 7. Principle of the proposed solution validation process.
Sustainability 14 16544 g007
Figure 8. Summary of accuracy metrics for all seven analyzed cases.
Sustainability 14 16544 g008
Figure 9. Four class mapping accuracy dependency from the number of mappings between the system and student course competencies.
Sustainability 14 16544 g009
Figure 10. Reduce manual review of all mappings based on the review priority till the fully correct system course competency coverage will be achieved.
Sustainability 14 16544 g010
Table 1. Fuzzy rule definition.
InputOutputRationale behind the
Output Class Assignment 1
Topic
Similarity
Bloom Level DifferenceCompetency Matching Class
“match”“higher”“redundant”The topic matcher but the student has a higher level of competency; therefore, his or her competencies are even redundant.
“match”“match”“match”The topic and competency level match; therefore, the competency fully matches.
“match”“lower”“partial”The topic matches, but the student has a lower level of competency; therefore, the competencies match just partially.
“no match”“higher”“partial”The competency level is higher; therefore, the topic description can use different terms; therefore, the partial match should be identified.
“no match”“match”“not related”The competency level matches, but the topic is different; therefore, the competencies are not related.
“no match”“lower”“not related”The student has a lower level of competency and is in a different topic; therefore, the competencies are not related.
1 Rules were defined by a group of experts in pedagogy.
Table 2. Summary of course and student competency mapping results.
MetricsCase Number
1234567
Number of course competencies5131111555
Number of student competencies71338934
Manual mapping resultsNot related1511322501603
Partial911730221215
Match3711532
Redundant838337200
Number of manually covered competencies51344532
Automated mapping resultsNot related010616092
Partial32137234326514
Match2112261814
Redundant11113100
Number of automatically covered competencies28310512
Accuracy4 class31%17%47%27%44%20%55%
2 class71%75%91%74%73%73%80%
Competency coverage40%62%91%36%100%60%60%
Publisher’s Note: MDPI stays neutral with regard to jurisdictional claims in published maps and institutional affiliations.

