Abstract
Concrete durability in saline soil areas is a global problem. Both SO42− and Cl− in saline soil seriously affect the durability of concrete and restrict the sustainable development of engineering construction. Soil samples were collected from Tumushuke city, Xinjiang, and the concentrations of SO42− and Cl− in the soil were measured. Classical statistics and geostatistics methods were combined to analyze the distribution characteristics of the soil salts. Additionally, the kriging interpolation method was used to draw a salt distribution map. The results showed that the average contents of SO42− and Cl− in the soil of this area were 7037.08 and 6018.94 mg/kg, respectively. SO42− exhibited moderate variability at depths of 30–60 and 60–100 cm in the soil and strong variability in the surface layer; Cl− exhibited strong variability at depths of 0–30, 30–60, and 60–100 cm in the soil. The SO42− and Cl− concentrations exhibited high spatial correlation and showed regular changes. The horizontal distribution patterns of “low in the south and high in the north” and “high in the east and low in the west” were observed. Regarding the vertical distribution, the profiles of the SO42− and Cl− contents in the soils primarily exhibited “surface aggregation” distribution characteristics. Therefore, according to the spatial distribution characteristics of SO42− and Cl−, local concrete engineering construction can adopt different anti-erosion measures to enhance the safety and durability of concrete structures.
1. Introduction
Soil salinization is a widespread global phenomenon. Approximately 1 billion ha of soil worldwide is affected by salinization, representing approximately 7% of the world’s land area [1]. Soil salinization is one of the current major environmental problems faced by humankind [2,3], because the total global area impacted by soil salinization is increasing at an alarming annual rate [4,5]. By 2050, over 50% of the global cropland is estimated to be salinized [6]. Soil salinization severely affects the ecological and nonecological functions of soil owing to the high content of sulfate and chloride salts in saline soil, which react with the cement matrix in concrete, generating expansive corrosion products [7,8,9,10]. This causes concrete structures to swell and crack, reducing their life span, structural durability, and overall quality [11,12,13]. Therefore, controlling soil salinization has been included in global future development plans [1,14].
In China, saline soil is widely distributed in the northwest, north, northeast, and coastal areas, covering a total area of approximately 3.6 × 10⁶ hm2, that is, approximately 4.88% of the country’s total land area [14]. Xinjiang, located in the hinterland of Eurasia, accounts for 22.01% of the total area of saline soil in China. It has the widest distribution of saline soil, the most types of salinization, and the heaviest soil salt accumulation in the entire country. Tumushuke city is located in the south of Xinjiang, representing a typical arid and semi-arid climate region because of chronic rainfall deficiency, high evaporation, and irrational farm irrigation practices. This has increased the water table level and water soluble salt content in the area, and soil salinization is particularly prominent [15,16,17].
Tumushuke city is in the area of the Belt and Road construction. As of 2021, the annual investment by the construction industry in Tumushuke city was CNY 2.299 billion; the contracts signed by various types of building construction units amount to 15.734 billion yuan; and the annual construction area of housing buildings reached 8.0968 million m2. With the acceleration of infrastructure construction, the impacts of saline soil on engineering constructions continue to emerge [18,19]. Moreover, the temperature difference between the four seasons and day and night in Tumushuke city drastically fluctuates, which contributes to rapid evaporation of water, leading to inadequate hydration of under-construction concrete material. This, in turn, shrinks the volume and increases the brittleness of concrete structures, and numerous reticulated cracks form on the concrete surface, facilitating the erosion of SO42− and Cl− in the saline soils of the concrete interior, generating substantial expansive erosion products and further cracking the structure [19,20]. With this cyclic action, SO42− and Cl− rapidly diffuse inside the material, causing severe damage to the building [19]. However, there is still a blank in research on soil salinization in Tumushuke city. The contents of SO42− and Cl− in the soils are still not known. It limits the study of the capability of resistance to salt eroding on local concrete. Therefore, there is an urgent need to study the SO42− and Cl− contents and distribution in local saline soils.
In this paper, through field investigation and sampling, data were collected in Tumushuke city, Xinjiang. Classical statistics and geostatistics methods were combined to explore the spatial variation characteristics of the concentrations of SO42− and Cl− in the soil. Kriging interpolation was combined with Pearson correlation analysis to describe the spatial distribution characteristics of the contents of SO42− and Cl− intuitively and accurately. The research results can provide ideas for the design and construction of concrete buildings in Tumushuke city. Reasonable measures to prevent concrete corrosion can be proposed to improve the durability of concrete and promote local economy and sustainable development.
2. Materials and Methods
2.1. Study Area
The study area of Tumushuke city, Xinjiang Province, is located in the Yarkant River and Kashgar River basins in the west of the Tarim Basin. It is adjacent to the Taklamakan Desert in the east, the Pamir Plateau in the west, the Tianshan Mountains in the north, and the Karakoram Mountains in the south. It is located between 78°43′20″–79°36′30″ E and 39°39′0″–40°05′50″ N, and the administrative area is 3664 km2. The geomorphic features are plains and dunes, and the Tulamaiti River, Kelegen River, and Xiaohaizi Reservoir lie in the study area. The region has a temperate and extremely arid desert climate, long sunshine duration, and a significant temperature difference between day and night. According to the meteorological data over the last decade, the maximum temperature in the study area was 42.7 °C, and the minimum temperature was −24.22 °C. The annual average precipitation is 38.3 mm (data are from: http://www.weather.com.cn/).
2.2. Sample Collection and Analysis
Within the sampling area of Tumushuke city, based on the 2.5 × 2.5 km grid layout of the soil sampling points, the grid node was used as the sampling point, and the longitude and latitude coordinates were used to record the location of the sampling points. A distribution map of the sampling points is shown in Figure 1. The sampling range was 78°43′–79°36′ E, 39°39′–40°06′ N, that is, approximately 90 km long from east to west and 55 km wide from north to south, with a total of 360 sampling points. Each sampling point was divided into three soil layers with sampling depths of 0–30, 30–60, and 60–100 cm, and in total, 1080 saline soil samples were collected.
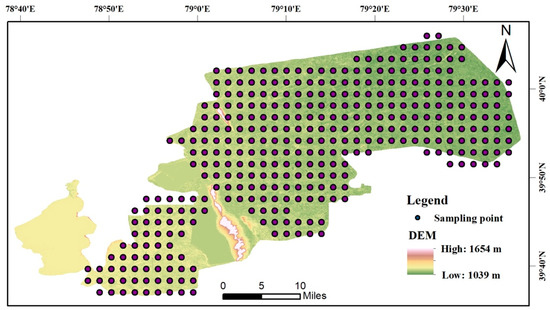
Figure 1.
Study area and distribution of the sampling points.
First, the obtained soil samples were air-dried indoors, and their visible plant residues were removed. Then, the samples were finely ground and passed through a 2 mm standard sieve. Finally, they were mixed and extracted in a 5:1 water-to-soil ratio. The resulting extract was used to determine the contents of SO42− and Cl−. The content of SO42− was determined by ethylene diamine tetraacetic acid (EDTA) complexometric titration and the content of Cl− by AgNO3 by titration [21,22].
2.3. Methodology
The 3σ criterion was used to test and correct the outliers for specific values of the data series. A descriptive statistical analysis of the soil salinity and ions was performed using SPSS 22 software. As geostatistical estimation methods consider the spatial correlation of the data, the most useful tool in the analysis of the spatial correlation of the data is the semivariance function [23]. Therefore, a semivariance function model fitted using the GS + 9.0 geostatistical software was used to study the spatial correlation of the data. The kriging interpolation of SO42− and Cl− in the soil was performed using ArcGIS 10.2, and the spatial distribution of the SO42− and Cl− was mapped.
3. Results and Discussion
3.1. Salinization Types
Soil salinity classification can not only quantitatively assess the soil salinity but also serve as a reference point for the scientific management and effective use of saline land [24]. According to the Chinese classification standards for saline soils, salt-affected soils are traditionally classified into four main types based on the Cl−/SO42− stoichiometric value [25]. When Cl−/SO42− < 0.5, the soil in this area is the sulfate type soil; when 0.5 < Cl−/SO42− < 1.0, the soil in this area is saline soil of the chloride-sulfate type; when 1.0 < Cl−/SO42− < 4.0, the soil of the region is of the sulfate-chloride type; and when Cl−/SO42− > 4.0, the area has a chloride-type saline soil. According to Table 1, the mean values of the Cl−/SO42− stoichiometric ratio of the soils in the study area ranged from 0.77 to 0.87, implying that all three soil layers are chloride-sulfate saline soils.

Table 1.
Saline soil types.
3.2. Descriptive Statistical Analysis of SO42− and Cl−
The descriptive statistics of the SO42− and Cl− concentrations in the soils from 360 sampling sites in the study area for three soil layers (i.e., 0–30, 30–60, and 60–100 cm) are presented in Table 2. For the SO42− concentration, the mean values of each soil layer from top to bottom were 7037.08, 4431.15, and 3212.81 mg/kg, respectively. The changes in the mean values of the SO42− and Cl− concentrations in the soil indicated a decreasing trend of salt concentration with increasing soil depth. Xinjiang is a semi-arid region, and according to relevant studies, when SO42− > 1500 mg/kg in the soil, the soil is highly corrosive to concrete structures [26]. The lowest mean value of SO42− in the soil of the study area was 3212.81 mg/kg, considerably above the 1500 mg/kg mark. This indicates that the soil in Tumushuke city is highly corrosive to the concrete structures in the area. The two indicators, skewness and kurtosis, revealed significant positive deviation values and kurtosis values of the SO42− and Cl− contents in the samples from the three soil layers at 360 sampling sites in the study area. The coefficient of variation (CV) of the data reflects the degree of dispersion of the random variables, referring to relevant studies [27,28,29]. When CV ≤ 0.1, this represents weak variability; 0.1 < CV < 1 represents moderate variability; and CV ≥ 1 represents strong variability. Table 2 presents the relatively high CV values of the soil salinity in all three soil layers at the 360 sampling sites in the study area. SO42− had moderate variability at 30–60 and 60–100 cm, with CV values of 0.78 and 0.90, respectively; it had strong variability at the 0–30 cm depth. Cl− exhibited strong variability in all three soil layers. This indicates that the horizontal distribution of the soil salt in Tumushuke city is uneven and spatially heterogeneous. The analysis of the vertical distribution of the CV reveals that the CV for the two ions was smaller in the middle layer and larger in the surface and bottom layers. This implies that the salt content of the middle layer of the soil is more uniform than that of the surface and subsoil. The variability of the surface and bottom layers was higher than that of the middle layer. This is primarily due to the presence of climate and human factors. According to Li’s [30] research on the factors of soil salinity in the Kashgar River basin, the type of land use is the main factor affecting the surface soil salinity, while the deep layer is mainly affected by the salinity of groundwater and the depth of groundwater. As Tumushuke city is located in the Kashgar River basin, therefore climatic factors, such as strong sunlight, high temperature, long sunshine, and large water evaporation, lead to the accumulation of salt in the soil surface [31], with the maximum salt ion concentration. In addition, artificial irrigation, drainage, and improper farming methods also exacerbated this result. The higher salt concentration in the deep layer was mainly related to the depth of the groundwater and the salinity of the groundwater.
Table 2.
Descriptive statistical characteristic values of soil salinity in each layer.
3.3. Geostatistical Analysis
The theoretical model and parameters of the semivariance function of soil salinity at each stratum of the study area are presented in Table 3. The nugget (C0) represents a kind of variation not caused by the spacing of sampling points, which reflects the spatial variation caused by human factors. The sill (C + C0) is the semivariance maximum that exists at different sampling intervals, reflecting the spatial variation caused by a combination of natural and anthropogenic factors. The ratio of the nugget (C0) to sill (C + C0) is known as the nugget effect. This ratio reflects the dominant role of natural and anthropogenic factors in influencing spatial variability [32,33].
Table 3.
Semivariance model and related parameters.
In general, when C0/(C0 + C) < 0.25, this indicates that the variables are highly spatially correlated, primarily controlled by environmental factors, and less influenced by anthropogenic factors; when 0.25 ≤ C0/(C0 + C) ≤ 0.75, this indicates that the variables have a moderate degree of spatial correlation; when C0/(C0 + C) > 0.75, this indicates that the spatial correlation of the variables is weak and that the variables are subject to human influence [34,35,36]. The best theoretical models for SO42− content are all exponential models, where the nugget effects of the top, middle, and bottom layers were 0.131, 0.140, and 0.123, respectively (Table 3). The best theoretical models for the Cl− content for the top, middle, and bottom layers are the spherical, Gaussian, and exponential models, respectively, and the nugget effects were 0.055, 0.195, and 0.112, respectively. SO42− and Cl− had high spatial correlations, implying that the spatial variability of the two ions were primarily influenced by environmental factors. This is consistent with the results of the above study of the coefficient of variation (CV).
3.4. Pearson Correlation Analysis
The Pearson correlation coefficients between the SO42− and Cl− and the longitude, latitude, and soil depth in the study area are presented in Table 4, where their correlation coefficients were 0.574, –0.331, 0.140, and 0.255, respectively, reaching significant correlation levels (p < 0.01). Thus, the SO42− and Cl− contents in the samples from the three soil layers had a high correlation with longitude, latitude, and depth. In the study area, the concentrations of SO42− and Cl− increased in the direction of latitude, implying a gradual increase in the concentration from south to north. In terms of longitude, their concentrations increased with longitude, implying an increasing trend from west to east. In the longitudinal direction, the concentrations of both ions decreased with depth, implying that the salt content of the soil gradually decreased downward from the surface layer. The concentrations of SO42− and Cl− also showed a positive correlation, which is consistent with the results of previous studies on the trends of the salinity change in the southern part of Xinjiang Province, China [37].
Table 4.
Pearson correlation coefficients between the SO42− and Cl− concentrations, longitude, latitude, and soil depth.
3.5. Spatial Distribution Characteristics Analysis of SO42− and Cl−
As shown in Figure 2a–f, the SO42− and Cl− contents were relatively high at a 0–30 cm depth, and the SO42− concentration in the sampling site reached 29,380 mg/kg (79°21′ E, 40°3′ N). The maximum concentration of Cl− reached 69,154 mg/kg (79°21′ E, 39°58′ N) in the cultivated farmland area, which may be related to irrigation, drainage, and tillage practices, which cause local salt accumulation. At depths of 30–60 cm, the concentrations of SO42− and Cl− decreased compared to those in the surface layer; however, they still reached 25,570 and 59,782 mg/kg, respectively. At a 60–100 cm depth, the maximum concentrations of SO42− and Cl− were 21,570 and 27,442 mg/kg, respectively. The magnitude of the change in SO42− from the surface to the bottom layers was relatively flat compared to that of Cl−. The area of a high concentration of SO42− was in the Gobi Desert beach, which is rarely affected by human activity and where soil salinization is primarily influenced by natural factors. In Figure 2d, the concentration of Cl− in the circled area was significantly different from the surrounding soil salt content, and the concentration significantly varied from the surface to the bottom layers. As this area is arable land, the sudden local increase in the Cl− concentration was significantly influenced by anthropogenic factors. The surface layer generally exhibits high salt deposition during soil salinization. The contents of both ions were significantly higher in the surface layer than in the middle and bottom layers, and the area with a high concentration of both ions was predominantly in the northeastern part of the study area (Figure 3). The region’s landform was primarily dominated by the Gobi beach, with serious soil degradation, high soil salinity, and severe soil salinization.
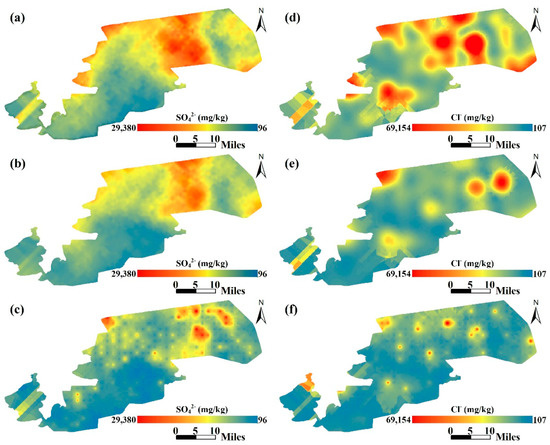
Figure 2.
Spatial distribution of the salt concentration in each soil layer: (a) 0–30 cm SO42− spatial distribution; (b) 30–60 cm SO42− spatial distribution; (c) 60–100 cm SO42− spatial distribution; (d) 0–30 cm Cl− spatial distribution; (e) 30–60 cm Cl− spatial distribution; (f) 60–100 cm Cl− spatial distribution.
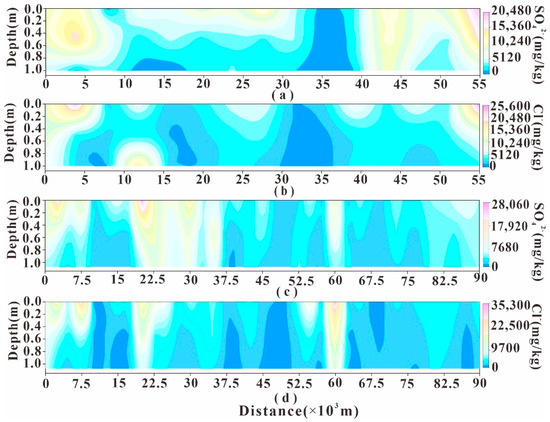
Figure 3.
Vertical distribution of the soil salinity: (a) SO42− content in the longitudinal direction; (b) Cl− content in the longitudinal direction; (c) SO42− content in the latitudinal direction; (d) Cl− content in the latitudinal direction.
Figure 2 shows that the spatial structure of SO42− and Cl− was well formed, with high regularity in the spatial variability that had evident directionality and continuity. Moreover, all three layers in the study area exhibited high spatial variability, with the surface layer exhibiting the highest variability. All three soil layers in the study area were relatively consistent in their spatial distribution patterns and were characterized by high local content and divergence. In terms of the horizontal spatial distribution of the soil salinity, the spatial distribution of the soil salinity in each layer in the study area was relatively regular. Overall, the spatial distribution pattern of the soil salinity was “high in the east and low in the west” and “high in the north and low in the south”, exhibiting the same distribution characteristics as in Pearson’s correlation analysis.
The soil salinity in the northeast was higher than that of the southwest, and the high concentration areas were mainly concentrated in the northeast of the study area. Combined with the actual situation in the study area, we can explain this phenomenon based on the following factors. On the one hand, the northeastern part of the study area is close to the desert, and the soils around here are significantly degraded, hence, resulting in the high salinity of the northeastern soils. On the other hand, there was a large area of cotton planting land in the northeast of the study area, and artificial irrigation and drainage also have a great impact on the salt content of the soil. In addition, Li et al.’s research (2022) on soil salinization and its influencing factors shows that there was a strong positive correlation between evaporation and soil salinization degree, and a strong negative correlation between the total precipitation and soil salinization degree, both of which are important factors leading to soil salinization [38]. A study of the annual precipitation and evapotranspiration in Xinjiang over the past 54 years revealed that precipitation in the region decreases from west to east and evaporation decreases from south to north [39]. Obviously, precipitation determines evaporation. Therefore, it is strongly proved that the degree of soil salinization in this area is also related to the local precipitation and evaporation.
Figure 3 shows the distribution of the salts in the soil profile, with the highest concentration of salts at the surface layer of the study area and soil salts aggregated at the surface. Salt accumulation patches on the surface of this area were found everywhere during the field sampling, as shown in Figure 4. This could be related to the primary salinization process, which generally occurs in areas with significant surface vegetation but low rainfall, where vegetation draws salt from the deeper layers and deposits it on the surface, gradually decreasing the salt concentration in the lower layers [40]. This phenomenon can be observed in Figure 3a,b. The Salinity significantly varied over a 15 km range from south to north in the study area. Within this 15 km area, significant farmland cultivation was practiced, which led to evident changes in the salinity. However, with an increase in the distance from south to north in the study area, large swathes of the Gobi Desert appeared in the northern part of the study area, where the soil salinity predominantly accumulated in the surface layer. Figure 3c,d show parts of the study area from west to east, where the salts primarily accumulated on the surface. The salinity concentration in the eastern part of the study area was significantly higher than that in the western part. In terms of topographical factors, the eastern part is closer to the edge of the desert, and the soil is severely degraded, thereby resulting in the high salinity content.
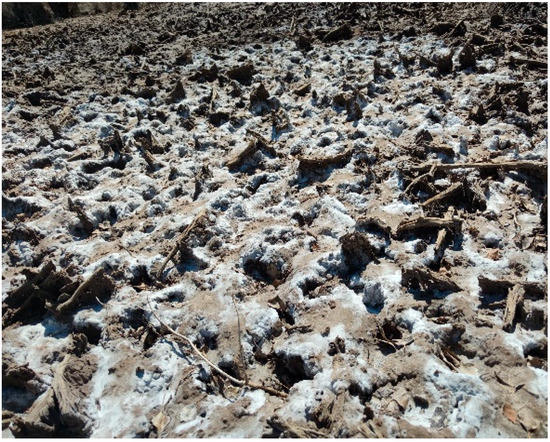
Figure 4.
Salinity accumulation at sampling points.
The salinity distribution of the soil profile in the study area was primarily characterized by the high evapotranspiration effect in extremely arid areas. Consequently, under high evaporation conditions, a substantial quantity of salt accumulates in shallow areas. In this case, once irrigated, a significant change in the salinity occurred. With the development of agriculture in Tumushuke city, the cultivation of cotton also increased. Large-scale irrigation is used to desalinate the soil salinity and ensure normal crop growth; thus, agricultural activities, such as fertilizations, irrigations, and tillages, become important factors in accelerating the soil salinization in the region. At the same time, the study area belongs to a temperate and extremely arid desert climate, with long sunshine hours, strong evaporation, drought and little rain throughout the year, and water in the soil mainly showing an upward movement, which also causes the surface soil salt accumulation in the study area.
4. Conclusions
The spatial distribution of SO42− and Cl− in the soil of Tumushuke city, south Xinjiang, China, was investigated based on the SO42− and Cl− contents in the soil samples from 360 sampling points. The results showed that the study area had a chloride-sulfate type saline soils with extremely high salt content, and the two concentration peak values occurred in the northeastern part of the study area. SO42− exhibited moderate variability in the middle and bottom layers and high variability in the surface layer; Cl− exhibited high variability in all three soil layers. The soil salinity distribution was not uniform, and the spatial heterogeneity was strong. The soil salinity in all layers exhibited high spatial autocorrelation, and the spatial distribution was primarily influenced by environmental factors. The soil salinity generally exhibited a horizontal distribution pattern of “high in the east and low in the west” and “high in the north and low in the south”. The concentration of salts decreased with the soil depth, with the highest concentration in the surface layer. Therefore, these results can provide data support for the subsequent development and research of the construction industry and agriculture. For example, concrete buildings in Tumushuke city can adopt different antisalt erosion measures according to the spatial distribution characteristics of SO42− and Cl−, and also provide data support for subsequent studies on concrete antisalt erosion. Further, more agricultural planting areas can be reclaimed according to the spatial distribution characteristics of salt.
Author Contributions
X.J.: Conceptualization, Methodology, Data curation, and Writing—original draft; Y.M. and G.L.: Supervision, Writing—review, Project administration, and Funding acquisition; W.H. and G.C.: Resources and Formal analysis; A.W. and H.Z.: Validation and Writing—review. All authors have read and agreed to the published version of the manuscript.
Funding
This research was supported and funded by the National Natural Science Foundation of China (52168064); Science and Technology Project of Bingtuan (2021DB005); Innovation and Development of Shihezi University (CXFZ202215).
Institutional Review Board Statement
Not applicable.
Informed Consent Statement
Not applicable.
Data Availability Statement
The original contributions presented in this study are included in the article. Further enquiries may be directed to the appropriate author.
Acknowledgments
We wish to express our thanks to Yonghang Chen, Xuexia Yu, Ziqian Li and Jiamin Liu for analyzing a large number of samples.
Conflicts of Interest
The authors declare no conflict of interest.
References
- Wang, Y.; Deng, C.; Liu, Y.; Niu, Z. Identifying change in spatial accumulation of soil salinity in an inland river watershed, China. Sci. Total Environ. 2018, 621, 177–185. [Google Scholar] [CrossRef]
- Sun, G.; Zhu, Y.; Ye, M.; Yang, Y.; Yang, J.; Mao, W.; Wu, J. Regional soil salinity spatiotemporal dynamics and improved temporal stability analysis in arid agricultural areas. J. Soils Sediments 2021, 22, 272–292. [Google Scholar] [CrossRef]
- Hamzehpour, N.; Bogaert, P. Improved spatiotemporal monitoring of soil salinity using filtered kriging with measurement errors: An application to the West Urmia Lake, Iran. Geoderma 2017, 295, 22–33. [Google Scholar] [CrossRef]
- Jiang, Q.; Peng, J.; Biswas, A.; Hu, J.; Zhao, R.; He, K.; Shi, Z. Characterising dryland salinity in three dimensions. Sci. Total Environ. 2019, 682, 190–199. [Google Scholar] [CrossRef]
- Liu, Y.; Zhang, F.; Wang, C.; Wu, S.; Liu, J.; Xu, A.; Pan, K.; Pan, X. Estimating the soil salinity over partially vegetated surfaces from multispectral remote sensing image using non-negative matrix factorization. Geoderma 2019, 354, 113887. [Google Scholar] [CrossRef]
- Wang, J.; Liu, Y.; Wang, S.; Liu, H.; Fu, G.; Xiong, Y. Spatial distribution of soil salinity and potential implications for soil management in the Manas River watershed, China. Soil Use Manag. 2019, 36, 93–103. [Google Scholar] [CrossRef]
- Yang, D.; Yan, C.; Zhang, J.; Liu, S.; Li, J. Chloride threshold value and initial corrosion time of steel bars in concrete exposed to saline soil environments. Constr. Build. Mater. 2021, 267, 120979. [Google Scholar] [CrossRef]
- Liu, Z.; Zhang, F.; Deng, D.; Xie, Y.; Long, G.; Tang, X. Physical sulfate attack on concrete lining–A field case analysis. Case Stud. Constr. Mater. 2017, 6, 206–212. [Google Scholar] [CrossRef]
- Yu, D.; Feng, C.; Fu, T.; Shen, A. Effect of Sulfate Concentration on Chloride Diffusion of Concrete under Cyclic Load. Materials 2022, 15, 2036. [Google Scholar] [CrossRef]
- Wang, B.; Pan, J.; Fang, R.; Wang, Q. Damage model of concrete subjected to coupling chemical attacks and freeze-thaw cycles in saline soil area. Constr. Build. Mater. 2020, 242, 118205. [Google Scholar] [CrossRef]
- Liao, K.-X.; Zhang, Y.-P.; Zhang, W.-P.; Wang, Y.; Zhang, R.-L. Modeling constitutive relationship of sulfate-attacked concrete. Constr. Build. Mater. 2020, 260, 119902. [Google Scholar] [CrossRef]
- Maes, M.; De Belie, N. Influence of chlorides on magnesium sulphate attack for mortars with Portland cement and slag based binders. Constr. Build. Mater. 2017, 155, 630–642. [Google Scholar] [CrossRef]
- Du, J.; Tang, Z.; Li, G.; Yang, H.; Li, L. Key inhibitory mechanism of external chloride ions on concrete sulfate attack. Constr. Build. Mater. 2019, 225, 611–619. [Google Scholar] [CrossRef]
- Li, J.; Pu, L.; Han, M.; Zhu, M.; Zhang, R.; Xiang, Y. Soil salinization research in China: Advances and prospects. J. Geogr. Sci. 2014, 24, 943–960. [Google Scholar] [CrossRef]
- Wang, R.; Wan, S.; Sun, J.; Xiao, H. Soil salinity, sodicity and cotton yield parameters under different drip irrigation regimes during saline wasteland reclamation. Agric. Water Manag. 2018, 209, 20–31. [Google Scholar] [CrossRef]
- Butcher, K.; Wick, A.F.; DeSutter, T.; Chatterjee, A.; Harmon, J. Soil Salinity: A Threat to Global Food Security. Agron. J. 2016, 108, 2189–2200. [Google Scholar] [CrossRef]
- Amundson, R.; Berhe, A.A.; Hopmans, J.W.; Olson, C.; Sztein, A.E.; Sparks, D.L. Soil science. Soil and human security in the 21st century. Science 2015, 348, 1261071. [Google Scholar] [CrossRef]
- Zhang, F.; Hu, Z.; Wei, F.; Wen, X.; Li, X.; Dai, L.; Liu, L. Study on Concrete Deterioration in Different NaCl-Na2SO4 Solutions and the Mechanism of Cl− Diffusion. Materials 2021, 14, 5054. [Google Scholar] [CrossRef]
- Zhao, G.; Li, J.; Shao, W. Effect of mixed chlorides on the degradation and sulfate diffusion of cast-in-situ concrete due to sulfate attack. Constr. Build. Mater. 2018, 181, 49–58. [Google Scholar] [CrossRef]
- Yang, D.; Yan, C.; Liu, S.; Jia, Z.; Wang, C. Prediction of Concrete Compressive Strength in Saline Soil Environments. Materials 2022, 15, 4663. [Google Scholar] [CrossRef]
- Institute of Agricultural Resources and Regional Planning, CAAS. Soil Testing Part 17: Method for Determination of Soil Chloride Iron Content; NY/T1121.17-2006; Chinese Agricultural Press: Beijing, China, 2006. (In Chinese) [Google Scholar]
- Institute of Agricultural Resources and Regional Planning, CAAS. Soil Testing Part 18: Method for Determination of Soil Sulfate Content; NY/T1121.18-2006; Chinese Agricultural Press: Beijing, China, 2006. (In Chinese) [Google Scholar]
- Hojati, S. Use of spatial statistics to identify hotspots of lead and copper in selected soils from north of Khuzestan Province, southwestern Iran. Arch. Agron. Soil Sci. 2018, 65, 654–669. [Google Scholar] [CrossRef]
- Yao, R.; Yang, J. Quantitative evaluation of soil salinity and its spatial distribution using electromagnetic induction method. Agric. Water Manag. 2010, 97, 1961–1970. [Google Scholar] [CrossRef]
- Liu, Q.; Hanati, G.; Danierhan, S.; Liu, G.; Zhang, Y.; Zhang, Z. Identifying Seasonal Accumulation of Soil Salinity with Three-Dimensional Mapping—A Case Study in Cold and Semiarid Irrigated Fields. Sustainability 2020, 12, 6645. [Google Scholar] [CrossRef]
- Wang, K. Climate and Evaluation of Crystallizable Erosion of Concrete by Sulfates in Water and Soil. Site Investig. Sci. Technol. 2007, 1, 34–38. (In Chinese) [Google Scholar]
- Behera, S.K.; Shukla, A.K. Spatial Distribution of Surface Soil Acidity, Electrical Conductivity, Soil Organic Carbon Content and Exchangeable Potassium, Calcium and Magnesium in Some Cropped Acid Soils of India. Land Degrad. Dev. 2014, 26, 71–79. [Google Scholar] [CrossRef]
- Aghasi, B.; Jalalian, A.; Khademi, H.; Toomanian, N. Sub-basin scale spatial variability of soil properties in Central Iran. Arab. J. Geosci. 2017, 10, 136. [Google Scholar] [CrossRef]
- De Caires, S.A.; Wuddivira, M.N.; Bramble, D.S.E.; Atwell, M.; Roopnarine, R.; Farrick, K.K. Soil Sampling Strategies for the Characterization of Spatial Variability Under Two Distinct Land Uses. Commun. Soil Sci. Plant Anal. 2021, 52, 2217–2240. [Google Scholar] [CrossRef]
- Li, S.; Lu, L.; Gao, Y.; Zhang, Y.; Shen, D. An Analysis on the Characteristics and Influence Factors of Soil Salinity in the Wasteland of the Kashgar River Basin. Sustainability 2022, 14, 3500. [Google Scholar] [CrossRef]
- Li, H.Y.; Shi, Z.; Webster, R.; Triantafilis, J. Mapping the three-dimensional variation of soil salinity in a rice-paddy soil. Geoderma 2013, 195–196, 31–41. [Google Scholar] [CrossRef]
- Huang, H.; Zhang, K.; Shao, C.; Wang, C.; Ente, M.; Wang, Z.; Zhang, D.; Li, K. Spatial distribution of Gasterophilus pecorum (Diptera) eggs in the desert steppe of the Kalamaili Nature Reserve (Xinjiang, China). BMC Ecol. Evol. 2021, 21, 169. [Google Scholar] [CrossRef]
- Pang, S.; Li, T.-X.; Zhang, X.-F.; Wang, Y.-D.; Yu, H.-Y. Spatial variability of cropland lead and its influencing factors: A case study in Shuangliu county, Sichuan province, China. Geoderma 2011, 162, 223–230. [Google Scholar] [CrossRef]
- Liu, W.; Xu, X.; Lu, F.; Cao, J.; Li, P.; Fu, T.; Chen, G.; Su, Q. Three-dimensional mapping of soil salinity in the southern coastal area of Laizhou Bay, China. Land Degrad. Dev. 2018, 29, 3772–3782. [Google Scholar] [CrossRef]
- Xu, L.; Du, H.; Zhang, X. Spatial Distribution Characteristics of Soil Salinity and Moisture and Its Influence on Agricultural Irrigation in the Ili River Valley, China. Sustainability 2019, 11, 7142. [Google Scholar] [CrossRef]
- Cao, Q.; Yang, B.; Li, J.; Wang, R.; Liu, T.; Xiao, H. Characteristics of soil water and salt associated with Tamarix ramosissima communities during normal and dry periods in a semi-arid saline environment. Catena 2020, 193, 104661. [Google Scholar] [CrossRef]
- Li, X.-M.; Yang, J.-S.; Liu, M.-X.; Liu, G.-M.; Yu, M. Spatio-Temporal Changes of Soil Salinity in Arid Areas of South Xinjiang Using Electromagnetic Induction. J. Integr. Agric. 2012, 11, 1365–1376. [Google Scholar] [CrossRef]
- Li, X.; Li, Y.; Wang, B.; Sun, Y.; Cui, G.; Liang, Z. Analysis of spatial-temporal variation of the saline-sodic soil in the west of Jilin Province from 1989 to 2019 and influencing factors. Catena 2022, 217, 106492. [Google Scholar] [CrossRef]
- Liu, X.; Zhang, Q.; Zhang, P.; Zhang, G. Spatial Distribution Characteristics and Analysis of Saline-alkali Land in Northern Xinjiang. J. Agric. Sci. Technol. 2020, 22, 141–148. (In Chinese) [Google Scholar] [CrossRef]
- Peng, J.; Biswas, A.; Jiang, Q.; Zhao, R.; Hu, J.; Hu, B.; Shi, Z. Estimating soil salinity from remote sensing and terrain data in southern Xinjiang Province, China. Geoderma 2019, 337, 1309–1319. [Google Scholar] [CrossRef]
Publisher’s Note: MDPI stays neutral with regard to jurisdictional claims in published maps and institutional affiliations. |
© 2022 by the authors. Licensee MDPI, Basel, Switzerland. This article is an open access article distributed under the terms and conditions of the Creative Commons Attribution (CC BY) license (https://creativecommons.org/licenses/by/4.0/).