Article

A Study on the Evaluation of Green Innovation Efficiency and Influencing Factors of the Chinese Tourism Industry

School of Economics & Management, Shanghai Maritime University, Shanghai 201306, China
*
Author to whom correspondence should be addressed.
Sustainability 2022, 14(24), 16458; https://doi.org/10.3390/su142416458
Submission received: 22 October 2022 / Revised: 16 November 2022 / Accepted: 5 December 2022 / Published: 8 December 2022

Abstract

:
It is necessary to promote harmony between the economic growth of tourism and the resource environment to achieve the green and sustainable development of China’s tourism industry. The research objects were taken in 30 provinces and cities in China. The green innovation efficiency of tourism is measured and evaluated based on the super-efficient SBM model and Moran index. The spatial and temporal heterogeneity of the influencing factors of green innovation efficiency is analyzed using the GWR model. The study shows that: (1) The level of green innovation efficiency of the tourism industry as a whole keeps improving during the study period, but the development is uneven among eastern, central, and western provinces. (2) The spatial correlation of the green innovation efficiency of the tourism industry in 30 provinces and cities keeps getting closer and closer, and some regions show the characteristics of spatial aggregation. (3) The green innovation efficiency of the tourism industry is affected by various factors, such as the level of economic development and the level of professional development of the tourism industry. (4) Tourism green innovation efficiency is influenced by various factors, such as economic development level and tourism professional development level, and there are apparent intensity differences and spatial heterogeneity among various influencing factors. Finally, reasonable countermeasures are proposed to promote the overall improvement and balanced development of green innovation efficiency in China’s tourism industry.

1. Introduction

Since the reform and opening up, China’s tourism industry has developed by leaps and bounds, and tourism has become an essential part of people’s daily life. “During the 14th Five-Year Plan period, tourism development is still in an important strategic opportunity period, and the tourism industry is facing new requirements of high-quality development. In 2022, General Secretary Xi Jinping pointed out during the two sessions that implementing the five development concepts of innovation, coordination, green, openness, and sharing is the only way for China to develop and grow in the new era”. As a result, promoting green and low-carbon development has become the main task of government work and national economic and social development in 2022.
Specifically, this study aims to construct a scientific and objective index evaluation system to measure the level of green innovation efficiency in China’s tourism industry on the basis of comprehensive reference to existing studies and overall grasp of the current situation of China’s tourism industry, to analyze the evolution pattern of the level of green innovation efficiency in China’s tourism industry from the perspective of time and space, and finally select representative indexes to explore the factors influencing green innovation efficiency in the tourism industry and its spatial and temporal development. Finally, we select representative indicators to explore the factors influencing the green innovation efficiency of the tourism industry and their spatial and temporal heterogeneity, and propose targeted countermeasures based on the empirical results. By empirically measuring the level of green innovation efficiency in China’s tourism industry, revealing the spatial and temporal differences in green economic efficiency among different regions and their changing trends, and analyzing the specific effects of various factors on green innovation efficiency, it is not only important for green innovation development and the sustainable development of the tourism industry in each region, but also conducive to promoting the overall ecological civilization construction work.

2. Literature Review

Combining the literature related to this study, foreign scholar Fussler first defines the connotation of green innovation, which is a way to produce new products using the latest technology, and to a certain extent, achieves the coordinated development of economic value and environmental protection [1]. Subsequently, domestic and foreign scholars extended the research on green innovation to similar levels, such as eco-innovation and sustainable innovation [2,3,4,5,6]. Synthesizing the research results of domestic and foreign scholars, the connotation of green innovation is mainly divided into two aspects: On the one hand, it is to reduce the negative impact on the environment through the development and application of new products or processes. On the other hand, it is the improvement of environmental performance to get the highest possible benefit in economic, technological, and green aspects with the smallest human, capital, and resource input and pollution output.
Scholars at home and abroad have generally used mathematical models to construct multi-perspective evaluation index systems to evaluate green innovation efficiency and its impact factor analysis. Most of them have focused on the fields of industry and high-tech industry [7,8,9,10,11]. With the continuous research on green innovation efficiency, scholars began to focus on the tourism field. Green innovation efficiency of tourism refers to the evaluation of the level of green innovation development of tourism in a specific geographical area, which is the level of effective utilization of various green innovation input factors under the premise of careful consideration of innovation R&D benefits, economic benefits and resource, and environmental benefits. Razzaq analyzed the relationship between green innovation and economic growth in tourism and verified the hypothesis of tourism-led [12] economic growth. Gurlek M and Koseoglu MA studied the antecedents and consequences of green innovation development in the tourism and accommodation sector and its prospects [13]. Yue XG and Gao J confirmed that green innovation in tourism plays an essential role in reducing global carbon emissions and achieving the goal of carbon neutrality [14]. Focusing on the green innovation of tourism products, Liu Y and Deng MR reveal that the green creation of tourism [15] products has a unique life cycle and thus improves the green quality of tourism products. Using the modified gravity model and social network analysis, Liu J and Song QY investigate the spatial characteristics and development [16] trend of green innovation efficiency in China’s tourism industry and further analyze its influencing factors and mechanisms.
Xu WQ used super-efficient SBM, standard deviation ellipsoid, and geographic detector to reveal that the green innovation efficiency evolution pattern of the tourism industry in coastal areas of China is a spatial pattern formed by the combined effect of dominant technology spillover, induced effect of infrastructure radiation, urbanization agglomeration, and economic drive, and driving effect of industrial optimization, opening to the outside world, environmental control, and innovation leadership [17]. Using the super-efficient SBM model, Li JH measured the eco-efficiency and tourism industry efficiency and their coupling coordination in nine cities in Guizhou Province and proved that the eco-efficiency of nine cities in Guizhou Province showed a U-shaped development state [18]. Li G measured tourism economic-ecological efficiency and its total factor productivity using CCR-DEA and MALMQUIST-DEA models and proved that the level of economic development and fixed asset investment have a positive contribution to tourism economic-ecological efficiency [19]. An K used the super-efficient SBM model, the distribution dynamic method, and panel quantile regression to reveal the evolution pattern of green innovation efficiency in China’s tourism industry and its main causes The level of economic development and tourism industry agglomeration are the core factors for the evolution of green innovation efficiency in the tourism industry at national and regional levels, and the degree of openness to the outside world, the intensity of environmental regulation, and the scale of tourism enterprises have obvious regional heterogeneity [20].
In summary, although there is some progress in the research on green innovation efficiency in the tourism industry, there are still some research gaps in the existing studies. Firstly, from the perspective of the research object, the previous studies mainly focus on the industrial field. At the same time, the tourism industry has some involvement, but the overall research is relatively small. In addition, in the previous studies, scholars mainly studied the influencing factors through qualitative analysis without fully considering the influence of spatial effects, which cannot effectively reveal the spatial heterogeneity of the influencing factors. In this paper, we choose the super-efficient SBM model to measure the green innovation efficiency of tourism in 30 provinces and cities in China from 2009 to 2019 and use the Moran index and GWR model to analyze the spatial and temporal heterogeneity of green innovation efficiency and influencing factors of tourism in China. The research results can provide some reference for tourism’s green and sustainable development in China and other similar regions or countries.

3. Methods and Data Source

3.1. Super-Efficient SBM Model

Before evaluating the green innovation efficiency of tourism industry, we should first clarify the evaluation method. The green innovation efficiency of tourism industry is to evaluate the efficiency of capital, human as well as green resources utilization in the Chinese tourism industry, which involves various indicators, so this paper chooses data envelopment analysis to study the green innovation efficiency of the tourism industry. Data envelopment analysis is a quantitative analysis method that uses linear programming with multiple inputs and outputs to evaluate the relative effectiveness of comparable units of the same type, and it has absolute advantages in dealing with multiple output-multiple input effectiveness evaluation problems [21], which can simultaneously evaluate the production performance of decision making units (DMU) with multiple input elements and output elements. It is able to evaluate the production performance of DMUs with multiple input and output elements at the same time, avoiding the complexity and subjectivity of the measurement process due to the different scales of evaluation indicators. However, the traditional DEA model has the problem of slack variables in inputs or outputs and the problem that the measurement results are all 1 and thus cannot be compared, which may affect the measurement results. For this reason, Tone et al. [22,23] proposed a super-efficient SBM model to solve the above problems, which can be described as:
m i n ρ S E = 1 + 1 m j = 1 m s i X i k 1 1 q 1 + q 2 r = 1 q 1 s r + Y r k + r = 1 q 1 s t b b t k s . t . j = 1 , j k n x i j λ j s i x i k j = 1 , j k n y r j λ j + s r + x r k j = 1 , j k n x t j λ j s t b x t k j = 1 , j k n λ j = 1 λ , s , s + 0 i = 1 , 2 , , m ; r = 1 , 2 , , q 1 ; t = 1 , 2 , , q 2 ; j = 1 , 2 , , n j k
As in the above equation, It represents the calculated efficiency value.when ρ S E 0 , it means that the decision unit is valid and there exists ρ S E 1 . An enormous value indicates a more efficient decision unit. X is the input vector, Y is the desired output vector, and b is the undesired output vector. s i and denotes s i + . For the input and output slack variables, λ denotes the weight vector, n denotes the number of DMUs, m represents the number of input indicators, and means the number of desired and undesired outputs, respectively q 1 q 2 .

3.2. Spatial Correlation Analysis

3.2.1. Global Spatial Autocorrelation-Global Moran’s I Index

The global spatial autocorrelation (Global Moran’s I) can be used to measure the distribution characteristics of the whole study unit among spatial elements, which can effectively test the autocorrelation of regional units in neighboring or proximity relationships, and thus discover the patterns that exist in the spatial distribution of green innovation efficiency in this study. The global Moran’s I index can be defined as
Moran s   I = n i = 1 n i = 1 n w i j x i x ¯ x j x ¯ i = 1 n i = 1 n w i j ( i = 1 n x i x ¯ 2
The above equation: and denotes the green innovation efficiency values of tourism in x i different regions; denotes x j . The average value of green innovation efficiency; denotes the spatial weight matrix. If i and j are adjacent, then = 1. If not, then = 0. The global Moran’s I index ranges from −1 to 1. If the global Moran’s I index is between 0 and 1, then there is a positive spatial correlation x ¯ and the green regions with higher (or lower) innovation efficiency levels tend to be significantly clustered in space; if the Moran’s index is between −1 and 0, it proves that there is a negative spatial correlation and green innovation efficiency w i j levels are randomly distributed in space; if Moran’s index is 0, it indicates no spatial correlation w i j w i j . It is also necessary to analyze the obtained P and Z-values while judging the Moran index.

3.2.2. Local Spatial Autocorrelation—Local Moran’s I Index

The local spatial autocorrelation (Local Moran’s I) can effectively measure the spatial correlation of green innovation efficiency in each region of China’s tourism industry, and the scatter plot can reflect the local spatial differences and the spatial clustering of green innovation efficiency more intuitively, so as to reveal the spatial clustering of green innovation efficiency in each province of China’s tourism industry. The local Moran’s index can reflect the clustering or dispersion of a region locally, which is defined as follows.
I i = X i X ¯ s i = 1 n w i j X i X ¯
S = 1 n i = 1 n X i X ¯ 2
As in the above equation, if the local Moran’s I > 0, it means that the region itself and the surrounding regions are high-high (low-low) adjacent, and if the local Moran’s I < 0, it means low-high (high-low) adjacent.

3.3. Geographically Weighted Regression (GWR) Model

If the research data or objects contain spatial attributes, there may be autocorrelation, variability, and complexity in space, which often lead to differences in the relationship between the explanatory and dependent variables in different spaces, and this phenomenon is called spatial non-stationarity. The existence of such spatial non-stationarity makes the traditional linear regression model no longer applicable and may lead to errors or mistakes in the study results. Therefore, the GWR model is introduced to avoid or reduce the effects of errors caused by spatial non-stationarity. The GWR model further extends the ordinary linear regression (OLR) model. The GWR model embeds the geographic location of all sampling points into the regression parameters, effectively reflecting the spatial variability of the effect of the independent variable on the dependent variable. The GWR model can be written as
y i = β 0 m u i , v i + s u m k = 1 p β k u i , v i x i k + ε i         i = 1 , 2 , , n
where y i denotes the green innovation efficiency value of tourism in a region: I denote the kth explanatory variable in a part where I am the region’s coordinator. I suggest the regression parameter of descriptive variable k in area I and the random error term in region i. x i k u i , v i β k u i , v i ε i .

3.4. Data Sources

This study uses the study population of 30 provinces and cities in China (excluding Tibet and Hong Kong, Macao, and Taiwan). The period 2009–2019 is chosen as the study period, considering the availability of data and the possibility of significant fluctuations in the study results due to the major impact of the COVID-19 epidemic on tourism in 2020. Given the time lag between input and output indicators, a time lag period of 1 year was determined, with data from 2009–2018 for input indicators and from 2010–2019 for output indicators, mainly from the China Statistical Yearbook, China Tourism Statistical Yearbook, China Environmental Statistical Yearbook, and the National Economic and Social Development Statistical Bulletin of each province. Since the tourism industry data statistics are not yet independent and perfect, some indicators are converted through the proportion of total tourism revenue equivalent to the regional GDP.

4. Research Design and Result Analysis

4.1. Construction of Green Innovation Efficiency Evaluation Index System of the Tourism Industry and Analysis of Results

4.1.1. Construction of Green Innovation Efficiency Evaluation Index System for the Tourism Industry

In this paper, based on the principles of scientific, objective, completeness, and comparability in setting up indicators and combining the current situation of green innovation in China’s tourism industry as well as its connotation, the indicator system is set up based on three aspects, which are input, expected output, and non-expected output. The indicator system is shown in Table 1. The specific indicators are described as follows.
(1)
Input indicators: Combined with the studies of Liu J [17], Wang YK [24], and Wei ZX [25] et al., the economic and ecological innovation efficiency of tourism industry development can be achieved on the basis of reducing resource consumption by investing in tourism innovation elements of talent, capital, and resources and carrying out tourism innovation activities. Economic efficiency lies in relying on scientific and technological progress to promote green production in the tourism industry, which in turn improves the efficiency of tourism resource utilization. Ecological innovation efficiency lies in the combination of tourism green innovation activities and products to reduce the negative impact of tourism activities on the ecological environment and enhance tourism environmental welfare. The green innovation efficiency of the tourism industry precisely combines tourism economic efficiency and ecological innovation efficiency, thus realizing the high-quality development of the tourism industry. Therefore, this paper selects the number of employees in the tourism industry, research funds in the tourism industry, and the number of tourist attractions of grade 3 or above as the indicators of labor input, capital input, and tourism resource input in the tourism industry based on domestic and foreign studies [26]. At the same time, the greening coverage rate of the city’s built-up area and the number of institutions are introduced as the measurement indicators of the green innovation dimension.
(2)
Expected output indicators: the output of green innovation activities carried out by the tourism industry is generally reflected in social and economic benefits. Social benefits include subjective emotions, such as tourists’ satisfaction and willingness to revisit, which are difficult to measure in a standardized way and therefore are not selected. Therefore, this paper only considers the output of economic benefits, so tourism revenue is set as the desired output indicator. In addition, the number of patents applied by tourism is introduced as a measure of innovation benefits.
(3)
Non-desired output indicators: environmental pollution is the key issue affecting green innovation in tourism due to the limitation of data calculability and the number of indicators, so this paper selects tourism wastewater discharge and solid waste discharge as non-desired output indicators based on the research of Liu Jia and other scholars [27].

4.1.2. Analysis of Empirical Results

The data of 30 provincial administrative regions collated by MaxDEA8 software are processed to obtain the green innovation efficiency values of tourism in 30 provinces in China from 2009 to 2019 and then divided into three regions: east, middle, and west, and the average value of green innovation efficiency of tourism is calculated, to reflect the green innovation efficiency of tourism in three major regions in China intuitively, 2010–2019. To visually reflect the green innovation efficiency of tourism in the three areas of China, the green innovation efficiency of tourism in the three regions of China is plotted from 2010 to 2019.
As shown in Figure 1, depicting the green innovation efficiency of 30 provincial-level administrative regions in the east, central, and west, as well as the overall mean value over time from 2009 to 2019, and the integrated green innovation efficiency values of tourism in the east, central, and west and the whole country, the green innovation efficiency values of tourism in China generally showed an upward trend during the study period. The green innovation efficiency of tourism grew slowly before 2015. After 2015, rapid development was achieved, and all three regions reached their maximum values in 2019. Therefore, using 2015 as the cut-off point can be further divided into two stages. The first stage is the stable growth stage, as the conditions of science and technology level, capital investment, location factors, and transportation accessibility in the eastern region are more substantial than those in the central and western areas, which can transform tourism-related inputs into higher output levels and thus improve the green innovation efficiency of local tourism. Therefore, the average green innovation efficiency of tourism in the eastern region is always higher than the average value in the central and western areas and the national average and is at a higher level overall, with a more significant gap.
Meanwhile, the green innovation efficiency value in the west is higher than that in the central region because the central region is an intermediate transition region, which does not have the developed economic level and location advantage of the eastern region nor the natural tourism resources the western region is blessed. However, the difference between the west and central regions is negligible. This stage is on the rise, but the overall development is flat. After 2015, the rapid growth phase, after entering the 13th Five-Year Plan period, General Secretary Xi Jinping put forward the five development concepts; adhering to green development, innovative development, green innovation into the economy, politics, culture, tourism, and other aspects. The three major regions of China, east, central, and west, relying on their advantages and responding to national policies, have optimized the tourism development structure and economic growth model, putting green development and innovative development in the first place, and achieving substantial growth in tourism green innovation efficiency. At the same time, the gap between the three regions is gradually narrowing, and the green innovation efficiency of tourism is developing progressively in the direction of balance. However, analyzing the trend of green innovation efficiency in tourism from the east, middle, and west of China alone cannot profoundly explore the inner correlation of green innovation efficiency in tourism in each province and city. Therefore, spatially analyzing the interaction of green innovation efficiency in tourism in each region is necessary.

4.2. Spatial Correlation Analysis of Green Innovation Efficiency in Tourism

4.2.1. Global Spatial Correlation Analysis

Using GeoDa software, the Moran index values of green innovation efficiency in China’s tourism industry from 2009 to 2019 were calculated using distance spatial weights as the spatial correlation weight matrix, as shown in Table 2. According to the calculation results in Table 2, the global Moran indexes were all positive, the p-values were all less than 0.05, and the Z-scores were all greater than 1.96, which passed at least the 5% significance level test. This shows a positive spatial correlation between regions of green innovation efficiency in China’s tourism industry. The green innovation efficiency of China’s tourism industry shows aggregation characteristics in spatial distribution. Moreover, according to the graph of the Moran index in Figure 2, the Moran index generally shows a fluctuating upward trend, indicating that the spatial aggregation of green innovation efficiency in China’s tourism industry is usually increasing. The reason for this may be that it is easy to strengthen the cooperation among the neighboring provincial administrative units in the economy, technology, and talents, which supports the spatial correlation of green innovation efficiency.

4.2.2. Local Spatial Correlation Analysis

Local Moran exponential scatter plot of the mean value of green innovation efficiency of tourism in 30 provinces and cities from 2009–2019, as shown in Figure 3, is obtained using GeoDa software. Moran’s I index scatter plot includes four quadrants. The first quadrant to the fourth quadrant represent high-high, low-high, low-low, and high-low clustering of observation units, respectively. The first quadrant represents each province and city’s green innovation efficiency with neighboring areas and cities is higher, and The difference is negligible. The second quadrant indicates that each region and city has low and high green innovation efficiency in the surrounding areas. The third quadrant shows that each province and city and the regional city have low green innovation efficiency, and the difference is negligible. The fourth quadrant indicates that each area and city has higher and lower green innovation efficiency than the neighboring provinces and cities. Specifically, as shown in Figure 3, high-high and low-low clustering are more significant, as 22 regions and cities are distributed in the first and third quadrants, accounting for 73% of all provinces, further confirming the significant spatial clustering of green innovation efficiency in China’s local tourism industry. Several provinces and municipalities are distributed in the second and fourth quadrants. Specifically, those falling in the first quadrant include eastern areas, such as Jiangsu and Beijing, due to the high level of economic development in the region, which drives the growth of green innovation in tourism. Those falling in the third quadrant mainly include central and western provinces, such as Jiangxi, Sichuan, and Shaanxi, which have a high degree of accumulation. Still, the average value of green innovation efficiency in tourism is generally low. Hence, the construction of ecological civilization should be vigorously promoted to facilitate the sustainable development of green innovation in tourism.

4.3. Research on Factors Influencing Green Innovation Efficiency of the Tourism Industry in China

4.3.1. Geographically Weighted Regression Model Research Design

To further explore the spatial and temporal heterogeneity of tourism green innovation efficiency, we selected the level of economic development (ED), industrial structure (INP), professional tourism development (TS), environmental regulation intensity (ER), degree of marketization (MD), and level of openness to the outside world (FDI) to establish a geographically weighted regression model (FDI), to establish the independent variables of the geographically weighted regression model and the annual green innovation efficiency values of the tourism industry in 30 provinces and cities as the dependent variables [28,29,30,31,32]. The factors affecting the differences in green innovation efficiency values between provinces and cities were obtained.
The level of economic development is closely related to the development of each local industry and, to a certain extent, affects the level of innovation in tourism as well as the level of industrial development. Therefore, in this study, the GDP per capita of the region is used to measure the level of economic growth in the area. The share of the tertiary sector in the region’s GDP is used to measure the region’s industrial structure. The level of professional development in the tourism industry promotes the formation of specialized labor divisions in the tourism industry in the area, and positive externality effects, such as resource sharing and technological knowledge spillover, further enhance the utilization rate of resources, mitigate pollution emissions, and contribute to the efficiency of green innovation. This indicator can be characterized by the entropy of the tourism industry location. Borrowing from Ma Xue Feng, this paper measures the level of professional tourism development in 30 [33] provinces and cities in China by the proportion of regional tourism revenue to the region’s GDP. Environmental regulation intensity is a kind of management or constraint imposed by the local government on the production activities of the production sector and other economic behaviors to improve environmental problems. This indicator is based on the approach of Hao Shouyi et al., by standardizing the data of three waste emissions and then calculating the weights. The product of standardization and weights is [34] used to obtain the environmental regulation intensity. The level of external openness is characterized by using the ratio of the actual amount of foreign capital employed to GDP.
The level of marketization can promote healthy competition among individual enterprises to a certain extent by activating the market economy and promoting green innovation efficiency in tourism. The provincial marketization index characterizes the marketization level in this paper.
Given that the GWR model deals with cross-sectional data, this paper selects two years of 2012 and 2019 influencing factor index values for comparative analysis. The independent variables are standardized by extreme differences to eliminate the influence of the magnitude between different indicators. Before building the model, we first conducted a cointegration test on the independent variables to avoid the bias of the regression results due to the multicollinearity among the variables. Table 3 shows the results of multiple cointegrations of factors influencing green innovation efficiency in tourism. The variance inflation factors of the independent variables are all well below 10, which indicates that there is almost no multicollinearity. With the GWR tool in ArcGIS software to construct a geographically weighted regression model, we used an adaptive approach to determine the optimal bandwidth of the minimum information criterion (AIC) to analyze the differences in the influencing factors of green innovation efficiency in China’s tourism industry in different regions. The regression results are shown in Table 4. The goodness-of-fit values for the two years, 2012 and 2019, were 0.88 and 0.79, respectively, with adjusted R2 of 0.81 and 0.69, both of which were greater than 0.5. The GWR model in this study can well explain the spatial heterogeneity of green innovation efficiency in the Chinese tourism industry.

4.3.2. Spatial and Temporal Heterogeneity Analysis of the Factors Influencing Green Innovation Efficiency in China’s Tourism Industry

The coefficients of the six independent variables of the GWR model of green innovation efficiency of China’s tourism industry in 2012 and 2019 are shown in Figure 4. In 2012, the coefficient of the influence of the level of economic development (ED) on the green innovation efficiency of the local tourism industry was negative. The more developed the economy is, the more significant the negative influence on the green innovation efficiency of the tourism industry is. According to the environmental Kuznets curve, when the economic development of a region is more backward, the smaller risk of environmental pollution can promote the green innovation efficiency of tourism to a certain extent, while the eastern part is more economically developed than the western region. The risk of environmental pollution also increases with the increase of economic development level, so in the early stage, the higher the level of economic development in the eastern region, the more significant the negative impact on the green innovation efficiency of local tourism [35]. From 2019 onwards, after the economic development level reaches a certain critical point, the environmental quality tends to improve, and the economic development level significantly influences tourism’s green innovation efficiency. This influence gradually decreased from northwest to southeast. The reason for this is that the tourism industry in northwest China started late and has been vigorously developed in recent years because of its rich natural tourism resources. In contrast, the tourism industry in the eastern region started earlier. The efficiency of capital utilization gradually decreased with the excessive concentration of capital and the continuous expansion of the investment scale. Therefore, the influence of economic development level on the current green innovation efficiency of the tourism industry in the west is more significant than that in the east region.
The two independent variables of regional industrial structure and the degree of marketization generally have a significant positive impact on the green innovation efficiency of the local tourism industry and show a decreasing trend from southeast to northwest. In 2012, the effect of the northwest region on the green innovation efficiency of the local tourism industry was hostile. The reason for this is that, generally, the economic and industrial structure and the degree of marketization in the southeast region of China are more rational and advanced than those in the northwest region. The advantages of industrial design in the southeast region have emerged continuously as the tourism industry in China has started to develop in a green and sustainable way in recent years. The increase in the degree of marketization has also strengthened the competition among tourism enterprises, which is conducive to saving production factors and optimizing resource allocation to enhance the green innovation efficiency of the tourism industry.
According to Zhu Jinhe et al.’s research, there are two hypotheses of “pollution paradise” and “pollution halo” for the effect of opening up [36] to the outside world on green innovation efficiency. In the early stage of opening up to the outside world, a higher level of openness can facilitate the introduction of advanced technology and production management experience, which in turn promotes the improvement of management level and the optimization and upgrading of technology. As the level of openness increases, the degree of openness has a significant “competition effect”, and the local government, to continuously attract potential investments from nearby areas, causes the advantages of transparency in the surrounding regions to weaken gradually, which to a certain extent curbs the efficiency of green innovation in the surrounding areas. The above hypothesis is widely applied in the industrial field. In this study, in 2012, China’s level of openness to the outside world generally had a positive impact on the green innovation efficiency of tourism. In 2019, with the increasing level of transparency, the level of green innovation efficiency of tourism in some regions began to decrease, which verified the existence of a “pollution halo” and “pollution paradise” in tourism, i.e., the “pollution paradise” hypothesis.
Consistent with the work of Xu Hui et al., environmental regulation and local green innovation efficiency have a “U” shaped relationship, in which the early stage [37] of environmental law is not conducive to improving green innovation efficiency due to the increase of ecological management costs. In the later stage of environmental regulation, the local government’s management capacity is enhanced. The substantial growth of economic output is far greater than the ecological management costs, which in turn has a catalytic effect on the green innovation efficiency of the local tourism industry. This study shows that in most regions of China in 2012, the impact coefficient of the influence of environmental regulation on the green innovation efficiency of the local tourism industry was hostile. Still, until 2019, although the intensity of ecological law became positive on the green innovation efficiency, its explanatory strength is at a low level, roughly at the bottom right of the U-shaped curve. The increase in tourism industry output due to environmental regulation offsets the early ecological management costs. It has not yet been able to substantially contribute to the green innovation efficiency of the local tourism industry. The level of professional development in the tourism industry has a significant positive impact on the improvement of green innovation efficiency in the local tourism industry, and the effect is gradually increasing. The reason for this is that as the level of local tourism specialization increases, the clustering and exchange of various tourism factors gradually increase, and the scale and radiation effects generated by tourism development increase, thus enhancing the green innovation efficiency of local tourism.

5. Conclusions and Discussion

5.1. Conclusions

In this paper, the super-efficient SBM model, Moran index, and GWR model are used to measure the green innovation efficiency of tourism in 30 provinces in China and the spatial and temporal variation characteristics and influencing factors of green innovation efficiency of tourism in different areas are analyzed. The following conclusions are drawn:
(1)
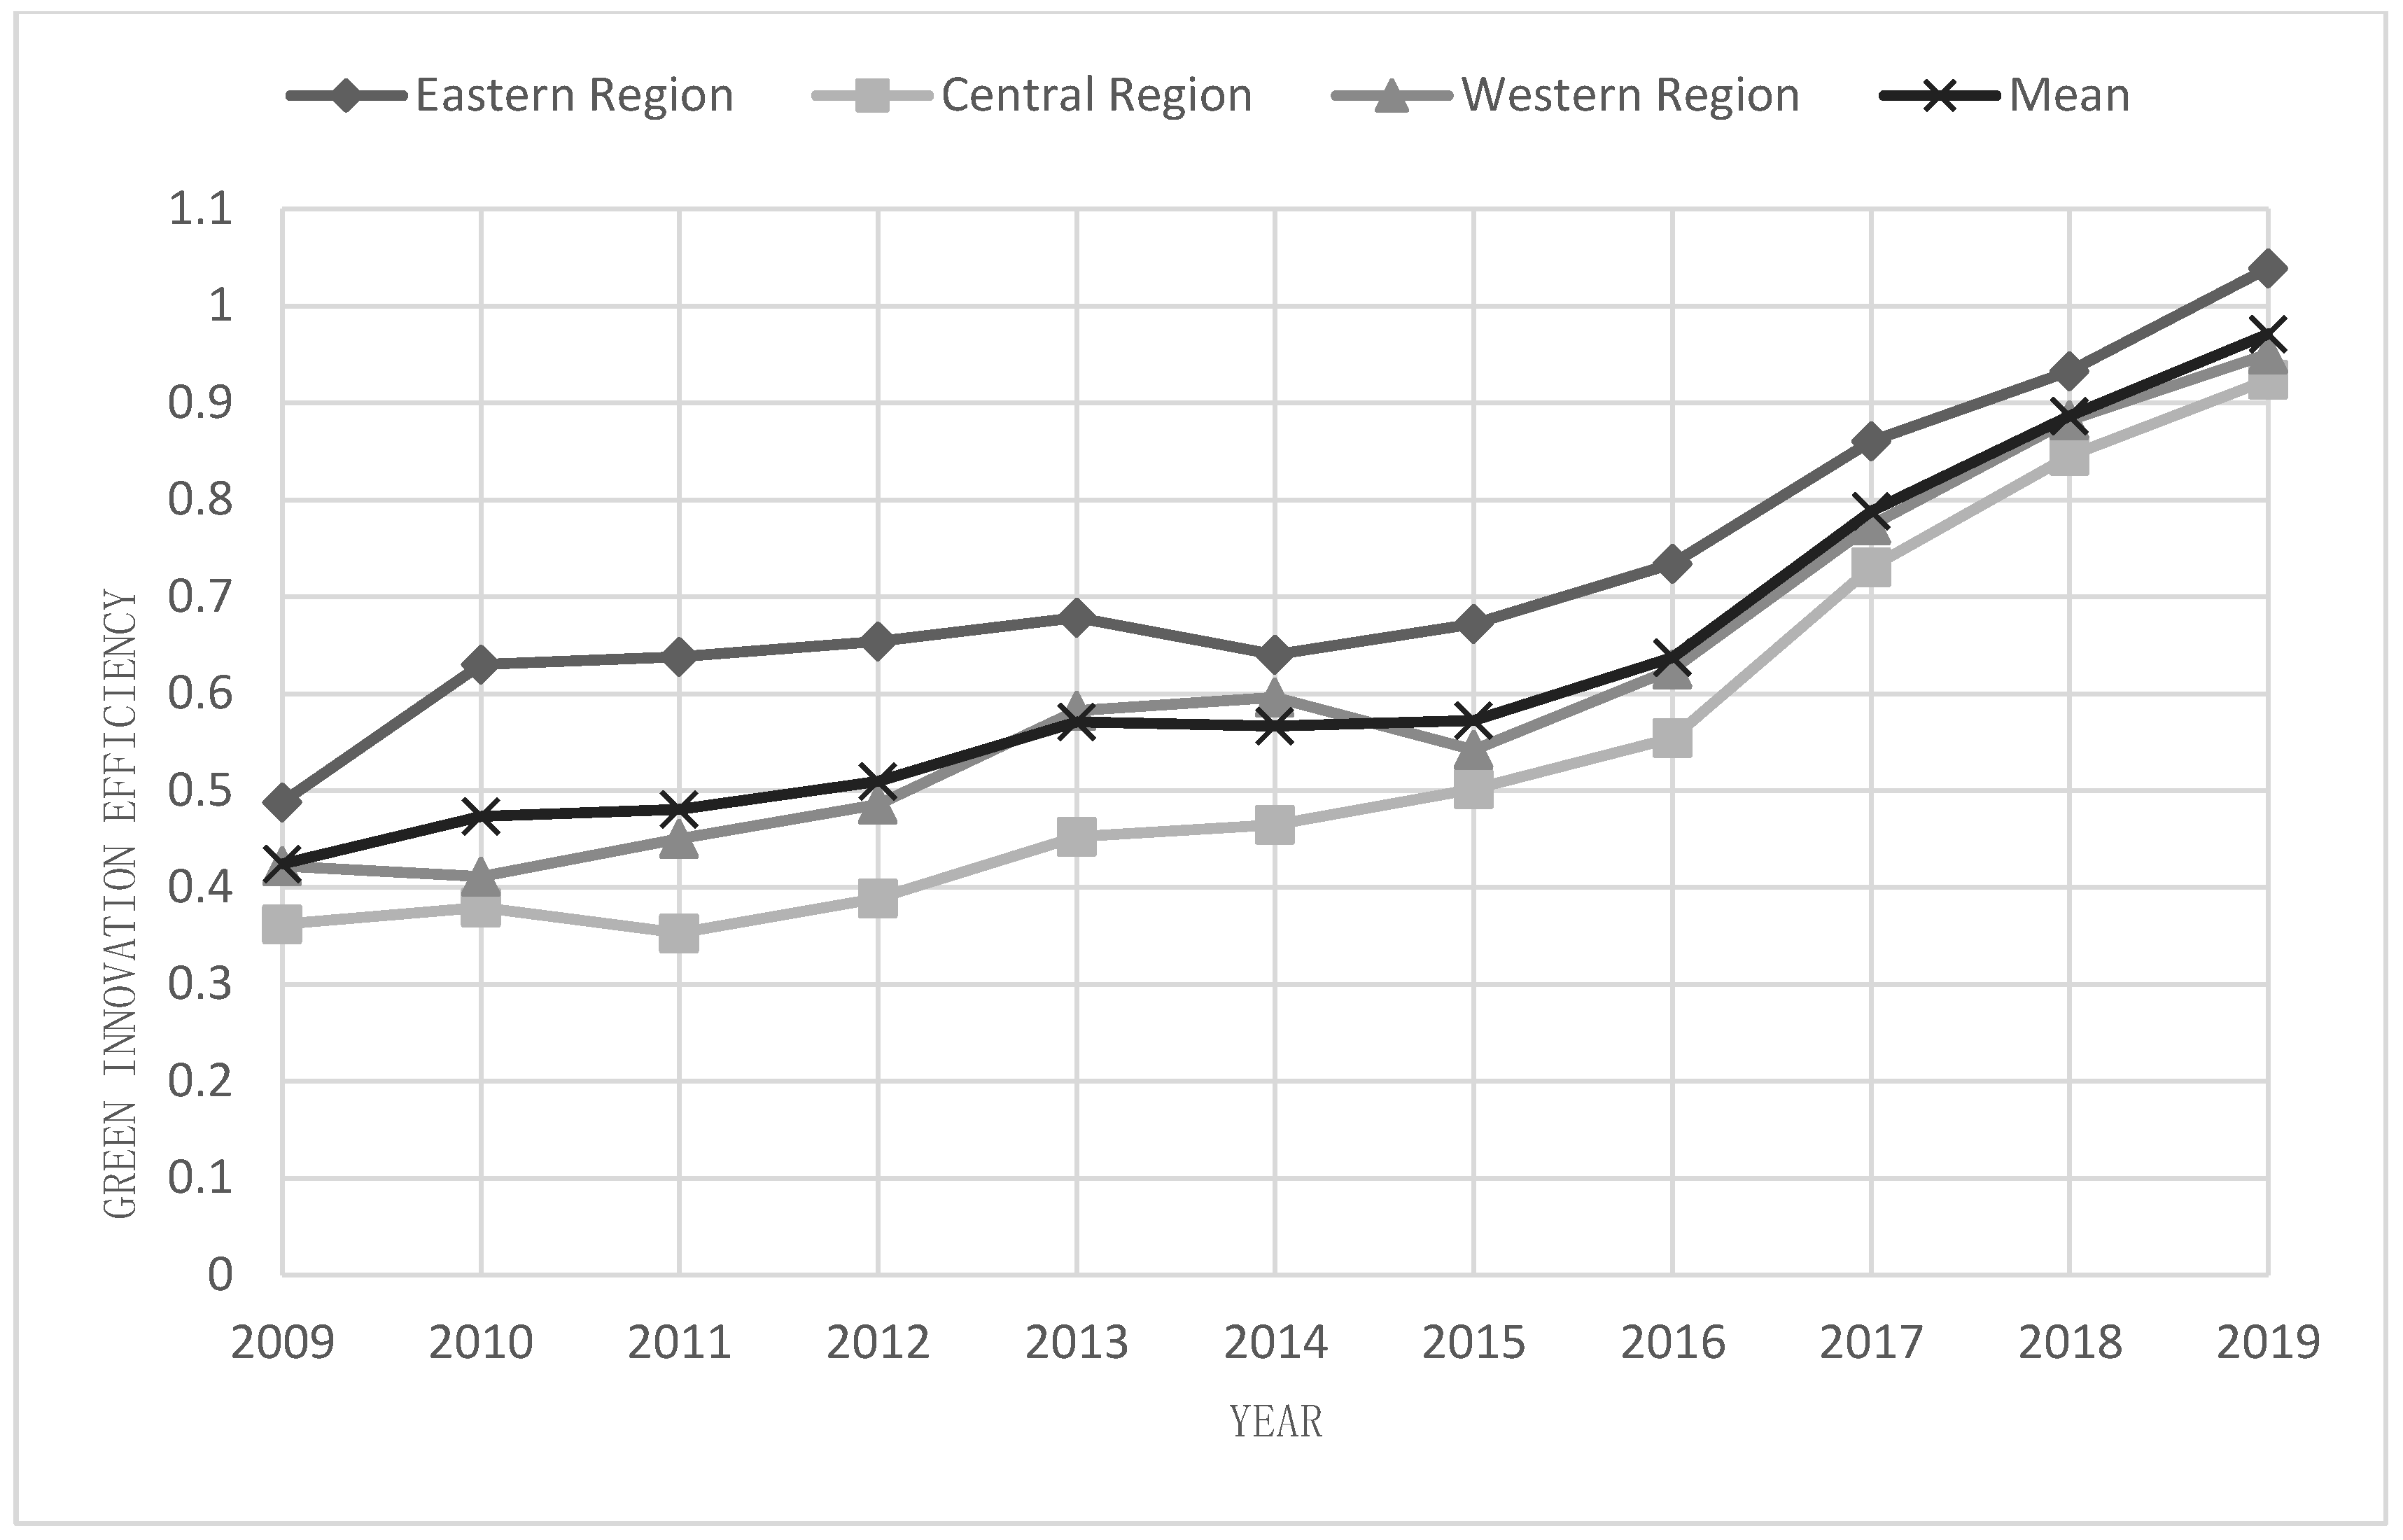
The green innovation efficiency of China’s tourism industry has been improving in general, and it has achieved rapid growth with the introduction of the five development concepts. From a regional perspective, the average value of the green innovation efficiency of tourism in the eastern region is always higher than that in the central and western areas, as well as the national average, and the gap between the three parts is gradually narrowing. The green innovation efficiency of tourism gradually tends to be balanced.
(2)
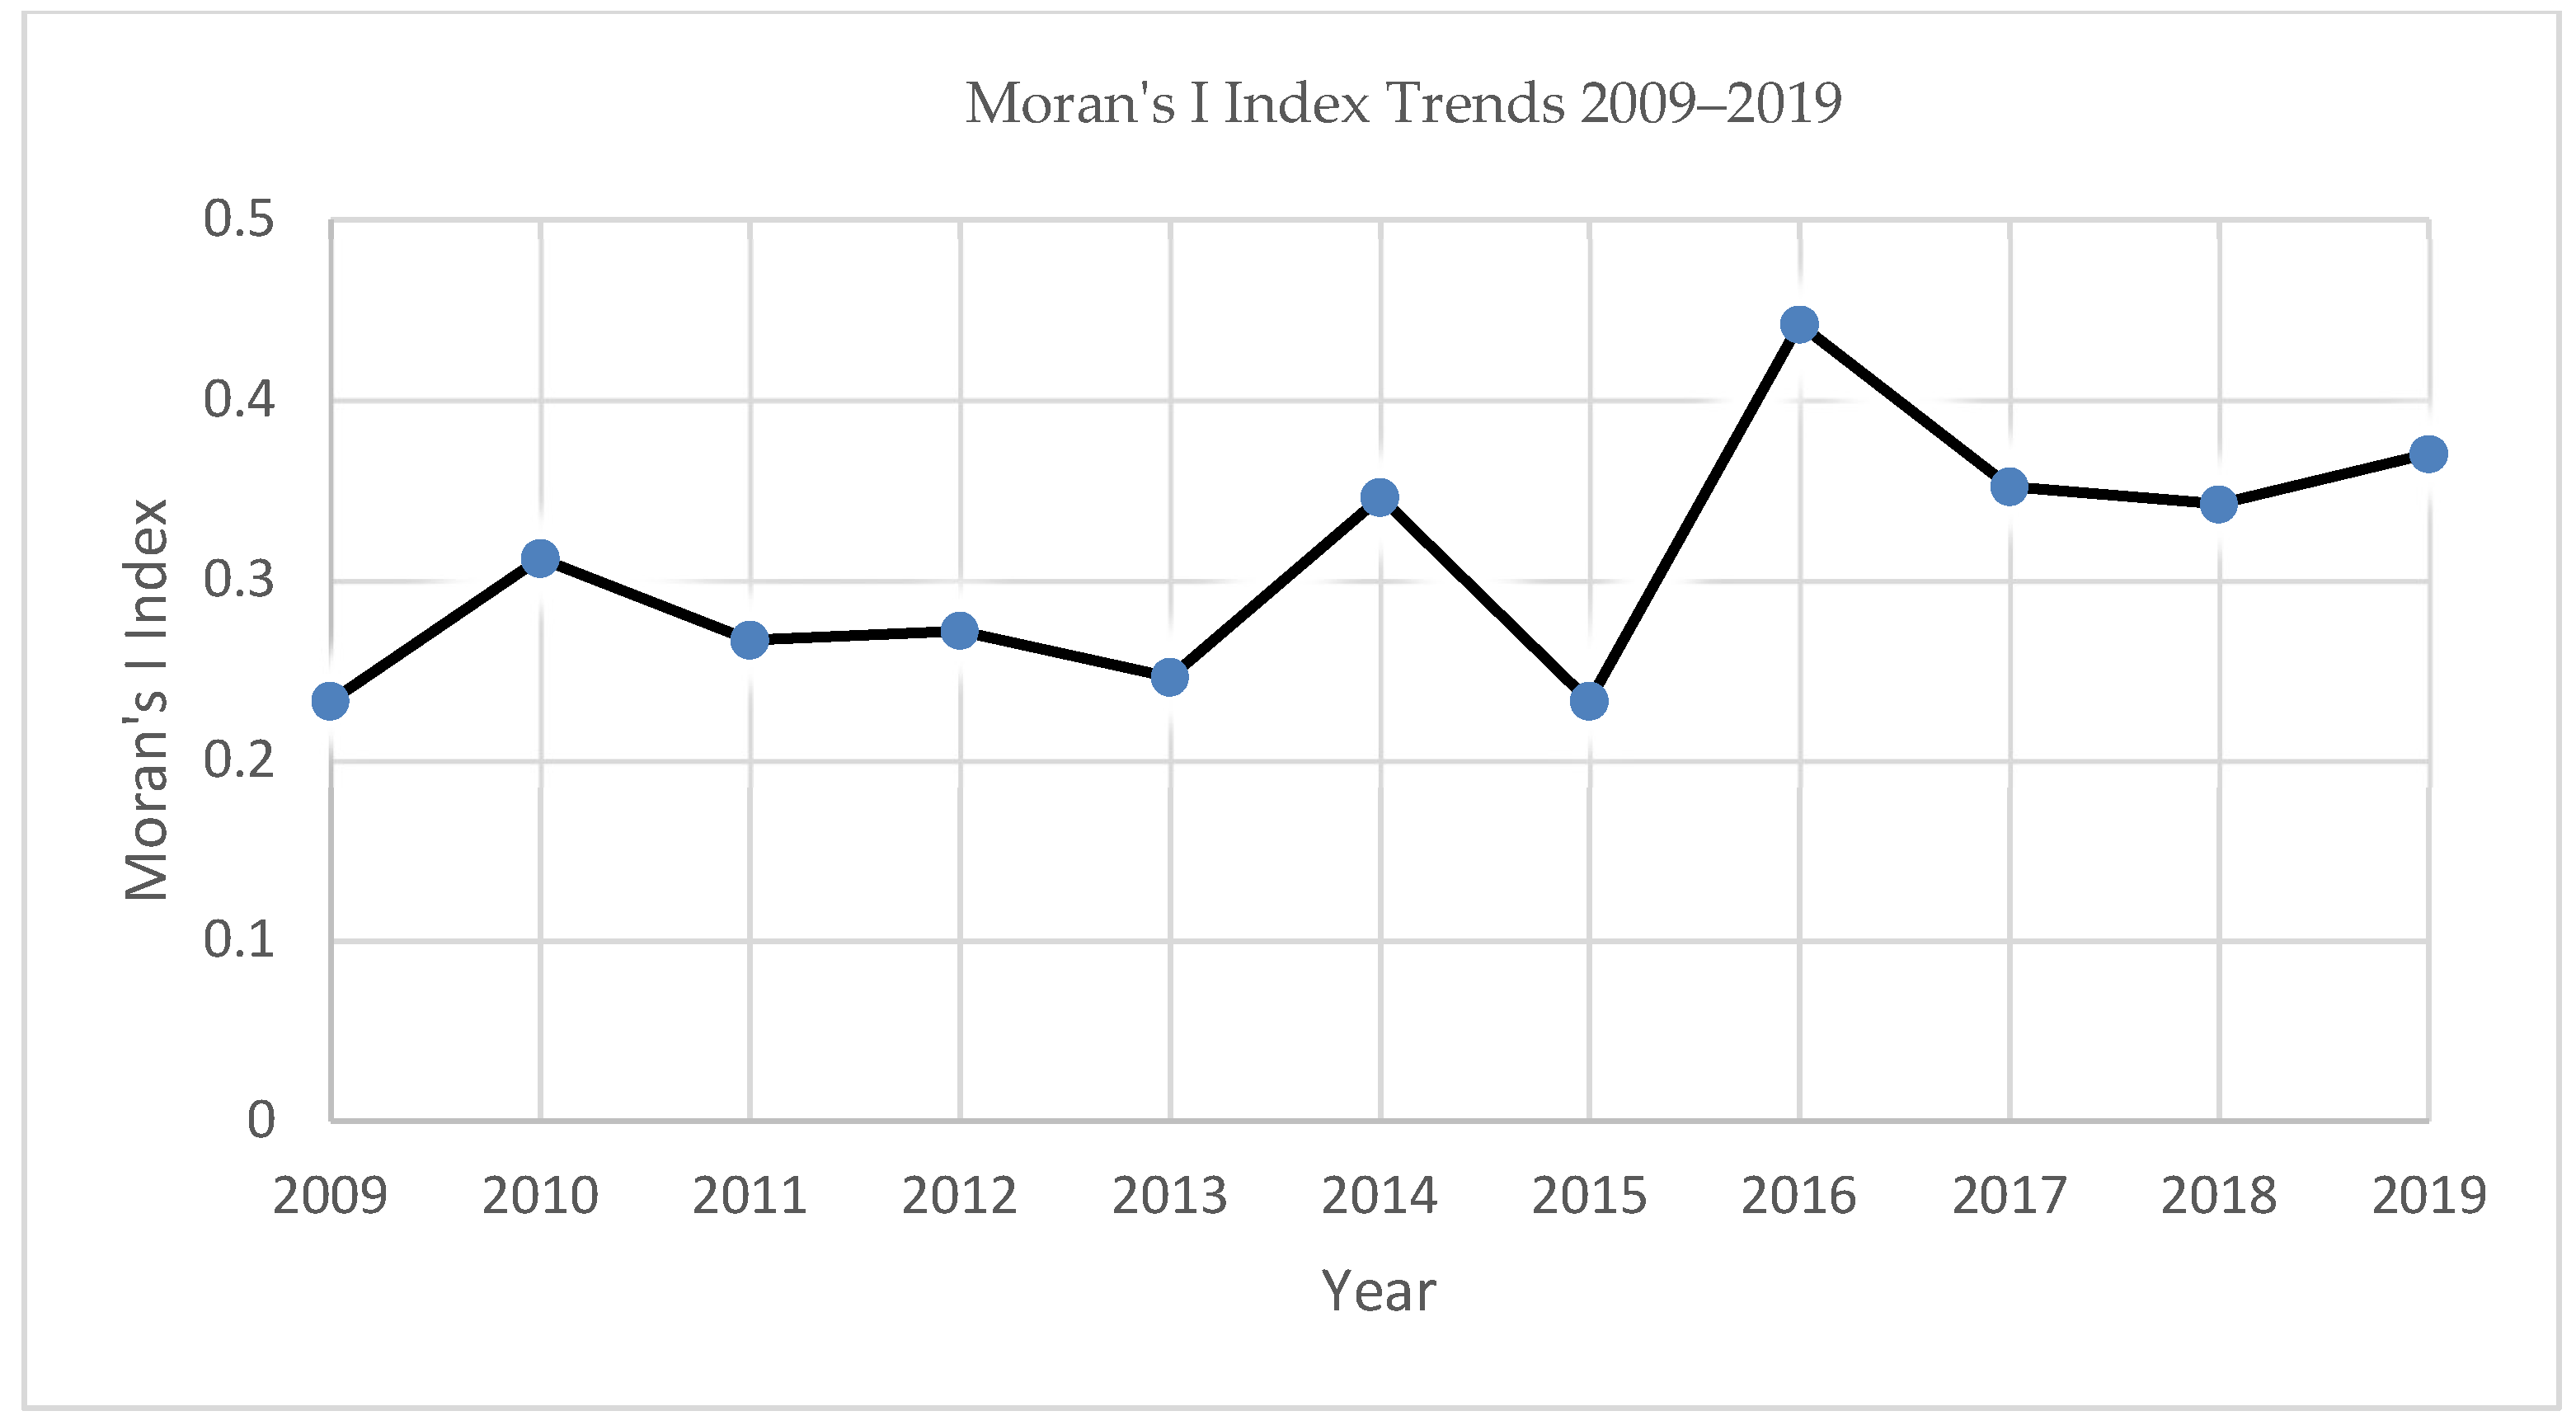
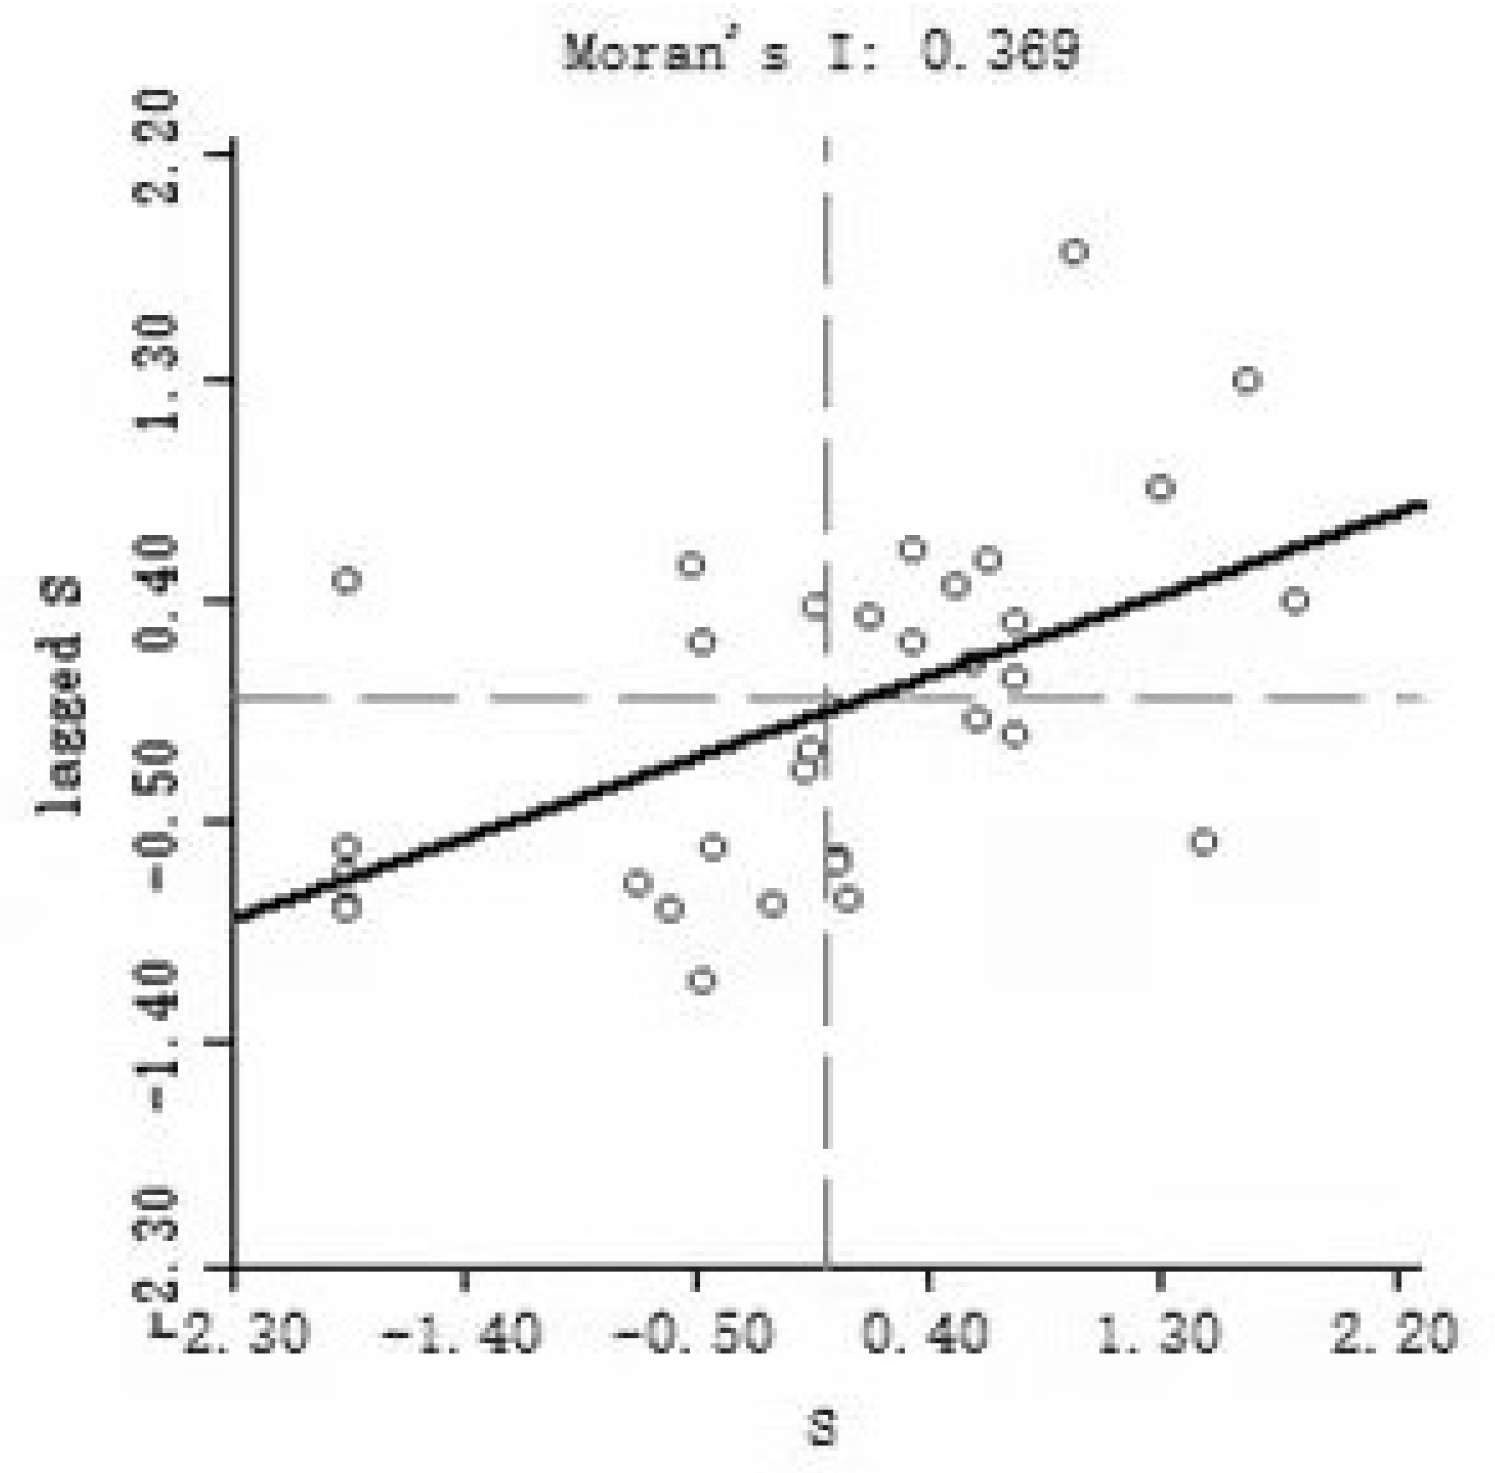
In terms of spatial distribution, the global Moran index is positive and shows a fluctuating upward trend, which indicates that the spatial aggregation of green innovation efficiency in China’s tourism industry is increasing. In the scatter plot of the mean local Moran index of green innovation efficiency in 30 provinces and cities, 22 provinces and cities in China are distributed in the first and third quadrants, which further leads to a similar conclusion as the global Moran index, i.e., high-high agglomeration and low-low agglomeration are more significant.
(3)
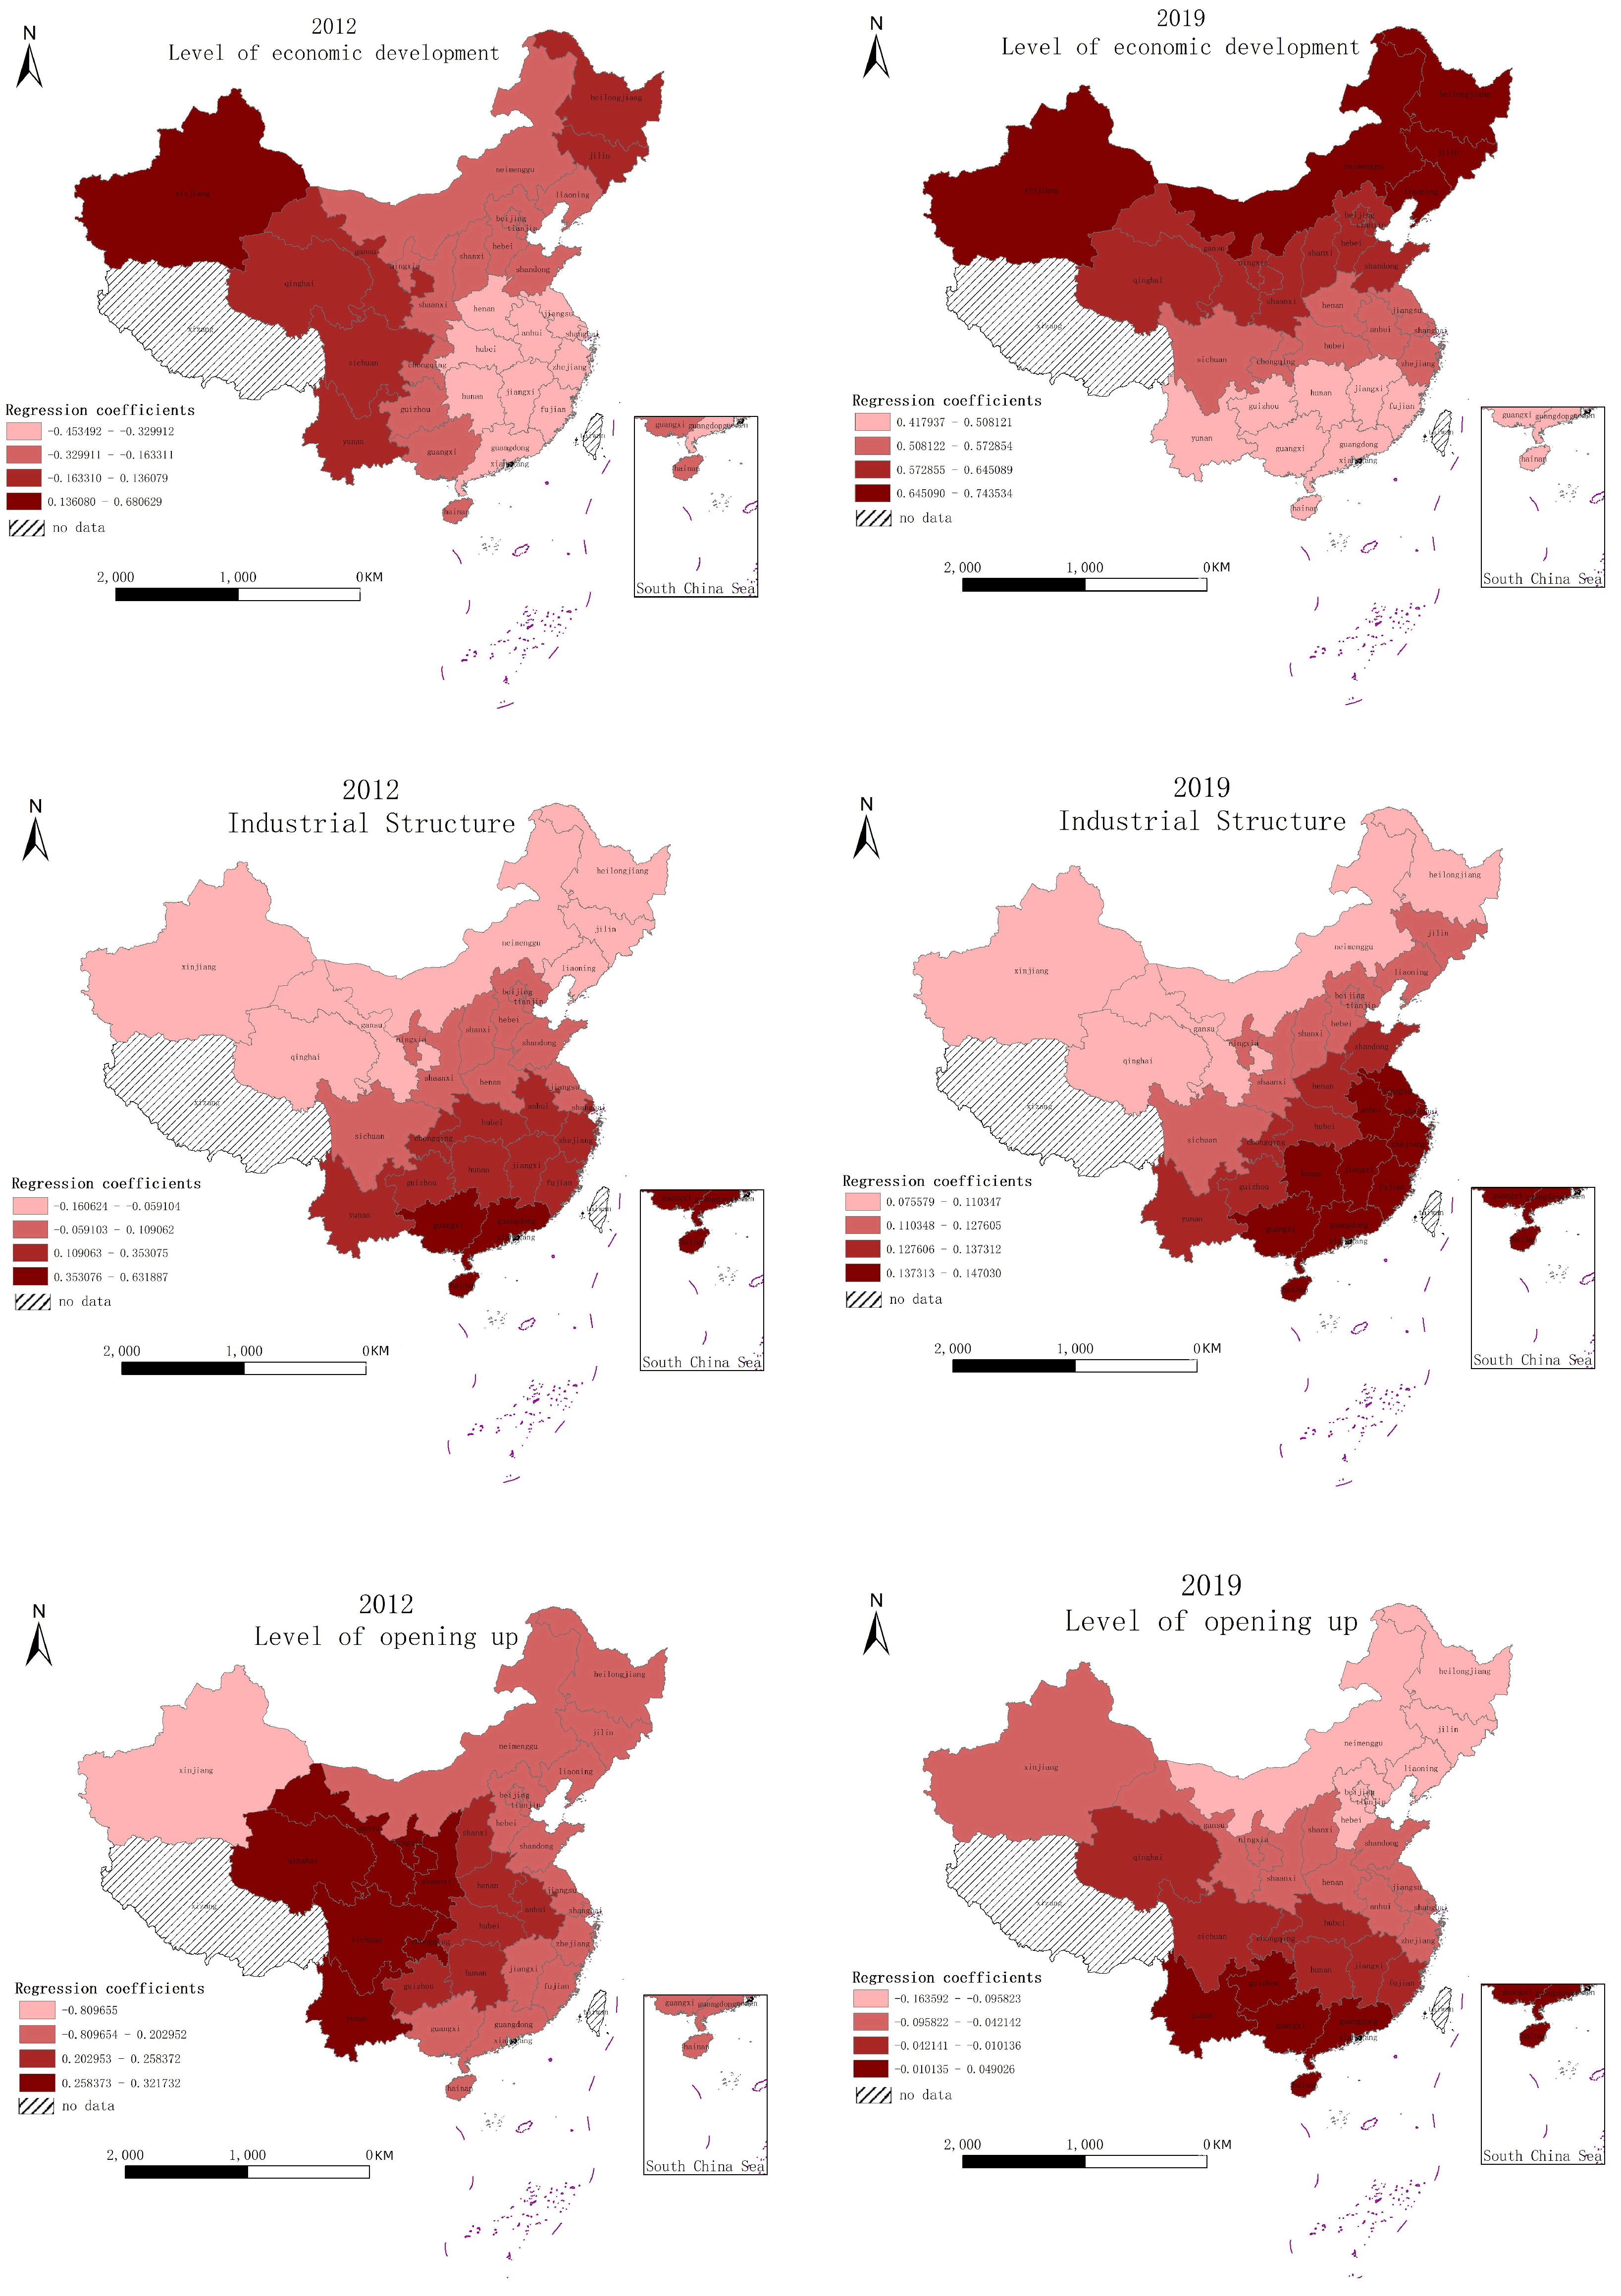
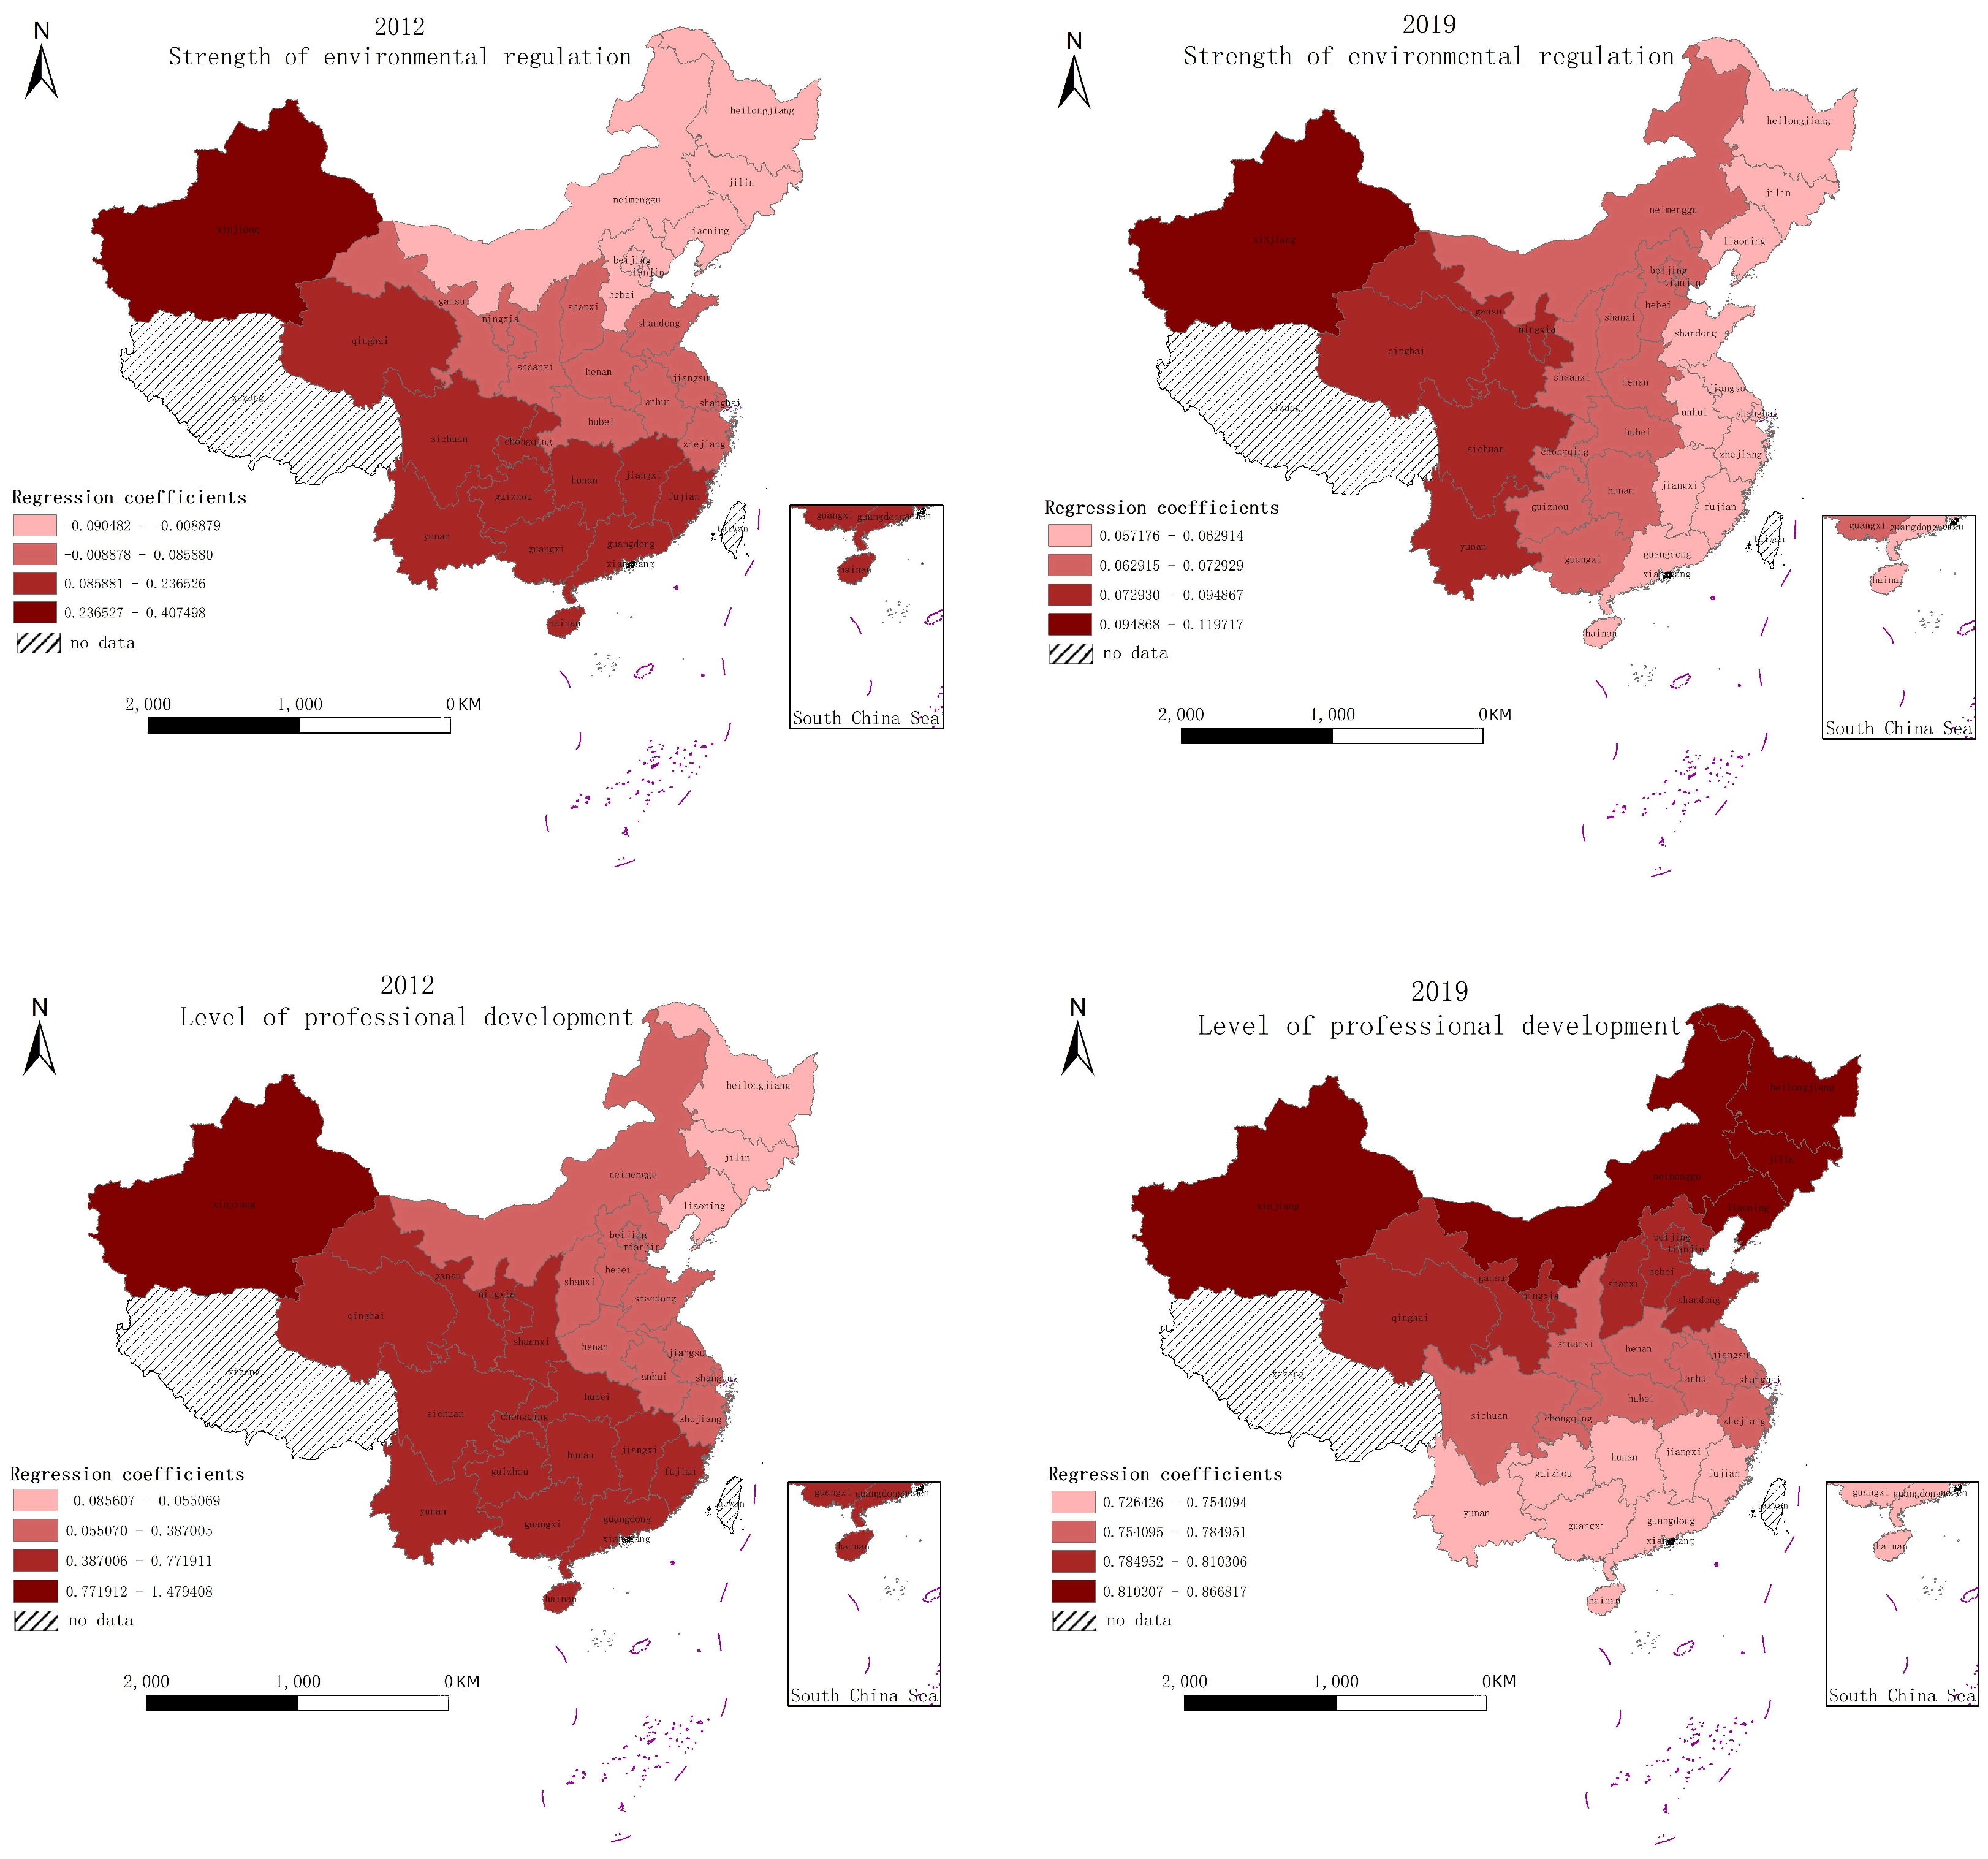
The green innovation efficiency of China’s tourism industry is influenced by many factors, the strength and tendency of various influencing factors differ from region to region, and the influence on green innovation efficiency of tourism industry has obvious spatial and temporal heterogeneity. Moreover, the level of economic development has a positive influence on green innovation efficiency and gradually decreases from northwest to southeast. The level of economic development has a positive impact on green innovation efficiency and decreases from the northwest to the southeast. The industrial structure and the degree of marketization have a significant positive impact on green innovation efficiency in general, showing a decreasing trend from the southeast to the northwest. The level of openness has a negative impact on the green innovation efficiency of tourism in some regions. The level of professional development of tourism has a significant positive influence on the green innovation efficiency of local tourism, and the influence gradually increases. The intensity of environmental regulation has a U-shaped relationship with local green innovation efficiency, and environmental regulation has not yet played a substantial role in promoting the green innovation efficiency of local tourism.

5.2. Policy Suggestions

Based on the results of the empirical analysis, we can put forward the following policy suggestions. First, the government should continue to promote the high-quality development of China’s economy, change the standard factor input and investment-driven crude development model, and then realize the fundamental transformation of economic growth from factor-driven to innovation-driven. Second, the government should continuously optimize the industrial structure, strengthen the role and position of tourism in the tertiary industry, and promote the unification of green and economic benefits of tourism. Third, the cooperation and exchange mechanism within each province and city should be improved to enhance communication and exchange in areas, such as infrastructure, tourism planning, collaborative innovation, pollution prevention, and control, and promote the optimal allocation of tourism resources and balanced and coordinated development. Fourth, the relevant government departments should set different standards for the intensity of environmental regulations according to the development characteristics of tourism in other regions, deepen institutional reform, and establish a sound legal system and environmental regulation system, so that the relationship between environmental regulations and green innovation efficiency will be in the rising stage on the right side of the “U” curve as soon as possible, i.e., to achieve a significant increase in the efficiency of environmental regulations on tourism. The efficiency of green innovation is greatly improved.

5.3. Limitations and Future Research

Tourism is a comprehensive industry that does not exist in isolation and is closely related to many industries. Although the measurement index system established in this paper integrally considers green innovation activities from the perspectives of innovation, environment, and resources, due to the limited academic ability, the selection of green innovation efficiency evaluation indexes is only based on reference to other scholars and the data available. The selection of index measurement is also relatively simple. Finally, due to the relevant statistical yearbook not being updated in time or containing incomplete disclosure, the data acquisition in this paper represents another limitation. Although the number of missing values is relatively small and is also compensated by scientific estimation, it still affects the accuracy of the empirical results to a certain extent.
From the perspective of the research object, this paper takes tourism as the research object to start the analysis, and the current tourism industry is deeply integrated with science, technology, culture, and the future. Hence, studies can focus on a certain segment of tourism industry, such as cultural tourism, rural tourism, etc. From the research perspective, this paper focuses on the green innovation efficiency of China’s tourism industry at the provincial level. With the combination of optimal capital allocation, policy guidance, and technology selection, urban cluster economies have flourished. Currently, China already has city clusters, such as the Yangtze River Delta city cluster, Beijing-Tianjin-Hebei city cluster, and Guangdong-Hong Kong-Macao Greater Bay Area. City clusters symbolize the increasing level of modernization and also represent one of the signs of high-quality economic development. In the future, I think we can start from the level of city clusters, update the data to the level of prefecture-level cities, and launch a valuable heterogeneity analysis to accurately grasp the level of green innovation efficiency of tourism in city clusters, which is of great practical significance to promote the efficiency of green innovation in regional tourism.

Author Contributions

Writing—original draft, K.Z.; Writing—review & editing, Y.Z.; Supervision, Y.Z. All authors have read and agreed to the published version of the manuscript.

Funding

This research was funded by the National Social Science Foundation of China “Research on Innovative Model of High-quality Development of China’s Marine Tourism under the Background of Consumption Upgrading” (19BJY208).

Institutional Review Board Statement

Not applicable.

Informed Consent Statement

Not applicable.

Data Availability Statement

Not applicable.

Conflicts of Interest

The authors declare no conflict of interest.

References

  1. James, P.; Fussler, C. Driving Eco-Innovation: A Breakthrough Discipline for Innovation and Sustainability; PitanPub: London, UK, 1996. [Google Scholar]
  2. Yang, S.Y.; Liu, W.; Zhang, Z. The Dynamic Value of China’s High-Tech Zones: Direct and Indirect Influence on Urban Ecological Innovation. Land 2022, 11, 59. [Google Scholar] [CrossRef]
  3. Wang, S.; Wang, X.L.; Lu, F.; Fan, F. The impact of collaborative innovation on ecological efficiency-Empirical research based on China’s regions. Technol. Anal. Strateg. Manag. 2021, 33, 242–256. [Google Scholar] [CrossRef]
  4. Farmaki, A. Regional network governance and sustainable tourism. Tour. Geogr. 2015, 17, 385–407. [Google Scholar] [CrossRef]
  5. Della Corte, V.; Del Gaudio, G.; Sepe, F.; Sciarelli, F. Sustainable Tourism in the Open Innovation Realm: A Bibliometric Analysis. Sustainability 2019, 11, 6114. [Google Scholar] [CrossRef] [Green Version]
  6. Santos, V.; Sousa, M.J.; Costa, C.; Au-Yong-Oliveira, M. Tourism towards Sustainability and Innovation: A Systematic Literature Review. Sustainability 2021, 13, 11440. [Google Scholar] [CrossRef]
  7. Du, J.L.; Liu, Y.; Diao, W.X. Assessing Regional Differences in Green Innovation Efficiency of Industrial Enterprises in China. Int. J. Environ. Res. Public Health 2019, 16, 940. [Google Scholar] [CrossRef] [Green Version]
  8. Zhang, K.R.; Jiang, W.L.; Xu, Y.S.; Hou, Y.; Zhang, S.; Liu, W. Assessing the corporate green technology progress and environmental governance performance based on the panel data on industrial enterprises above designated size in Anhui Province, China. Environ. Sci. Pollut. Res. 2021, 28, 1151–1169. [Google Scholar] [CrossRef]
  9. Click, B.; Baraniecka, A.; Jefmanski, B. Exploring Supply Chain Collaboration for Green Innovations: Evidence from the High-Tech Industry in Poland. Energies 2022, 15, 1750. [Google Scholar]
  10. Yang, J.P.; Wang, S.J.; Sun, S.; Zhu, J. Influence Mechanism of High-Tech Industrial Agglomeration on Green Innovation Performance: Evidence from China. Sustainability 2022, 14, 3187. [Google Scholar] [CrossRef]
  11. Gao, X.Y.; Lyu, Y.W.; Shi, F.; Zeng, J.; Liu, C. The Impact of Financial Factor Market Distortion on Green Innovation Efficiency of High-tech Industry. Ekoloji 2019, 28, 3449–3461. [Google Scholar]
  12. Razzaq, A.; Fatima, T.; Murshed, M. Asymmetric effects of tourism development and green innovation on economic growth and carbon emissions in top 10 GDP countries. J. Environ. Plan. Manag. 2021, 16, 1–30. [Google Scholar] [CrossRef]
  13. Gurley, M.; Koseoglu, M.A. Green innovation research in hospitality and tourism: The construct, antecedents, consequences, and future outlook. Serv. Ind. J. 2021, 41, 734–766. [Google Scholar] [CrossRef]
  14. Yue, X.G.; Liao, Y.; Zheng, S.Y.; Shao, X.; Gao, J. The role of green innovation and tourism towards carbon neutrality in Thailand: Evidence from bootstrap ADRL approach. J. Environ. Manag. 2021, 292, 112778. [Google Scholar] [CrossRef]
  15. Liu, Y.; Deng, M.R. Institutional support system for green innovation of ecotourism products in the central and western regions. Sci. Technol. Prog. Countermeas. 2006, 2, 108–111. [Google Scholar]
  16. Liu Jia Song, Q.Y. Spatial network structure and formation mechanism of green innovation efficiency in the Chinese tourism industry. China Popul. Resour. Environ. 2018, 28, 127–137. [Google Scholar]
  17. Liu, J.; Xu, W.Q. Spatial and temporal divergence and formation mechanism of green innovation efficiency in China’s coastal tourism industry under carbon emission constraints. Resour. Dev. Mark. 2022, 38, 538–545. [Google Scholar]
  18. Li, J.H.; Xiao, L. The coupled coordination and spatial and temporal divergence of regional eco-efficiency and tourism industry efficiency: A sample of nine cities (states) in Guizhou Province. Ecol. Econ. 2022, 38, 121–127. [Google Scholar]
  19. Li, G.; Yu, Q.F. Tourism economy in Yangtze River Delta-Eco-efficiency measurement and analysis of influencing factors. J. Shenyang Univ. Technol. 2021, 1–8. [Google Scholar]
  20. Liu, J.; An, K. Evaluation of green innovation efficiency and analysis of influencing factors in China’s tourism industry under the goal of “double carbon”. J. Southwest Univ. Natl. 2022, 43, 29–40. [Google Scholar]
  21. Wei, Q. Data Envelopment Analysis (DEA). Sci. Bull. 2000, 1793–1808. [Google Scholar]
  22. Tone, K. A slacks-based measure of efficiency in data envelopment analysis. Eur. J. Opera Res. 2001, 130, 498–509. [Google Scholar] [CrossRef] [Green Version]
  23. Kaoru, T. A Slacks-Based Measure of Super-Efficiency in Data Envelopment Analysis; Elsevier B.V.: Amsterdam, The Netherlands, 2002; Volume 143. [Google Scholar]
  24. Wang, Y.K.; Guo, H. Study on the Spatial and Temporal Differentiation and Convergence of Xinjiang Tourism Ecological Efficiency. Geogr. Arid. Areas 2022, 45, 1320–1331. [Google Scholar]
  25. Wei, Z.X.; Guo, W. Study on space-time characteristics and influencing factors of tourism ecological efficiency. Ecol. Econ. 2021, 37, 111–119. [Google Scholar]
  26. Liu, Z.L.; Lu, C.P.; Mao, J.H.; Sun, D.; Li, H.; Lu, C. Spatial-Temporal Heterogeneity and the Related Influencing Factors of Tourism Efficiency in China. Sustainability 2021, 13, 5825. [Google Scholar] [CrossRef]
  27. Liu, J.; Zhang, J.F.; Fu, Z.B. Tourism eco-efficiency of Chinese coastal cities-Analysis based on the DEA-Tobit model. Ocean Coast. Manag. 2017, 148, 164–170. [Google Scholar] [CrossRef]
  28. Dong, H.Z.; Cao, Z.X.; Zhang, R.J. Identification of green innovation efficiency and influencing factors in two stages of Chinese high-tech industry. Stat. Decis. Mak. 2022, 44–49. [Google Scholar]
  29. Wang, Z.Y.; Wang, Z.F. Spatial and temporal evolution of tourism industry efficiency in the Yangtze River Economic Zone under carbon emission constraints and the influencing factors. Yangtze River Basin Resour. Environ. 2021, 30, 280–289. [Google Scholar]
  30. Zhu, D.; Luo, Y.S.; Lu, Z.N. Environmental regulation, industrial agglomeration and green innovation efficiency. Stat. Decis. Mak. 2021, 37, 53–57. [Google Scholar]
  31. Zhao, C.Y.; Shang, M.Y.; Zhao, Y.N. Two-way FDI and green innovation efficiency in China in the context of “double-loop”-AS moderating analysis based on the level of marketization. Bus. Res. 2022, 144–152. [Google Scholar]
  32. Lu, X.; Shi, P.; Deng, Z.; Li, X.; Hu, Y. Green productivity measurement and spatial and temporal evolution analysis of tourism in Yangtze River Economic Zone. China Popul. Resour. Environ. 2019, 29, 19–30. [Google Scholar]
  33. Ma, X.F.; Tan, J.X.; Huang, J. Research on the process of regional tourism industry agglomeration and its influencing factors—Take Xiangxi region as an example. J. Tour. 2021, 36, 13–27. [Google Scholar]
  34. Hao, S.Y.; Zhang, Y.H. Research on the impact of environmental regulation on economic agglomeration—Based on the perspective of new economic geography. Soft Sci. 2016, 30, 27–30. [Google Scholar]
  35. Lian, Y. Economic hierarchy and environmental pollution: A study of ecological Kuznets curve based on carbon emissions. Stat. Decis. Mak. 2021, 37, 146–150. [Google Scholar]
  36. Zhu, J.H.; Wang, Y.L. Innovation compensation or compliance cost? Pollution halo or pollution paradise?—Testing the threshold effect and spatial spillover effect of the dual hypothesis from the perspective of green total factor productivity. Sci. Technol. Prog. Countermeas. 2018, 35, 46–54. [Google Scholar]
  37. Xu, H.; Li, G.Y. Research on the impact of environmental regulation on the efficiency of green innovation. Res. Financ. Econ. 2018, 42, 52–58. [Google Scholar]
Figure 1. The trend of green innovation efficiency changes in the regional tourism industry, 2009–2019.
Sustainability 14 16458 g001
Figure 2. The trend of Moran’s I index of green innovation efficiency in tourism in 30 Chinese provinces and cities, 2009–2019.
Sustainability 14 16458 g002
Figure 3. Scatter plot of the average value of green innovation efficiency of tourism in 30 provinces of China from 2009 to 2019.
Sustainability 14 16458 g003
Figure 4. Spatial variation of regression coefficients of influencing factors of the geographically weighted regression model of green innovation efficiency of the Chinese tourism industry.
Sustainability 14 16458 g004aSustainability 14 16458 g004b
Table 1. Tourism green innovation efficiency evaluation index system.
Primary IndicatorsSecond-Level IndicatorsTertiary Indicators
Input indicatorsHuman inputNumber of employees in the tourism industry
Financial inputTourism industry research funds
Resource inputNumber of tourism scenic spots above grade 3A
Green Innovation InputsGreening coverage rate of built-up areas
Output indicatorsDesired OutputsNumber of tourism colleges and universities
Total tourism revenue
Number of tourism patents
Non-desired output indicatorsTourism industry wastewater emissions
Tourism solid waste emission
Table 2. Mean Moran index and test results of green innovation efficiency in China’s tourism industry, 2009–2019.
YearMoran’s Ip-ValueZ-Value
20090.2330.0063.216
20100.3120.0093.304
20110.2670.0232.481
20120.2720.0162.366
20130.2460.0272.140
20140.3460.0042.832
20150.2330.0312.001
20160.4420.0003.749
20170.3520.0052.785
20180.3420.0023.318
20190.3700.0033.719
Table 3. Results of covariance test for independent variables in 2012 and 2019.
YearEDINFDIMDTSER
20123.292.252.843.031.221.28
20194.043.362.722.641.361.25
Table 4. Results of the GWR model for green innovation efficiency in the Chinese tourism industry.
GWR Model Parameters20122019
Bandwidth1,355,3742,535,886
Residual Squares0.200.79
Effective Number16.3210.60
Sigma0.110.19
AICc15.223.42
Adjusted R20.880.79
Adjusted R20.810.69
Publisher’s Note: MDPI stays neutral with regard to jurisdictional claims in published maps and institutional affiliations.

