Article

Wheat Straw Burial Enhances the Root Physiology, Productivity, and Water Utilization Efficiency of Rice under Alternative Wetting and Drying Irrigation

by
Willy Franz Gouertoumbo
1,†,
Yousef Alhaj Hamoud
1,†,
Xiangping Guo
1,*,
Hiba Shaghaleh
2,
Amar Ali Adam Hamad
2 and
Elsayed Elsadek
3,4
1
College of Agricultural Science and Engineering, Hohai University, Nanjing 210098, China
2
College of Environment, Hohai University, Nanjing 210098, China
3
College of Agriculture, Damietta University, Damietta 34517, Egypt
4
College of Hydrology and Water Resources, Hohai University, Nanjing 210098, China
*
Author to whom correspondence should be addressed.
These authors contributed equally to this work.
Sustainability 2022, 14(24), 16394; https://doi.org/10.3390/su142416394
Submission received: 26 October 2022 / Revised: 28 November 2022 / Accepted: 29 November 2022 / Published: 7 December 2022

Abstract

:
This study evaluated whether the straw burial and alternative wetting and drying (AWD) irrigation could improve the root activity, yield, and water utilization efficiency (WUE) of rice. Accordingly, we conducted a field experiment with three straw burial levels, i.e., with no straw burial (NSB), low straw burial 300 kg.ha−1 (LSB), and dense straw burial 800 kg.ha−1 (DSB), and three irrigation regimes, i.e., alternate wetting/moderate drying (AWMD), alternate wetting/severe drying (AWSD), and alternate wetting/critical drying (AWCD). Results showed that straw burial improved the root activity, rice yield, and WUE under AWD regimes. The combination AWMD×DSB resulted in the greatest values of total dry mass (1764.7 g/m2) and water use (853.1 mm). Conversely, the treatment AWCD × NSB led to the lowest values of total biomass (583.3 g/m2) and water use (321.8 mm). Root dry weight density (1.11 g cm−3) and root active absorption area (31.6 m2 plant−1) were higher in the treatment AWMD × DSB than root dry weight density (0.41 g cm−3) and root active absorption area (21.2 m2 plant−1) were in the treatment AWCD×NSB. The former combined treatment increased root oxidation ability (55.5 mg g−1 FWh−1), the root surface phosphatase activity (1.67 mg g−1 FWh−1) and nitrate reductase activity of root (14.4 μg g−1 h−1) while the latter considerably reduced the values of root oxidation ability (21.4 mg g−1 FWh−1), the root surface phosphatase activity (0.87 mg g−1 FWh−1) and nitrate reductase activity of root (5.8 μg g−1 h−1). The following conclusions can be drawn with regard to water use and biomass yield. (i) The reduction in water consumption was greater than the reduction in yield in the case of AWSD. (ii) The decline in water consumption was less than the decline in biomass yield in the case of AWCD. (iii) The increase in in water consumption was greater than the increase in biomass yield in the case of AWMD. Therefore, the indicators of WUE were recorded in the following order: AWSD > AWMD > AWCD. This study recommends AWD irrigation to improve the root growth traits that contribute to the greater biomass yield of rice. It also suggests that farmers should implement AWD irrigation after leaving wheat straw residues in the field, and followed by deep tillage, to mitigate the negative effect of drought stress caused by AWD irrigation, preserving plant growth without large biomass losses, and thus, addressing the constrains of straw residues and sustaining rice production under limited freshwater resources.

1. Introduction

Freshwater resources have become limited in many countries worldwide due to climate changes and environmental contamination [1,2]. Rice is the world’s leading staple food source, accounting for 11% of globally cultivated area and using 70% of global agricultural water resources [3]. About 92% of rice yield is produced within Asia [4], and paddy fields use 50% of freshwater resources [5]. However, the yield level is below consumer demand [6]. Thus, a rise of 8–10 million tons per year in rice yield is currently needed to meet the upcoming global food requirements [7].
In China, rice farms use 65% of freshwater resources [3]. Moreover, approximately 23% of Chinese agricultural area is dedicated for rice production, accounting for 20% of the world’s entire cultivated area [8]. Furthermore, nearly 90% of the Chinese rice production area is cultivated under continuous flooding (CF) irrigation [9]. Therefore, many practices, such as non-ponded mulch farming and alternative wetting/drying (AWD) irrigation regimes, have been designed to adapt with the scarcity of freshwater resources [10,11,12]. Hence, improving water use efficiency (WUE) in cultivating rice and decreasing the gap between water resources and usage are central issues in ensuring food safety during water shortage [13,14]. However, the worsening freshwater shortage can increase competition for freshwater resources over the next decades. Thus, rice production systems with water-efficient strategies should be introduced [14,15].
Recent studies have stated that AWD irrigation has reduced the use of water [16], increasing the WUE of rice compared with flooding irrigation [17]. However, AWD irrigation increases water leakage and declines yield and, consequently, the WUE of rice grown in clay soil [18] as the topsoil layer is dried out during drying cycles, and desiccation cracks are dominant on the soil surface [19]. Cracks in soil increase water penetration rates, allowing deeper leakage of water [20] into the deeper subsoil [21] and leaching nutrients down to the rhizosphere [22]. AWD cycles also adversely trigger soil properties that regulate plant–nutrient availability [23,24,25]. Moreover, plant–nutrient uptake in rice under AWD regime is less than that under CF regime due to the reduction in plant–nutrient accessibility [26,27]. The magnitudes of all these changes indicate that AWD irrigation needs to reduce the water loss associated with deep percolation and water evaporation from the topsoil surface, thus enhancing nutrient availability and preserving soil properties [14,28], and consequently, improving the yield and WUE of rice [29].
Agricultural cellulosic residues have been the subject of considerable research recently [30,31], and the return of agricultural crop straw residues is higher than 9 × 10⁸ tons per year in China. Only 15% of these agricultural residues are used for construction materials and feedstuff for livestock. The remaining amount of stubble residues is cleaned to prepare the land for the next crop season [32]. Mulching the soil surface with straw residues is an effective technique to increase the grain yield of rice and soil quality [33,34]. For example, compared with the conventional rice system, straw mulching treatments improved root growth [35], biomass [36], and rice WUE [37]. It also conserved nearly 61–94% of water applied in irrigation [37]. In addition, the straw mulching strategy increases soil organic matter content [38] and reduces evapotranspiration, improving plant growth and yield [39]. Furthermore, returning straw residues to the soil surface affects water content [40] by increasing the soil’s capability to preserve water and enhancing the drainage property of soil (Ranjan et al., 2017), improving crop productivity and soil quality [41]. However, crop control and management are not easy under straw mulching cultivation; moreover, straw can attract pathogens and insects and disturb the impact of rainfall on the soil surface [42].
Embedding straw layers into subsoil can clearly influence water and soil management approaches [43,44,45]. The buried straw layers enhance soil water content by delaying water infiltration after irrigation [46] and reducing water percolation [47]. Moreover, straw burial is considered a viable option to improve soil biological and microbial activity and fertility, reducing weed development, and thus enhancing the quality, productivity, and sustainability of agricultural production systems [48]. Hence, subsoil straw burial can alter soil quality. However, plant growth adaptation under AWD irrigation and straw burial is not well understood.
Rice root activity is changed by changes in the growth environment [18,49]. Root activity is also regulated by the moisture content availability. In addition, vigorous plant roots result in large rice production [50]. However, knowledge is limited with regard to root physiological characters and their relationships to the rice yield and WUE with straw burial under the AWD system. Thus, knowledge of plant responses to a varying soil environment is required to decide the appropriate straw burial amount for rice production under AWD irrigation. Accordingly, our study hypothesized that embedding the wheat layer at a depth of 40 cm below the topsoil can prolong soil water residence period in the layer above, which maximize the quantity of water and nutrients of the topsoil, because water slowly infiltrates the soil profile. Thus, subsoil straw burial can reduce water loss without affecting or disturbing root penetration, and consequently improve the root physiological traits, biomass, and WUE of rice. Moreover, the current study assumes that straw burial can improve the soil moisture storage in the irrigated paddy field, contributing to increasing the yield and WUE of rice.

2. Materials and Methods

2.1. Experimental Location Characterization

A field experiment was conducted from June to November 2020 in the agricultural farm of Hohai University (35.31° N, 113.87° E), Nanjing, China. The area is characterized by a humid subtropical weather. The rainfall season is in summer from July to September. The annual mean temperature is 16 °C, the absolute maximum temperature reaches 43 °C in July, and the absolute minimum temperature drops to −16.9 °C in winter in January. The average yearly rainfall is approximately 1062 mm, which is condensed in summer. Weather data used during the trial are shown in Table 1.
The soil properties are as follows: silt (53.7%), clay (27.8%), sand (18.5%), pH (7.0), soil total porosity (41%), bulk density of soil (1.25 g/cm3), soil total nitrogen (N) (1.3 %), soil available N (47.5 mg.kg−1), soil total phosphorus (P) (307.5 mg.kg−1), soil available P (13.2 mg.kg−1), soil available potassium (K) (92.6 mg.kg−1), and total organic matter of soil (1.18%).

2.2. Experimental Scheme, Treatments, and Cultural Practices

In this trail, we performed a split plot design that included three repetitions. The main plot was the AWD irrigation regime, with three watering managing options achieved as follows: (1) submerging soil surface with 5 cm standing water depth once water content arrived 100–90% saturation, AWMD; (2) submerging soil surface with 5 cm standing water depth once soil water content arrived 80–70% saturation, AWSD; and (3) submerging soil surface with 5 cm standing water depth once soil water content arrived 70–60% saturation, AWCD. Wetting/drying cycles were applied during the entire development period, except for the yellow ripening and maturation stages, in which soil was naturally dried.
Buried wheat straw layers of different densities, i.e., 0, 300, and 800 kg/ha, which correspond to no straw burial (NSB), low or light straw burial (LSB), and dense straw burial (DSB), respectively, were applied to the subplot. The straw was collected from nearby wheat fields. To evaluate the chemical composition of straw, the water content of 100 g of straw sample was adjusted to nearly 8%. Then, the sample was minced using a sharp knife with a 2 mm sieved and separated through 850 mm and 180 mm stackable screens to define the structure of the straw by applying the analytical process suggested by the National Renewable Energy Laboratory (NERL) [51]. The organic matter of wheat straw was 95.35% of the total dry matter; it basically included acid-soluble lignin (2.2%), cellulose (36.0%), hemicellulose (20.3%), and acid-insoluble lignin (18.7%); this composition is consistent with the recent literature [31,52]. Without using any treatment, straw was chopped into 10–15 cm pieces with a chopper. Soil was plowed, and then followed by laddering, and thus experimental plots were prepared. Each plot measured 1 m (length) × 1 m (width) and was well separated by ridges as artificial barriers covered by a film of plastic to prevent lateral water flow between plots. Burial chambers were prepared by plowing soil at 20 cm intervals. Then, straw layers with a thickness of about 5–7 cm were buried in the subsoil to a depth of 40 cm, and plowed soil was repacked and flattened to a bulk density that corresponded to the original value. The layers of wheat straw were embedded into the subsoil 10 days before transplanting of the seedling (Figure 1).
The rice (Oryza sativa L.) cultivar Nanjing 44, which is described by high resistance to pests and viruses and high yield was used in this experiment. Seedlings grown for 30 days were relocated at an intensity of 20 hills.m−2, with three plants per hill. The fertilizers applied were superphosphate (12%, P2O5) as P fertilizer, urea (46% N) as N fertilizer and potassium chloride (60% K2O) as K fertilizer. The N, P, and K nutrients were supplied in the amounts of 250, 90, and 80 kg/ha, respectively. As a local growers’ fertilizer method, 40% N and entire K and P were applied as a basal dosage combined with the soil. The residual N amount was applied as 20% at tillering–booting, 20% at panicle initiation–full heading, and 20% at full heading–milk ripening. Experimental plots were frequently weeded until canopy leaves were fully crowded. To avoid yield loss, insects and diseases were controlled. The final harvest was conducted in the 5th of November 2020.

2.3. Determination of Root Physiological Characteristics

Three plant saplings were selected at tillering, full heading, and milk ripening. The soil–root columns were collected for each plot, and the roots were isolated from the soil. Fresh rice roots were air-dried, and the mass of the roots was recorded. The root dry weight (RDW, g m−2) of rice was calculated from the fresh mass and the root’s water content, which was calculated by taking a 0.5 g sample and then oven-drying it for 72 h at 75 °C for 72 h. The (%) water content was calculated through weighing the obtained sample to estimate the amount water was lost. Root weight density (RWD, g cm−3) was estimated from the root dry mass and the soil column volume (cm3) [53]. Suppose that fresh roots had a density of 1.0 g cm−3 and were cylindrical (Barber, 1984). The average root radius (r0) was calculated as follows:
r 0   = RFW / RL × π 0.5
where RFW is the root fresh weight (g) of rice, and RL is the root total length (cm) of rice. The latter was measured using the grid method, with the help of an optical microscope [54]. Thus, root surface area (RSA, m2 plant−1) was determined as follows:
TSA = 2 × r 0   × π × RL
The nitrate reductase activity of roots (RNR, μg g−1 h−1) was measured using the assay blend that comprised K3PO4 buffer, M KNO3, NADH, and NaHCO3. Tests were conducted for 15 min at 30 °C, and the reaction was postponed by adding Zn(CH3COO)2. The surplus NADH was oxidized through the addition of phenazine methosulfate. The produced blend was centrifuged at 10,000× g for 5 min. The NO2− level was measured through the integration of the supernatant with sulfanilamide prepared from HCl and N-(1-naphthyl) ethylene-diamine di-hydrochloride. Absorbance was read through a spectrophotometric method at a wavelength of 540 nm. The activity of rice root surface phosphatase (RSP) was measured through the hydrolysis of p-nitrophenyl phosphate [55]. Roots were pounded with deionized water. Then, root tips were sited into substrates of p-nitrophenyl phosphate and sodium citrate buffer and incubated at 30 °C for 30 min. Absorbance was read using a microplate reader (MR-T00BS, Tryte Technology (H.K.) Limited, Hongkong, China) at the wavelength of 405 nm. Rice root phosphatase ability was detailed as mg p-nitrophenol g−1 h−1. Rice root oxidative aptitude (ROA) was determined by oxidating alpha-naphthylamine (α-NA) [56]. Fresh roots were positioned in a flask with α-NA, and then the flask was incubated in an end-over-end shaker for 120 min. The aliquots were filtered after incubation, and then 2 mL of the aliquot was combined with sodium nitrate and sulfanilic acid. The resulting color was read by the spectrophotometric method.

2.4. Determination of Dry Biomass Accumulation

The rice plants were harvested during the maturity stage, and samples were categorized and weighed to determine the fresh weights of leaves, stems, and spikelets. The samples were also located in an oven at 75 °C for 72 h and reweighed to determine the biomass of panicles, leaves, and stems. The dry mass of each portioning of the plant was quantified as g m−2. Then, total dry mass production (g m−2) was estimated via the shoot dry mass and the plant’s root dry mass under all treatments. The root to shoot ratio (RSR, %) was assessed as the dry mass of root divided by the dry mass of shoot and multiplied by 100. Furthermore, the harvest index (HI, %) was evaluated as dry spikelet mass divided by the dry mass of the shoot at harvest.

2.5. Determination of Water Consumptive Use

The water content of the soil was regularly checked using a time-domain reflectometer (Mini Trace System-Soil Moisture Equipment Corp., Santa Barbara, CA, USA), and freshwater was pumped from the pond nearby and introduced through pipelines to the plots. The number of irrigation events (IF) was logged during the season, and the amount of water used for irrigation was measured as follows:
I = Q + Δ S
Δ S = ϕ 1 ϕ 2 × DSM plot A plot × 1000
DSM plot = A plot × D S × B D × ϕ 0
where I is the water input for irrigation at every irrigation event (mm), Q is the amount of flooding water (mm), ΔS is the soil water kept in the soil of root zone (mm), ϕ1 is the soil saturated water content (%), ϕ2 is the actual moisture content of the soil when watering (%), DSMplot is the dry soil mass (kg) of the net area of the experimental plot, Aplot is the net area of the experimental plot (m2), DS is the soil depth (m), BD is the bulk density of soil (kg/m3), and ϕ0 is the initial moisture content (%). Evapotranspiration from the evaporation pan was calculated as follows:
ET c = E pan × K pan
where ETc is the crop evapotranspiration (mm/day), Kpan is the pan coefficient changing from 0.7 to 0.9, and Epan is the pan evaporation (mm/day).
Water percolation during the season was measured using the following equation:
D P = I ET c + R off + Δ S
where DP is the deep drainage (mm); ETc is the evapotranspiration (mm); Roff is the surface runoff (mm), which was omitted; and ΔS is the moisture stored in the root zone (mm).
The total irrigation input (TI, mm) was determined via the irrigation number (IN) and irrigation input at each event (I, mm) and calculated as follows:
TI = IN × I

2.6. Determination of WUE

As an assessor of the water-saving properties of an agricultural crop production system, WUE was introduced at different scales for varied water-related factors in accordance with the following formulas [5,57,58]:
CWUE Y = GY ET c
IWUE Y = GY TI
CWUE B = BY ET c
IWUE B = BY TI
where CWUEY is the crop yield water utilization efficiency (kg/m3), GY is the grain yield of rice (kg/ha), ETc is total evapotranspiration (m3), IWUEY is the yield irrigation water utilization efficiency (kg/m3), TI is the total water input for irrigation (m3), CWUEB is the crop biomass water utilization efficiency (kg/m3), BY is the total biomass yield (kg/ha), and IWUEB is the biomass irrigation water use efficiency (kg/m3).

2.7. Statistical Examination

Statistically, the collected data were evaluated using the IBM-SPSS package (IBM-SPSS, 19, Armonk, NY, USA). The two-way ANOVA was perform using a general linear model method was used to perform two-way ANOVA. When p values were significant, the mean values were compared by performing Duncan’s multiple range test at the 0.05 significance level.

3. Results

3.1. Consumption of Irrigation Water

The water treatments exerted a substantial (p ≤ 0.05) impact on ETc and Dp (Table 2). The largest values of ETc and Dp were recorded with AWMD, while their lowest values were detected with the AWCD regime during the season (Table 2). The straw burial treatments considerably influenced ETc and Dp (p ≤ 0.05). LSB and DSB treatments significantly reduced ETc values compared with NSB treatment. Statistically, the highest values of ETc (579.5 mm) and Dp (273.6 mm) were obtained from the NSB × AWMD combined treatments, while the lowest mean values of ETc (207.4 mm) and Dp (114.4 mm) were observed from the DSB × AWCD combined treatments (Table 2). In a similar context, the obtained results demonstrated that LSB and DSB considerably reduced TI values compared with the NSB treatment. Moreover, the results showed that IN and TI were affected by irrigation frequency, and the effect was enhanced with increasing soil moisture content under the same straw burial density. Statistically, the highest IN (17 events) and TI (853.1 mm) were recorded in the combination of NSB × AWMD. However, the lowest IN (7 events) and TI (321.8 mm) were recorded in the combination of DSB × AWCD (Table 2).

3.2. Root Development and Physiological Activity Parameters

RDW, RWD, and RSA significantly differed (p ≤ 0.05) during different growth stages due to the AWD water regimes and straw burial levels. Under similar straw burial level, the RDW, RWD, and RSA improved increasingly in a significant manner (p ≤ 0.05), with improving the water supply during AWCD, AWSD, and AWMD, respectively. For the same AWD method, increasing wheat straw burial level decreased the RDW, RWD, and RSA of rice. The highest values were realized in NSB, followed by those in LSB, while the lowest mean values were detected in DSB. The AWMD × DSB combination offered the maximum values of RDW (14.0 g plant−1), RWD (1.11 g cm−3), and RSA (31.6 m2 plant−1) due to integration. By contrast, the treatment AWCD × NSB presented the lowest values of RDW (5.1 g plant−1), RWD (0.41 g cm−3), and RSA (21.2 m2 plant−1). Moreover, the highest RDW, RWD, and RSA values were recorded during the milky stage (Figure 2).
The ROA, RSP, and RNR of rice roots were considerably affected by the diverse AWD techniques, and the wheat straw burial levels at different development phases (Figure 2). ROA, RSP, and RNR increased with increasing soil moisture content and level of wheat straw burial. Higher ROA and RSP were observed with DSB compared with all irrigation treatments (AWMD, AWSD, and AWCD) until the heading phase and then gradually decreased during the milky phase (Figure 2). In a different trend, RNR increased gradually during the tillering and heading stages and reached its maximum values during the milky stage (Figure 2IV). The highest ROA (55.5 mg g−1 FWh−1), RSP (1.67 mg g−1 FWh−1), and RNR (14.4 μg g−1 h−1) were observed at the AWMD × DSB treatment, while lower ROA (21.4 mg g−1 FWh−1), RSP (0.87 mg g−1 FWh−1), and RNR (5.8 μg g−1 h−1) were observed with the AWCD × NSB treatment (Figure 2).

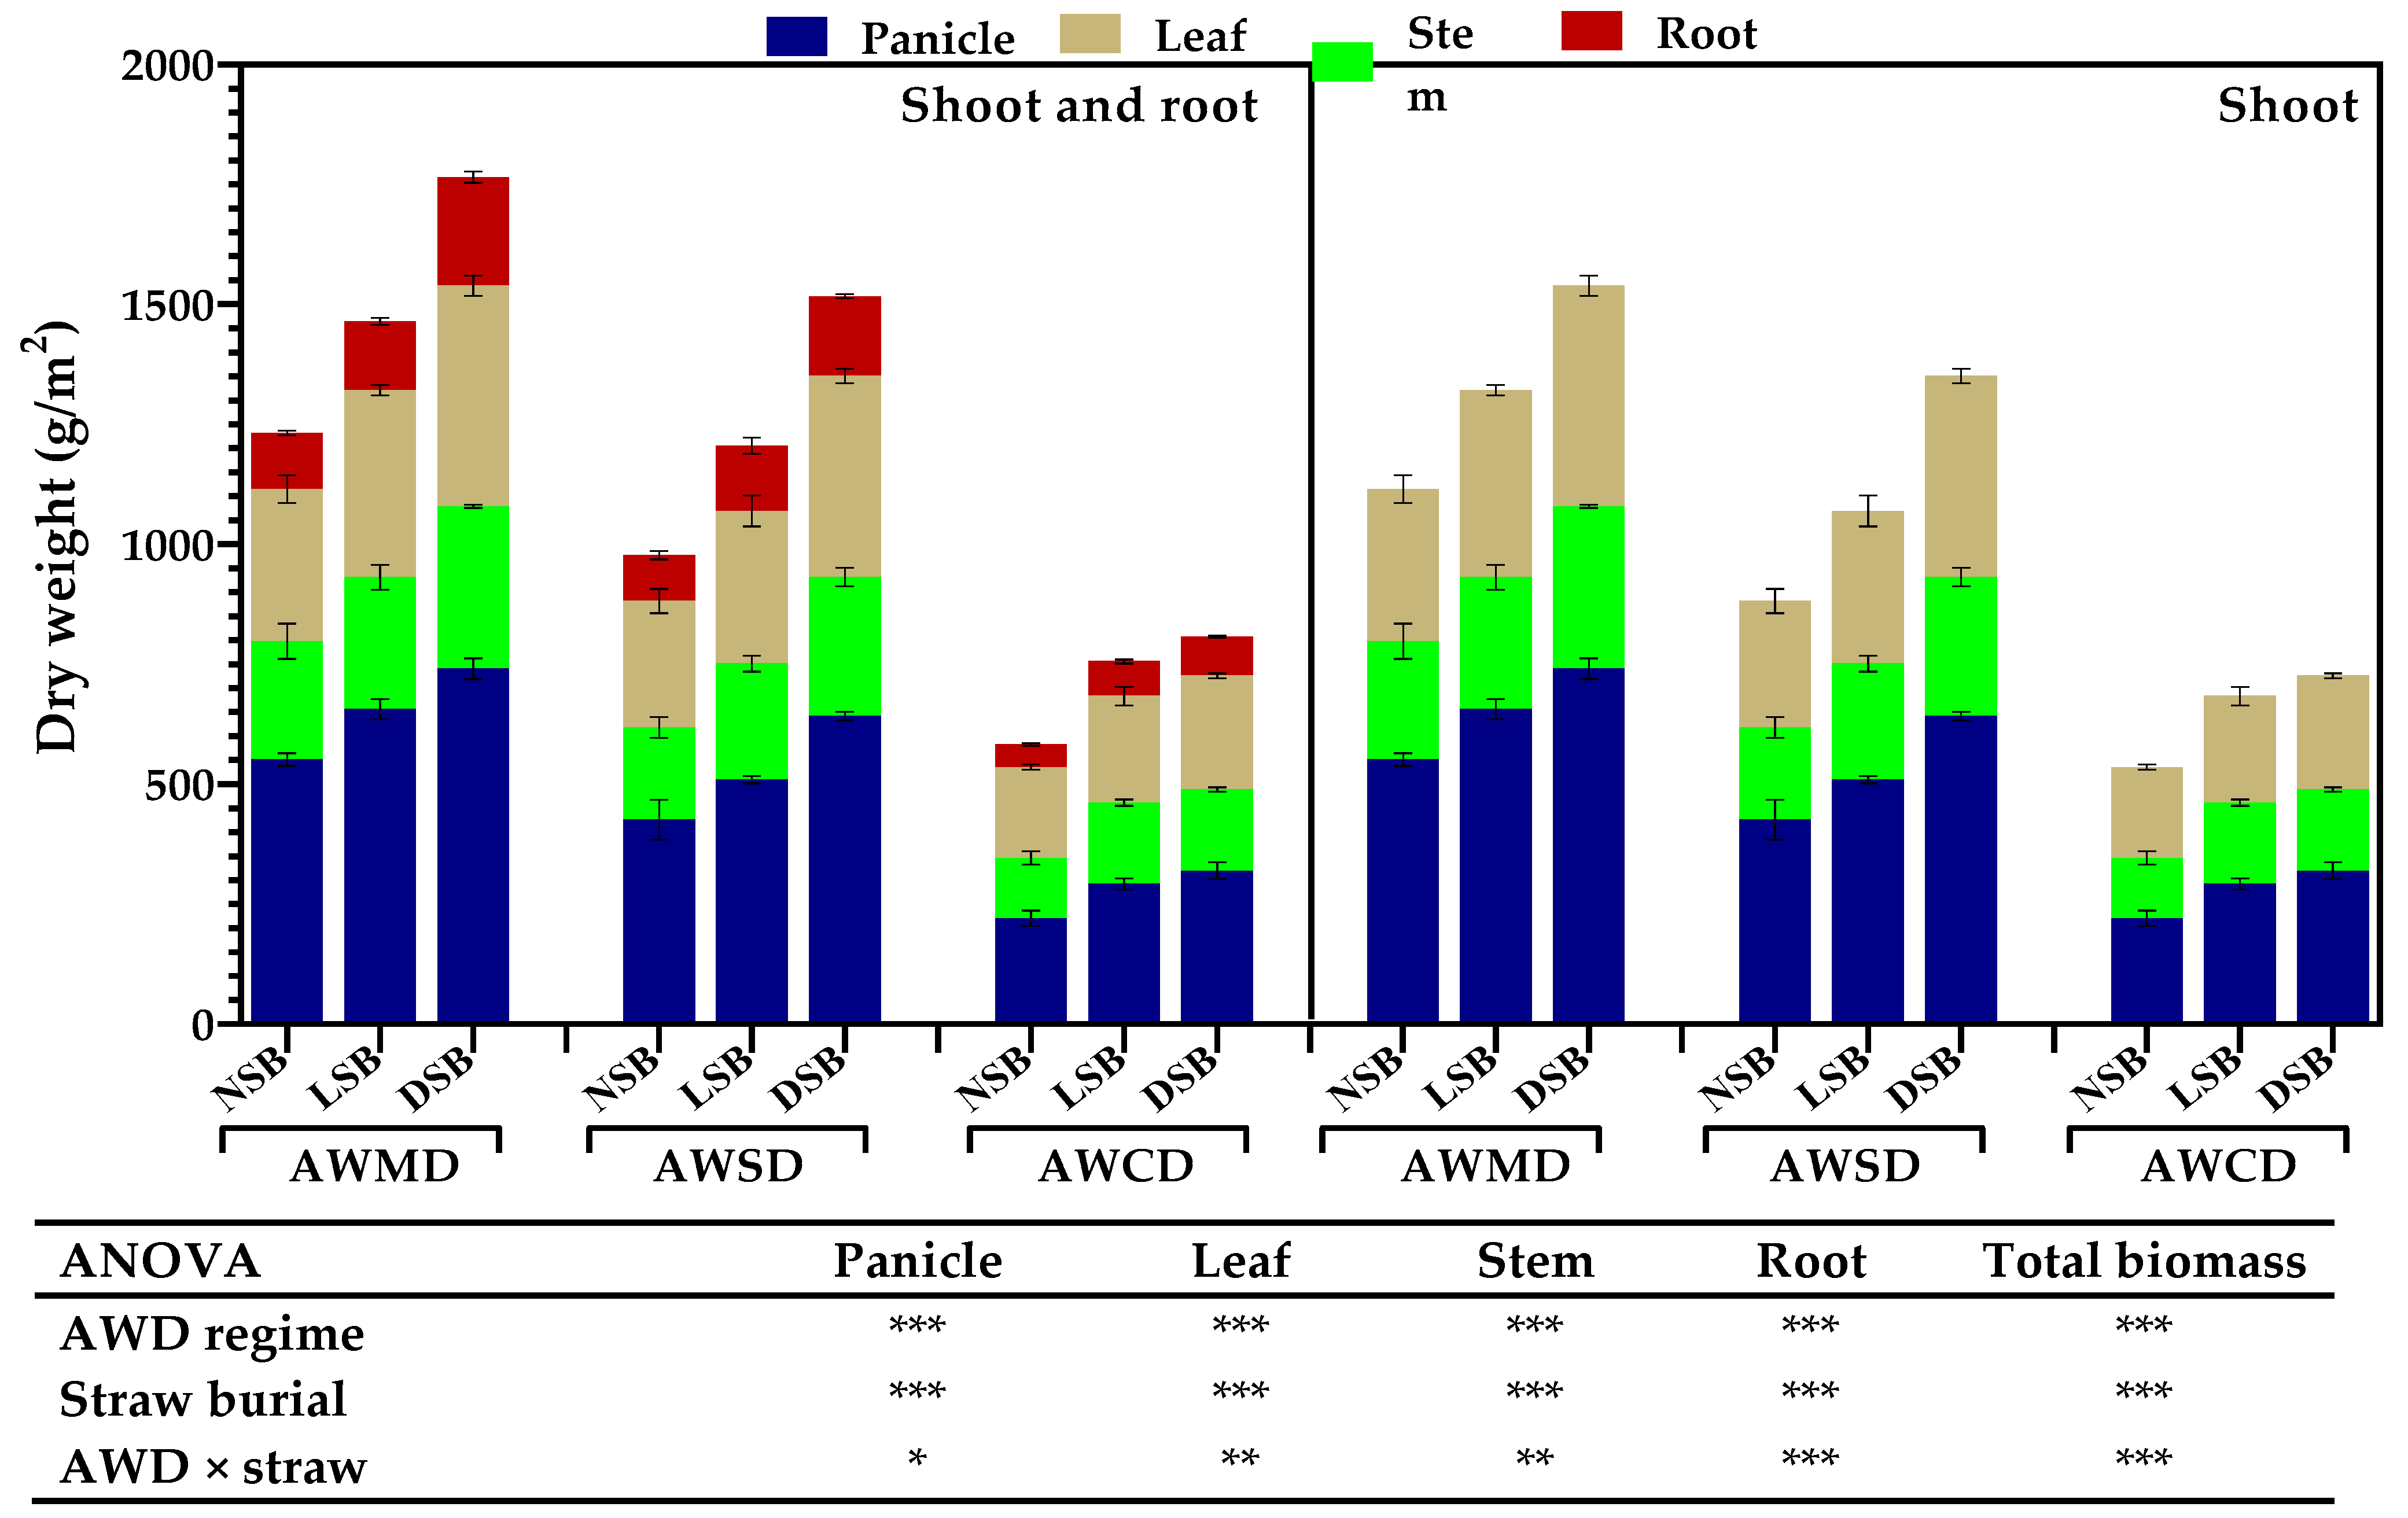
3.3. Dry Mass of Plant Parts Partitionings and Overall Plant Dry Mass

The dry mass of grain, stems, leaves, and roots, and consequently of overall plan biomass yield, were determined to differ according to the AWD regime, wheat straw burial rate, and their combined effects. Shoot biomass and total biomass increased with increments in soil water supplementation under the same straw burial level, where the dry matter of leaves, stems, grain, and roots improved increasingly during the AWCD, AWSD, and AWMD regimes. Moreover, with the same AWD technique, the lowest mean values of the dry mass of stems, seeds, roots, and leaves, and consequently of total dry matter, were observed in the NSB treatment, followed by LSB treatment, while the highest mean values were found in DSB treatment. The dry biomass of leaves, grain, stems, and roots, and consequently of shoot biomass and total biomass, increased considerably (p ≤ 0.05) with increasing soil water supplementation and straw burial rate. They peaked at maximum values of 1764.7 g m−2 and 1538.9 g m−2, respectively, at the combination AWMD × DSB. Meanwhile, the minimum values (583.3 g m−2 and 535.4 g m−2) were obtained by the combination AWCD × NSB (Figure 3).

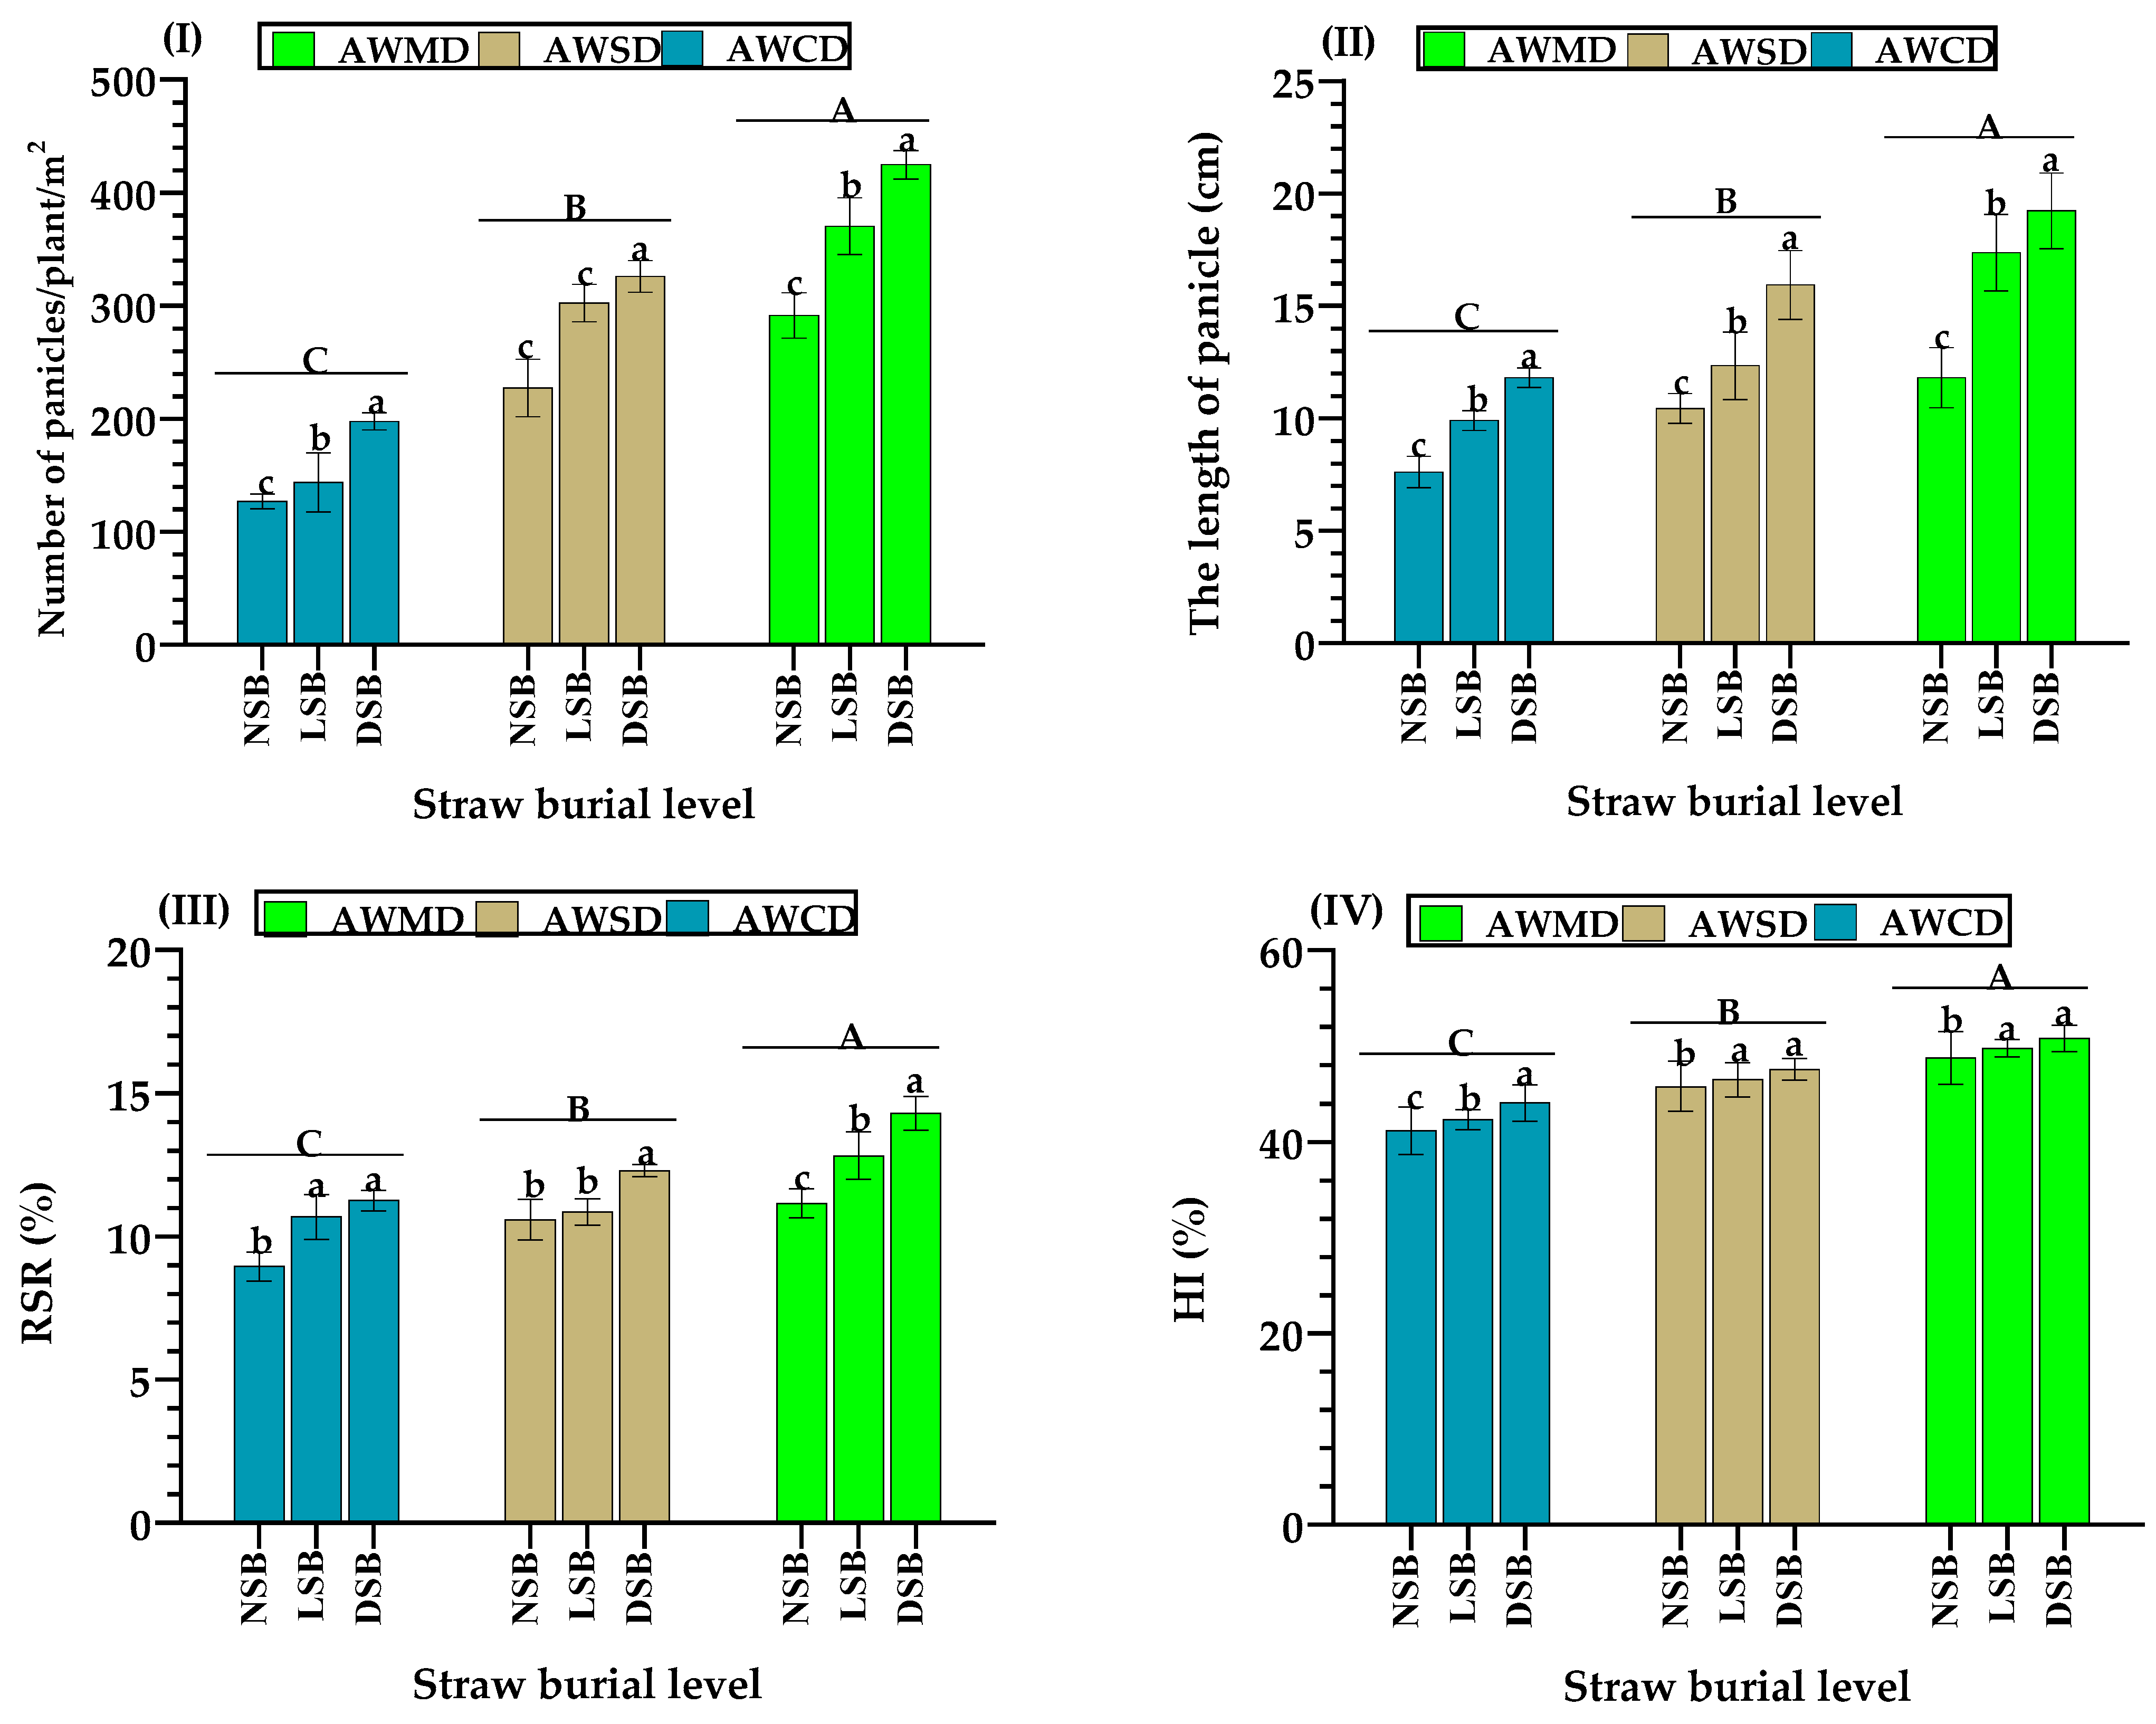
3.4. Indicators of the Grain and Dry Matter Production of Rice

The total dry matter production improved with increases in irrigation water submission under similar straw application level. Meanwhile, the panicles number, length of panicle, HI, and RSR improved increasingly during the AWCD, AWSD, and AWMD irrigation regimes. Furthermore, in the same AWD regime, the lowest length of panicle, number of panicles, RSR, and HI were observed in NSB, followed by LSB. Meanwhile, the highest value was in DSB. The number of panicles, length of panicle, HI, and RSR increased with an increase in water amount and straw burial level. They peaked at maximum values of 425 panicle plant−1 m−2, 19.2 cm, 14.3%, and 50.8, respectively, at the combination AWMD × DSB. By contrast, the minimum values of 127 panicle plant−1 m−2, 7.6 cm, 8.9%, and 41.2, respectively, were obtained by the combination AWCD × NSB (Figure 4I–IV).

3.5. WUE Indicators

As shown by the ANOVA analysis results, wheat straw burial resulted in substantial improvement of CWUEY and CWUEB under all AWD regimes. This effect increased with a larger level of straw burial. LSB and DSB significantly improved CWUEY values by 26.72% and 33.7%, respectively, while CWUEB was improved by 24.4% and 31.0%, respectively, compared with NSB treatment. Under a similar level of straw burial, the AWD regime presented different effects on CWUEY and CWUEB, wherein their values declined by reducing the ETc values (Table 3). Moreover, the AWSD × DSB treatment presented the highest values of CWUEY (1.87 kg m−3) and CWUEB (4.31 kg m−3). By contrast, the lowest mean values of CWUEY and CWUEB, which corresponded to 0.81 kg m−3 and 2.13 kg m−3, respectively, were obtained by the AWMD × NSB treatment.
Significant variances among different treatments were observed for IWUEY and IWUEB at a probability level of 0.05. In response to irrigation regimes, IWUEY and IWUEB tended to increase with a decrease in TI and an increase in grain yield. The greatest mean values were obtained by AWSD irrigation, followed by AWCD irrigation, and then AWMD irrigation. The straw burial treatments presented alike trends, wherein enlargement was toward the greatest straw burial level. LSB and DSB treatments had considerably increased the IWUEY values by 28.9% and 31.7%. Meanwhile, IWUEB was enhanced by 30.9% and 33.2%, respectively, compared with the treatment of NSB. The results showed that the treatment AWSD × DSB exhibited the maximum IWUEY and IWUEB (1.47 and 3.05 kg m−3, respectively). Furthermore, no significant difference (p ≤ 0.05) was observed when AWSD was compared with other regimes under the same straw burial rate of DSB. However, the minimum values of 0.52 and 1.40 kg m−3 were achieved by the combined treatment AWSD × NSB, as shown in Table 3.

4. Discussion

The existence of buried straw layers can prolong the water residence period in soil, reducing water percolation, compared with the nonexistence of buried straw layers [59]. Moreover, AWD irrigation is controlled by the rate and number of water applications to crops, depending on the climate and soil hydrological conditions. Thus, soil with NSB under the AWMD regime reached the low limit of irrigation considerably faster than that of soil with DSB under the AWSD and AWCD regimes due to the higher ETc and Dp under the AWMD regime. Consequently, the highest value of IN was observed in AWMD, followed by in the AWSD regime. Meanwhile, the lowest IN value of IN occurred in the AWCD irrigation regime. The results of TI were decreased under the AWCD and AWSD regimes compared with the AWMD irrigation regime according to the major reduction in IN, reducing TI. Moreover, under the same AWD regime, TI was decreased under DSB, compared with NSB for straw burial rates, reflecting the soil’s ability to increase its moisture holding capacity as a result of the presence of subsoil buried straw. Moreover, the increase in DP under NSB compared with that under DSB under all AWD regimes was ascribed to the enlargement in DP after each irrigation event that accelerated total DP, because NSB has no barrier that prevents deep discharge of water, causing the reduction in TI (mm) (Table 2). Similarly, the TI required for the unit area in the flooding system of rice was 3–5 times greater than those used in AWD irrigation [60]. Moreover, about 43% of the TI was used through ETc in flooding irrigation, while the remainder is lost through Dp (about 57%) [29,57].
RDW and RWD improved under AWMD × DSB by creating large and heavier roots joining the soil via high RSA above the straw layers. Similarly, the RWD, RSA, and RDW of rice depended on the differences in soil with soil moisture regime and plant–nutrient obtainability with soil moisture contents [14]. Moreover, large roots are essential for nutrient plant uptake [61,62]. Furthermore, a clear relation between the plant root development and total dry matter of rice was discovered [63,64]. Water stress under the treatment AWCD × NSB can limit the creation of large root growth. In such cases, the RWD, RWD, and RSA of the root were reduced, affecting the physiology of the root [65]. Under AWD conditions, a decreased growth of rice roots was realized under water stress conditions, reducing the exploitation of the deeper layers of the soil and decreasing root growth [66,67]. Increasing straw burial strengthens the soil’s capability to allow rice plants to produce larger roots that are in contact with the soil above the straw layer; thus, higher RDW, RWD, and RSA signified better plant growth, enhancing rice biomass production. Similarly, the RDW, RSA, and RWD of rice cultivated under ponded conditions were better than those under non-ponded conditions [14]. Moreover, the burial of the straw increased the root development traits of various plants [43,44,45].
Under flooded conditions, rice roots create aerenchyma, i.e., air-space tissue [68], allowing the passage of oxygen to the roots from the shoots [69,70]. Moreover, air-space tissue in rice is enlarged at soil waterlogging [71]. Therefore, under the conditions of AWMD × DSB treatment, rice was capable of conveying a huge amount of oxygen to the roots from the shoots via aerenchyma. By contrast, under the combined treatment AWCD × NSB, rice capably conveyed a minor quantity of oxygen through gas tissues. Thus, ROA was possibly relative to the RDW, RWD, and RSA of the rice rooting system. Consistently, a strong relation was recognized between ROA and root growth morphology of rice, which could affect oxygen delivery in the root zone [14,72,73]. Root and ROA morphological traits in rice were affected by the accessibility of nutrients under varied AWD regimes [13,74]. Hence, to achieve greater rice yield, a greater ROA is necessary [14,65,75]. The ROA variance of roots under varied straw burial densities referred that roots grown with DSB treatment gained further oxygen from the shoot than the rice roots grown with LSB and NSB treatments. Hence, a large ROA in rice roots was apparently due to large roots with high RDW, RSA, and RWD created in soil with DSB transferring a large amount of oxygen from the shoots. Rice root morphological traits were highly influenced by the accessibility of soil nutrients under varied AWD methods [14,74].
Higher RNR and RSP indicate adequate N and P root contents compared with lower RSP and RNR (Chen et al., 2020). Large P and N root contents are also explained by high P and N accessibility in soil linked to high plant N and P absorption under low acidity of the root zone soil [14]. Therefore, high RNR and RSP under the AWMD × DSB combination demonstrated increasing N and P accessibility to rice roots and high N and P sources to the shoots from the roots in rice. By contrast, the low values of RSP and RNR indicated a decline in N and P obtainability and decreased shoots and roots under AWCD × NSB. Similarly, the physiological traits of rice roots were highly influenced by the accessibility of nutrients under varied AWD regimes [13,74].
The improvement in the dry mass accumulation of rice was attributed to the accessibility of soil moisture and nutrients to rice roots under AWMD × DSB treatment, providing regular demands of water and nutrients for rice. Such conditions promote overall plant growth, and more effective panicles and tillers of rice were produced in flooding than in the AWD method [29,76,77], because anaerobic conditions increased the accessibility of plant nutrients, whereas aerobic conditions decreased it [78]. Moreover, DSB treatment can provide encouraging conditions to the roots growing above the straw layer, enhancing the development of plant effective panicles and tillers. Thus, total dry matter was increased compared with NSB treatment. Similarly, variances in the moisture content of soil affected plant nutrient supply and further influenced the development of rice [77]. The decrease in vegetative development and total biomass of rice under the AWCD × NSB combined treatment was ascribed to insufficient supplementation of soil water and nutrients in the soil above the straw buried-layer because an undesirable nutrient system for plant nutrients was generated under these conditions of water stress [25], while the dry matter production of rice greatly relies on the numbers of effective tillers and panicles [79]; therefore, the yield of rice declined in the following order: flooding, saturating, and the AWD method [27,80]. Moreover, prolonged irrigation intervals interrupted soil water conditions, leading to the low biomass yield of rice [27,81]. Our present study proposes that the large vegetative plant development in AWMD practice plays a fundamental role in the high grain and biomass yields of rice through the effective transportation of moisture and plant nutrients from the superior rice roots system to the larger rice shoots system.
In AWD approaches, enhancements in the number of panicles, RSR, and HI were linked to the high total biomass yield of rice [53,75]. Moreover, the number of effective panicles, length of panicle, RSR, and HI were greater in saturated soil than in moist soil because the accessibility of nutrients was reduced severely when waterlogged soil dried up [82]. In the current work, RSR demonstrated that the increment in root biomass was proportional to the enhancement of rice shoot dry weight, wherein the maximum dry weights of the shoots and roots of rice were linked to the highest RSR under AWMD × DSB treatment. By contrast, the minimum dry masses of the rice shoots and roots were connected to the minimum RSR under AWCD × NSB treatment. In a similar trend, HI indicated that an improvement in rice yield was comparable to the improvement in rice total biomass production, wherein the highest dry mass of grain and total biomass were associated with the highest HI under AWMD. By contrast, the minimum dry biomass of grain and total biomass were associated with the lowest HI under AWCD. The effective uptake of plant nutrients increased the production of rice total biomass [83,84,85]. Conversely, changing from ponded soil to non-ponded soil can extensively trigger the nutrient supply to crops, root development, and total biomass production in rice [4]. The presented results support the fact that a large root biomass is desirable for supporting large total biomass accumulation [61,65]. Moreover, in rice, plant development ratio can be regulated by soil water source, which indicates the magnitude of the increase in biomass production rate. Furthermore, the variance in rice plant growth levels was ascribed to changes in water and plant nutrient acquisition [61]. Thus, the higher the root and shoot development level, the greater the dry matter accumulation of rice.
WUE (kg/m3) is the primary index to assess the relations between water consumption (m3) and crop productivity. However, the general index of WUE (kg.m−3) is not a sufficiently accurate indicator for the optimum water management options [29,58], particularly to improve biomass yield and the WUE of rice grown under AWD irrigation coupled with subsoil straw burial in the subsoil. In addition, AWD method combined with the subsoil straw burial technique may reduce water use and guarantee morpho-physiological improvements in roots, contributing to higher dry matter production and, consequently to a better WUE of rice. Thus, to help farmers plan irrigation and decide which water and soil management options to practice when cultivating rice under limited freshwater resources, all potential forms of WUE should be evaluated separately, underlying the interactive role of the AWD irrigation and subsoil straw burial in regulating the WUE of rice. Accordingly, CWUEY, CWUEB, IWUEY, and IWUEB increased during wheat straw burial levels in NSB > LSB > DSB and declined during the water regimes in AWSD > AWMD > AWCD (Table 3). On the one hand, due to the increase in dry matter and grain yields under DSB, which has the highest capacity to hold water in the soil of root zone, it could increase rice growth and reduce the ETc and TI under the same irrigation regime. On the other hand, although biomass and grain yields in AWSD decreased from that in AWMD, increases in CWUEY, CWUEB, IWUEY, and IWUEB were achieved in AWSD due to the lower amounts of ETc and TI compared with that in the AWMD regime during the season. Moreover, the higher yields of biomass and grain and the lower AWSD increased CWUEY, CWUEB, IWUEY, and IWUEB compared with those in AWCD. The lowest yields of biomass and grain were observed in AWCD, because rice was subjected to water stress, resulting in the lowest CWUEY, CWUEB, IWUEY, and IWUEB of rice, along with the lowest values of ETc and TI compared with those in the other AWD techniques (Table 3). Consistently, the greatest WUE of rice was obtained when the decline in water use was larger than the reduction in the dry matter yield under different moisture levels [29,58]. In addition, the maximum WUE in paddy rice was achieved via AWD irrigation, reducing TI compared with that in flooding irrigation [58]. In addition, the combination AWSD × DSB improved total dry mass production by improving moisture storage, favoring the environment of the root zone. By contrast, the absence of straw burial, such as in NSB, supported by prolonged drought cycles, such as in the AWCD regime, considerably reduced total biomass production, decreasing soil moisture storage and disturbing the environment of the root zone. Therefore, DSB treatment should be applied with the AWSD irrigation regime to substantially enhance the WUE of rice under limited freshwater resources.

5. Conclusions

Subsoil straw burial demonstrated significant improvements in the root physiology and yield of rice under AWD irrigation. AWMD irrigation could increase rice yield while increasing water application intervals, increasing TI, and decreasing the WUE. Moreover, superior growth roots could match the higher yield of rice under AWMD irrigation. AWSD irrigation could enhance WUE because the reduction in TI was larger than the decrease in the dry matter of rice. Moreover, the AWSD regime exhibited a slight decrease in the root activity and productivity of rice, mainly at DSB. AWCD irrigation decreased the intervals of water application, decreasing TI. However, AWCD irrigation was an inadequate water management decision for rice because it could decrease root physiological traits. Therefore, it caused a large reduction in the overall rice plant growth, dry matter yield, and WUE. We suggest that rice growers perform AWSD irrigation after leaving straw residues in the field following deep tillage to embed straw residues below the soil surface, improving the yield and WUE of rice. We also propose that AWSD irrigation coupled with DSB should be adopted to overcome drought stress and maintain plant growth to address the problem of agricultural crop residues and freshwater scarcity for the sustainable rice production.

Author Contributions

Data curation, W.F.G., Y.A.H., H.S. and A.A.A.H.; Formal analysis, W.F.G., Y.A.H., H.S. and E.E.; Project administration, X.G.; Supervision, X.G.; Writing—original draft, Y.A.H.; Writing—review and editing, H.S. All authors have read and agreed to the published version of the manuscript.

Funding

This research was funded by the Water Conservancy Science and Technology Project of Jiangsu Province, grant number (2020049 and 2021055).

Institutional Review Board Statement

Not applicable.

Informed Consent Statement

Not applicable.

Data Availability Statement

Not applicable.

Acknowledgments

The authors thank the Water Conservancy Science and Technology Project of Jiangsu Province (2020049 and 2021055) for providing financial support in all experimental work.

Conflicts of Interest

The authors declare no conflict of interest.

References

  1. Jensen, C.R.; Battilani, A.; Plauborg, F.; Psarras, G.; Chartzoulakis, K.; Janowiak, F.; Stikic, R.; Jovanovic, Z.; Li, G.; Qi, X. Deficit irrigation based on drought tolerance and root signalling in potatoes and tomatoes. Agric. Water Manag. 2010, 98, 403–413. [Google Scholar] [CrossRef]
  2. Oumarou Abdoulaye, A.; Lu, H.; Zhu, Y.; Alhaj Hamoud, Y.; Sheteiwy, M. The global trend of the net irrigation water requirement of maize from 1960 to 2050. Climate 2019, 7, 124. [Google Scholar] [CrossRef] [Green Version]
  3. FAOSTAT. Agriculture data. In Agricultural Production; FAOSTAT: Rome, Italy, 2013. [Google Scholar]
  4. Buresh, R.; Haefele, S. Changes in Paddy Soils under Transition to Water-Saving and Diversified Cropping Systems; World Congress of Soil Science: Brisbane, Australia, 2010. [Google Scholar]
  5. Bouman, B. Water Management in Irrigated Rice: Coping with Water Scarcity; International Rice Research Institute: Manila, Philippines, 2007. [Google Scholar]
  6. Dibba, L.; Diagne, A.; Fialor, S.C.; Nimoh, F. Diffusion and adoption of new rice varieties for africa (NERICA) in the gambia. Afr. Crop Sci. J. 2012, 20, 141–153. [Google Scholar]
  7. Maclean, J.; Hardy, B.; Hettel, G. Rice Almanac: Source Book for One of the Most Important Economic Activities On Eazrth; IRRI: Los Baños, Philippines, 2013. [Google Scholar]
  8. Frolking, S.; Qiu, J.; Boles, S.; Xiao, X.; Liu, J.; Zhuang, Y.; Li, C.; Qin, X. Combining remote sensing and ground census data to develop new maps of the distribution of rice agriculture in china. Glob. Biogeochem. Cycles 2002, 16, 38. [Google Scholar] [CrossRef] [Green Version]
  9. Lin, Y.; Huabin, Z.; Jianxia, L. Current situation and prospect of rice water-saving irrigation technology in china. Chin. J. Ecol. 2014, 33, 1381–1387. [Google Scholar]
  10. Ye, Y.; Liang, X.; Chen, Y.; Liu, J.; Gu, J.; Guo, R.; Li, L. Alternate wetting and drying irrigation and controlled-release nitrogen fertilizer in late-season rice. Effects on dry matter accumulation, yield, water and nitrogen use. Field Crops Res. 2013, 144, 212–224. [Google Scholar] [CrossRef]
  11. Pan, J.; Liu, Y.; Zhong, X.; Lampayan, R.M.; Singleton, G.R.; Huang, N.; Liang, K.; Peng, B.; Tian, K. Grain yield, water productivity and nitrogen use efficiency of rice under different water management and fertilizer-n inputs in south china. Agric. Water Manag. 2017, 184, 191–200. [Google Scholar] [CrossRef]
  12. Alhaj Hamoud, Y.; Guo, X.; Wang, Z.; Shaghaleh, H.; Chen, S.; Hassan, A.; Bakour, A. Effects of irrigation regime and soil clay content and their interaction on the biological yield, nitrogen uptake and nitrogen-use efficiency of rice grown in southern china. Agric. Water Manag. 2019, 213, 934–946. [Google Scholar] [CrossRef]
  13. Xu, G.-w.; Lu, D.-K.; Wang, H.-Z.; Li, Y. Morphological and physiological traits of rice roots and their relationships to yield and nitrogen utilization as influenced by irrigation regime and nitrogen rate. Agric. Water Manag. 2018, 203, 385–394. [Google Scholar] [CrossRef]
  14. Alhaj Hamoud, Y.; Shaghaleh, H.; Sheteiwy, M.; Guo, X.; Elshaikh, N.A.; Khan, N.U.; Oumarou, A.; Rahim, S.F. Impact of alternative wetting and soil drying and soil clay content on the morphological and physiological traits of rice roots and their relationships to yield and nutrient use-efficiency. Agric. Water Manag. 2019, 223, 105706. [Google Scholar] [CrossRef]
  15. Tao, Y.; Zhang, Y.; Jin, X.; Saiz, G.; Jing, R.; Guo, L.; Liu, M.; Shi, J.; Zuo, Q.; Tao, H. More rice with less water–evaluation of yield and resource use efficiency in ground cover rice production system with transplanting. Eur. J. Agron. 2015, 68, 13–21. [Google Scholar] [CrossRef]
  16. Chu, G.; Wang, Z.; Zhang, H.; Yang, J.; Zhang, J. Agronomic and physiological performance of rice under integrative crop management. Agron. J. 2016, 108, 117–128. [Google Scholar] [CrossRef]
  17. Wang, Z.; Zhang, W.; Beebout, S.S.; Zhang, H.; Liu, L.; Yang, J.; Zhang, J. Grain yield, water and nitrogen use efficiencies of rice as influenced by irrigation regimes and their interaction with nitrogen rates. Field Crops Res. 2016, 193, 54–69. [Google Scholar] [CrossRef]
  18. Alhaj Hamoud, Y.; Wang, Z.; Guo, X.; Shaghaleh, H.; Sheteiwy, M.; Chen, S.; Qiu, R.; Elbashier, M.M.A. Effect of irrigation regimes and soil texture on the potassium utilization efficiency of rice. Agronomy 2019, 9, 100. [Google Scholar] [CrossRef] [Green Version]
  19. Islam, M.; Parul, S.; Pathan, A.; Islam, M.; Quasem, M. Influence of Cracking on Rice Seasons and Irrigation in Bangladesh; Asian Network for Scientific Information: Faisalabad, Pakistan, 2004. [Google Scholar]
  20. Stewart, R.D.; Abou Najm, M.R.; Rupp, D.E.; Lane, J.W.; Uribe, H.C.; Arumí, J.L.; Selker, J.S. Hillslope run-off thresholds with shrink–swell clay soils. Hydrol. Process. 2015, 29, 557–571. [Google Scholar] [CrossRef]
  21. Greve, A.; Andersen, M.; Acworth, R. Investigations of soil cracking and preferential flow in a weighing lysimeter filled with cracking clay soil. J. Hydrol. 2010, 393, 105–113. [Google Scholar] [CrossRef]
  22. Arnold, J.; Potter, K.; King, K.; Allen, P. Estimation of soil cracking and the effect on surface runoff in a texas blackland prairie watershed. Hydrol. Process. 2005, 19, 589–603. [Google Scholar] [CrossRef]
  23. Huguenin-Elie, O.; Kirk, G.; Frossard, E. Phosphorus uptake by rice from soil that is flooded, drained or flooded then drained. Eur. J. Soil Sci. 2003, 54, 77–90. [Google Scholar] [CrossRef]
  24. Wissuwa, M.; Ismail, A.M.; Yanagihara, S. Effects of zinc deficiency on rice growth and genetic factors contributing to tolerance. Plant Physiol. 2006, 142, 731–741. [Google Scholar] [CrossRef] [Green Version]
  25. Sahrawat, K.L. Soil fertility in flooded and non-flooded irrigated rice systems. Arch. Agron. Soil Sci. 2012, 58, 423–436. [Google Scholar] [CrossRef] [Green Version]
  26. Belder, P.; Bouman, B.; Cabangon, R.; Guoan, L.; Quilang, E.; Yuanhua, L.; Spiertz, J.; Tuong, T. Effect of water-saving irrigation on rice yield and water use in typical lowland conditions in asia. Agric. Water Manag. 2004, 65, 193–210. [Google Scholar] [CrossRef]
  27. Carrijo, D.R.; Lundy, M.E.; Linquist, B.A. Rice yields and water use under alternate wetting and drying irrigation: A meta-analysis. Field Crops Res. 2017, 203, 173–180. [Google Scholar] [CrossRef]
  28. Bezborodov, G.; Shadmanov, D.; Mirhashimov, R.; Yuldashev, T.; Qureshi, A.S.; Noble, A.; Qadir, M. Mulching and water quality effects on soil salinity and sodicity dynamics and cotton productivity in central asia. Agric. Ecosyst. Environ. 2010, 138, 95–102. [Google Scholar] [CrossRef]
  29. Hamoud, Y.A.; Guo, X.; Wang, Z.; Chen, S.; Rasoul, G. Effects of irrigation water regime, soil clay content and their combination on growth, yield, and water use efficiency of rice grown in south china. Int. J. Agric. Biol. Eng. 2018, 11, 144–155. [Google Scholar]
  30. Shaghaleh, H.; Xu, X.; Wang, S. Current progress in production of biopolymeric materials based on cellulose, cellulose nanofibers, and cellulose derivatives. RSC Adv. 2018, 8, 825–842. [Google Scholar] [CrossRef] [PubMed] [Green Version]
  31. Shaghaleh, H.; Xu, X.; Liu, H.; Wang, S.; Hamoud, Y.A.; Dong, F.; Luo, J. The effect of atmospheric pressure plasma pretreatment with various gases on the structural characteristics and chemical composition of wheat straw and applications to enzymatic hydrolysis. Energy 2019, 176, 195–210. [Google Scholar] [CrossRef]
  32. García, C.; Montero, G.; Coronado, M.; Torres, R.; Vázquez, A.; Ayala, J.; León, J.; Sagaste, C. Power generation estimation from wheat straw in mexico. Energy Sustain. VI WIT Trans. Ecol. Environ. 2015, 195, 101–110. [Google Scholar]
  33. Oanh, N.T.K.; Ly, B.T.; Tipayarom, D.; Manandhar, B.R.; Prapat, P.; Simpson, C.D.; Liu, L.-J.S. Characterization of particulate matter emission from open burning of rice straw. Atmos. Environ. 2011, 45, 493–502. [Google Scholar] [CrossRef] [Green Version]
  34. Qu, C.; Li, B.; Wu, H.; Giesy, J.P. Controlling Air Pollution from Straw Burning in China Calls for Efficient Recycling; ACS Publications: Washington, DC, USA, 2012. [Google Scholar]
  35. Zhang, Y.; Liu, M.; Dannenmann, M.; Tao, Y.; Yao, Z.; Jing, R.; Zheng, X.; Butterbach-Bahl, K.; Lin, S. Benefit of using biodegradable film on rice grain yield and n use efficiency in ground cover rice production system. Field Crops Res. 2017, 201, 52–59. [Google Scholar] [CrossRef]
  36. Liu, S.; Yang, J.; Zhang, X.; Drury, C.; Reynolds, W.; Hoogenboom, G. Modelling crop yield, soil water content and soil temperature for a soybean–maize rotation under conventional and conservation tillage systems in northeast china. Agric. Water Manag. 2013, 123, 32–44. [Google Scholar] [CrossRef]
  37. Jin, X.; Zuo, Q.; Ma, W.; Li, S.; Shi, J.; Tao, Y.; Zhang, Y.; Liu, Y.; Liu, X.; Lin, S. Water consumption and water-saving characteristics of a ground cover rice production system. J. Hydrol. 2016, 540, 220–231. [Google Scholar] [CrossRef]
  38. Liu, M.; Dannenmann, M.; Lin, S.; Saiz, G.; Yan, G.; Yao, Z.; Pelster, D.; Tao, H.; Sippel, S.; Tao, Y. Ground cover rice production system facilitates soil carbon and nitrogen stocks at regional scale. Biogeosci. Discuss. 2015, 12, 3647. [Google Scholar]
  39. Bunna, S.; Sinath, P.; Makara, O.; Mitchell, J.; Fukai, S. Effects of straw mulch on mungbean yield in rice fields with strongly compacted soils. Field Crops Res. 2011, 124, 295–301. [Google Scholar] [CrossRef]
  40. Chen, S.; Zhang, X.; Pei, D.; Sun, H.; Chen, S. Effects of straw mulching on soil temperature, evaporation and yield of winter wheat: Field experiments on the north china plain. Ann. Appl. Biol. 2007, 150, 261–268. [Google Scholar] [CrossRef]
  41. Humphreys, E.; Eberbach, P.; Katupitiya, A.; Kukal, S. Growth, yield and water productivity of zero till wheat as affected by rice straw mulch and irrigation schedule. Field Crops Res. 2011, 121, 209–225. [Google Scholar]
  42. Turmel, M.-S.; Speratti, A.; Baudron, F.; Verhulst, N.; Govaerts, B. Crop residue management and soil health: A systems analysis. Agric. Syst. 2015, 134, 6–16. [Google Scholar] [CrossRef]
  43. Chen, S.; Zhang, Z.; Wang, Z.; Guo, X.; Liu, M.; Hamoud, Y.A.; Zheng, J.; Qiu, R. Effects of uneven vertical distribution of soil salinity under a buried straw layer on the growth, fruit yield, and fruit quality of tomato plants. Sci. Hortic. 2016, 203, 131–142. [Google Scholar] [CrossRef]
  44. Chen, S.; Wang, Z.; Guo, X.; Rasool, G.; Zhang, J.; Xie, Y.; Yousef, A.H.; Shao, G. Effects of vertically heterogeneous soil salinity on tomato photosynthesis and related physiological parameters. Sci. Hortic. 2019, 249, 120–130. [Google Scholar] [CrossRef]
  45. Rasool, G.; Xiangping, G.; Zhenchang, W.; Sheng, C.; Alhaj Hamoud, Y.; Javed, Q. Response of fertigation under buried straw layer on growth, yield, and water-fertilizer productivity of chinese cabbage under greenhouse conditions. Commun. Soil Sci. Plant Anal. 2019, 50, 1030–1043. [Google Scholar] [CrossRef]
  46. Zhang, S.; Kong, D.; Chang, X.; Zhai, L. Effect of straw deep application on soil water storage capacity. J. Northeast Agric. Univ. 2010, 6, 034. [Google Scholar]
  47. Cao, J.; Liu, C.; Zhang, W.; Guo, Y. Effect of integrating straw into agricultural soils on soil infiltration and evaporation. Water Sci. Technol. 2012, 65, 2213–2218. [Google Scholar] [CrossRef]
  48. Kaur, J.; Bons, H.K. Mulching: A viable option to increase productivity of field and fruit crops. J. Appl. Nat. Sci. 2017, 9, 974–982. [Google Scholar] [CrossRef] [Green Version]
  49. Palta, J.A.; Yang, J. Crop root system behaviour and yield. Field Crops Res. 2014, 165, 1–149. [Google Scholar] [CrossRef]
  50. Petricka, J.J.; Winter, C.M.; Benfey, P.N. Control of arabidopsis root development. Annu. Rev. Plant Biol. 2012, 63, 563–590. [Google Scholar] [CrossRef] [Green Version]
  51. Hames, B.; Ruiz, R.; Scarlata, C.; Sluiter, A.; Sluiter, J.; Templeton, D. Preparation of samples for compositional analysis. Lab. Anal. Proced. (LAP) 2008, 1617, 65–71. [Google Scholar]
  52. Daly, P.; van Munster, J.M.; Blythe, M.J.; Ibbett, R.; Kokolski, M.; Gaddipati, S.; Lindquist, E.; Singan, V.R.; Barry, K.W.; Lipzen, A.; et al. Expression of aspergillus niger cazymes is determined by compositional changes in wheat straw generated by hydrothermal or ionic liquid pretreatments. Biotechnol. Biofuels 2017, 10, 35. [Google Scholar] [CrossRef] [PubMed] [Green Version]
  53. Yang, C.; Yang, L.; Yang, Y.; Ouyang, Z. Rice root growth and nutrient uptake as influenced by organic manure in continuously and alternately flooded paddy soils. Agric. Water Manag. 2004, 70, 67–81. [Google Scholar] [CrossRef]
  54. Tennant, D. A test of a modified line intersect method of estimating root length. J. Ecol. 1975, 6, 995–1001. [Google Scholar] [CrossRef]
  55. Boero, G.; Thien, S. Phosphatase activity and phosphorus availability in the rhizosphere of corn roots. In The Soil–Root Interface; Elsevier: Amsterdam, The Netherlands, 1979; pp. 231–242. [Google Scholar]
  56. Zhang, X.; Tan, G.; Huang, Y. Experimental technology of plant physiology. Liaoning Sci. Technol. Press Shenyang China 1994, 21, 51–75. [Google Scholar]
  57. Bouman, B.; Peng, S.; Castaneda, A.; Visperas, R. Yield and water use of irrigated tropical aerobic rice systems. Agric. Water Manag. 2005, 74, 87–105. [Google Scholar] [CrossRef]
  58. Shao, G.-C.; Deng, S.; Liu, N.; Yu, S.-E.; Wang, M.-H.; She, D.-L. Effects of controlled irrigation and drainage on growth, grain yield and water use in paddy rice. Eur. J. Agron. 2014, 53, 1–9. [Google Scholar] [CrossRef]
  59. Zhao, Y.; Li, Y.; Wang, J.; Pang, H.; Li, Y. Buried straw layer plus plastic mulching reduces soil salinity and increases sunflower yield in saline soils. Soil Tillage Res. 2016, 155, 363–370. [Google Scholar] [CrossRef]
  60. Lampayan, R.M.; Rejesus, R.M.; Singleton, G.R.; Bouman, B.A. Adoption and economics of alternate wetting and drying water management for irrigated lowland rice. Field Crops Res. 2015, 170, 95–108. [Google Scholar] [CrossRef]
  61. Chu, G.; Wang, Z.; Zhang, H.; Liu, L.; Yang, J.; Zhang, J. Alternate wetting and moderate drying increases rice yield and reduces methane emission in paddy field with wheat straw residue incorporation. Food Energy Secur. 2015, 4, 238–254. [Google Scholar] [CrossRef]
  62. Gao, C.; El-Sawah, A.M.; Ali, D.F.I.; Hamoud, Y.A.; Shaghaleh, H.; Sheteiwy, M.S. The integration of bio and organic fertilizers improve plant growth, grain yield, quality and metabolism of hybrid maize (Zea mays L.). Agronomy 2020, 10, 319. [Google Scholar] [CrossRef] [Green Version]
  63. Sharma, P.K.; Verma, T.S.; Bhagat, R.M. Soil structural improvements with the addition of lantana camara biomass in rice-wheat cropping. Soil Use Manag. 1995, 11, 199–203. [Google Scholar] [CrossRef]
  64. Bandyopadhyay, K.; Mohanty, M.; Painuli, D.; Misra, A.; Hati, K.; Mandal, K.; Ghosh, P.; Chaudhary, R.; Acharya, C. Influence of tillage practices and nutrient management on crack parameters in a vertisol of central india. Soil Tillage Res. 2003, 71, 133–142. [Google Scholar] [CrossRef]
  65. Yang, J.-C.; Zhang, H.; Zhang, J.-H. Root morphology and physiology in relation to the yield formation of rice. J. Integr. Agric. 2012, 11, 920–926. [Google Scholar] [CrossRef]
  66. Kondhia, A.; Tabien, R.E.; Ibrahim, A. Evaluation and selection of high biomass rice (Oryza sativa L.) for drought tolerance. Am. J. Plant Sci. 2015, 6, 1962. [Google Scholar] [CrossRef]
  67. Sheteiwy, M.S.; Shao, H.; Qi, W.; Hamoud, Y.A.; Shaghaleh, H.; Khan, N.U.; Yang, R.; Tang, B. Gaba-alleviated oxidative injury induced by salinity, osmotic stress and their combination by regulating cellular and molecular signals in rice. Int. J. Mol. Sci. 2019, 20, 5709. [Google Scholar] [CrossRef] [Green Version]
  68. Colmer, T.D.; Pedersen, O. Oxygen dynamics in submerged rice (Oryza sativa). New Phytol. 2008, 178, 326–334. [Google Scholar] [CrossRef] [PubMed]
  69. Colmer, T. Long-distance transport of gases in plants: A perspective on internal aeration and radial oxygen loss from roots. Plant Cell Environ. 2003, 26, 17–36. [Google Scholar] [CrossRef] [Green Version]
  70. Evans, D.E. Aerenchyma formation. New Phytol. 2004, 161, 35–49. [Google Scholar] [CrossRef]
  71. Shiono, K.; Ogawa, S.; Yamazaki, S.; Isoda, H.; Fujimura, T.; Nakazono, M.; Colmer, T.D. Contrasting dynamics of radial o2-loss barrier induction and aerenchyma formation in rice roots of two lengths. Ann. Bot. 2010, 107, 89–99. [Google Scholar] [CrossRef] [PubMed] [Green Version]
  72. Kirk, G.J. Rice root properties for internal aeration and efficient nutrient acquisition in submerged soil. New Phytol. 2003, 159, 185–194. [Google Scholar] [CrossRef] [PubMed]
  73. Mishra, A.; Salokhe, V. Flooding stress: The effects of planting pattern and water regime on root morphology, physiology and grain yield of rice. J. Agron. Crop Sci. 2010, 196, 368–378. [Google Scholar] [CrossRef]
  74. Mishra, A.; Uphoff, N. Morphological and physiological responses of rice roots and shoots to varying water regimes and soil microbial densities. Arch. Agron. Soil Sci. 2013, 59, 705–731. [Google Scholar] [CrossRef]
  75. Ju, C.; Buresh, R.J.; Wang, Z.; Zhang, H.; Liu, L.; Yang, J.; Zhang, J. Root and shoot traits for rice varieties with higher grain yield and higher nitrogen use efficiency at lower nitrogen rates application. Field Crops Res. 2015, 175, 47–55. [Google Scholar] [CrossRef]
  76. Bunnag, S.; Pongthai, P. Selection of rice (Oryza sativa L.) cultivars tolerant to drought stress at the vegetative stage under field conditions. Am. J. Plant Sci. 2013, 4, 1701. [Google Scholar] [CrossRef]
  77. Dou, F.; Soriano, J.; Tabien, R.E.; Chen, K. Soil texture and cultivar effects on rice (Oryza sativa, L.) grain yield, yield components and water productivity in three water regimes. PLoS ONE 2016, 11, e0150549. [Google Scholar] [CrossRef] [PubMed]
  78. Carmeis Filho, A.C.d.A.; Crusciol, C.A.C.; Nascente, A.S.; Mauad, M.; Garcia, R.A. Influence of potassium levels on root growth and nutrient uptake of upland rice cultivars. Rev. Caatinga 2017, 30, 32–44. [Google Scholar] [CrossRef] [Green Version]
  79. Huang, M.; Zou, Y.-b.; Jiang, P.; Bing, X.; Md, I.; Ao, H.-J. Relationship between grain yield and yield components in super hybrid rice. Agric. Sci. China 2011, 10, 1537–1544. [Google Scholar] [CrossRef]
  80. Belder, P.; Spiertz, J.; Bouman, B.; Lu, G.; Tuong, T. Nitrogen economy and water productivity of lowland rice under water-saving irrigation. Field Crops Res. 2005, 93, 169–185. [Google Scholar] [CrossRef]
  81. Bouman, B.; Tuong, T.P. Field water management to save water and increase its productivity in irrigated lowland rice. Agric. Water Manag. 2001, 49, 11–30. [Google Scholar] [CrossRef]
  82. Huguenin-Elie, O.; Kirk, G.; Frossard, E. The effects of water regime on phosphorus responses of rainfed lowland rice cultivars. Ann. Bot. 2008, 103, 211–220. [Google Scholar] [CrossRef] [Green Version]
  83. Siavoshi, M.; Laware, S.L. Effect of organic fertilizer on growth and yield components in rice (Oryza sativa L.). J. Agric. Sci. 2011, 3, 217. [Google Scholar] [CrossRef] [Green Version]
  84. Xiang, J.; Haden, V.R.; Peng, S.; Bouman, B.A.; Huang, J.; Cui, K.; Visperas, R.M.; Zhu, D.; Zhang, Y.; Chen, H. Effect of deep placement of nitrogen fertilizer on growth, yield, and nitrogen uptake of aerobic rice. Aust. J. Crop Sci. 2013, 7, 870. [Google Scholar]
  85. Ding, C.; You, J.; Chen, L.; Wang, S.; Ding, Y. Nitrogen fertilizer increases spikelet number per panicle by enhancing cytokinin synthesis in rice. Plant Cell Rep. 2014, 33, 363–371. [Google Scholar] [CrossRef]
Figure 1. A layout shows the experimental design and placement of subsoil straw layers.
Sustainability 14 16394 g001
Figure 2. Root dry weight (RDW) (I), root weight density (RWD) (II), root surface area (RSA) (III), root oxidation ability (ROA) (IV), root nitrate reductase RNR (IIV) and root surface phosphatase (RSP) (IIIV) mean values as influenced by straw layer application and irrigation regimes. NSB, LSB, and DSB represent straw densities of 0, 300, and 800 kg/ha, respectively. AWMD, AWSD, and AWCD denote the water management options of alternate wetting/mild drying irrigation, alternate wetting/severe drying irrigation, and alternate wetting/critical drying irrigation, respectively. The letters above the bars that are different indicate significant differences between AWD methods (uppercase) or wheat straw burial (lowercase) levels (p ≤ 0.05) via Duncan’s multiple range tests.
Sustainability 14 16394 g002
Figure 3. Dry matter production for different irrigation regimes and subsoil straw burial levels. NSB, LSB, and DSB represent straw densities of 0, 300, and 800 t.ha−1, respectively. AWMD, AWSD, and AWCD denote alternate wetting/mild drying, alternate wetting/severe drying, and alternate wetting/critical drying, respectively; ANOVA, analysis of variance tests; ns, not significant; and ***, **, and * represent significant differences at p ≤ 0.001, 0.01, and 0.05, respectively, among treatments. The full-length bar denotes the total dry biomass.
Sustainability 14 16394 g003
Figure 4. Number of panicles (I), length of panicle (II), root-to-shoot ratio (RSR) (III), and harvest index (HI) (IV) mean values as affected by straw burial rate and AWD regimes. NSB, LSB, and DSB represent straw rates of 0, 300, and 800 t/ha, respectively. AWMD, AWSD, and AWCD denote alternate wetting/mild drying irrigation, alternate wetting/sharp drying irrigation, alternate wetting/critical drying irrigation, respectively. The letters above bars that are different refers significant differences among the water regimes (uppercase) or straw burial (lowercase) treatments (p ≤ 0.05) based on the Duncan’s multiple range tests.
Sustainability 14 16394 g004
Table 1. Monthly mean humidity (%), minimum temperature (T min), maximum temperature (Tmax), and related weather data throughout the season.
Average DataMayJunJulAugSepOct
TMax (°C)30.731.832.139.329.827.4
TMin (°C)18.420.922.528.516.712.9
Max. Relative humidity %9584.510084.588.873.8
Min. Relative humidity %68.361.968.361.967.566.5
Sunshine (h)89111197
Solar Rad. MJ m−2 day−196.3113.696.5113.27872.8
Rainfall (mm)104.6188.5172.1135.485.365.9
Note: the climate data were obtained from the Metrological Bureau of Nanjing.
Table 2. Mean values of water consumptive use indicators in rice with different AWD regimes and straw layers, and a summary of the two-way ANOVA analysis on the impacts of the AWD system and straw burial on water use parameters.
TreatmentWater Use IndicatorIrrigations Number
AWD RegimeStraw BurialETc (mm)Dp (mm)TI (mm)IN (Events)
AWMDNSB579.5 ± 19.51 Aa273.6 ± 10.7 Aa853.1 ± 9.07 Aa17 ± 0.47 Aa
LSB523.2 ± 13.79 Aa277.0 ± 3.7 Aa800.2 ± 10.28 Aa16 ± 0.47 Aa
DSB501.1 ± 4.13 Aa240.8 ± 7.6 Ab751.9 ± 11.73 Ab14 ± 0.24 Ab
AWSDNSB418.3 ± 14.54 Bb160.7 ± 6.3 Ba579.0 ± 8.60 Ba13 ± 0.48 Ba
LSB361.7 ± 9.73 Bc153.1 ± 2.7 Ba514.8 ± 7.54 Ba11 ± 0.32 Ba
DSB352.3 ± 13.79 Bc135.9 ± 3.8 Bb478.3 ± 10.28 Bb11 ± 0.77 Ba
AWCDNSB231.8 ± 6.57 Cd128.5 ± 1.25 Ca365.4 ± 7.21 Ca11 ± 0.41 Ca
LSB214.6 ± 6.73 Cd118.6 ± 4.2 Ca333.2 ± 3.6 Ca9 ± 0.35 Ca
DSB207.4 ± 3.61 Cd104.4 ± 4.3 Cb307.8 ± 7.90 Cb7 ± 0.68 Cb
ANOVA
AWD regime*****
Straw burial***********
AWD × straw*****ns
Note: ETc, Dp, TI, and IN denote evapotranspiration, deep percolation, total irrigation, and irrigation events, respectively. Means are not significantly different (p ≤ 0.05) among the AWD regimes (uppercase) or straw burial (lowercase) treatments when followed by the different letter in accordance with Duncan’s multiple range tests; ANOVA, analysis of variance tests; ns, not significant; ***, **, and *, refers significant differences at p ≤ 0.001, 0.01, and 0.05, respectively, among different treatments.
Table 3. Mean values of the indicators of WUE of rice with varied AWD regimes and straw layer levels, and a summary of Duncan’s multiple range test on the main impacts of the AWD irrigation regimes and straw burial rates on the rice WUE indicators for the varied treatments.
TreatmentWater Use Efficiency Indicator
AWD RegimeStraw BurialCWUEY (kg/m3)IWUEY (kg /m3)CWUEB (kg/m3)IWUEB (kg/m3)
AWMDNSB0.81 ± 0.02 Cb0.52 ± 0.01 Cc2.13 ± 0.09 Cb1.40 ± 0.05 Cb
LSB1.15 ± 0.02 Ca0.82 ± 0.03 Cb2.80 ± 0.10 Ca1.83 ± 0.04 Cb
DSB1.46 ± 0.04 Ca1.02 ± 0.02 Ca3.05 ± 0.07 Ca2.51 ± 0.06 Ca
AWSDNSB0.96 ± 0.01 Ab0.70 ± 0.01 Ab2.54 ± 0.11 Ac1.69 ± 0.07 Ab
LSB1.39 ± 0.08 Aa0.98 ± 0.05 Ab3.53 ± 0.12 Ab2.44 ± 0.10 Aa
DSB1.87 ± 0.05 Aa1.47 ± 0.07 Aa4.31 ± 0.09 Aa3.05 ± 0.06 Aa
AWCDNSB0.87 ± 0.04 Bb0.61 ± 0.03 Bb2.22 ± 0.10 Bb1.51 ± 0.02 Bb
LSB1.25 ± 0.07 Ba0.87 ± 0.02 Bb3.33 ± 0.09 Ba2.13 ± 0.04 Ba
DSB1.62 ± 0.09 Ba1.11 ± 0.06 Ba3.49 ± 0.11 Ba2.62 ± 0.08 Ba
ANOVA
AWD regime*****
Straw burial**********
AWD × Straw********
Note: Means are not significantly different (p ≤ 0.05) among the AWD regimes (uppercase) or straw burial (lowercase) treatments when followed by different letter in accordance with Duncan’s multiple range tests; ANOVA, analysis of variance tests; ns, not significant; ***, **, and * signify significant differences at p ≤ 0.001, 0.01, and 0.05, respectively, among different treatments.
Publisher’s Note: MDPI stays neutral with regard to jurisdictional claims in published maps and institutional affiliations.

