
Analysis of the Challenges in the Swedish Urban Planning Process: A Case Study about Digitalization


Abstract
1. Introduction
2. Materials and Methods
2.1. Document Analysis
2.2. Survey
2.3. Interviews
2.4. Case Study
3. Results
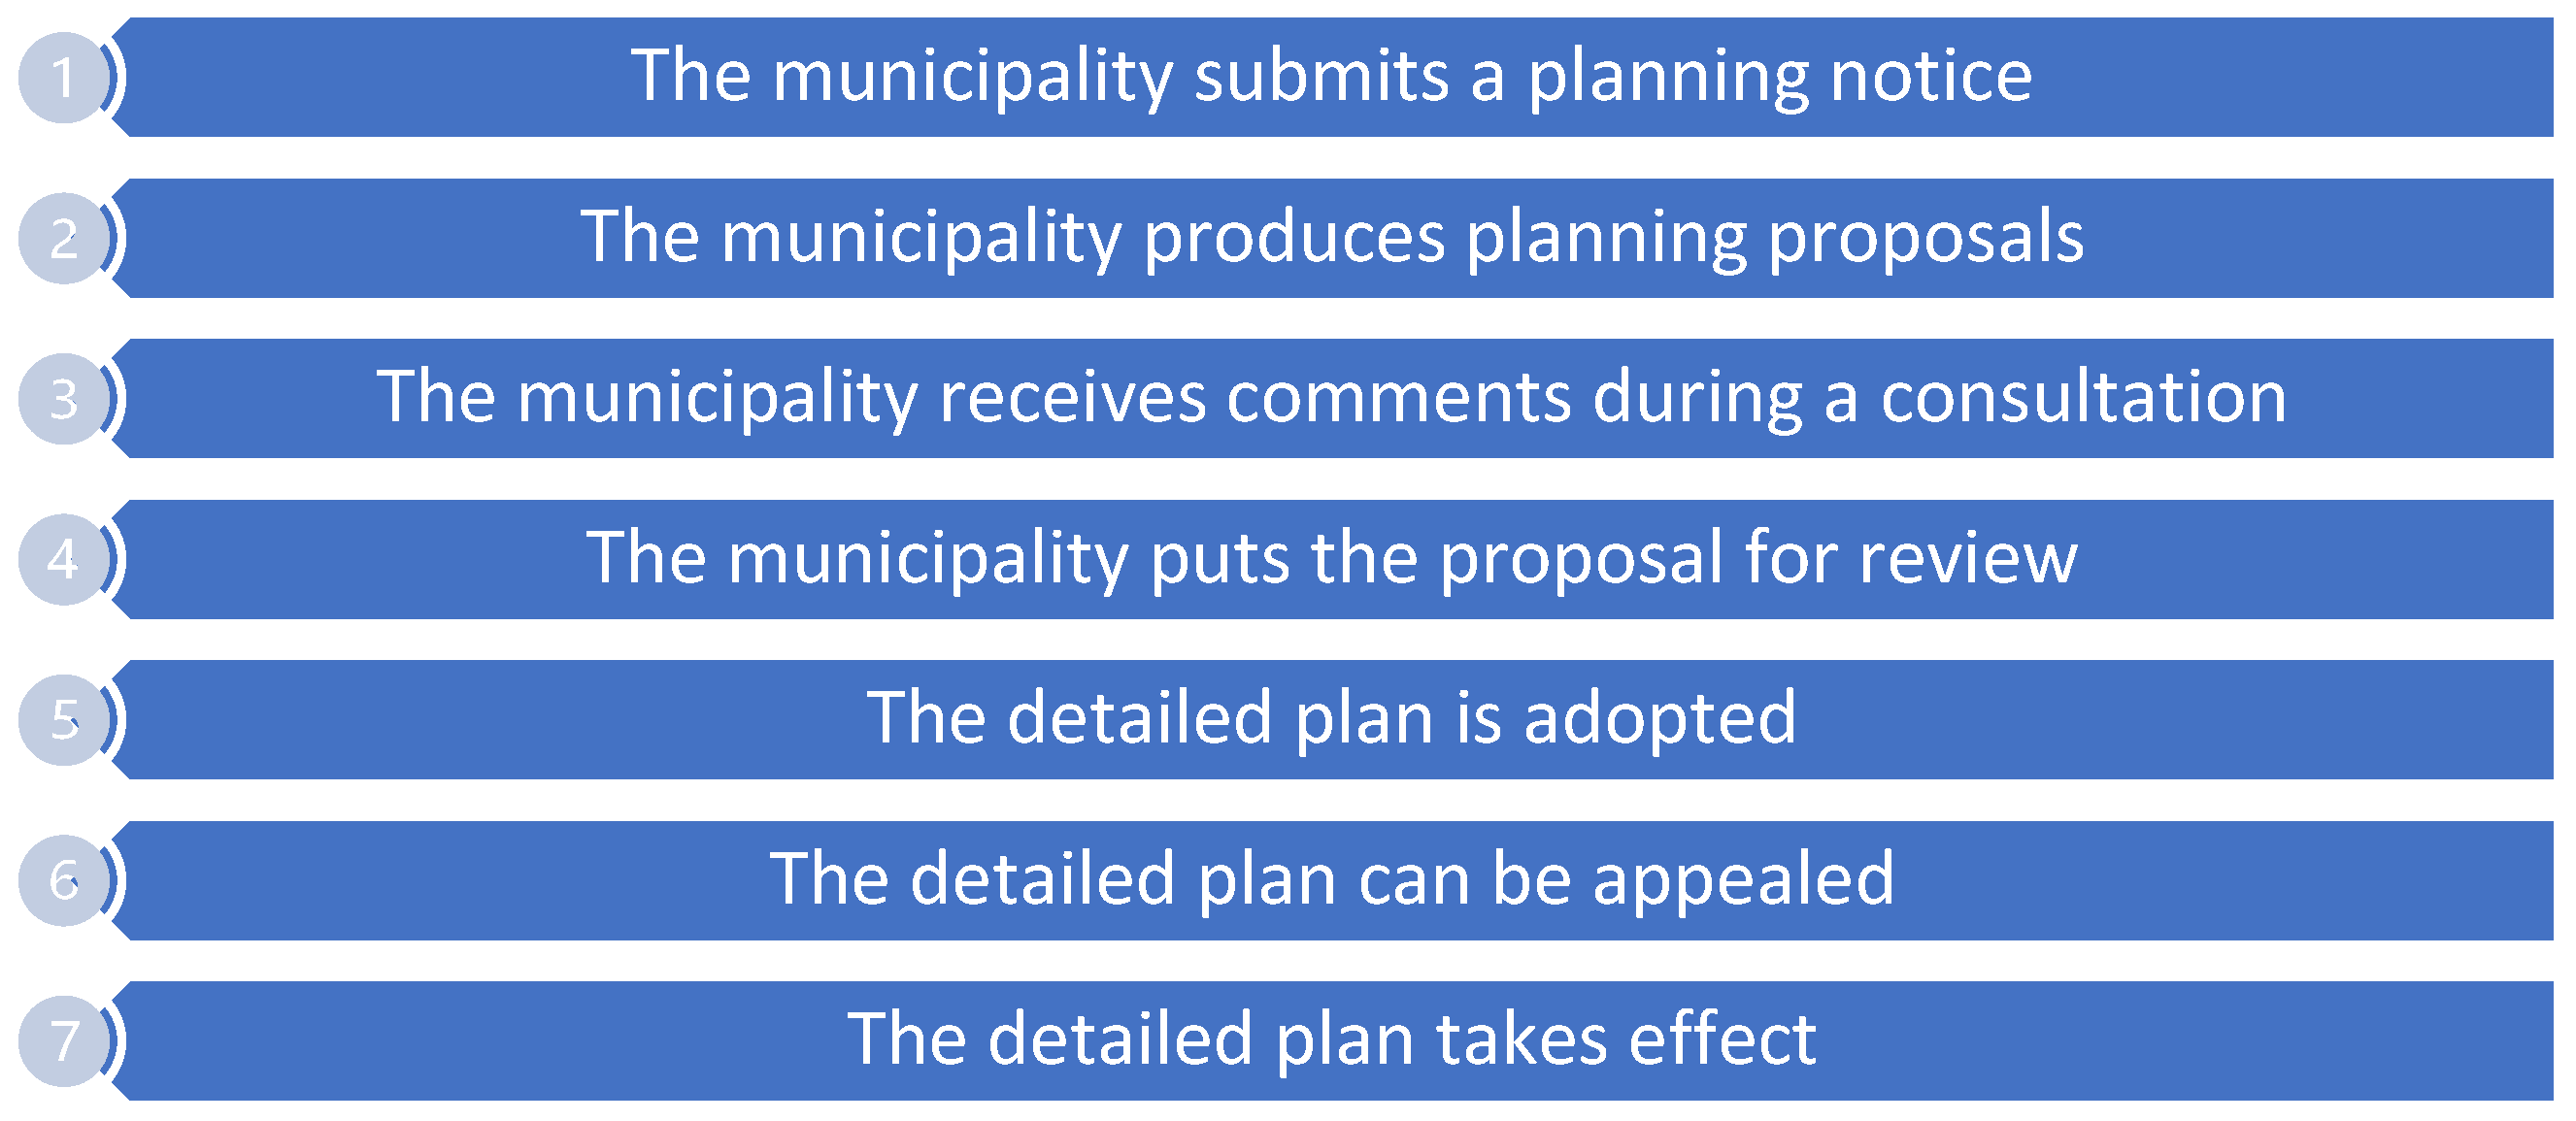
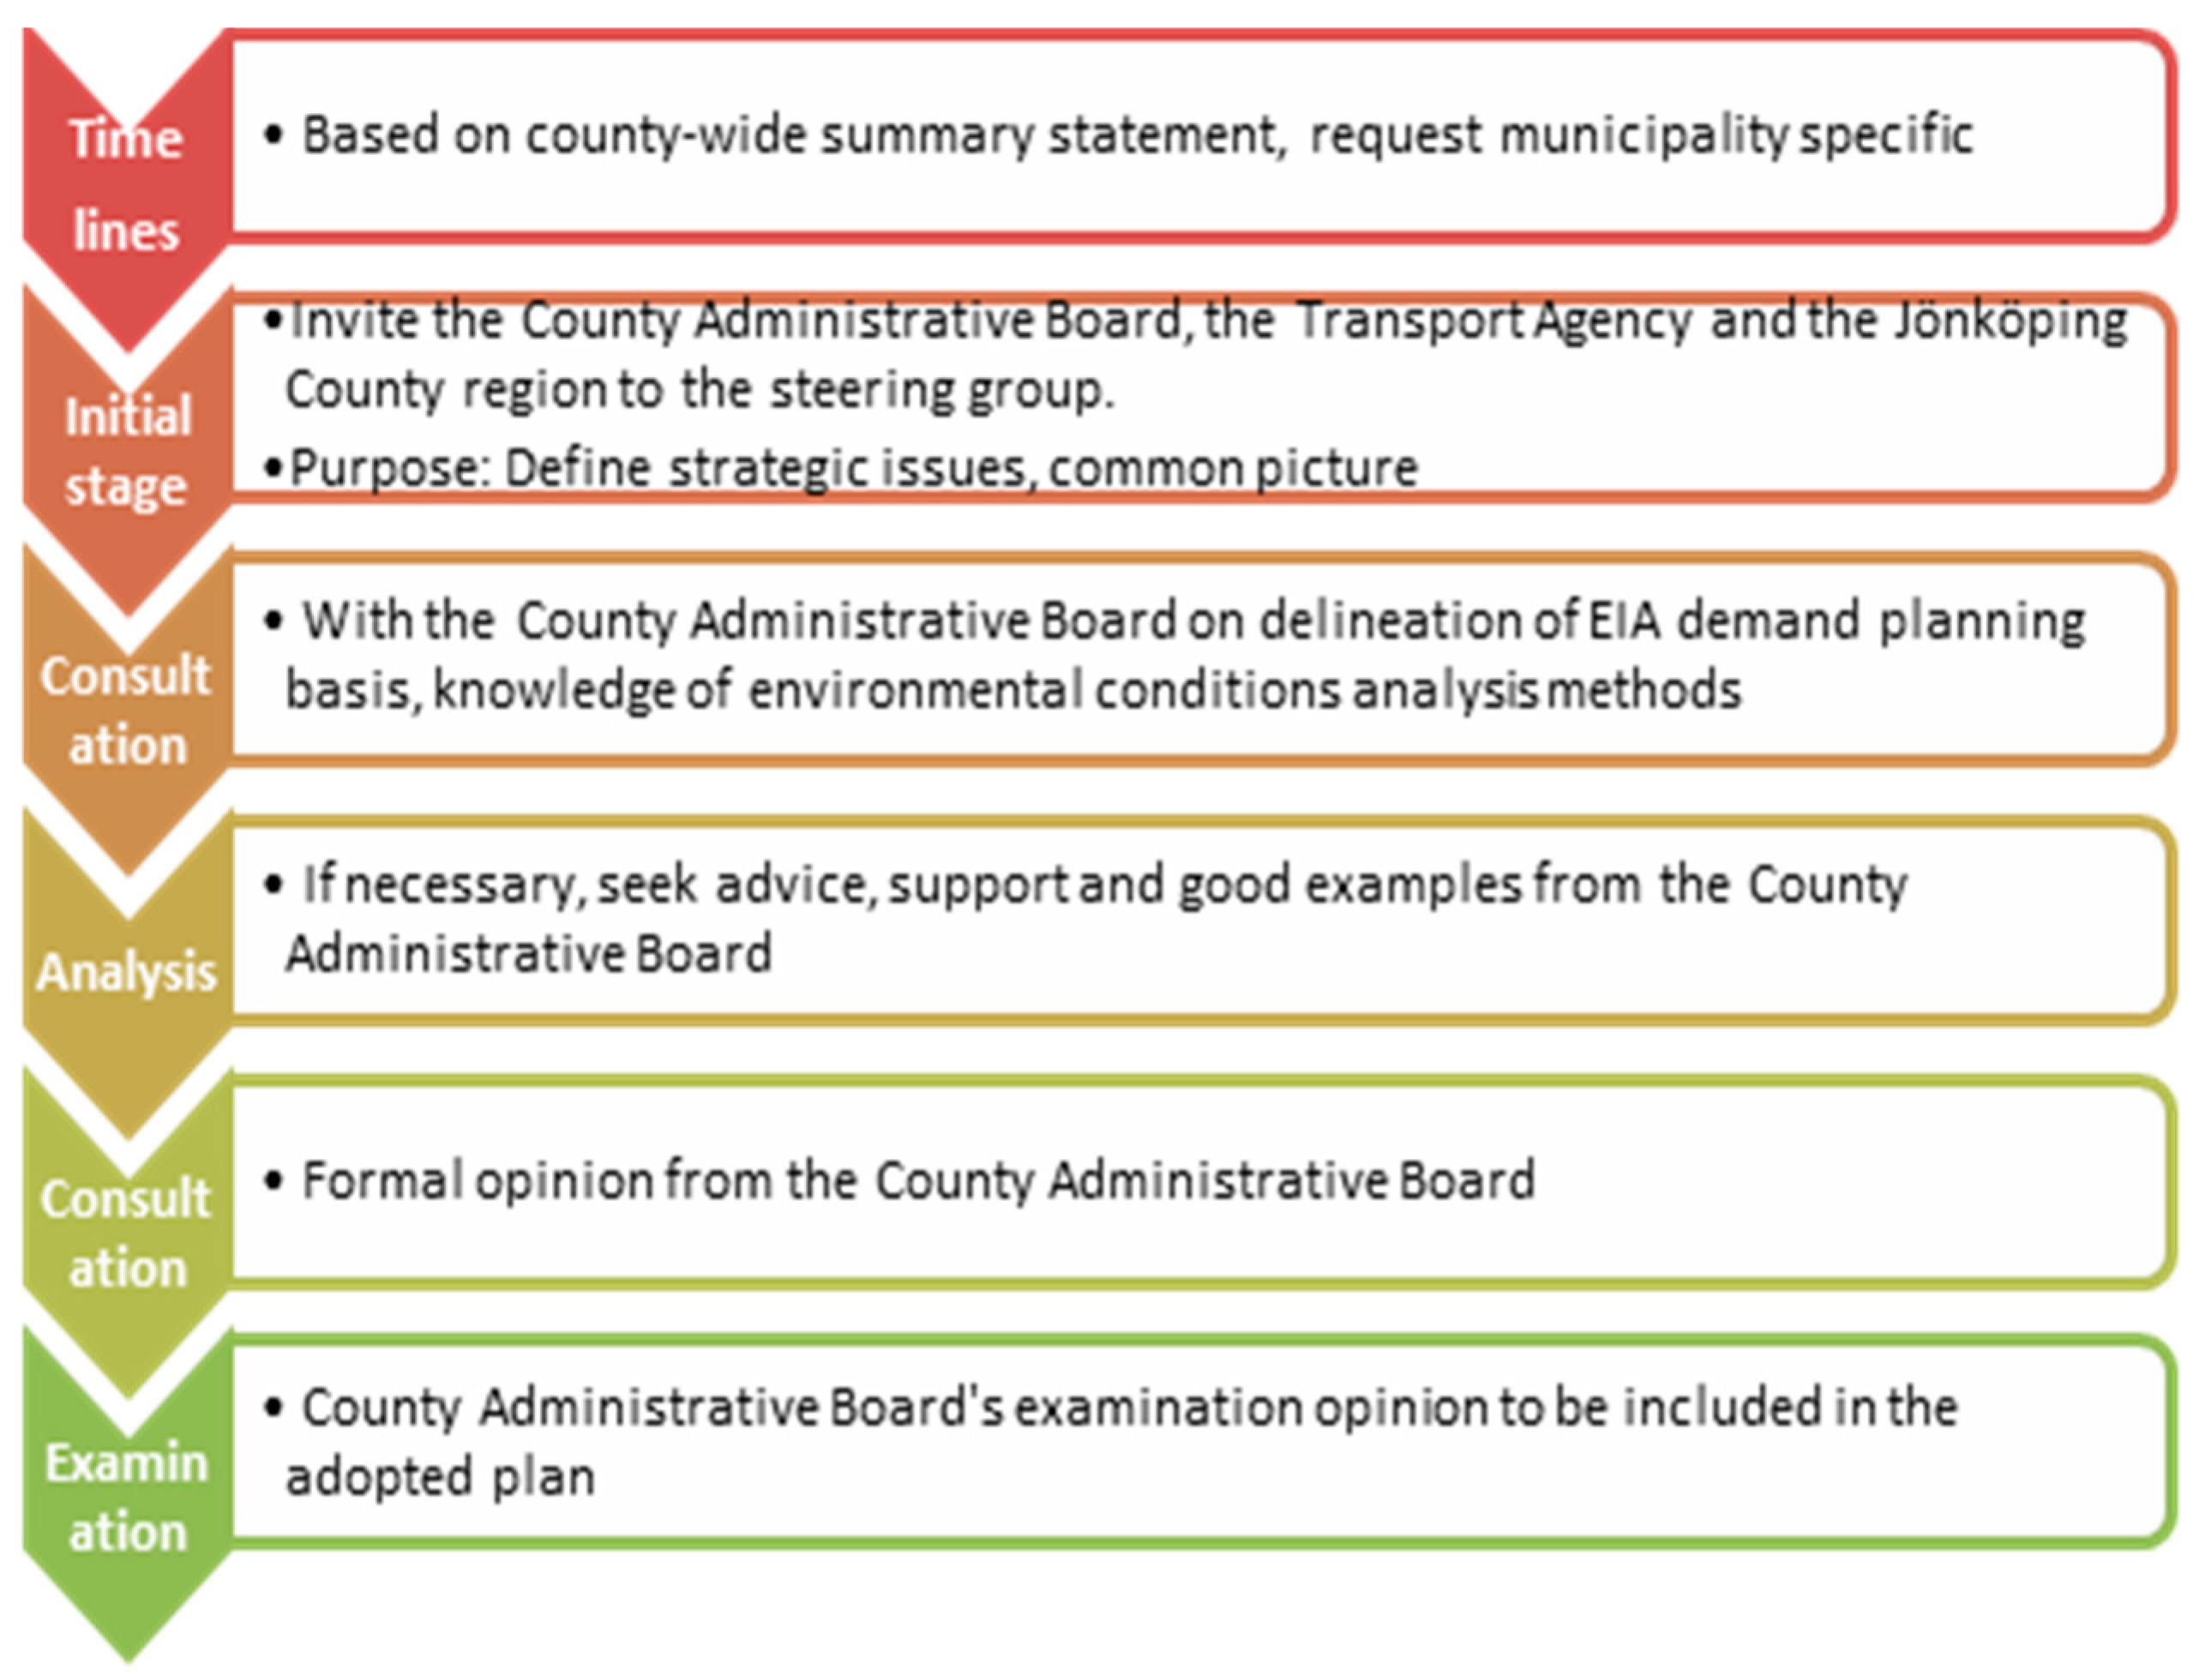
3.1. Documents’ Analysis: Urban Planning Regulations in Sweden
3.2. The Survey
3.3. Interviews
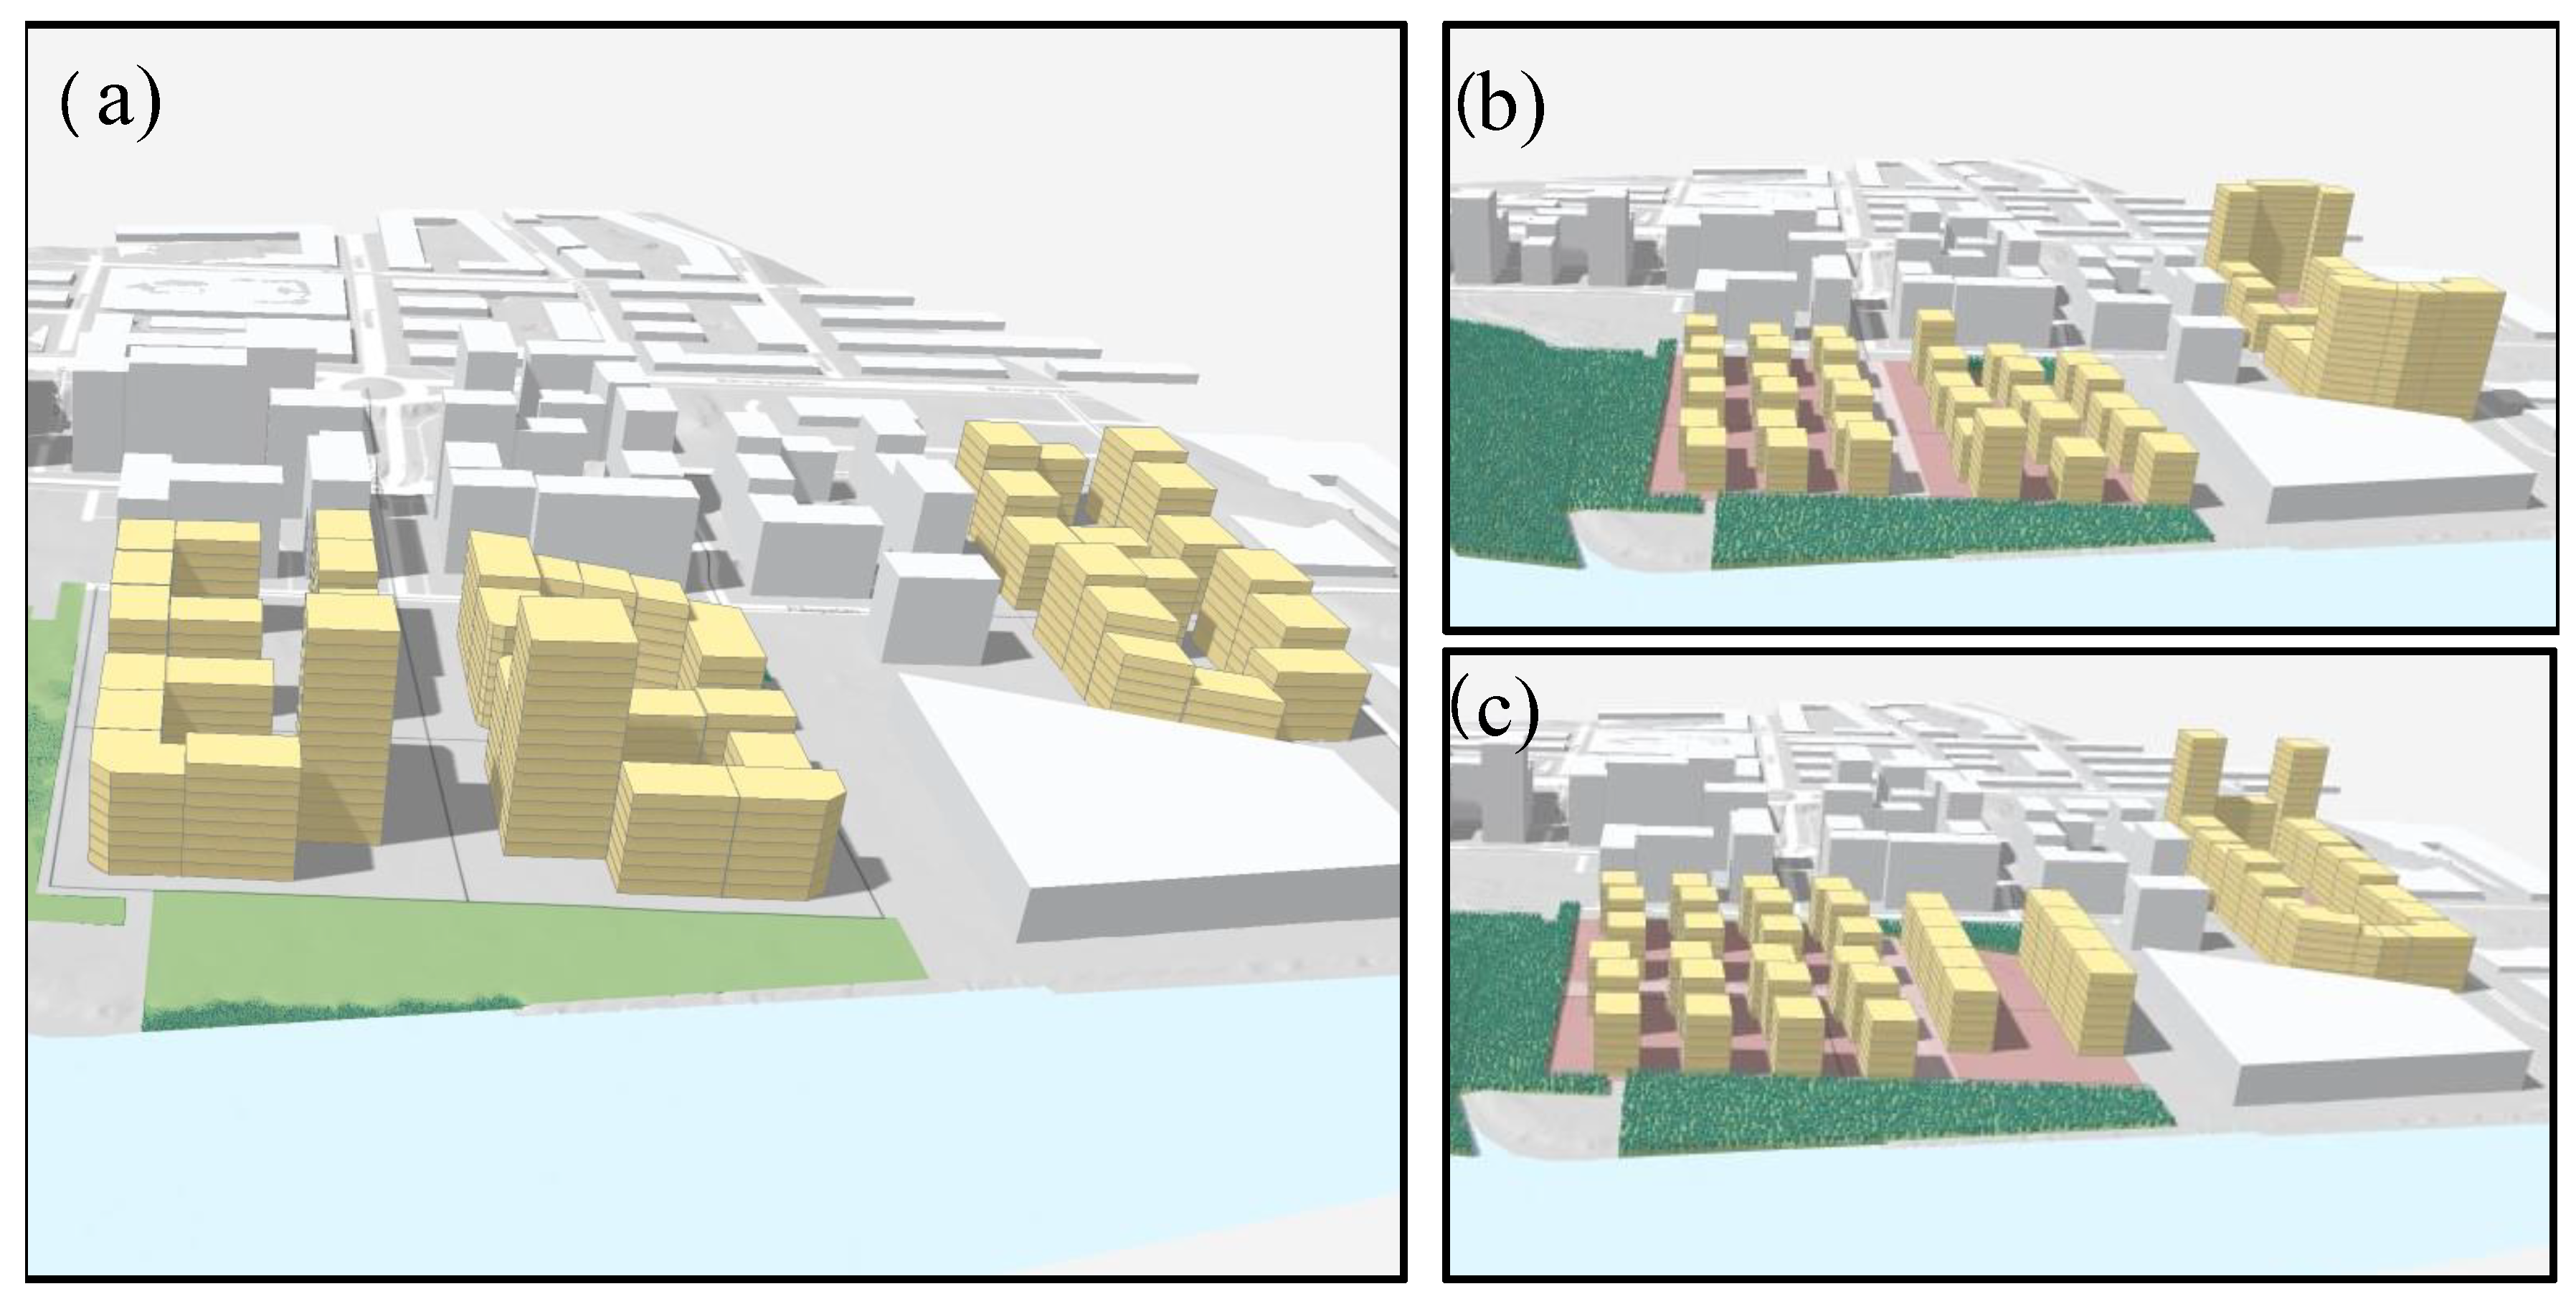
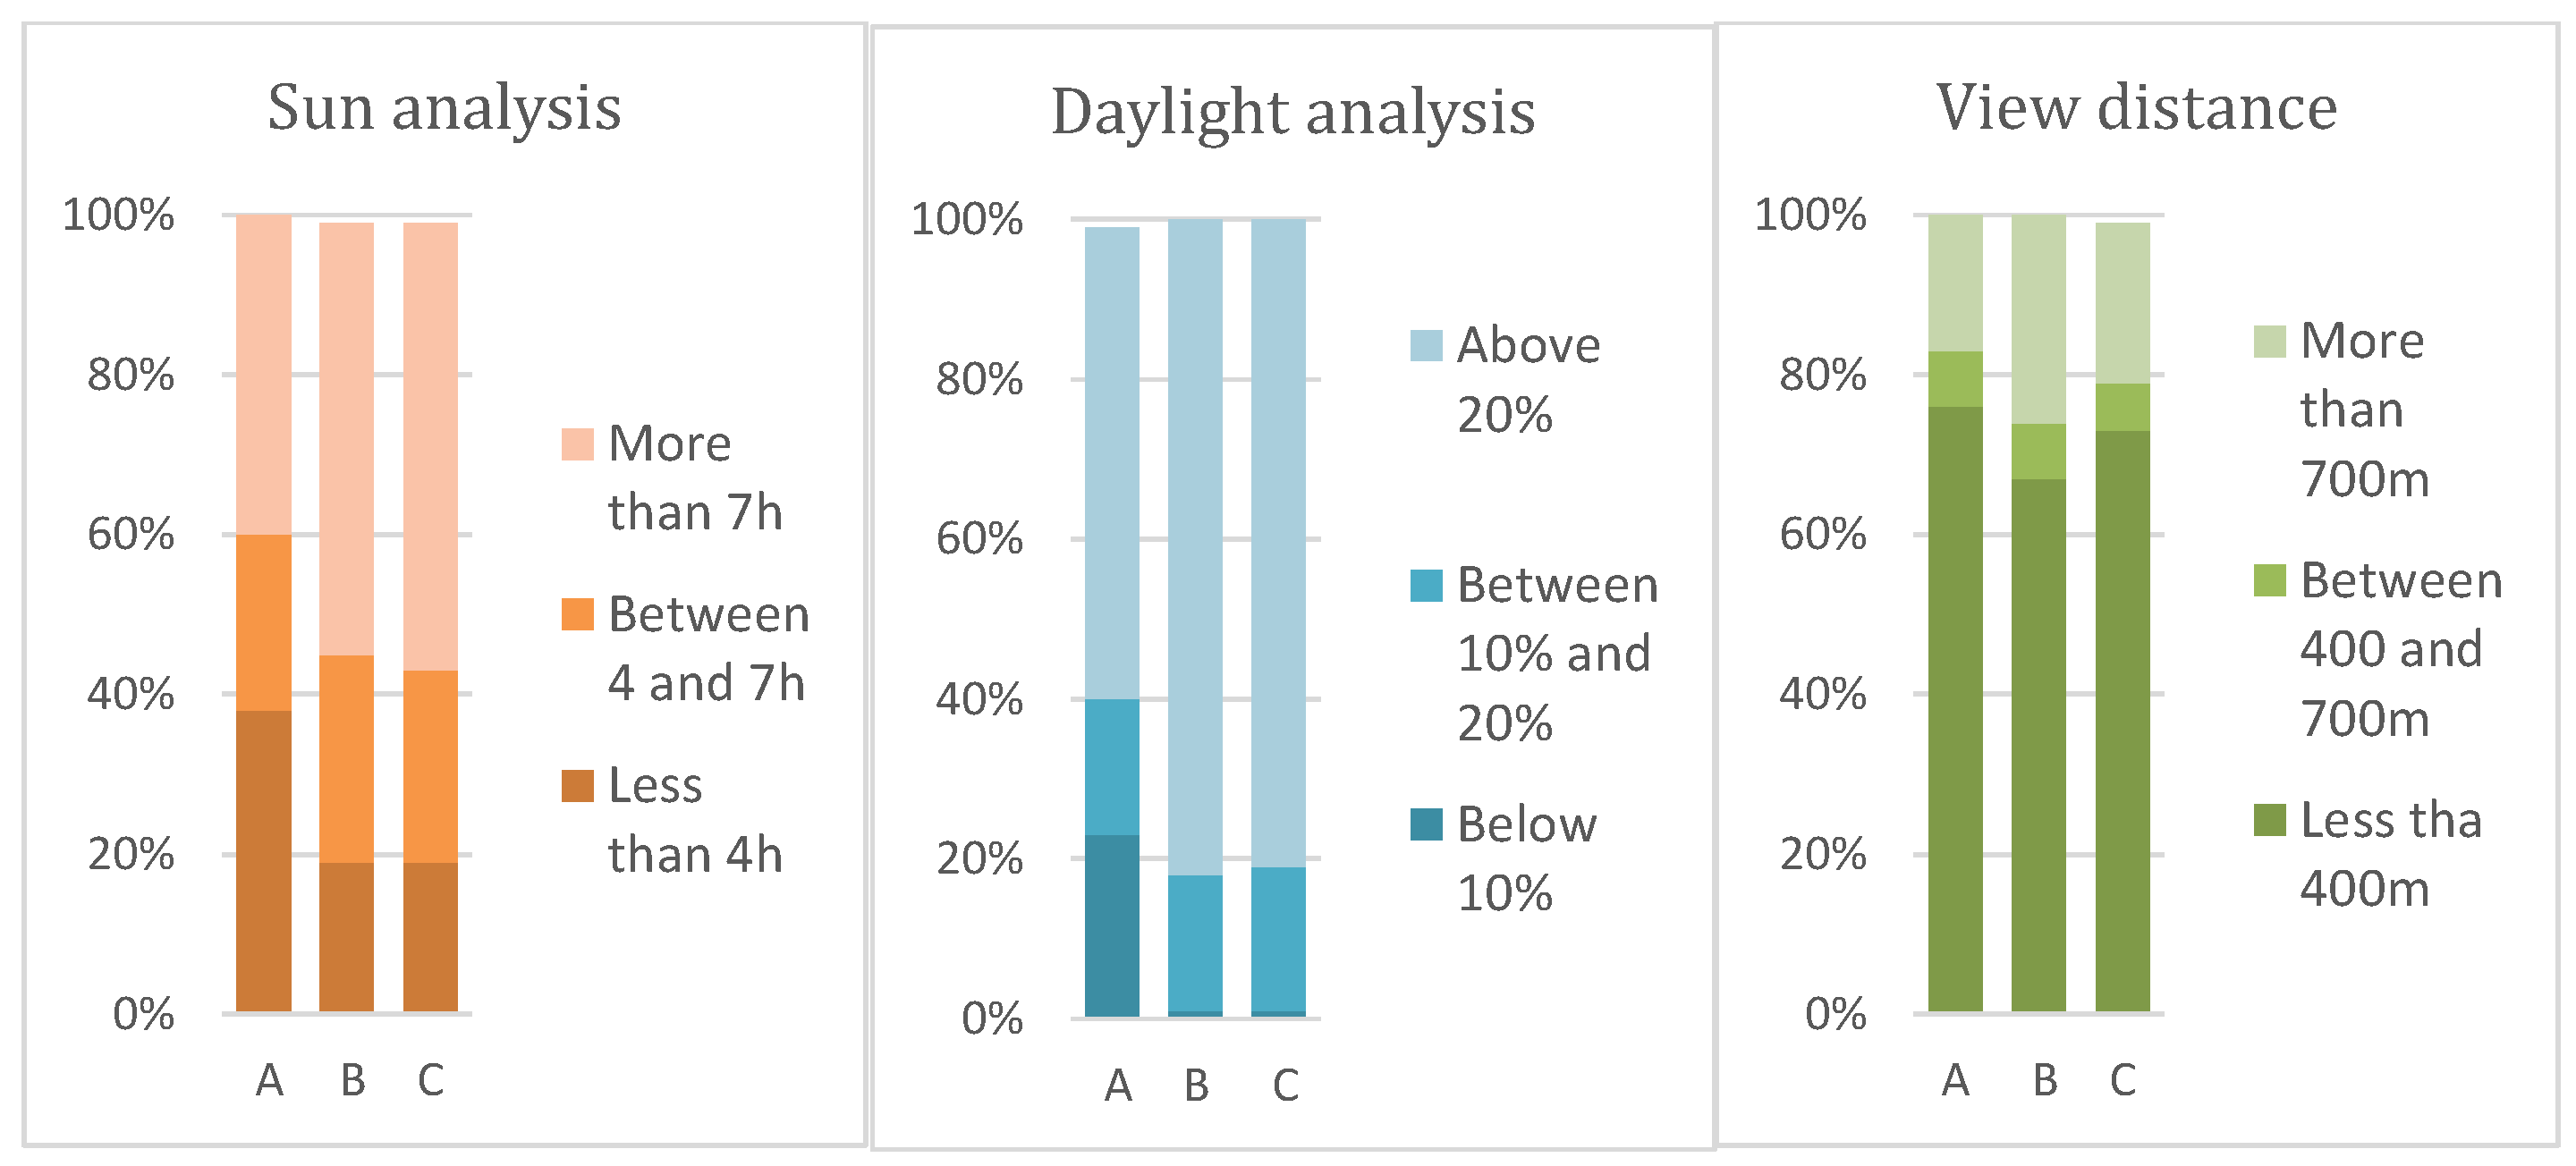
3.4. Case Study
4. Discussion
4.1. The Swedish Urban Planning Process
“A common problem is the difficult trade-offs between competing public interests.”
“Loss of political support during the planning process takes the most time.”
4.2. Digitalization
“So much is politically decided. It doesn’t matter that I’m an expert in my field if the politics pulls the other way.”
“... It is an unclear division of roles within the municipality, where too many interests must come together, that makes it difficult to carry out the planning process.”
“We are not able to buy all the tools and have staff with all the knowledge of the tools as they are used too rarely. Therefore, we have to buy consultancy services where it is needed instead. The result is then unfortunately a loss in the analysis. For example, when developing a 3D model, a lot of analysis occurs while the model is being developed. This analysis will not be the same of a ‘dead’ PDF image.”
4.3. Generative Design
5. Conclusions
Author Contributions
Funding
Institutional Review Board Statement
Informed Consent Statement
Data Availability Statement
Conflicts of Interest
Appendix A. Document Analysis


| Planning Documentation/Analysis |  | Plan Proposal |
|---|---|---|
| Public Interests | Governmental Interests | Content |
| Basic housekeeping Land and water areas are used for their most suitable intended purpose, considering nature, location and needs. Promote * Appropriate structure * Socially good living environment * Long-term good housekeeping * Good economic growth housing construction and development of housing stock Location regarding * Health and safety * Soil, rock, and water conditions, * Traffic, water supply, drainage, waste management, electronic communications, community services * Water, air pollution, and noise pollution * The risk of accidents, flooding, and erosion * Energy supply and energy management Housing * Large unaffected areas * Particularly sensitive ecological areas * Agriculture, forestry, and professional fishing * Natural, cultural, and, recreational values * Valuable substances or materials * Industrial installations production, energy production and distribution, communications, water supply, or waste management * Total defense | National interests, chapter 3 MB * Professional fishing * Natural environment * Cultural environment * Outdoor recreation * Valuable substances or material * Energy production—wind power * Communications * Water supply * Total defense Named national interests (Chapter 4 MB) * Vättern with islands and riparian areas * Emån * Natura 2000 MKN (Chapter 5 MB) Environmental quality standards for air, water, noise LIS (Chapter 7 MB) Areas for rural development in near the shore Health and safety (PBL) Human health and safety and the risk of accidents, flooding or erosion | During the consultation, the municipality shall report (Chapter 3 § 8 PBL) * The meaning of the proposal * The reasons for the proposal * The consequences of the proposal * The planning context that is relevant from a national, regional, inter-municipal, or other point of view Must be stated in the Masterplan (Chapter 3, § 5 PBL) * The basic features of the land and water use * How the built environment will be used, developed and conserved * How the municipality intends to meet the identified national interests and environmental quality standards * How to take account of national and regional objectives, plans, and programmers relevant to sustainable development. * How to meet the long-term need for housing, Rural development near the coast * The municipality’s approach to the risk of damage to the built environment that may result from flooding, landslides, and erosion related to climate change, and how such risks can be reduced or eliminated |
References
- Vaidya, H.; Chatterji, T. SDG 11 Sustainable Cities and Communities. In Actioning the Global Goals for Local Impact; Springer: Singapore, 2020. [Google Scholar] [CrossRef]
- UN General Assembly. Transforming Our World: The 2030 Agenda for Sustainable Development, 21 October 2015, A/RES/70/1. Available online: https://www.refworld.org/docid/57b6e3e44.html (accessed on 20 January 2022).
- Directive 2014/24/EU of the European Parliament and of the Council of 26 February 2014 on Public Procurement and Repealing Directive 2004/18/EC Text with EEA Relevance. Current Consolidated Version: 01/01/2022. Available online: http://data.europa.eu/eli/dir/2014/24/oj (accessed on 20 January 2022).
- European Commission. Urban Agenda for the EU ‘Pact of Amsterdam’, 30 May 2016. Available online: https://futurium.ec.europa.eu/en/urban-agenda (accessed on 15 March 2022).
- Csukás, M.S.; Bukovszki, V.; Reith, A. Challenges and Solutions for Organizational Design in Urban Digitalization. Eur. J. Sustain. Dev. 2020, 9, 615–629. [Google Scholar] [CrossRef]
- Storbjörk, S.; Hjerpe, M.; Glaas, E. Using Public–Private Interplay to Climate-Proof Urban Planning? Critical Lessons from Developing a new Housing District in Karlstad, Sweden. J. Environ. Plan. Manag. 2019, 62, 568–585. [Google Scholar] [CrossRef]
- Agudelo-Vera, C.M.; Mels, A.R.; Keesman, K.J.; Rijnaarts, H.H.M. Resource management as a key factor for sustainable urban planning. J. Environ. Manag. 2011, 92, 2295–2303. [Google Scholar] [CrossRef] [PubMed]
- Noardo, F.; Wu, T.; Arroyo Ohori, K.; Krijnen, T.; Stoter, J. IFC models for semi-automating common planning checks for building permits. Autom. Constr. 2022, 134, 104097. [Google Scholar] [CrossRef]
- Turrin, M.; von Buelow, P.; Stouffs, R. Design explorations of performance driven geometry in architectural design using parametric modeling and genetic algorithms. Adv. Eng. Inform. 2011, 25, 656–675. [Google Scholar] [CrossRef]
- Miao, Y.; Koenig, R.; Knecht, K.; Konieva, K.; Buš, P.; Chang, M.-C. Computational urban design prototyping: Interactive planning synthesis methods-a case study in Cape Town. Int. J. Archit. Comput. 2018, 16, 212–226. [Google Scholar] [CrossRef]
- Wang, J. Ranking engineering design concepts using a fuzzy outranking preference model. Fuzzy Sets Syst. 2001, 119, 161–170. [Google Scholar] [CrossRef]
- Benkő, M.; Bene, B.; Pirity, Á.; Szabó, Á.; Egedy, T. Real vs. Virtual City: Planning Issues in a Discontinuous Urban Area in Budapest’s Inner City. Urban Plan. 2021, 6, 150–163. [Google Scholar] [CrossRef]
- Olsson, P.O.; Johansson, T.; Eriksson, H.; Lithén, T.; Bengtsson, L.H.; Axelsson, J.; Roos, U.; Neland, K.; Rydén, B.; Harrie, L. Unbroken digital data flow in the built environment process-a case study in Sweden. In International Archives of the Photogrammetry, Remote Sensing and Spatial Information Sciences-ISPRS Archives; International Society for Photogrammetry and Remote Sensing: Hannover, Germany, 2019; pp. 1347–1352. [Google Scholar] [CrossRef]
- Eicker, U.; Weiler, V.; Schumacher, J.; Braun, R. On the design of an urban data and model-ing platform and its application to urban district analyses. Energy Build. 2020, 217, 109954. [Google Scholar] [CrossRef]
- Lin, Y. Social media for collaborative planning: A typology of support functions and challenges. Cities 2022, 125, 103641. [Google Scholar] [CrossRef]
- Yang, P.P.J.; Yamagata, Y. Urban Systems Design: From “science for design” to “design in science”. Environ. Plan. B Urban Anal. City Sci. 2019, 46, 1381–1386. [Google Scholar] [CrossRef]
- Feizizadeh, B.; Ronagh, Z.; Pourmoradian, S.; Gheshlaghi, H.A.; Lakes, T.; Blaschke, T. An efficient GIS-based approach for sustainability assessment of urban drinking water consumption patterns: A study in Tabriz city, Iran. Sustain. Cities Soc. 2021, 64, 102584. [Google Scholar] [CrossRef]
- Grason, J. An approach to computerized space planning using graph theory. In Proceedings of the 8th Design automation workshop, Atlantic City, NJ, USA, 28–30 June 1971. [Google Scholar]
- Flemming, U.; Woodbury, R. Software Environment to Support Early Phases in Building Design (SEED): Overview. J. Achitectural Eng. 1995, 1, 147–152. [Google Scholar] [CrossRef]
- Liggett, R.S. Automated facilities layout: Past, present and future. Autom. Constr. 2000, 9, 197–215. [Google Scholar] [CrossRef]
- Nagy, D.; Villaggi, L.; Benjamin, D. Generative Urban Design: Integrating Financial and Energy Goals for Automated Neighborhood Layout. In Proceedings of the 2018 Symposium on Simulation for Architecture and Urban Design (SimAUD 2018), Delft, The Netherlands, 5–7 June 2018; Society for Modeling and Simulation International (SCS): Vista, CA, USA, 2018; pp. 190–197. [Google Scholar] [CrossRef]
- Yang, P.P.-J.; Chang, S.; Saha, N.; Chen, H.W. Data-driven planning support system for a campus design. Environ. Plan. B Urban Anal. City Sci. 2020, 47, 1474–1489. [Google Scholar] [CrossRef]
- Koenig, R.; Miao, Y.; Aichinger, A.; Knecht, K.; Konieva, K. Integrating urban analysis, generative design, and evolutionary optimization for solving urban design problems. Environ. Plan. B Urban Anal. City Sci. 2020, 47, 997–1013. [Google Scholar] [CrossRef]
- Persson, C. Perform or conform? Looking for the strategic in municipal spatial planning in Sweden. Eur. Plan. Stud. 2020, 28, 1183–1199. [Google Scholar] [CrossRef]
- Bjärstig, T.; Thellbro, C.; Stjernström, O.; Svensson, J.; Sandström, C.; Sandström, P.; Zachrisson, A. Between protocol and reality–Swedish municipal comprehensive planning. Eur. Plan. Stud. 2018, 26, 35–54. [Google Scholar] [CrossRef]
- Sveriges Riksdag. Plan-Och Bygglag (2010:900). Available online: https://www.riksdagen.se/sv/dokument-lagar/dokument/svensk-forfattningssamling/plan--och-bygglag-2010900_sfs-2010-900 (accessed on 20 January 2022).
- Sveriges Riksdag. Plan-Och Byggförordning (2011:338). 2022. Available online: https://www.riksdagen.se/sv/dokument-lagar/dokument/svensk-forfattningssamling/plan--och-byggforordning-2011338_sfs-2011-338 (accessed on 20 January 2022).
- Boverket. Så Planeras Sverige. 2019. Available online: https://www.boverket.se/sv/samhallsplanering/sa-planeras-sverige/ (accessed on 20 January 2022).
- The National Board of Housing, Building and Planning (2020). Guide to the Detailed Planning Process. Available online: https://www.boverket.se/sv/om-boverket/guider/hur-en-detaljplan-tas-fram/ (accessed on 29 March 2022).
- National Intrests Boverket (Allmänna Intressen). 16 December 2020. Available online: https://www.boverket.se/sv/PBL-kunskapsbanken/planering/oversiktsplan/allmanna-intressen/ (accessed on 20 January 2022).
- Enviormental code Miljöblaken: (1998:808) FROM 2021. Available online: https://www.riksdagen.se/sv/dokument-lagar/dokument/svensk-forfattningssamling/miljobalk-1998808_sfs-1998-808 (accessed on 20 January 2022).
- Jönköping Länstyrelsen, Report 2019, A Current Overview Plan. Available online: https://www.lansstyrelsen.se/jonkoping/tjanster/publikationer/2019/201901-en-aktuell-oversiktsplan.html (accessed on 20 January 2022).
- Boverket 2022, Digitization of the Community Building Process, Reviewed: 3 May 2022. Available online: https://www.boverket.se/sv/samhallsplanering/digitalisering (accessed on 8 May 2022).
- Sveriges Kommuner och Regioner, Kommungruppsindelning, (11 Mars 2021). Available online: https://skr.se/skr/tjanster/kommunerochregioner/faktakommunerochregioner/kommungruppsindelning.2051.html (accessed on 20 January 2022).
- Yrkeskollen: Vad Tjänar en Planarkitekt i lön 2021? Available online: https://yrkeskollen.se/lonestatistik/planarkitekt/ (accessed on 9 May 2022).


| Q | Answers | N° | Frequency | Q | Answers | N° | Frequency |
|---|---|---|---|---|---|---|---|
| 1. Factors | Noise | 143 | 87.70% | 4. Digital Tools | CAD | 113 | 72.90% |
| Outdoor environment | 142 | 87.10% | GIS | 128 | 82.58% | ||
| Indoor environment | 126 | 77.30% | 3D modelling | 15 | 9.68% | ||
| Daylight | 122 | 74.80% | Others | 17 | 10.97% | ||
| Distance view | 110 | 67.50% | City modelling programs | 18 | 11.61% | ||
| Wind | 51 | 31.30% | Generative design | 7 | 4.52% | ||
| Traffic, infrastructure and mobility | 27 | 16.60% | 5. Information Format | PDF document | 141 | 92.80% | |
| don’t know/not relevant | 16 | 9.80% | 2D document | 137 | 90.10% | ||
| Geotechnical, water, environmental and cultural issues | 8 | 4.90% | GIS fileformat document | 80 | 52.60% | ||
| Aesthetic/architectural values and landscape | 5 | 3.10% | 3D model | 56 | 36.80% | ||
| 2. People | Between 5 and 10 people | 65 | 59.10% | Don’t Know | 4 | 2.60% | |
| Less than 5 people | 21 | 19.10% | Script/database document | 4 | 2.60% | ||
| Between 15 and 20 people | 14 | 12.70% | 6. Issues | Bureaucracy | 54 | 35.10% | |
| don’t know/not relevant | 8 | 7.30% | Communication | 51 | 33.10% | ||
| More than 20 people | 2 | 1.80% | Lack of knowledge about work strategies | 42 | 27.30% | ||
| 3. Phases | Preparation of the draft plan | 144 | 88.34% | Lack of knowledge about digital tools | 35 | 22.70% | |
| Comments from the Consultation | 31 | 19.02% | None of the above | 29 | 18.80% | ||
| Others | 10 | 6.13% | Administrative problem | 22 | 14.30% | ||
| Review of the draft plan | 7 | 4.29% | Lack of non-digital | 21 | 13.60% | ||
| Adoption of the detailed plan | 7 | 4.29% |
| Scenario A | Scenario B | Scenario C | |
|---|---|---|---|
| BTA | 82,622 m2 | 73,020 m2 | 71,994 m2 |
| BOA | 66,366 m2 | 58,581 m2 | 57,779 m2 |
| Average number of stories | 7.5 | 6.7 | 6.7 |
| Total Volumen built | 251,000 m3 | 219,000 m3 | 216,000 m3 |
Publisher’s Note: MDPI stays neutral with regard to jurisdictional claims in published maps and institutional affiliations. |
© 2022 by the authors. Licensee MDPI, Basel, Switzerland. This article is an open access article distributed under the terms and conditions of the Creative Commons Attribution (CC BY) license (https://creativecommons.org/licenses/by/4.0/).
Share and Cite
Varela, E.N.; Öhrling, K.; Moscati, A. Analysis of the Challenges in the Swedish Urban Planning Process: A Case Study about Digitalization. Sustainability 2022, 14, 16333. https://doi.org/10.3390/su142416333
Varela EN, Öhrling K, Moscati A. Analysis of the Challenges in the Swedish Urban Planning Process: A Case Study about Digitalization. Sustainability. 2022; 14(24):16333. https://doi.org/10.3390/su142416333
Chicago/Turabian StyleVarela, Elena Núñez, Kristoffer Öhrling, and Annika Moscati. 2022. "Analysis of the Challenges in the Swedish Urban Planning Process: A Case Study about Digitalization" Sustainability 14, no. 24: 16333. https://doi.org/10.3390/su142416333
APA StyleVarela, E. N., Öhrling, K., & Moscati, A. (2022). Analysis of the Challenges in the Swedish Urban Planning Process: A Case Study about Digitalization. Sustainability, 14(24), 16333. https://doi.org/10.3390/su142416333