Article

A Novel Multi-Scale Feature Fusion-Based 3SCNet for Building Crack Detection

1
Department of Computer Engineering & Applications, GLA University, Mathura 281406, Uttar Pradesh, India
2
Advanced Construction Engineering Research Center, Department of Civil Engineering, GLA University, Mathura 281406, Uttar Pradesh, India
3
Department of Computer Science and Information Engineering, National Cheng Kung University, Tainan 701, Taiwan
4
School of Computing, Graphic Era Hill University, Dehradun 248002, Uttarakhand, India
5
School of Computer Science, University of Petroleum and Energy Studies, Dehradun 248007, Uttarakhand, India
6
Department of Basic Science, College of Science and Theoretical Studies, Saudi Electronic University, Riyadh-Male Campus, Riyadh 13316, Saudi Arabia
*
Author to whom correspondence should be addressed.
Sustainability 2022, 14(23), 16179; https://doi.org/10.3390/su142316179
Submission received: 15 October 2022 / Revised: 19 November 2022 / Accepted: 23 November 2022 / Published: 4 December 2022

Abstract

:
Crack detection at an early stage is necessary to save people’s lives and to prevent the collapse of building/bridge structures. Manual crack detection is time-consuming, especially when a building structure is too high. Image processing, machine learning, and deep learning-based methods can be used in such scenarios to build an automatic crack detection system. This study uses a novel deep convolutional neural network, 3SCNet (3ScaleNetwork), for crack detection. The SLIC (Simple Linear Iterative Clustering) segmentation method forms the cluster of similar pixels and the LBP (Local Binary Pattern) finds the texture pattern in the crack image. The SLIC, LBP, and grey images are fed to 3SCNet to form pool of feature vector. This multi-scale feature fusion (3SCNet+LBP+SLIC) method achieved the highest sensitivity, specificity, an accuracy of 99.47%, 99.75%, and 99.69%, respectively, on a public historical building crack dataset. It shows that using SLIC super pixel segmentation and LBP can improve the performance of the CNN (Convolution Neural Network). The achieved performance of the model can be used to develop a real-time crack detection system.

1. Introduction

Feature descriptors for object identification have received substantial attention in the past several years. Several recent approaches have employed dense features taken from areas of the input picture that are spaced regularly [1]. Crack detection in bridge post images is a critical safety operation that has to be automated. Only photographs of cracks captured from a distance of less than a few centimeters from the surface have been employed in previous practices. [2]. It is necessary to do periodic manual visual inspections on civil infrastructure to verify that it is in good working order and can continue to fulfill service expectations. However, many incidents may be traced back to a need for more inspection and evaluation. More than 140 people were wounded when the I-35W Highway Bridge collapsed in Minneapolis, MN, USA on 23 July 2007 [3]. Hence, the building structures should be inspected [4,5]. Genetic programming was used by Nishikawa et al. [6] to produce an image filter that detects fractures. The filter was modified depending on the image’s resolution, average brightness, and standard deviation. They used an image filter to remove noise, detected the endpoints and inflection points in the residual cracks, and assessed the lengths and angles of the endpoint and endpoint-inflection point connections in distinct cracks to link the locations appropriately [2,6]. Computer vision approaches for construction applications have grown significantly over the last ten years, owing to the accessibility of low-cost, high-quality, and convenient visual sensing technology (e.g., digital cameras). Modern Structural Health Monitoring (SHM) frameworks are increasing, including computer vision components [7]. Fractures may form on the surfaces of concrete buildings because they are subjected to harsh conditions, such as cyclic loading and fatigue pressures [8,9]. Buildings’ cracks substantially influence their durability and make it easier for external hostile chemicals to enter the reinforcing bars and induce corrosion [10,11]. As a result, local stiffness and material discontinuities are also reduced by fractures in the structural systems [12,13]. If cracks are not found and fixed on time, the structure’s dependability and performance will be negatively affected [14,15]. The structural integrity and serviceability of the structures should be ensured to provide the safety and reliability of the infrastructures to the users. Some common waste materials, such as fly ash and metakaolin, are added to the concrete structures for crack prevention [16,17,18]. In order to detect the early signs of concrete cracking problems, Chalioris et al. [19,20] created a wire-free impedance/admittance monitoring program. The development of cracks in concrete buildings was also monitored using non-destructive testing methods such as thermal, infrared, laser, ultrasound, and radiography [21]. Although these procedures provide accurate findings, they are challenging to implement due to their massive apparatus and labor-intensive nature [22]. Cracks have been detected and located using a variety of image-processing approaches, including filtering and feature extraction [23,24,25,26,27,28]. Furthermore, segmentation methods and fuzzy transformations were used to distinguish the fracture areas [27]. Even while image processing technologies could identify structural fractures in real time, the fluctuation in external environmental elements such as light, shadows, and rough surfaces hindered their use. Pattern recognition and extraction were used to boost the effectiveness of image processing methods [29]. In addition, deep CNN is widely used in several areas, similar to domain recognition of acoustic communication using a Bidirectional LSTM [30]. Visual question answering using a graph convolutional network [31], a glaucoma diagnosis using VGG16 [32], a bone fracture diagnosis [33], and an algal classification using ResNeXt [34]. There are several advantages to using CNN (Convolutional Neural Network) models instead of traditional image processing and artificial intelligence approaches because of their ability to extract meaningful characteristics from input data. CNN-based fracture detection was used to diagnose substantial structural damage [35]. Similarly, Bayesian algorithms and deep learning segmentation algorithms were employed to find fractures in nuclear power plants and tunnels, respectively [36].
Detection and categorization of cracks using Deep Convolutional Neural Networks (DCNNs) have been recently investigated [37,38]. In most DCNNs, semantic segmentation was employed to associate each pixel with a fracture categorization [39]. It takes a lot of time and data to train deep-learning networks. Pretrained DCNNs utilize fewer data and produce reliable results that may help reduce errors. Recently fine-tuned DCNNs such as GoogleNet, AlexNet, SqueezeNet ResNet, and VGGNet have been utilized to identify and categorize fractures in concrete constructions. Further, crack classification on concrete pavement and buildings was performed using a pre-trained VGG19 model [40]. SegNet, U-Net, and ResNet models were used to segment cracks [41,42,43,44]. In addition, researchers identified pixel-level deterioration in concrete structures, such as fractures, spalling, efflorescence, and holes, using a DenseNet-121 [45]. To improve the segmentation performance on concrete surfaces using the DCNNs model based on VGG16, architecture has been reported in the study [46]. In short, all of these methods are capable of performing crack identification. However, machine learning methods are dependent on handcrafted features due to a suboptimal performance. On the other side, the deep learning method extracts features automatically from images and provides notable classification performance. The deep learning methods discussed above are state-of-the-art, and models and their computation cost are high due to the high number of trainable neurons. In the proposed method, a novel 3SCNet model has been developed which is light weighted and takes input from three scales. This feature fusion model is capable to produce high classification accuracy on a small dataset.
The key contribution of the study is as follows:
(1)
The proposed study demonstrates a novel three-scale feature fusion model capable of producing high classification accuracy.
(2)
The SLIC and LBP, along with the grey image, improve the building crack detection with minimum loss.
(3)
The proposed model has fewer parameters and high sensitivity for building crack detection.
The rest of the paper is organized as follows. In Section 2, the proposed novel 3SCNet deep CNN model architecture and the SLIC segmentation algorithm along with the LBP image calculation is discussed. The result of the two methods is described in Section 3. In Section 4, a comparison of state-of-arts methods is elaborated. Finally, the paper concludes with a brief summary in Section 5.

2. The Proposed Method

In the literature, we have discussed several state-of-the-art methods for building crack detection. Some studies experimented on the pre-trained fine-tuned model, which takes less computation time, but performance is not remarkable due to the class mismatch in the ImageNet dataset. Several methods trained their model on the dataset. After that, validation is performed and achieved excellent performance. However, these methods have high computation costs, due to a large number of trainable parameters. Therefore, we have designed 3SCNet with high performance on fewer parameters shown in Table 1.
This model takes the greyscale and their corresponding SLIC and LBP images as an input. After that, features from three scales are extracted and fused to form a feature vector for the classification of a building defect. The detailed architecture of the proposed model is shown in Figure 1.

2.1. The SLIC Segmented Image Formation

Image segmentation is the process of assigning labels to an object in an image. This is an intermediate step that is used to improve the classification performance of the model. In this study, the SLIC superpixel segmentation technique has been applied which is simple and efficient. The SLIC segmentation technique starts with assigning an initial cluster K to the center Ci= [li, ai, bi, xi, yi] T to a sample grid S. After that, the move cluster centers to the lowest gradient position in a 3 × 3 neighborhood. Then, label i for each pixel assigned, and the initial distance is set to infinity. Once the initial cluster has been assigned to each cluster, a center update step is used to adjust the cluster center so that the mean [l, a, b, x, y]T vector of all the classes belongs to the cluster [47]. In the proposed steps, the SLIC superpixel for k = 80, 100, and 120 is calculated as shown in Figure 2.

2.2. LBP Image Formation

The texture of the crack area of a building is different from the non-crack region. A powerful texture descriptor can be handy to differentiate these regions. The LBP (Local Binary Pattern) descriptor first used by Ojala et al. [48] describes the local as well as global texture information of an image. In the proposed study, first the LBP and then the texture descriptor is used to assign a binary pattern to each pixel p c . After that, a window of a 3 × 3 neighborhood is used to calculate the difference of center pixel value from its eight neighbors using Equation (1). The LBP image calculation is shown in Figure 3.
The LBP of a central pixel p c   is calculated.
L B P Q , R ( p c ) = q = 0 Q 1 ( q c p c ) 2 q
If the value of q c p c   > 0, then 1 is assigned in Equation (1); otherwise, it is 0. This process will create a pool of binaries 0 and 1, which can be combined starting from the top-left in a clockwise direction. Finally, the LBP image is constructed using a texture descriptor and a LBP distribution pattern. The LBP histogram vector H for image representation is given by
H = i = 1 w j = 1 D δ ( L B P Q , R ( i , j ) k )
where W and D are the width and height of the image and δ is a heavy side function.

2.3. Proposed 3SCNet Deep CNN Model

In the proposed study, a novel 3SCNet deep CNN model has been developed in which three inputs, the grey image, and their corresponding SLIC and LBP images are fed to the model. The 3SCNet is a three-scale model and each of them has six convolution layers of a 3 × 3 filter. The output of these convolution layers is 16, 32, 64, 128, 256, and 512, respectively. In addition, a Rectified Linear Unit (ReLU) activation, a batch normalization, and a global average pooling of 2 × 2 are applied to each of these layers. The ReLU function was used to remove gradient descent problems and to avoid saturation of the model. Further, batch normalization accelerates training, which helps the model learn features and reduce the training time. The global average pooling layers do not use parameters for optimization, thus avoiding overfitting. The average operation over the feature maps makes the model more robust to spatial translations in the data. After that, features from the three scales are fused to generate a features pool of 4 × 4 × 1536. The feature extracted from the SLIC, grey, and LBP images are
A = { a 1 , a 2 .......... a n }
B = { b 1 , b 2 .......... b n }
C = { c 1 , c 2 .......... c n }
where n = 512 . After that, the concatenation of these features is calculated as
F c o n = A B C = ( a 1 , a 2 , .... a n , b 1 , b 2 , .... b n , c 1 , c 2 , c n )
where, F c o n represents the fused feature vector with a total feature of 1536. The fused tensor passes to the classification module, which consists of a flattened layer, a dense layer of 1024, a Relu layer, and a dense layer of two neurons.
The softmax activation is used to predict the image as a crack or non-crack. The functionality of the softmax function is to convert logits into probabilities by considering the exponent of each output layer [49]. In the present study, the input vector ϕ and the feature set x is passed to the system. To determine the classes, the value of k is set to 2 as we have to consider the binary (crack vs. non-crack) classification problem. For labeling, the class variable j is used and a bias W 0 X 0 is added to each iteration to predict output. The softmax optimizer is defined as
p ( y = j | ϕ ( i ) ) = e ϕ ( i ) j = 0 k e ϕ k ( i )
where ϕ = W 0 X 0 + W 1 X 1 + ............. + W k X k

2.3.1. Local Response Normalization (LRN)

The saturation of the deep CNN can be avoided using LRN. In RLN, the activation function ReLU can improve the feature learning ability of the neuron, even in small samples. Neighborhood neurons become more sensitive towards features and the activity of x u , v j neurons can be calculated at a place (u,v) by applying the i for the generalization of resources. After that, ReLU activation is applied, which aids non-linearity. The LRN b u , v j can be calculated using the formula shown in Equation (9)
b u , v j = x u , v j / ( t + x i max ( 0 , j , n / 2 ) min ( N , 1 , j + n / 2 ) ( x u , v i ) 2 ) γ
where N = Total channels, i = the output of the filter i, and t , x , n , γ = different hyper-parameters. These hyperparameters t , x , n , γ find the maximum pixel intensity during LRN and enhance the feature map. In addition, division by zero is avoided by setting t = 2. The value γ = 0.75 is set in the experiment.

2.3.2. Loss Function

In a deep CNN-based approach, training and validation loss plays an important role in deciding model robustness. A model is considered highly sensitive if the loss is minimal. Therefore, in the proposed study for each epoch, training and validation loss is calculated using Equation (10)
3 S C N e t _ L o s s = 1 N i = 1 N ( ( x i log ( Y i ) + ( 1 x i ) log ( 1 Y i ) )
where N = 2, Yi = ith scalar value in the model output and xi=corresponding target value.
The Algorithm 1 of the proposed method is described as
Algorithm 1: Building crack detection using 3SCNet
Algorithm 1
1: Create a crack and non-crack image dataset
2: Convert RGB image to grey image
3: Find the SLIC image using the method discussed in Section 2.1
4: Find the LBP image using the method discussed in Section 2.2
5: for I = 1 to 50 train the 3SCNet
   (a): Input the SLIC, grey, and LBP images to 3SCNet
   (b): Apply Equation (7) and Equation (8) to convert logits into probability values
6: For J = 1 to 50 do
     (a) Find the training accuracy
     (b) Find the validation accuracy
     (c) Find the loss of the hybrid 3SCNet
7: Plot training and validation loss graph for the 50 epochs

3. Results

3.1. Dataset

The performance validation of the proposed method is performed on the dataset collected from the Mendeley data source named Historical_Building_Crack_2019. This dataset contains 3886 images with annotated RGB images, out of which 757 are crack and 3139 are non-crack. The raw image was captured using a Canon camera (Canon EOS REBEL T3i) with a 5184 × 3456 resolution for the historical buildings, such as the Mosque (Masjed) of Amir al-Maridani, located in Sekat Al Werdani, El-Darb El-Ahmar, in the Cairo Governorate [50].

3.2. The Performance Evaluation Mathematical Method

The performance evaluation of the model's Accuracy (Acc), Precision (Pre), Recall (Re), F1-Score, and Matthew Correlation Coefficient (MCC) is calculated from each of the confusion matrices using indicators TN (True Negative), TP (True Positive), FN (False Negative), and FP (False Positive). The evaluation method is shown in Table 2.

3.3. Building Crack Detection Using the SLIC, Greyscale, and LBP Image Input to 3SCNet

Building crack detection is essential as soon as possible to save the life of people. In the proposed study, a novel multi-scale deep CNN model 3SCNet is used for crack detection. All simulations performed using the Keras library have been conducted with a back-end TensorFlow on a Windows 10 operating system with 128 GB RAM with dual 8 GB graphics. The method starts with preprocessing steps in which the image is resized to 256 × 256 × 3 pixels. After that, greyscale and their corresponding SLIC and LBP images are fed to the model. The model is trained with an initial learning rate of 0.001 for 50 epochs with a batch size of 32. To avoid biased performance, a five-fold cross-validation scheme is applied since, in the dataset, crack and non-crack images are unequal.
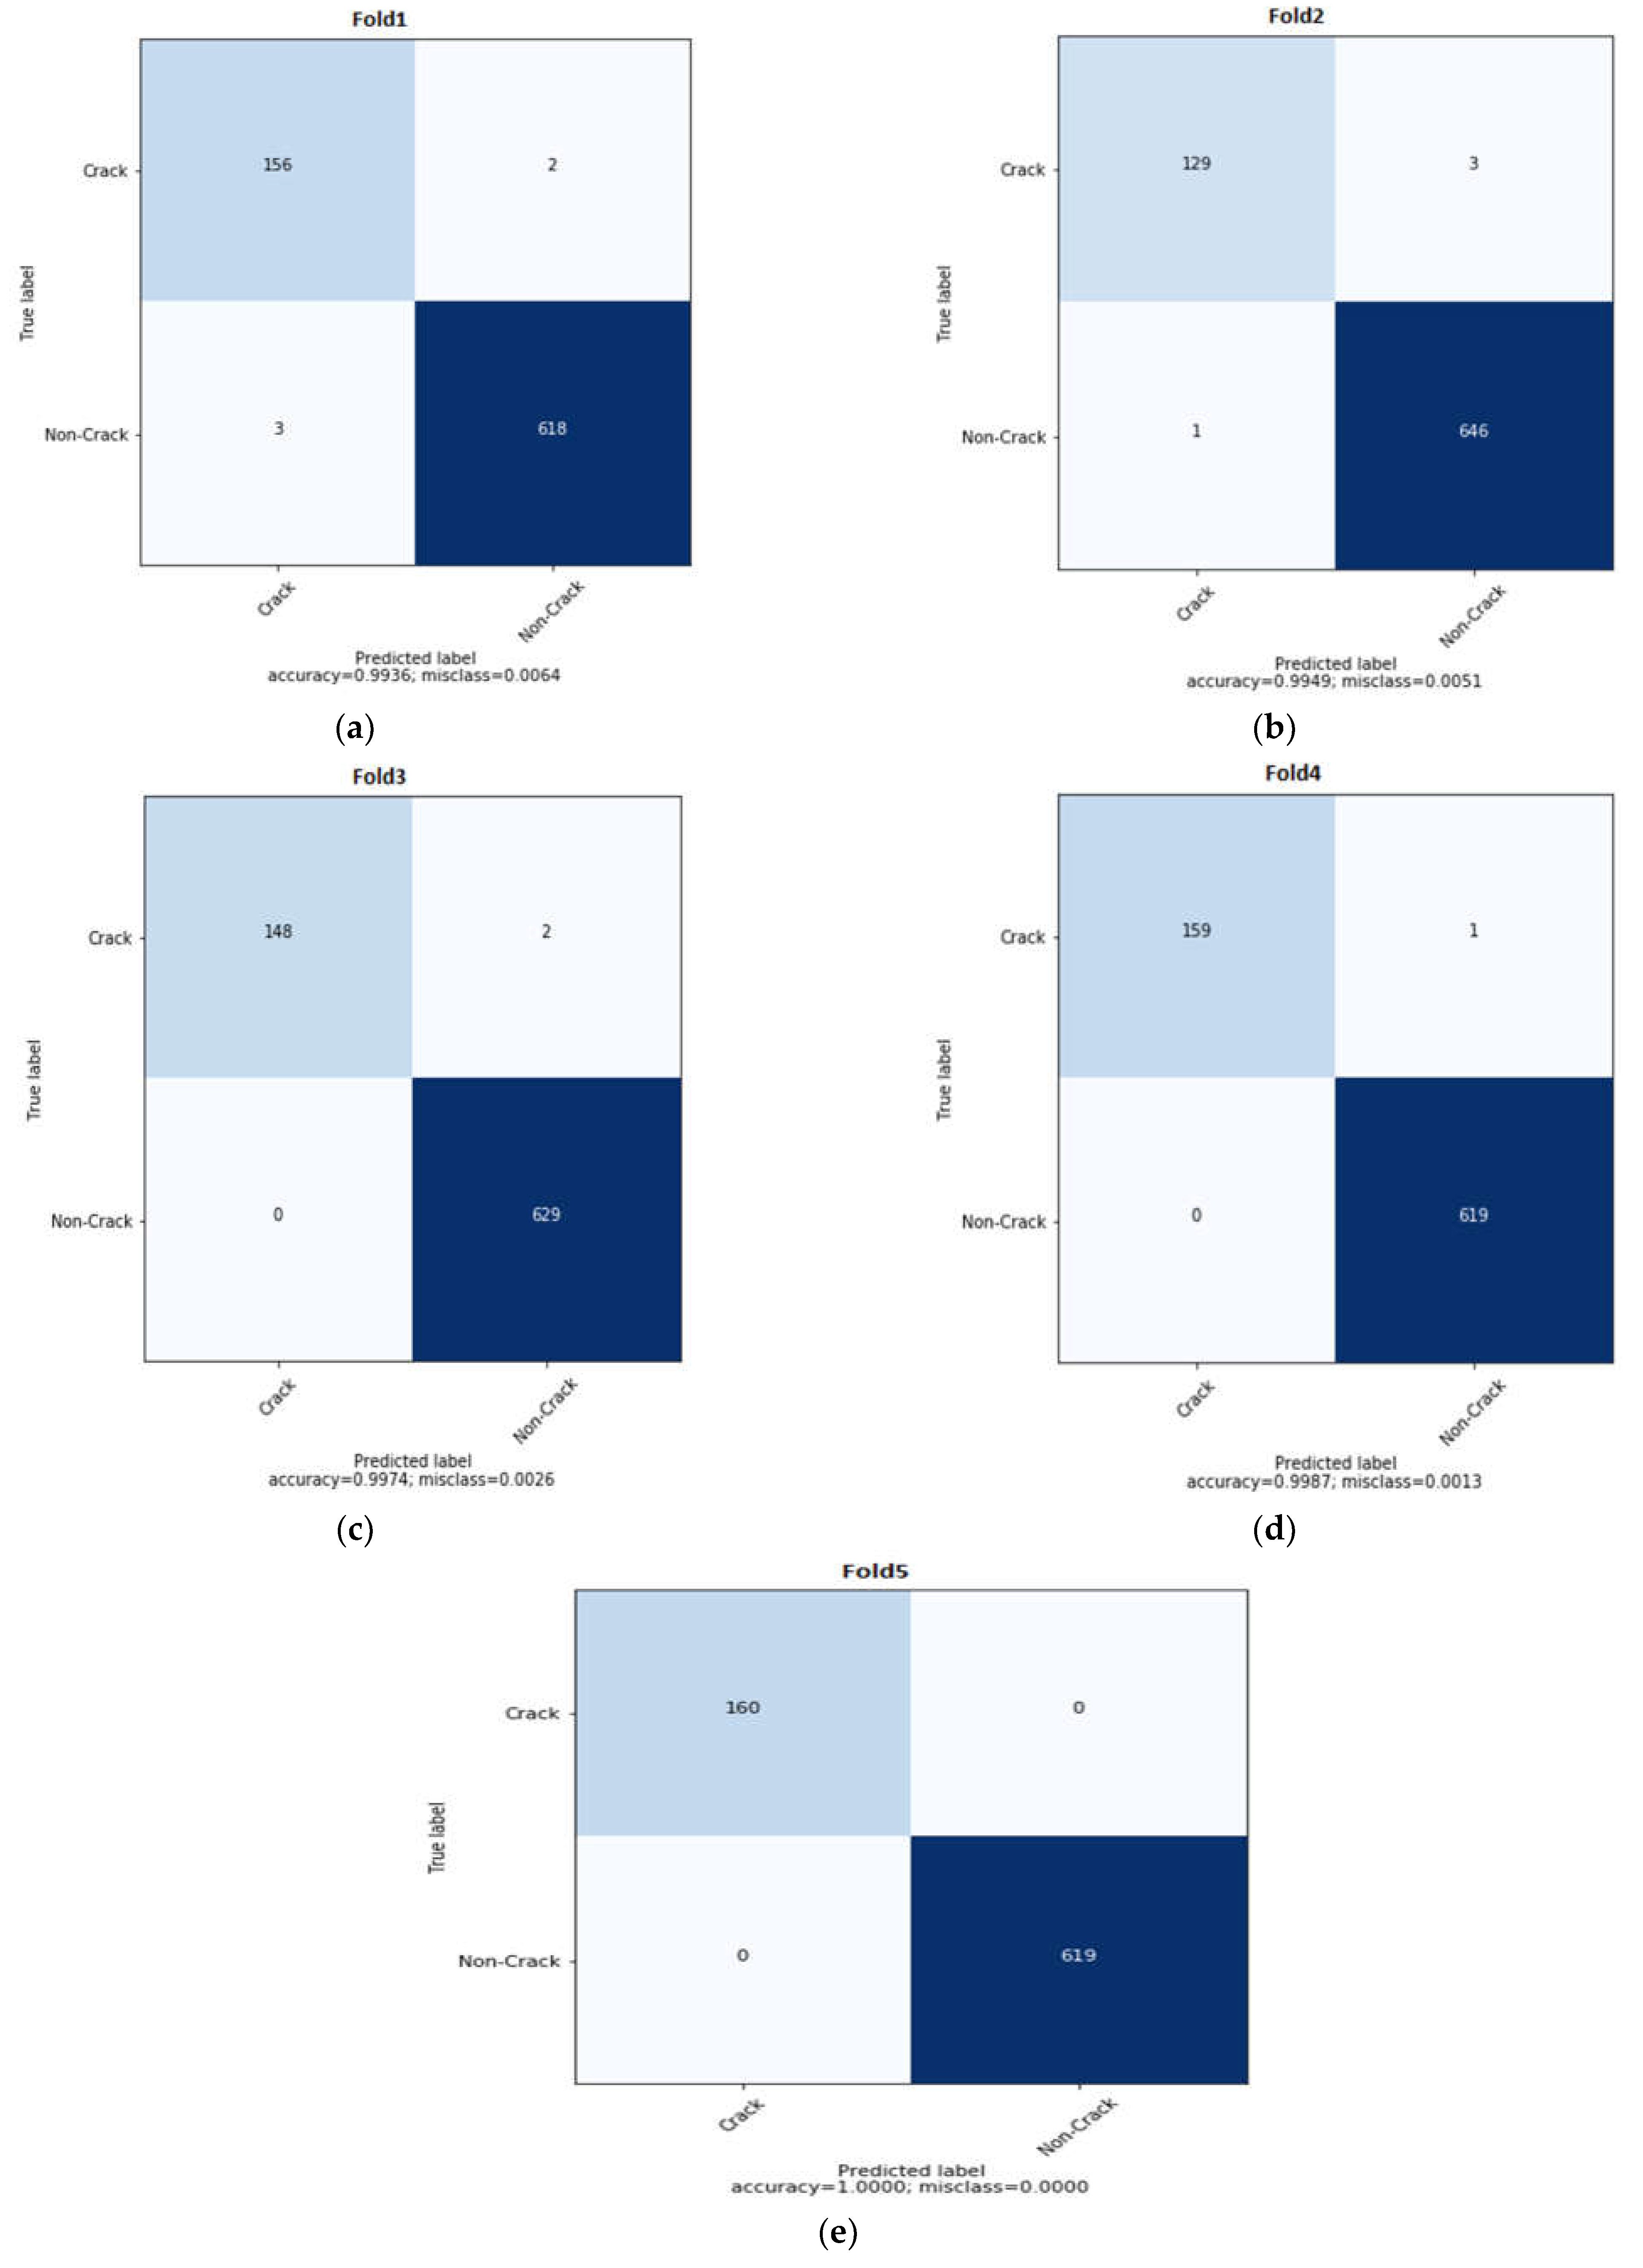
The five-fold cross-validation dataset is divided into five subsets. Out of these five subsets, one is used for testing and the rest of the four subsets are used for training. For each fold, a confusion matrix is plotted, as shown in Figure 4. In CM1 for Fold 1, we can see two false positives and three false negative values. Similarly, in CM for fold two, there are three false positives and one false negative. From these confusion matrices, performance measures are calculated using true indicators and mathematical formulas, as discussed in Table 2. Accuracy, Precision, Recall, F1-Score, and MCC for each fold is calculated and the average of these values is used to demonstrate the final performance of the model. In Table 3, we can see that all these performances gradually increase and the highest value was achieved for Fold 5.
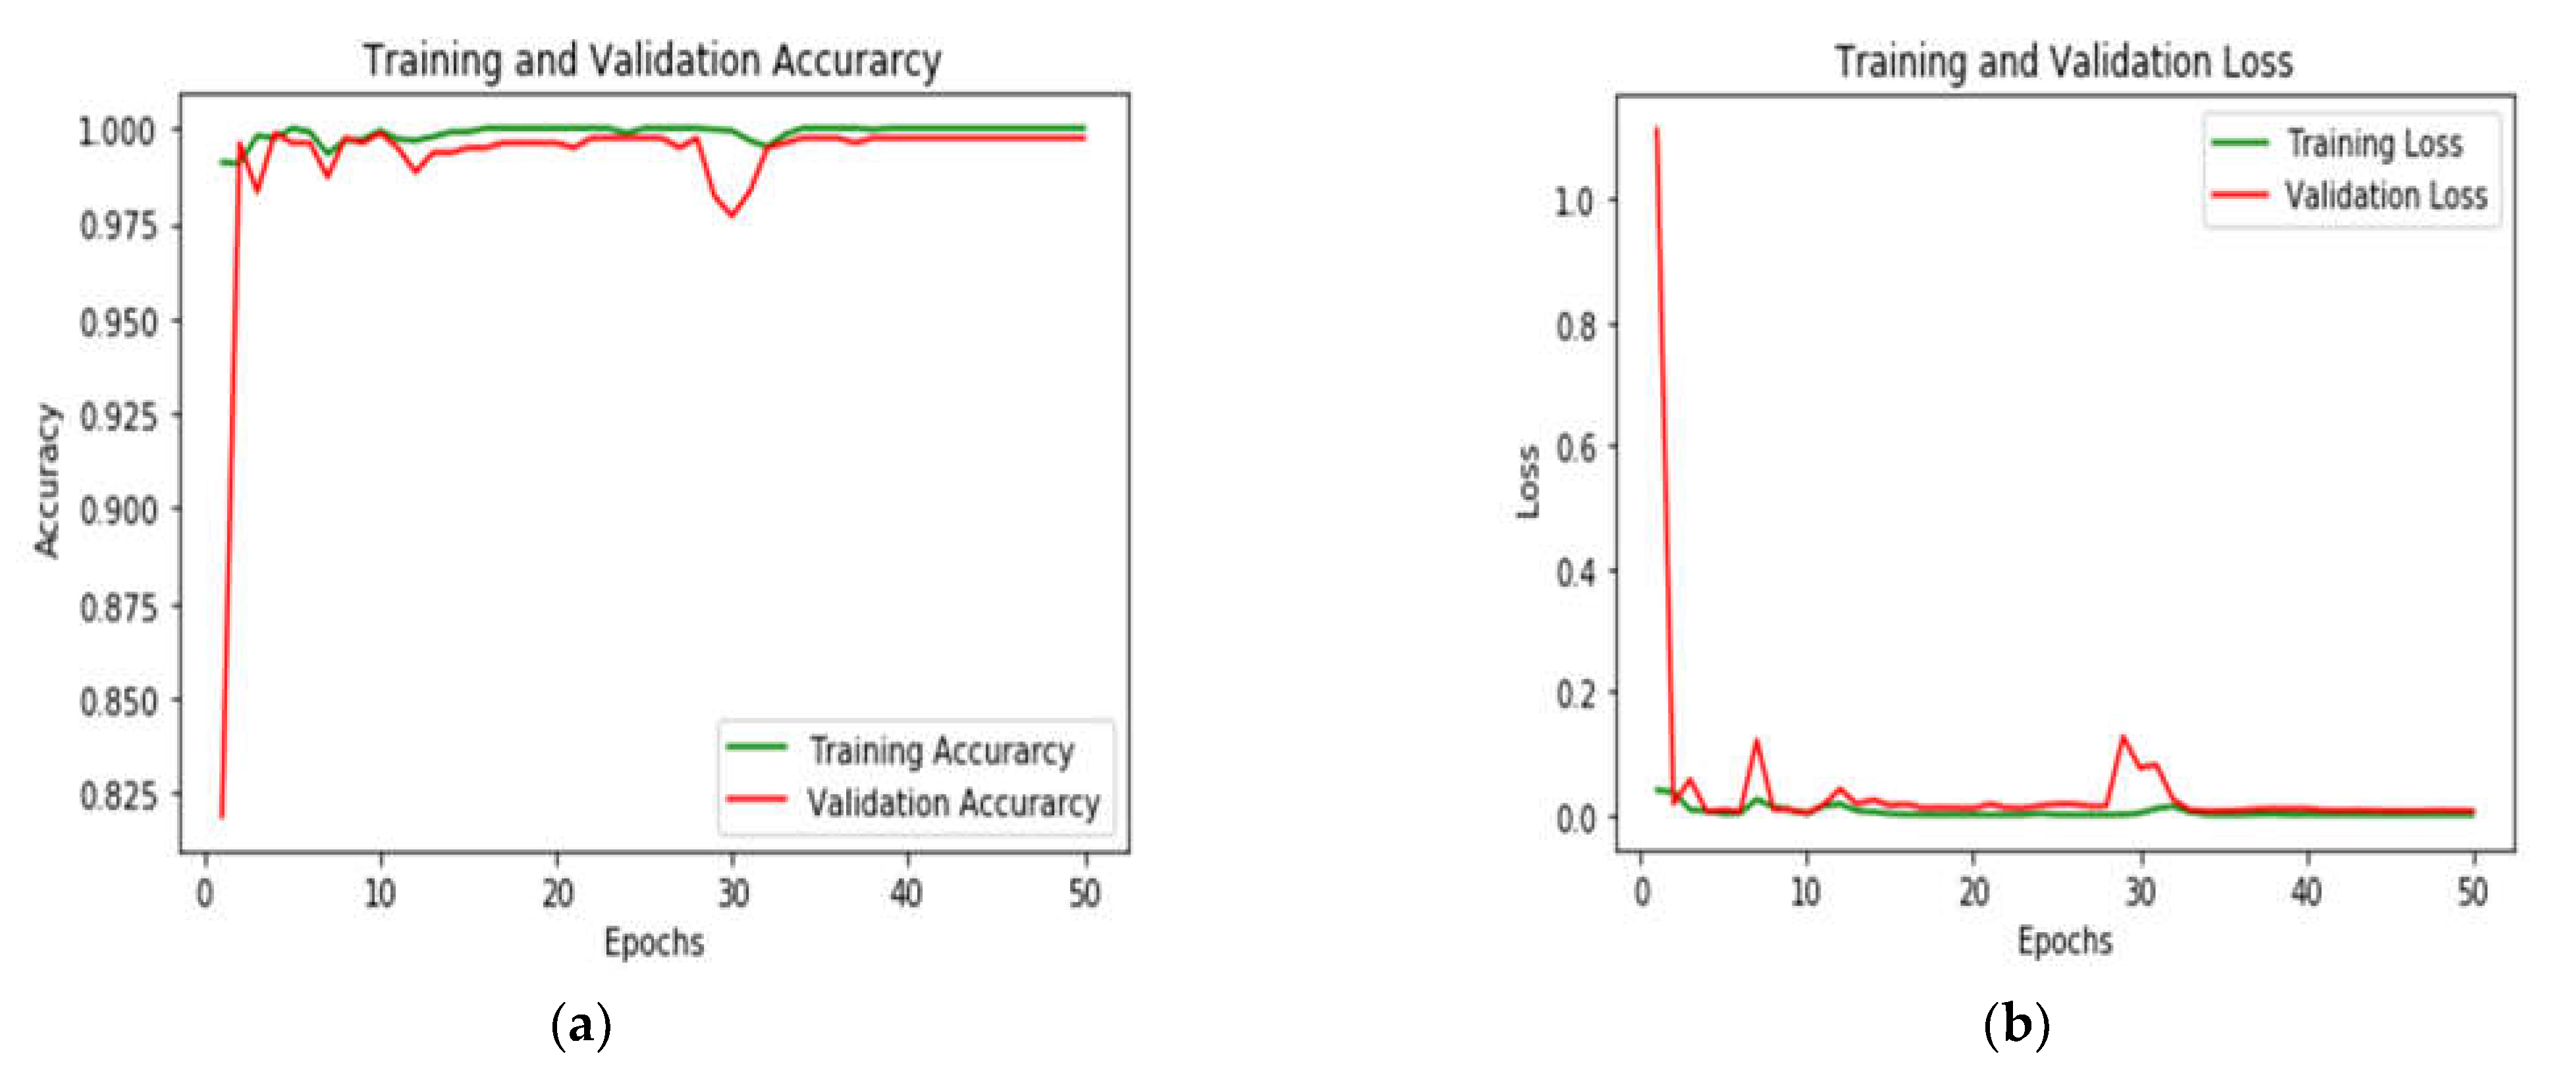
In addition, validation and training accuracy is shown in Figure 5a, it can, therefore, be seen that the accuracy increases from epoch one reaches more than 99% at 50 epochs. Furthermore, validation and training loss can be seen in Figure 5b. In Figure 5a, it can be noticed that the initial validation loss is high and reaches close to zero after thirty-five epochs.

3.4. The Building Crack Detection Using Only the Greyscale Image Input to 3SCNet

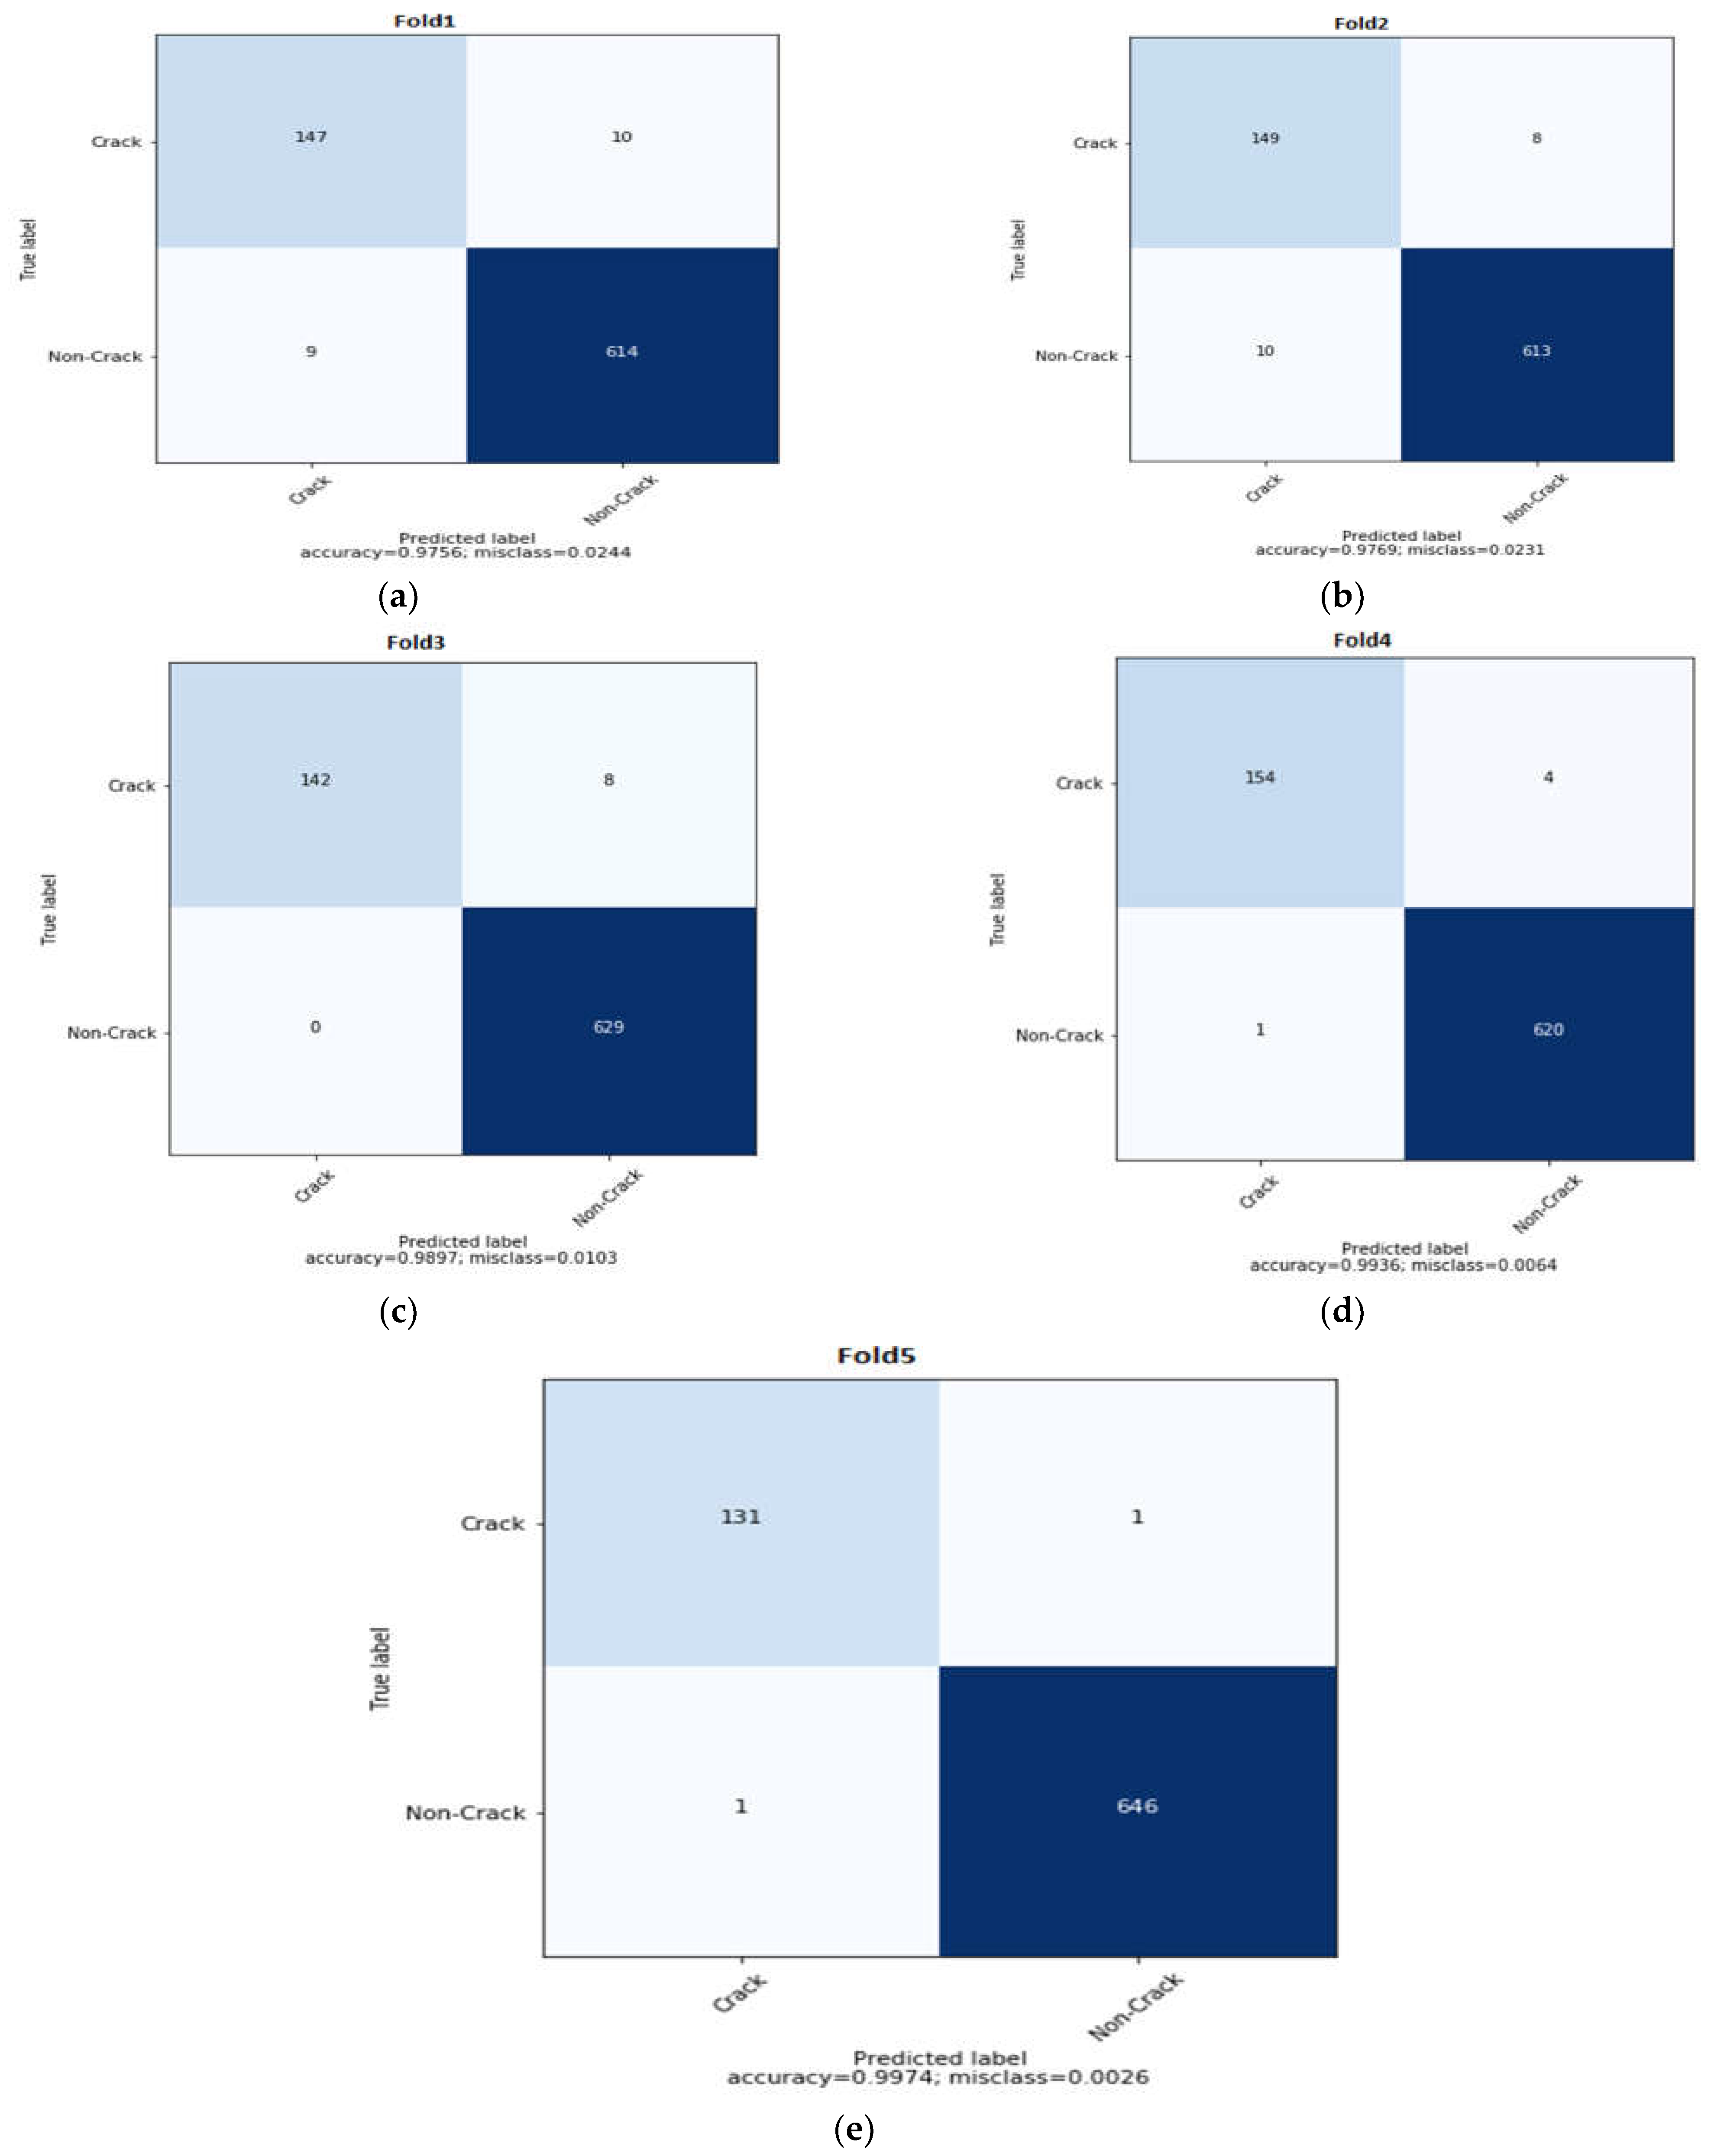
In the proposed study, another experiment is conducted in which the input to the multi-scale 3SCNet model is only a grey image of a size of 256 × 256 × 3. In addition, a model was trained on the same dataset with an initial learning rate of 0.001 for 50 epochs with a batch size of 32. Furthermore, five-fold cross-validation is applied, as discussed in Section 3.3. The confusion matrix of each fold is shown in Figure 6. In Fold 1, we can see ten false positive values and nine false negative values. Similarly, for other folds, false positive and false negative values can be seen in Fold 2, Fold 3, Fold 4, and Fold 5.
Furthermore, from the confusion matrix of each fold shown in Figure 6, performance measures such as Precision, Recall, F1-Score, and MCC are calculated using true indicators, as discussed in Section 3.2. Finally, an average of all these measures are calculated which is treated as the final performance of the model, as shown in Table 4.
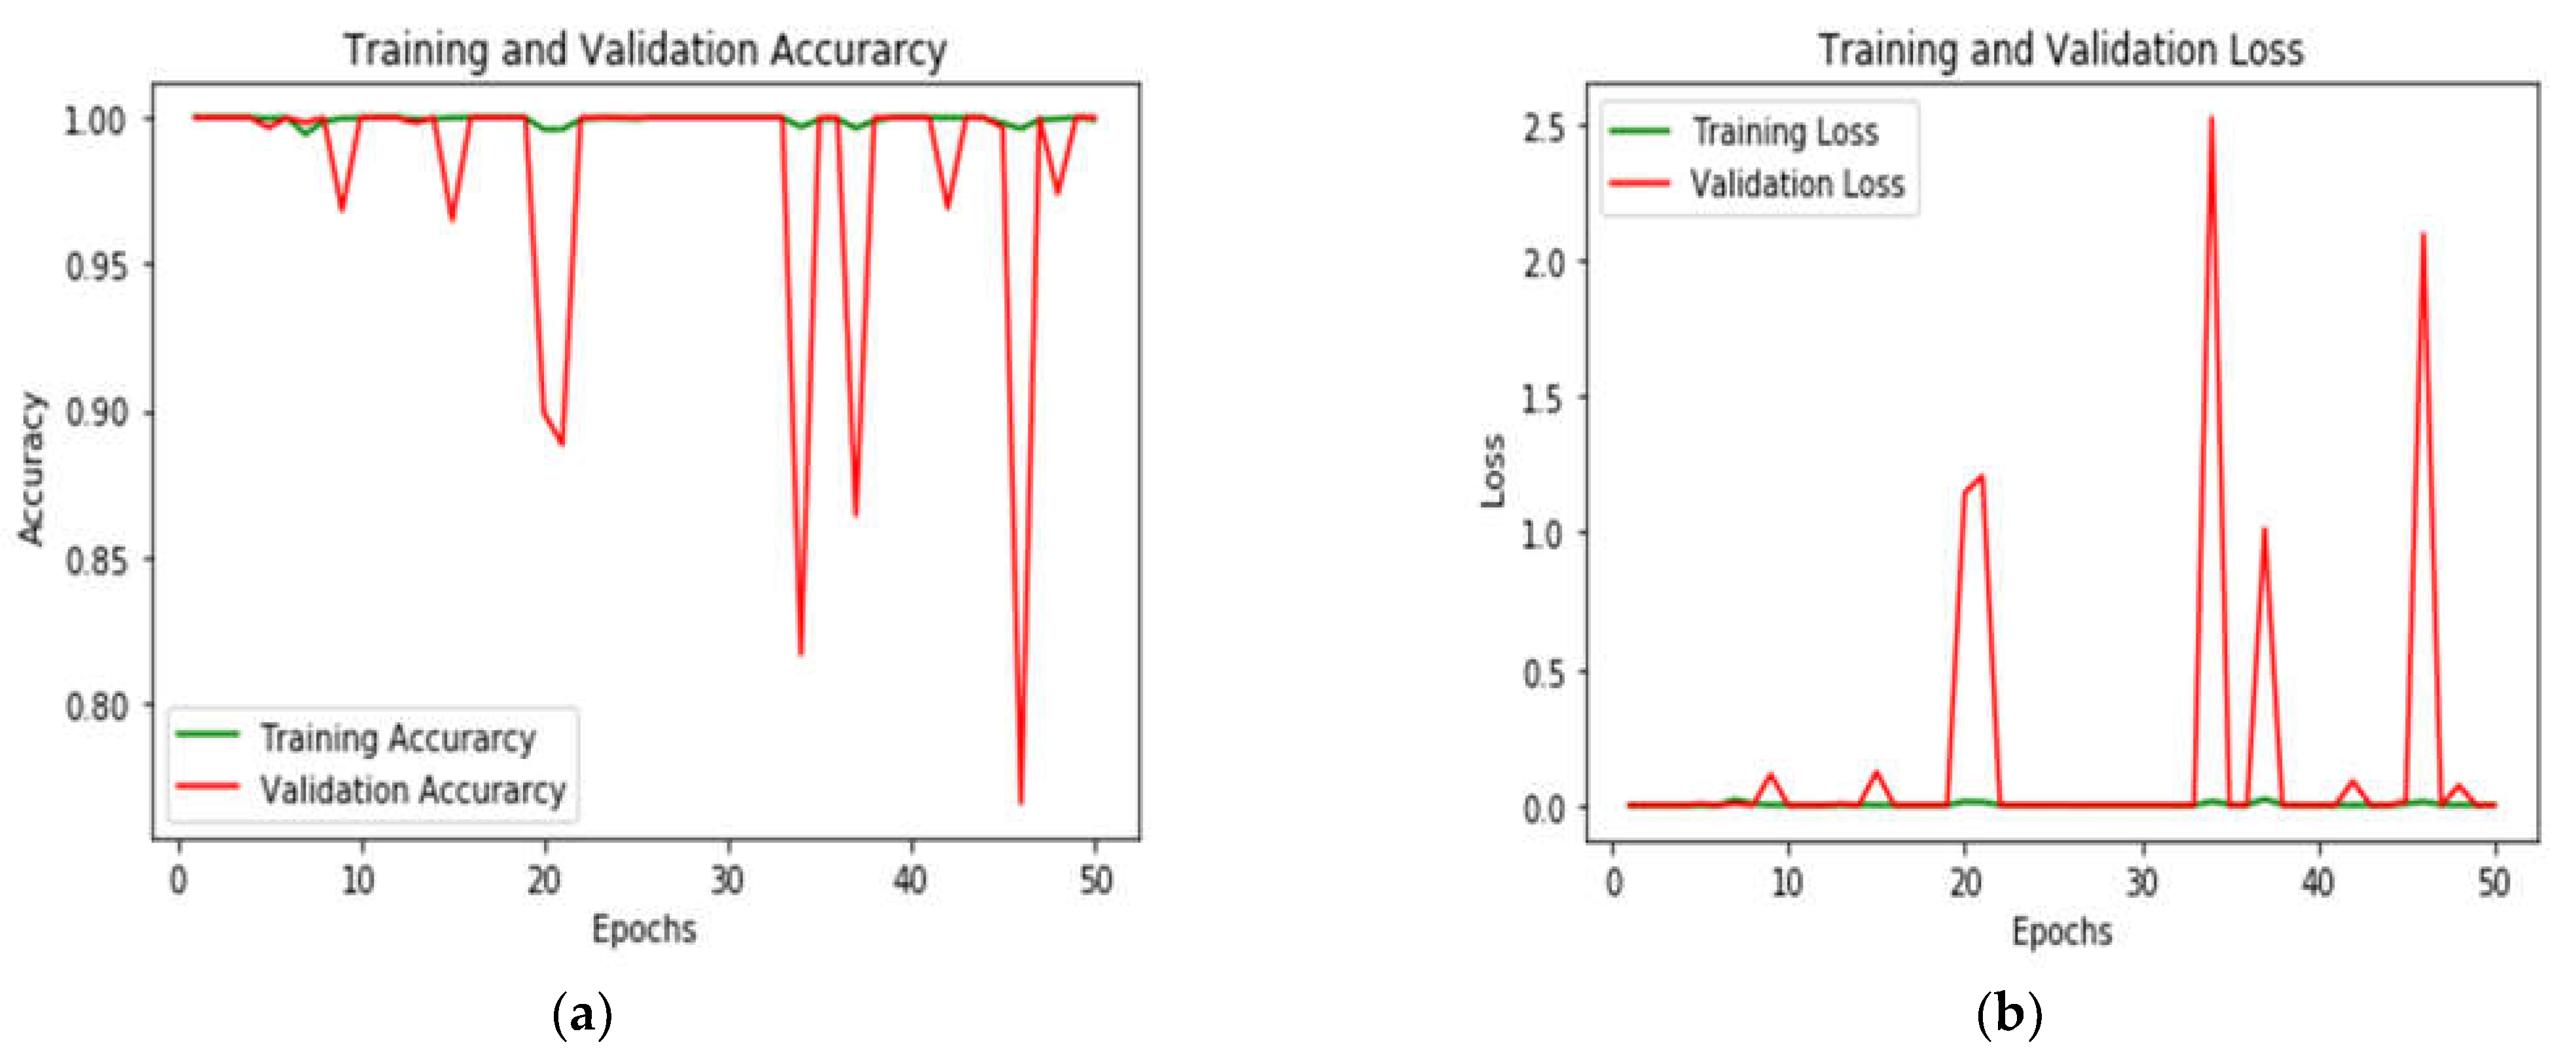
In addition, validation and training accuracy for each epoch is shown in Figure 7a, and training and validation loss is shown in Figure 7b. We can see that training and validation loss is high for several epochs and reaches close to zero at fifty epochs.

4. Discussion

Building crack detection at an early stage is essential to avoid accidental damage to human life. Manual building inspection is time-consuming and difficult for big towers. In recent days, machine learning and deep learning methods are capable to analyze the image to identify cracks. Several methods based on machine learning have been reported which, depend on hand-crafted features due to this performance not being optimal. On the other side, a deep CNN method was used for crack detection extracting features automatically, and it reported a notable classification accuracy. In addition, most of these methods using data augmentation techniques improved the performance and dataset size.
Considering the above challenges, a novel 3SCNet deep CNN model, which learns features from a multi-scale and constructs a pool of feature vector. We have conducted two experiments, as discussed in Section 3.3 and Section 3.4. In Section 3.3, the model is trained with grey images and their corresponding SLIC and LBP images. The SLIC superpixel segmentation classifies the same group of pixels in a cluster that can be used to differentiate the crack and non-crack regions, whereas LBP finds the local pattern of pixels in the crack and non-crack region.
The dataset used in the study contains unequal numbers of images in each class. Therefore, a five-fold cross-validation scheme is used to evaluate the performance. The five-fold cross-validation scheme avoids the biased performance of the model. For each fold, the confusion matrix is plotted, as shown in Figure 4. From each confusion matrix, performance measures are calculated using the method discussed in Table 2. Finally, the average of each fold is evaluated to measure the actual performance of the model, as shown in Table 3.
In Section 3.4, the model is trained using a grey image on the multi-scale using the same parameters discussed in Section 3.3. Again, the performance of the model is evaluated using a five-fold cross-validation scheme, the confusion matrix for each plot is shown in Figure 6, and their corresponding performance measures are shown in Table 4. A detailed comparison of these two methods is shown in Table 5. We can see this in Table 5. The 3SCNet with grey and their corresponding SLIC and LBP image performances are much higher compared to 3SCNet with a grey image only.
The past several types of research based on deep CNN for building cracks is available. Most of this research has used Inception V3, AlexNet, and VGG16. The classification performance of these models is notable. However, there is ample scope to design light weighted and efficient models. The Inception V3, ALexNet, and VGG16 have 25 million, 60 million, and 138 million neurons, respectively. In contrast, the proposed model contains 9 million neurons much smaller than these models. The performance comparison of available methods on the different datasets with the proposed methods is shown in Table 6. In Table 6, we can see the proposed 3SCNet+Grey and 3SCNet+Grey+SLIC+LBP achieved the highest classification accuracy.
The performance of the 3SCNet is also compared with the method on a dataset, as discussed in Section 3.1. The details of the performance measures are shown in Table 7.
In addition, a bar plot has been shown in Figure 8. In Figure 8, we can see that our 3SCNet+Grey method precision is 95.98%, which is less compared to the method discussed in [63]. However, the proposed 3SCNet+Grey+SLIC+LBP Precision, Recall, F1-Score, and Accuracy are much better than Elhariri et al. [63].

5. Conclusions

Crack detection at an early stage is necessary to save people's lifves. Several incidents in the past caused bridge or building collapse. Manual crack detection is time-consuming, especially where buildings are very high. Image processing, machine learning, and deep learning-based methods are available that can be used in such scenarios to build automatic crack detection systems. Several studies using machine learning were reported for building crack detection. The performance of these methods depends on the expertise of the expert since hand-crafted features are used to train the model. On the contrary, the deep learning-based method automatically extracts features to train the model. Nevertheless, designing an efficient model is a difficult task. In Table 1, we have summarized the deep CNN-based method that has been used for crack detection. These methods’ performance are better compared to machine learning-based approaches but they are computationally expensive. To reduce the computation cost and improve classification performance, we have designed a novel 3SCNet. The 3SCNet contains fewer trainable parameters and, due to this, the computation cost is reduced. The SLIC and LBP features are used to train the model that improves performance. To train the model, first, the RGB image is segmented using the SLIC superpixel segmented for a cluster of similar pixels. In addition, the LBP image is constructed to find local texture patterns in the crack images. Our method achieved a sensitivity of 99.47% and a classification accuracy of 99.69%. The developed model classification accuracy is highest compared to state-of-art methods. This confirms our method is robust and accurate. The limitation of the deep CNN model is the high computation cost and the limitation of input data to our algorithm. In the future, we will study other texture and segmentation algorithms with the deep CNN method, which will be used for real-time crack detection and depth estimation of cracks.

Author Contributions

Conceptualization and Data curation, D.P.Y.; Formal analysis: K.K.; Software, A.G.; Methodology and Writing—original draft, A.K. & T.S.; Supervision and Writing—original draft, K.U.S.; Investigation and Project administration and Writing—original draft, C.S. All authors have read and agreed to the published version of the manuscript.

Funding

This research received no external funding.

Institutional Review Board Statement

Not applicable.

Informed Consent Statement

Not applicable.

Data Availability Statement

Not applicable.

Conflicts of Interest

The authors declare no conflict of interest.

References

  1. Jarrett, K.; Kavukcuoglu, K.; Ranzato, M.A.; LeCun, Y. What is the best multi-stage architecture for object recognition? In Proceedings of the IEEE 12th International Conference on Computer Vision (ICCV), Kyoto, Japan, 29 September–2 October 2009; pp. 2146–2153. [Google Scholar]
  2. Noh, Y.; Koo, D.; Kang, Y.M.; Park, D.G.; Lee, D.H. Automatic crack detection on concrete images using segmentation via fuzzy C-means clustering. In Proceedings of the 2017 IEEE International Conference on Applied System Innovation: Applied System Innovation for Modern Technology, ICASI 2017, Sapporo, Japan, 13–17 May 2017; pp. 877–880. [Google Scholar]
  3. Koch, C.; Georgieva, K.; Kasireddy, V.; Akinci, B.; Fieguth, P. A review on computer vision based defect detection and condition assessment of concrete and asphalt civil infrastructure. Adv. Eng. Informatics 2015, 29, 196–210. [Google Scholar] [CrossRef] [Green Version]
  4. Kishore, K.; Gupta, N. Application of domestic & industrial waste materials in concrete: A review. Mater. Today Proc. 2020, 26, 2926–2931. [Google Scholar]
  5. Tomar, R.; Kishore, K.; Parihar, H.S.; Gupta, N. A comprehensive study of waste coconut shell aggregate as raw material in concrete. Mater. Today Proc. 2020, 44, 437–443. [Google Scholar] [CrossRef]
  6. Nishikawa, T.; Yoshida, J.; Sugiyama, T.; Fujino, Y. Concrete Crack Detection by Multiple Sequential Image Filtering. Comput. Civ. Infrastruct. Eng. 2011, 27, 29–47. [Google Scholar] [CrossRef]
  7. Zaurin, R.; Catbas, F.N. Integration of computer imaging and sensor data for structural health monitoring of bridges. Smart Mater. Struct. 2009, 19, 015019. [Google Scholar] [CrossRef]
  8. Huang, X.; Yang, M.; Feng, L.; Gu, H.; Su, H.; Cui, X.; Cao, W. Crack detection study for hydraulic concrete using PPP-BOTDA. Smart Struct. Syst. 2017, 20, 75–83. [Google Scholar]
  9. Kim, H.; Ahn, E.; Cho, S.; Shin, M.; Sim, S.H. Comparative analysis of image binarization methods for crack identification in concrete structures. Cem. Concr. Res. 2017, 99, 53–61. [Google Scholar] [CrossRef]
  10. Song, J.; Kim, S.; Liu, Z.; Quang, N.N.; Bien, F. A Real Time Nondestructive Crack Detection System for the Automotive Stamping Process. IEEE Trans. Instrum. Meas. 2016, 65, 2434–2441. [Google Scholar] [CrossRef]
  11. Le Bas, P.Y.; Anderson, B.E.; Remillieux, M.; Pieczonka, L.; Ulrich, T.J. Elasticity Nonlinear Diagnostic Method for Crack Detection and Depth Estimation. J. Acoust. Soc. Am. 2015, 138, 1836. [Google Scholar] [CrossRef]
  12. Budiansky, B.; O’Connell, R.J. Elastic Moduli of a Cracked Solid. Int. J. Solids Struct. 1976, 12, 81–97. [Google Scholar] [CrossRef]
  13. Aboudi, J. Stiffness reduction of cracked solids. Eng. Fract. Mech. 1987, 26, 637–650. [Google Scholar] [CrossRef]
  14. Dhital, D.; Lee, J.R. A Fully Non-Contact Ultrasonic Propagation Imaging System for Closed Surface Crack Evaluation. Exp. Mech. 2012, 52, 1111–1122. [Google Scholar] [CrossRef]
  15. Oliveira, H.; Correia, P.L. Automatic road crack detection and characterization. IEEE Trans. Intell. Transp. Syst. 2013, 14, 155–168. [Google Scholar] [CrossRef]
  16. Gupta, N.; Kishore, K.; Saxena, K.K.; Joshi, T.C. Influence of industrial by-products on the behavior of geopolymer concrete for sustainable development. Indian J. Eng. Mater. Sci. 2021, 28, 433–445. [Google Scholar]
  17. Kishore, K.; Gupta, N. Experimental Analysis on Comparison of Compressive Strength Prepared with Steel Tin Cans and Steel Fibre. Int. J. Res. Appl. Sci. Eng. Technol. 2019, 7, 169–172. [Google Scholar] [CrossRef]
  18. Shukla, A.; Kishore, K.; Gupta, N. Mechanical properties of cement mortar with Lime & Rice hush ash. IOP Conf. Ser. Mater. Sci. Eng. 2021, 1116, 012025. [Google Scholar]
  19. Chalioris, C.E.; Kytinou, V.K.; Voutetaki, M.E.; Karayannis, C.G. Flexural damage diagnosis in reinforced concrete beams using a wireless admittance monitoring system—Tests and finite element analysis. Sensors 2021, 21, 1. [Google Scholar] [CrossRef]
  20. Chalioris, C.E.; Voutetaki, M.E.; Liolios, A.A. Structural health monitoring of seismically vulnerable RC frames under lateral cyclic loading. Earthq. Struct. 2020, 19, 29–44. [Google Scholar]
  21. Jahanshahi, M.R.; Jazizadeh, F.; Masri, S.F.; Becerik-Gerber, B. Unsupervised Approach for Autonomous Pavement-Defect Detection and Quantification Using an Inexpensive Depth Sensor. J. Comput. Civ. Eng. 2013, 27, 743–754. [Google Scholar] [CrossRef]
  22. Fujita, Y.; Hamamoto, Y. A robust automatic crack detection method from noisy concrete surfaces. Mach. Vis. Appl. 2011, 22, 245–254. [Google Scholar] [CrossRef]
  23. Zhang, Y. The design of glass crack detection system based on image preprocessing technology. In Proceedings of the 2014 IEEE 7th Joint International Information Technology and Artificial Intelligence Conference, ITAIC 2014, Chongqing, China, 20–21 December 2014; Volume 2014, pp. 39–42. [Google Scholar]
  24. Broberg, Surface crack detection in welds using thermography. NDT&E Int. 2013, 57, 69–73.
  25. Wang, P.; Huang, H. Comparison analysis on present image-based crack detection methods in concrete structures. In Proceedings of the 2010 3rd International Congress on Image and Signal Processing, CISP 2010, Yantai, China, 16–18 October 2010; Volume 5, pp. 2530–2533. [Google Scholar]
  26. Cheng, H.D.; Shi, X.J.; Glazier, C. Real-Time Image Thresholding Based on Sample Space Reduction and Interpolation Approach. J. Comput. Civ. Eng. 2003, 17, 264–272. [Google Scholar] [CrossRef]
  27. Li, S.; Zhao, X. Image-Based Concrete Crack Detection Using Convolutional Neural Network and Exhaustive Search Technique. Adv. Civ. Eng. 2019, 2019, 1–12. [Google Scholar] [CrossRef] [Green Version]
  28. Yeum, C.M.; Dyke, S.J. Vision-Based Automated Crack Detection for Bridge Inspection. Comput. Civ. Infrastruct. Eng. 2015, 30, 759–770. [Google Scholar] [CrossRef]
  29. Zhang, W.; Zhang, Z.; Qi, D.; Liu, Y. Automatic crack detection and classification method for subway tunnel safety monitoring. Sensors 2014, 14, 19307–19328. [Google Scholar] [CrossRef] [PubMed]
  30. Rathor, S.; Agrawal, S. A robust model for domain recognition of acoustic communication using Bidirectional LSTM and deep neural network. Neural Comput. Appl. 2021, 33, 11223–11232. [Google Scholar] [CrossRef]
  31. Sharma, H.; Jalal, A.S. Visual question answering model based on graph neural network and contextual attention. Image Vis. Comput. 2021, 110, 104165. [Google Scholar] [CrossRef]
  32. Singh, L.K.; Garg, H.; Khanna, M. Performance evaluation of various deep learning based models for effective glaucoma evaluation using optical coherence tomography images. Multimedia Tools Appl. 2022, 81, 27737–27781. [Google Scholar] [CrossRef]
  33. Pant, G.; Yadav, D.P.; Gaur, A. ResNeXt convolution neural network topology-based deep learning model for identi fi cation and classi fi cation of Pediastrum. Algal Res. 2020, 48, 101932. [Google Scholar] [CrossRef]
  34. Yadav, D.P.; Rathor, S. Bone Fracture Detection and Classification using Deep Learning Approach. In Proceedings of the 2020 International Conference on Power Electronics & IoT Applications in Renewable Energy and Its Control (PARC), Uttar Pradesh, India, 28–29 February 2020; Volume 2020, pp. 282–285. [Google Scholar]
  35. Saar, T.; Talvik, O. Automatic asphalt pavement crack detection and classification using neural networks. In Proceedings of the BEC 2010–2010 12th Biennial Baltic Electronics Conference, Tallinn, Estonia, 4–6 October 2010; pp. 345–348. [Google Scholar]
  36. German, S.; Brilakis, I.; Desroches, R. Rapid entropy-based detection and properties measurement of concrete spalling with machine vision for post-earthquake safety assessments. Adv. Eng. Informatics 2012, 26, 846–858. [Google Scholar] [CrossRef]
  37. Prasanna, P.; Dana, K.J.; Gucunski, N.; Basily, B.B.; La, H.M.; Lim, R.S.; Parvardeh, H. Automated Crack Detection on Concrete Bridges. IEEE Trans. Autom. Sci. Eng. 2016, 13, 591–599. [Google Scholar] [CrossRef]
  38. Song, K.; Yan, Y. A noise robust method based on completed local binary patterns for hot-rolled steel strip surface defects. Appl. Surf. Sci. 2013, 285, 858–864. [Google Scholar] [CrossRef]
  39. Chen, F.C.; Jahanshahi, M.R. NB-CNN: Deep Learning-Based Crack Detection Using Convolutional Neural Network and Naïve Bayes Data Fusion. IEEE Trans. Ind. Electron. 2018, 65, 4392–4400. [Google Scholar] [CrossRef]
  40. Zhang, L.; Yang, F.; Zhang, Y.D.; Zhu, Y.J. Road Crack Detection Using Deep Convolutional Neural Network. In Proceedings of the 2016 IEEE International Conference on Image Processing (ICIP), Phoenix, AZ, USA, 25–28 September 2016; pp. 3708–3712. [Google Scholar]
  41. Makantasis, K.; Protopapadakis, E.; Doulamis, A.; Doulamis, N.; Loupos, C. Deep Convolutional Neural Networks for efficient vision based tunnel inspection. In Proceedings of the 2015 IEEE 11th International Conference on Intelligent Computer Communication and Processing, ICCP, Cluj-Napoca, Romania, 3–5 September 2015; pp. 335–342. [Google Scholar]
  42. Cha, Y.J.; Choi, W.; Büyüköztürk, O. Deep Learning-Based Crack Damage Detection Using Convolutional Neural Networks. Comput. Civ. Infrastruct. Eng. 2017, 00, 1–18. [Google Scholar] [CrossRef]
  43. Simonyan, K.; Zisserman, A. Very deep convolutional networks for large-scale image recognition. In Proceedings of the 3rd International Conference on Learning Representations, ICLR 2015-Conference Track Proceedings, San Diego, CA, USA, 7–9 May 2015; pp. 1–14. [Google Scholar]
  44. Badrinarayanan, V.; Handa, A.; Cipolla, R. SegNet: A Deep Convolutional Encoder-Decoder Architecture for Robust Semantic Pixel-Wise Labelling. arXiv 2015, arXiv:1505.07293. [Google Scholar]
  45. Ronneberger, O.; Fischer, P.; Brox, T. U-Net: Convolutional Networks for Biomedical Image Segmentation. In International Conference on Medical Image Computing and Computer-Assisted Intervention; Springer: Berlin/Heidelberg, Germany, 2015; Volume 9351, pp. 234–241. [Google Scholar]
  46. Bang, S.; Park, S.; Kim, H.; Kim, H. Encoder–decoder network for pixel-level road crack detection in black-box images. Comput. Civ. Infrastruct. Eng. 2019, 34, 713–727. [Google Scholar] [CrossRef]
  47. Achanta, R.; Shaji, A.; Smith, K.; Lucchi, A.; Fua, P.; Susstrunk, S. SLIC superpixels compared to state-of-the-art superpixel methods. IEEE Trans. Pattern Anal. Mach. Intell. 2012, 34, 2274–2281. [Google Scholar] [CrossRef]
  48. Ojala, T.; Pietikäinen, M.; Harwood, D. A comparative study of texture measures with classification based on feature distributions. Pattern Recognit. 1996, 29, 51–59. [Google Scholar] [CrossRef]
  49. He, K.; Zhang, X.; Ren, S.; Sun, J. Deep Residual Learning for Image Recognition. In Proceedings of the IEEE Conference on Computer Vision and Pattern Recognition, Las Vegas, NV, USA, 27–30 June 2016; pp. 770–778. [Google Scholar]
  50. Elhariri, E.; El-Bendary, N.; Taie, S. Historical_Building_Crack_2019. Mendeley Data, V1. 2020. Available online: https://data.mendeley.com/datasets/xfk99kpmj9/1 (accessed on 5 March 2022).
  51. Design, L.; Zhu, J.; Zhang, C.; Qi, H.; Lu, Z. Vision-based defects detection for bridges using transfer learning and convolutional neural networks. Struct. Infrastruct. Eng. 2019, 16, 1–13. [Google Scholar]
  52. Hung, P.D.; Su, N.T.; Diep, V.T. Surface Classification of Damaged Concrete Using Deep Convolutional Neural Network. Pattern Recognit. Image Anal. 2019, 29, 676–687. [Google Scholar] [CrossRef]
  53. Feng, C.; Zhang, H.; Wang, S.; Li, Y.; Wang, H.; Yan, F. Structural Damage Detection using Deep Convolutional Neural Network and Transfer Learning. KSCE J. Civ. Eng. 2019, 23, 4493–4502. [Google Scholar] [CrossRef]
  54. Hüthwohl, P.; Lu, R.; Brilakis, I. Multi-classifier for reinforced concrete bridge defects. Autom. Constr. 2019, 105, 102824. [Google Scholar] [CrossRef]
  55. Bukhsh, Z.A.; Jansen, N.; Saeed, A. Damage detection using in-domain and cross-domain transfer learning. Neural Comput. Appl. 2021, 33, 16921–16936. [Google Scholar] [CrossRef]
  56. Soni, A.N. Crack Detection in buildings using convolutional neural Network. J. Innov. Dev. Pharm. Tech. Res. 2019, 2, 54–59. [Google Scholar]
  57. Dung, C.V.; Anh, L.D. Autonomous concrete crack detection using deep fully convolutional neural network. Autom. Constr. 2019, 99, 52–58. [Google Scholar] [CrossRef]
  58. Słoński, M. A comparison of deep convolutional neural networks for image-based detection of concrete surface cracks. Comput. Assist. Methods Eng. Sci. 2019, 26, 105–112. [Google Scholar]
  59. Wang, Z.; Xu, G.; Ding, Y.; Wu, B.; Lu, G. A vision-based active learning convolutional neural network model for concrete surface crack detection. Adv. Struct. Eng. 2020, 23, 2952–2964. [Google Scholar] [CrossRef]
  60. Miao, P.; Srimahachota, T. Cost-effective system for detection and quantification of concrete surface cracks by combination of convolutional neural network and image processing techniques. Constr. Build. Mater. 2021, 293, 123549. [Google Scholar] [CrossRef]
  61. Kung, R.; Pan, N.; Wang, C.C.N.; Lee, P.C. Application of Deep Learning and Unmanned Aerial Vehicle on Building Maintenance. Adv. Civ. Eng. 2021, 2021, 1–12. [Google Scholar] [CrossRef]
  62. Loverdos, D.; Sarhosis, V. Automatic image-based brick segmentation and crack detection of masonry walls using machine learning. Autom. Constr. 2022, 140, 104389. [Google Scholar] [CrossRef]
  63. Elhariri, E.; El-Bendary, N.; Taie, S.A. Using hybrid filter-wrapper feature selection with multi-objective improved-salp optimization for crack severity recognition. IEEE Access 2020, 8, 84290–84315. [Google Scholar] [CrossRef]
Figure 1. The architecture of 3SCNet for building crack detection.
Sustainability 14 16179 g001
Figure 2. The SLIC image for k = 80, 100, and 120 is shown in 2(a), 2(b) and 2(c) respectively.
Sustainability 14 16179 g002
Figure 3. LBP Image Calculation.
Sustainability 14 16179 g003
Figure 4. The confusion matrix for each fold of crack detection: (a) CM for Fold 1, (b) CM for Fold 2, (c) CM for Fold 3, (d) CM for Fold 4, and (e) CM for Fold 5.
Sustainability 14 16179 g004
Figure 5. Illustration of the training and validation accuracy as well as loss of the proposed 3SCNet. (a) validation and training accuracy; (b) validation and training loss.
Sustainability 14 16179 g005
Figure 6. The confusion matrix for each fold of the class classification task: (a) CM for Fold 1, (b) CM for Fold 2, (c) CM for Fold 3, (d) CM for Fold 4, and (e) CM for Fold 5.
Sustainability 14 16179 g006
Figure 7. Illustration of the training and validation accuracy, as well as loss of the proposed 3SCNet. (a) validation and training accuracy; (b) training and validation loss.
Sustainability 14 16179 g007
Figure 8. Bar plot based on the comparison of the proposed method with the method Elhariri (2020) [63].
Sustainability 14 16179 g008
Table 1. Summary of different state-of-the-art models used by the previous studies.
ModelParametersLimitations
VGG1633 × 106High training time due to large numbers of trainable parameters.
AlexNet24 × 106This model cannot scan all features and the computation cost is high.
ResNet5023 × 106This model is challenging to apply in real-time application and it is 50 layers deep.
DenseNet-1617.2 × 106This model is small in size but
performance is less compared to other state-of-the art models.
Table 2. Performance evaluation indicators and mathematical formulas.
MeasuresFormulaInterpretation
Accuracy A c c = T P + T N T P + T N + F P + F N T N = It is an actual non-crack sample value and the model also classifies non-crack.
Precision Pr e = T P T P + F P
Recall Re = T P T P + F N T P = It is an actual crack sample value and the model also classifies crack.
F1-Score F 1 S c o r e = 2 Pr e R e Pr e + R e
MCC M C C = ( T P T N F P F N ) ( T P + F P ) ( T P + F N ) ( T N + F P ) ( T N + F N ) F P = It is an actual non-crack sample value and the model classifies as a crack.
F N = It is an actual crack sample and the model classifies as non-crack.
Table 3. The classification performance metrics of the 3SCNet model using the SLIC, grey, and LBP images.
FoldsPerformance Metrics (%)
SensitivitySpecificityPrecisionF1-ScoreAccuracyMCC
Fold 198.1199.6898.7398.4299.3698.02
Fold 299.2399.5497.7398.4799.4998.17
Fold 310099.6898.6799.3399.7499.17
Fold 410099.8499.3899.6999.8799.61
Fold 5100100100100100100
Average99.4799.7598.9099.1899.6998.99
Table 4. Classification performance metrics of the 3SCNet model using a grey image.
FoldsPerformance Metrics (%)
SensitivitySpecificityPrecisionF1-ScoreAccuracyMCC
Fold 194.2398.4093.6393.9397.5692.41
Fold 293.7198.7194.9094.3097.6992.86
Fold 310098.7494.6797.2698.9796.68
Fold 499.3599.3697.4798.4099.3698.01
Fold 599.2499.8599.2499.2499.7499.09
Average97.3099.0195.9896.2698.6695.81
Table 5. Classification performance comparison of two approaches.
Method Performance Metrics (%)
SensitivitySpecificityPrecisionF1-ScoreAccuracyMCC
3SCNet+Grey97.3099.0195.9896.2698.6695.81
3SCNet+
Grey+SLIC+LBP
99.4799.7598.9099.1899.6998.99
Table 6. Performance comparison with state-of-art methods on different datasets.
StudyModelDatasetAccuracy (%)
Design et al. [51]Pretrained Inception V3435 images97.8
Hung et al. [52]DCNN636 images92.29
Feng et al. [53]Pretrained Inception V3435 images96.8
Hüthwohl et al. [54]Inception V32545 images96.8
Bukhsh et al. [55]InceptionV3, VGG16, ResNet501028 images86.9
Soni et al. [56]VGG1640,000 images90
Dung et al. [57]DCNN40,000 images90
Słoński et al. [58]VGG1656,400 images94
Wang et al. [59]Pretrained AlexNet1350 images95.56
Miao et al. [60]GoogLeNet23 images96.69
Kung et al. [61]VGG163500 images92.27
Loverdos et al. [62]CNN2814 images96.86
Proposed 3SCNet+Grey3SCNet3896 images98.66
Proposed3SCNet+Grey+SLIC+LBP3SCNet3896 images99.69
Table 7. Performance comparison of the proposed method on the dataset used in the study.
StudyPrecision (%)Recall (%)F1-Score (%)Accuracy (%)
Elhariri et al. [63]99.0793.5296.2296.84
Proposed 3SCNet+Grey95.9897.3096.2698.66
Proposed 3SCNet+Grey+SLIC+LBP98.9099.7599.1899.69
Publisher’s Note: MDPI stays neutral with regard to jurisdictional claims in published maps and institutional affiliations.