Article

Speed Behavior of Heterogeneous Traffic on Two-Lane Rural Roads in Malaysia

by
Rizwan Ullah Faiz
*,
Nordiana Mashros
and
Sitti Asmah Hassan
Faculty of Civil Engineering, Universiti Teknologi Malaysia Skudai, Johor Bahru 81310, Malaysia
*
Author to whom correspondence should be addressed.
Sustainability 2022, 14(23), 16144; https://doi.org/10.3390/su142316144
Submission received: 29 September 2022 / Revised: 13 November 2022 / Accepted: 30 November 2022 / Published: 2 December 2022
(This article belongs to the Special Issue Sustainable Transportation and Road Safety)

Abstract

:
Highway geometry is a significant factor that affects the efficiency and safety of highway systems. The present study aims to investigate the speed behavior of various vehicle classes on the horizontal alignment of two-lane rural roads. An automatic data collection system based on a pressure sensor was employed to collect the speed of each individual vehicle, vehicle type, and headway at seven sites in each travel direction. The 85th percentile speed under free-flow conditions was used to observe the relationship between the operating speeds of various vehicle classes at consecutive curve points and the effect of the travel direction, time of day, and curve radius on the operating speed of the vehicle. A one-way ANOVA was employed to evaluate whether there is a significant difference in speed on horizontal curves. Then, a Tukey post hoc test was used to assess the significance of the difference in speed across four classes of vehicles. The results revealed that the horizontal curve affects the operating speed for all vehicle classes. A curve radius of less than 500 m, the travel direction, and the time of day are significant variables that affect the speed of all vehicle classes. The findings from this study can provide insight to transportation engineers for safer road design of horizontal curves and to assess traffic safety based on actual speed behavior.

1. Introduction

With rapid urbanization and the increased number of motor vehicles, road traffic crashes have risen considerably in the last few decades. Although each of these deaths and injuries is preventable, road traffic crashes still account for 1.3 million fatalities worldwide each year and remain a significant cause of death globally [1]. A road traffic crash is caused by factors connected to the components of the traffic system, which can include factors associated with road users, the environment, and vehicles [2]. Road users are an essential aspect of the traffic system and are responsible for around 90% of all crashes [3]. Human capabilities, constraints, physical conditions, and psychological states are among the contributing elements that substantially impact the likelihood and severity of crashes [4,5].
From a broad perspective, the road user factors, or components of the road user–environment relationship, are complex [6,7]. Several factors influence drivers’ perception of the road network, such as the highway geometry, environmental conditions, traffic control devices, and surrounding traffic. Roadway characteristics that differ from drivers’ expectations of the road network result in driving errors. Driving errors cause aberrant maneuvers in rural environments, which have fatal consequences [8]. Rural roads are more dangerous and lead to fatal accidents than urban roads [9] because vehicles on rural roads are less likely to encounter other vehicles and, therefore, maintain high speeds, as permitted by the road geometry [10].
On rural two-lane roads, horizontal alignment accounts for approximately half of all traffic crashes [11]. The crashes are influenced by the speed of vehicles, because on rural roads, drivers are likely to violate the speed limit on geometric conditions. Sharp horizontal alignment on two-lane rural roads after a long tangent section contradicts drivers’ expectations, leading to erroneous maneuvers. Sharp curves impose significant speed reductions, leading to disruption of the traffic flow and increasing the likelihood of road traffic crashes [12]. The fatality rate for road crashes on horizontal curves, particularly those with narrow lanes, is three times higher than those for other road segments [13,14]. About three-quarters of curve-related fatal crashes involve single vehicles leaving the roadway and striking trees, utility poles, rocks, or other fixed objects—or overturning [14]. Geometric design consistency appears to be a major factor affecting accident rates on rural highways. Inconsistent geometric features on horizontal curves, such as the radius, lane width, and shoulder width, impose abrupt changes in speed, which adversely affect road safety [15].
Geometry inconsistencies on two-lane rural roads have been examined through numerous measures, including speed characteristics, vehicle stability, alignment indices, and driver workload [16]. However, operational speed is one of the most frequently used and generally quantifiable methods due to its simplicity and lucidity [17]. It is also the most commonly used surrogate measure to evaluate safety on horizontal curves [18]. Operating speed is defined as the 85th percentile of the speed distribution observed by drivers on a particular road segment in free-flow conditions [19]. Vehicles entering the horizontal alignment from a tangent section exhibit significant variation in operating speed [17]. Speed differentials are commonly used to describe speed variations among tangents and curve sections. In addition, speed differentials are further exacerbated by heterogeneous traffic conditions, as each vehicle type has distinct operating characteristics.
Numerous studies have been conducted on rural two-lane highways to predict operating speeds and to evaluate design consistency. Operating speed models vary greatly depending on the country, or even region, in large countries [20]. The causes are related to varying driver attitudes, lifestyles, levels of motor law enforcement, etc. [21]. Although several models have been developed to evaluate the design consistency of roadways, most are based on the operating speed of passenger cars, and few have included heavy vehicles [22,23]. Additionally, studies on specific vehicle classes, such as light, medium, and heavy vehicles, are limited. All prevalent vehicle classes, including motorcycles, should be considered in speed studies.
Speed behavior has always been associated with road traffic crashes in Malaysia. Operating speed has been utilized by several authors as a measure of speed behavior on two-lane rural roads [24,25]. However, these studies often ignored the relationship between the operating speeds of various vehicle classes at consecutive curve points and the effect of the travel direction, time of day, and curve radius on the operating speed of the vehicle. To provide basic insight, the present work investigated the speed behavior of various vehicle classes on the horizontal alignment of two-lane rural roads. The effects of many other factors related to curve geometry were neglected because of the considerable limitations associated with the collected data due to the lack of official authority information regarding road geometry design. As driving behavior differs by country and region [24], these findings may help researchers develop a more accurate localized speed model, which may lead to safer road design and increased traffic safety.

2. Related Studies

Consideration of human factors in highway design is vital for diminishing crash frequency and severity [25]. The inputs of the driving task, road geometry, traffic conditions, and roadside environment determine the workload demand for the driver [26]. Inconsistency in road geometric elements, such as the curve radius and length, leads to human errors and excessive speed variation, resulting in aberrant maneuvers and road safety consequences [27]. Speed variations are evident while vehicles traverse from the tangent to the curve section [28]. Vehicles traveling at higher speeds are more likely to depart from the travel lane when traversing the horizontal alignment and cause crashes [29]. Thus, the horizontal alignment and tangent-to-curve sections are prone to geometric inconsistencies.
Studies have been conducted to determine speed variation, commonly referred to as speed differentials among the traffic stream, due to geometric elements on two-lane rural roads [30]. To avoid unusual speed behaviors, researchers estimated the speed differential using the 85th percentile operating speed on two-lane rural roads [31]. In a case study, McFadden and Elefteriadou [32] attempted to determine the 85th percentile speed differential between the maximum speed observed by individual vehicles in the last 200 m of the tangent section and the minimum speed in the curve section. The study results suggested that these speed differentials are incorporated into developing the operating speed reduction model. According to Sil et al. [33], a horizontal curve radius that is less than 360 m significantly affects vehicles’ speed. Apart from the radius of the horizontal curve, the curve length, the deflection angle of the horizontal curve, and the length of the approach tangent also influence a vehicle’s operating speed [10,17]. A geometric design is considered poor if the design and operating speed differential are greater than 20 km/h [34].
Anderson and Krammes [35] analyzed the association between speed reduction and crash rates using data from the 85th percentile speed distribution. The results indicate that the probability of a crash increases with speed reduction among the tangent and curve sections. Montella et al. [36] suggested that the 85th percentile speed reduction from tangent to the curve is two times greater than the operating speed difference from the tangent to the curve for individual drivers. According to García et al. [37], the inertial operating speed of a driver is the actual operating speed. Inertial operating speed is the speed observed by drivers in their last stretch of 1 km and is used to determine drivers’ expectations of the road. The maximum speed reduction between inertial and actual operating speeds is termed the inertial consistency index (ICI). The threshold values for the ICI are based on weighted average crash data, and higher threshold values reflect inconsistencies in geometric elements. Lamm et al.’s [34] criterion of a 20 km/h limit of poor design is based on the speed reduction from the designed speed; however, García et al. [37] capture the actual speed reduction observed by drivers.
Previous studies on operating speed were conducted based on passenger cars [38]. Whereas heterogeneity of traffic is not considered, few studies incorporate different vehicle classes to evaluate speed differentials on horizontal alignment [39]. Developing countries, such as Malaysia, have higher motorcycle ownership and dependency rates than developed countries because of their lower socioeconomic status [40]. Several studies have found significant speed differences between passenger cars and heavy vehicles while traversing tangent to curve sections [41]. Misaghi and Hassan [39] determined the speed differential between two fixed locations—at the tangent section approximately 100 m before the beginning of a curve and at the midpoint of the curve—and found that passenger cars and trucks observe different operating speeds on horizontal alignment. Llopis-Castelló et al. [23] gathered continuous data for trucks and found that the horizontal curve radius strongly influenced the speed of heavy vehicles. Maji et al. [42] estimated the speed differential for different vehicle classes (car, heavy vehicle, and light vehicle) and found that the tangent length influences the speed differential on the curve section. The speed differential at the middle of the curve is significant if the tangent section is longer.
To address the lack of operating speed behavior research at horizontal alignment, this study attempts to present speed behavior of motorcycle, light vehicle, medium vehicle, and heavy vehicle on the horizontal alignment of two-lane rural roads to assist practitioners in the design, safety analysis, and performance evaluation of new and existing roadway infrastructures. The major contribution of this study is the identification of significant attributes influencing the speed behavior of vehicle classes, which was neglected in prior studies. The finding on the relationship between the operating speeds of various vehicle classes at various study points and the effect of the travel direction, time of day, and curve radius on the operating speed of the vehicle provides a more detailed insight to better understand speed behavior of heterogeneous traffic on two-lane rural roads in Malaysia.

3. Methodology

3.1. Data Collection and Extraction

Traffic data were collected at seven sites from February 2020 to March 2020 using automatic traffic counters (ATCs). The installed ATCs at each study point for a duration of 35 h capture vehicle speed, gap, headway, time stamp, and vehicle classification for two lanes of traffic simultaneously, with specific codes for vehicles driving in each direction (i.e., AB and BA). The data were collected at five different study points in both travel directions: the approach tangent (AT), the beginning of the curve (BC), the middle point of the curve (MP), the end of the curve (EC), and departure tangent (DT), as shown in Figure 1. The AT and DT points were determined after the stopping sight distance factor from the curve was considered to obtain the free-flow condition.
Data observed at each point from 07:30 to 18:30 and from 20:00 to 06:00 were used in the analysis. The following traffic data were excluded: (i) 1 h of traffic data at the beginning and end of the data collection to avoid biased behavior due to crew members’ presence during the installation and removal of the ATCs, (ii) following vehicles with headway values of less than 5 s to obtain observed speed under free flow conditions, and (iii) traffic data during the twilight period to differentiate between day and night data. Data from 07:30 to 18:30 and 20:00 to 06:00 were used to represent day and night, respectively. As the ATCs can classify vehicles based on their axle configuration, they were used to track vehicle classes. Various vehicle classes, based on the Austroads-94 vehicle class scheme, are presented in Table 1.

3.2. Data Analysis

The association between the 85th percentile operating speed of various vehicle classes (motorcycle, light vehicle, medium vehicle, and heavy vehicle) was explored at different study sites, different study points, time periods (day and night), travel directions (AB and BA), and horizontal curve radii. The 85th percentile speed is defined as the speed at or below that which 85% of drivers travel on a road segment. In this study, the 85th percentile speed for each vehicle class was obtained from the cumulative frequency distribution curve, as illustrated in Figure 2. With the hypothesis that the study points, time (day and night), travel directions (AB and BA), and horizontal curve radii affect the speed of various vehicle classes on two-lane rural roads, an ANOVA was used to determine whether there is a statistically significant difference between two or more categorical groups by testing for differences between the means using variance. The Tukey post hoc test was then conducted to assess the significance of the differences between vehicle classes at each study point using the mean of the 85th percentile speed. The Tukey post hoc test is often a follow-up to one-way ANOVA when the F-test has revealed the existence of a significant difference between some of the tested groups.

3.3. Site Description

A total of seven horizontal curves with various radii, lane widths, and curve lengths were chosen on two lane-rural roads in the state of Johor, Malaysia. Johor is in the south of Peninsular Malaysia, with a population of around 3.7 million. There are two main categories of roads in Johor, according to Public Work Department [43]: federal roads, with a total length of 2459 km, and state roads, with a total length of 23,055 km paved roads. The following criteria were considered for the selection of sites to avoid disruptions in normal traffic behaviors [33]:
(i).
The pavement is in good condition, with uniform lanes and shoulder width.
(ii).
There are no features that may disrupt vehicle speed (e.g., stop control or signalized intersection).
(iii).
The tangent length is more than 700 m.
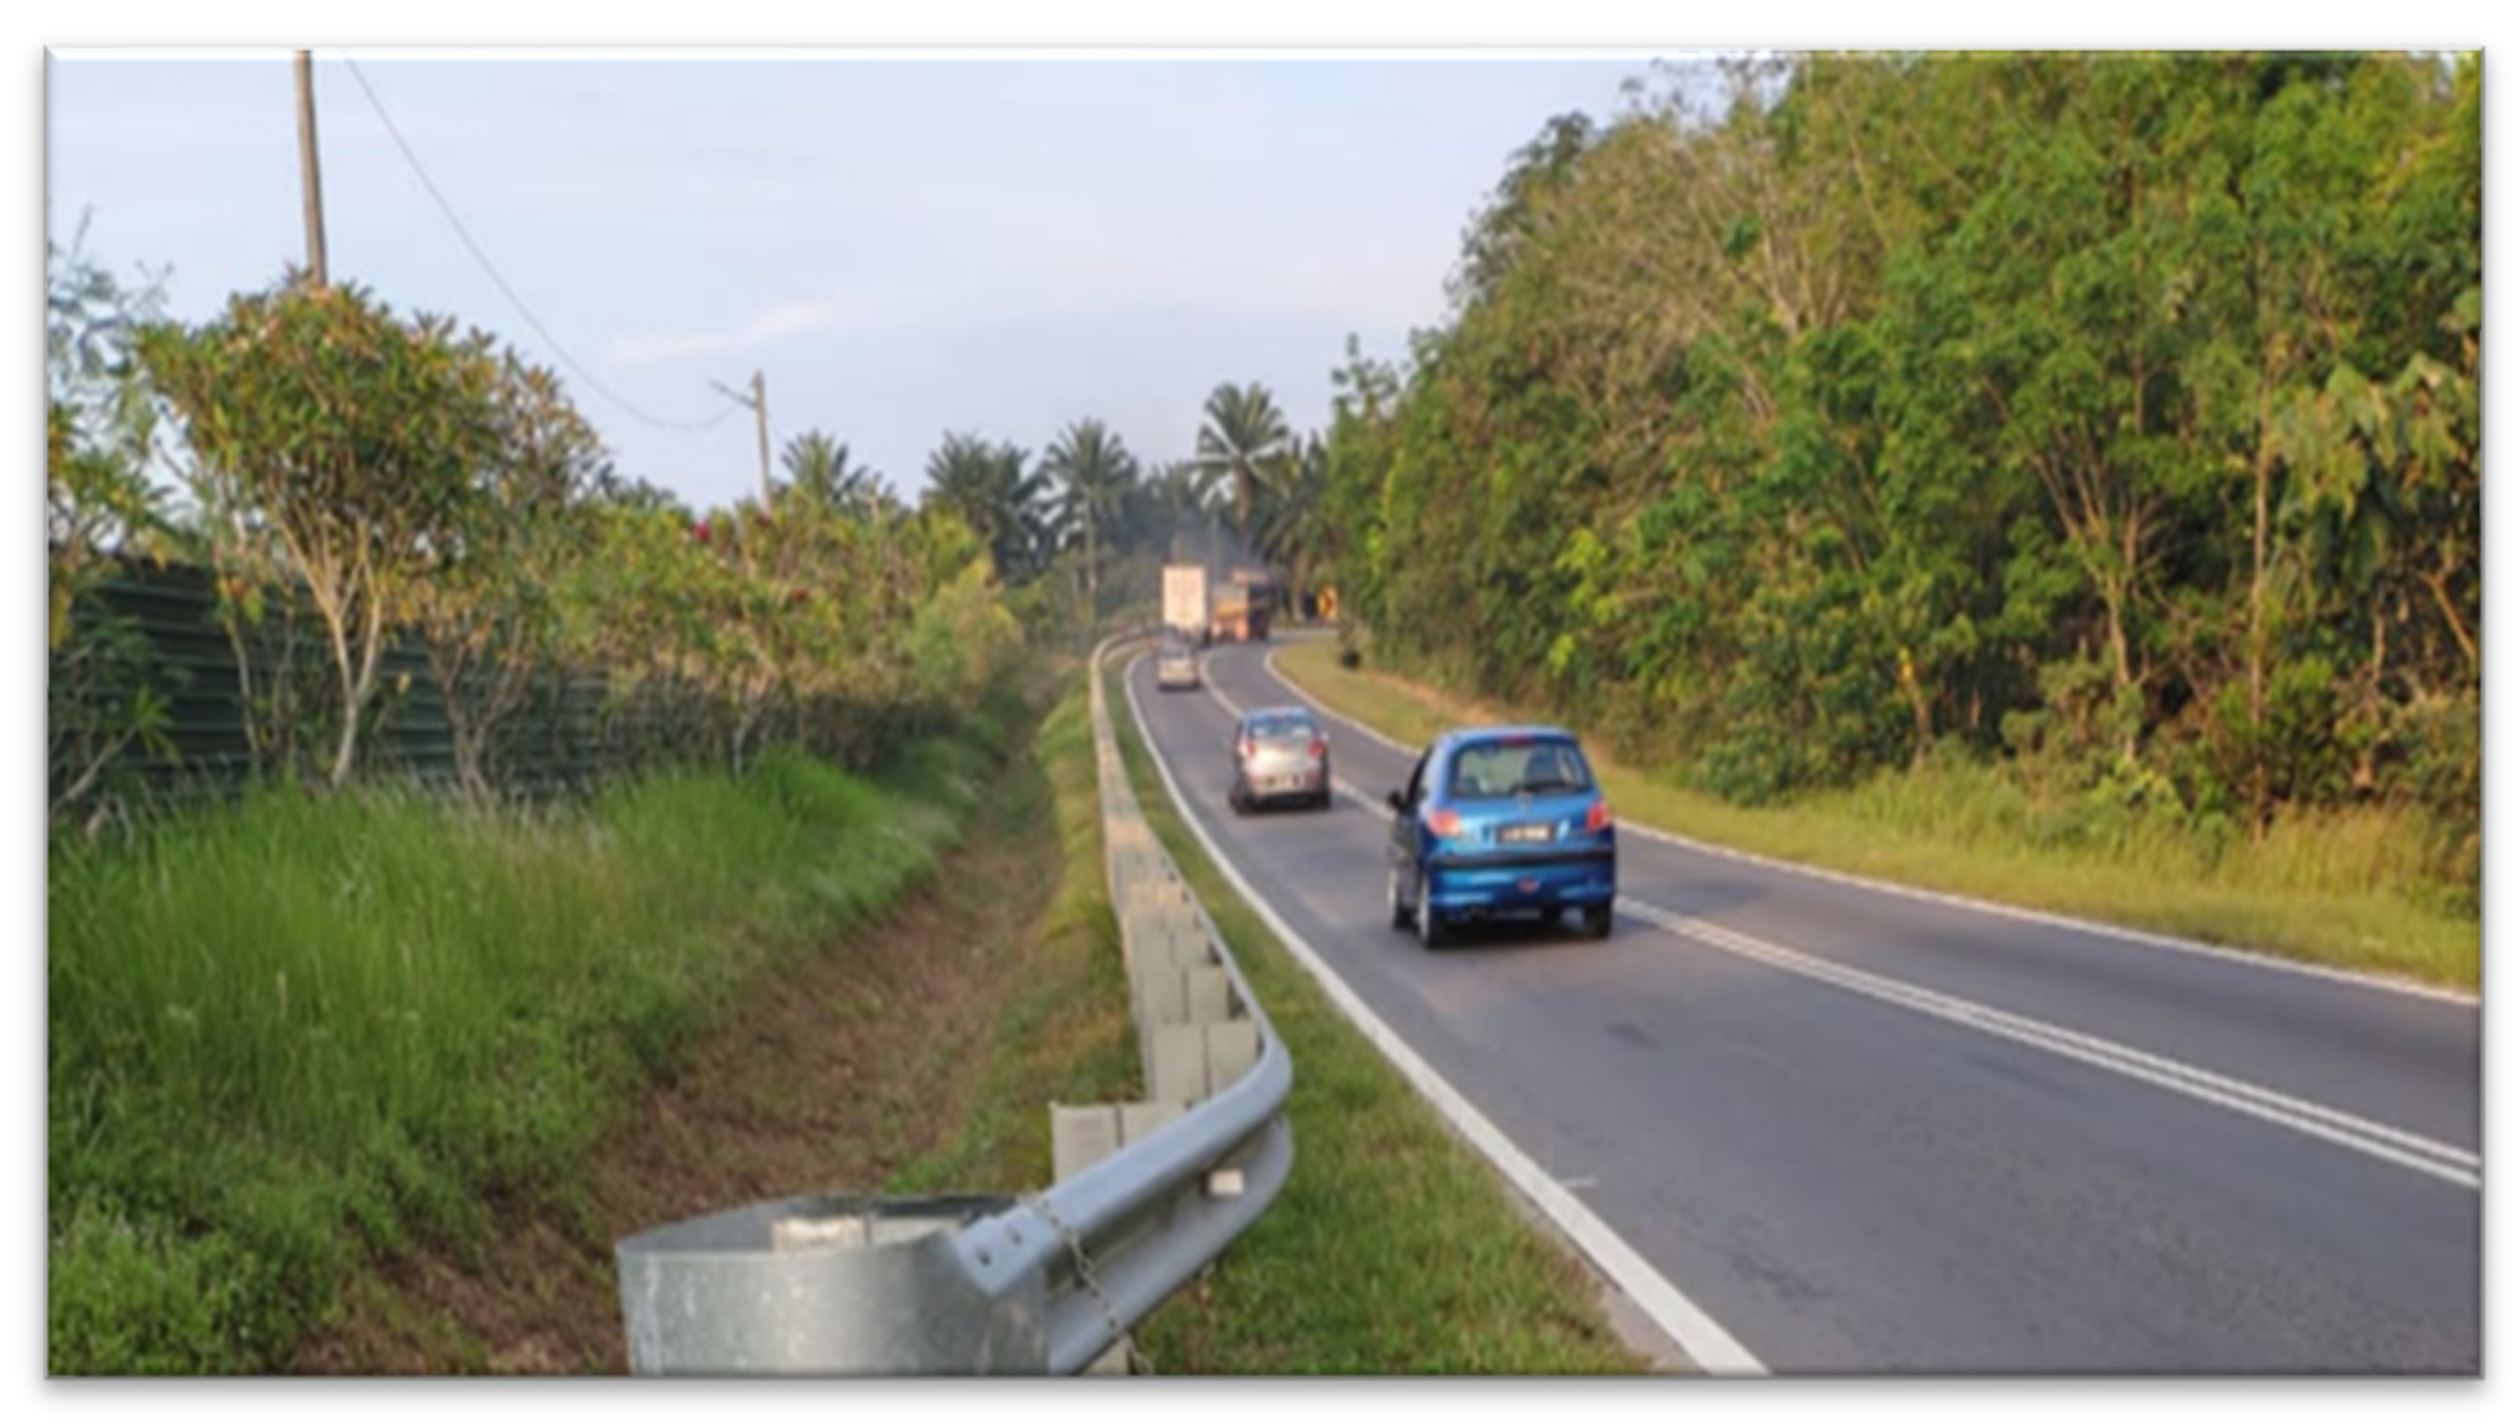
The study focuses on three districts: Pontian, Kota Tinggi, and Kulai. The geometric characteristics of the respective districts are presented in Table 2. In total, seven sites were chosen for data collection. According to Arahan Teknik (Jalan) [44], four study sites are classified as R3 (low geometric standards and design speeds of 60 km/h), one study site as R4 (medium geometric standards and design speed of 70 km/h or more), and two study sites as R5 (high geometric standards and design speeds ≥80 km/h). The typical study site conditions are shown in Figure 3.

4. Results

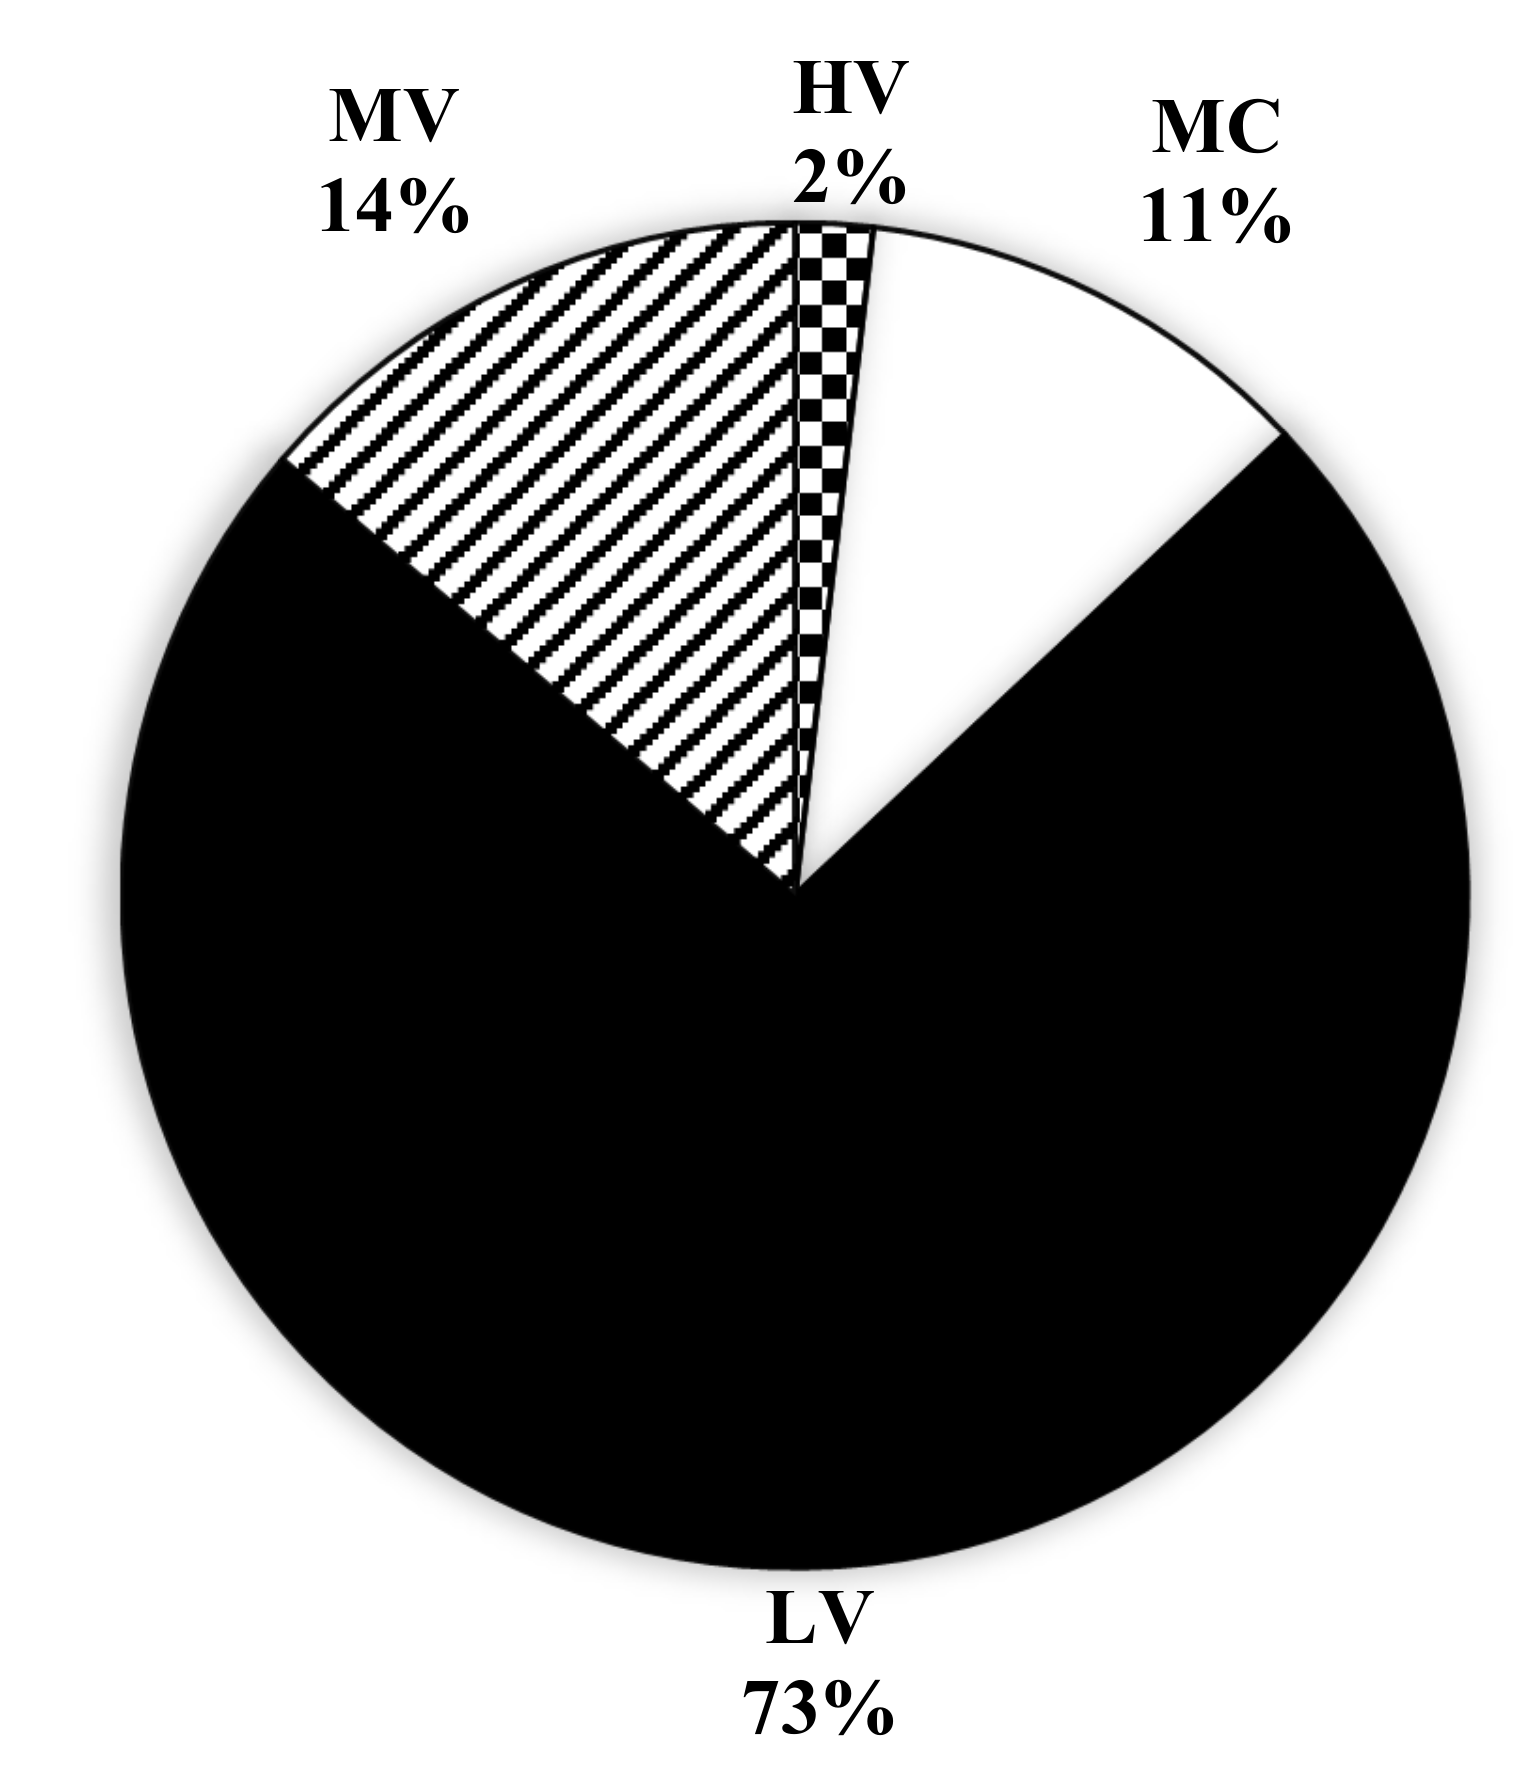
Analysis of the traffic data showed that light vehicles accounted for the highest (73%) share of the traffic composition, followed by medium vehicles (14%) and motorcycles (11%). The proportion of heavy vehicles was 2%. As the study focuses on two-lane rural roads that usually serve nearby localities, the proportion of heavy vehicles on these roads is low. The percentages of the individual classes of vehicles are presented in Figure 4.
Descriptive statistics of the observed speed for all vehicle classes at the five study points are presented in Table 3. The reported means of all vehicle classes differ, with the mean speed on curves (BC, MP, and EC) being lower than on tangent sections (AT and DT). This indicates that drivers typically select their speeds on long tangents oblivious to the safe speeds on downstream horizontal curves, and they reduce their speed when they approach and enter a horizontal curve. Drivers then accelerate out of the curve and maintain a reasonable speed at the departure tangent. In comparison to the mean speed at the departure tangent, the mean speed at the approach tangent was found to be greater. Among the vehicle classes considered in the study, the highest maximum speed was reported for light vehicles, and the lowest maximum speed was reported for heavy vehicles. This is because light vehicles are designed to achieve greater speeds than other vehicle classes by utilizing greater horsepower and vehicle dynamics. Heavy vehicles, however, are designed with greater torque power for delivering goods and usually travel at lower speeds compared to other vehicle classes. The findings also show that motorcycles have the highest minimum speed. Considerable variations in the standard deviation of speeds were also observed among vehicle classes, with a range of 12 to 17 km/h.

4.1. Effect of Tangent–Curve Section on Speed Behavior

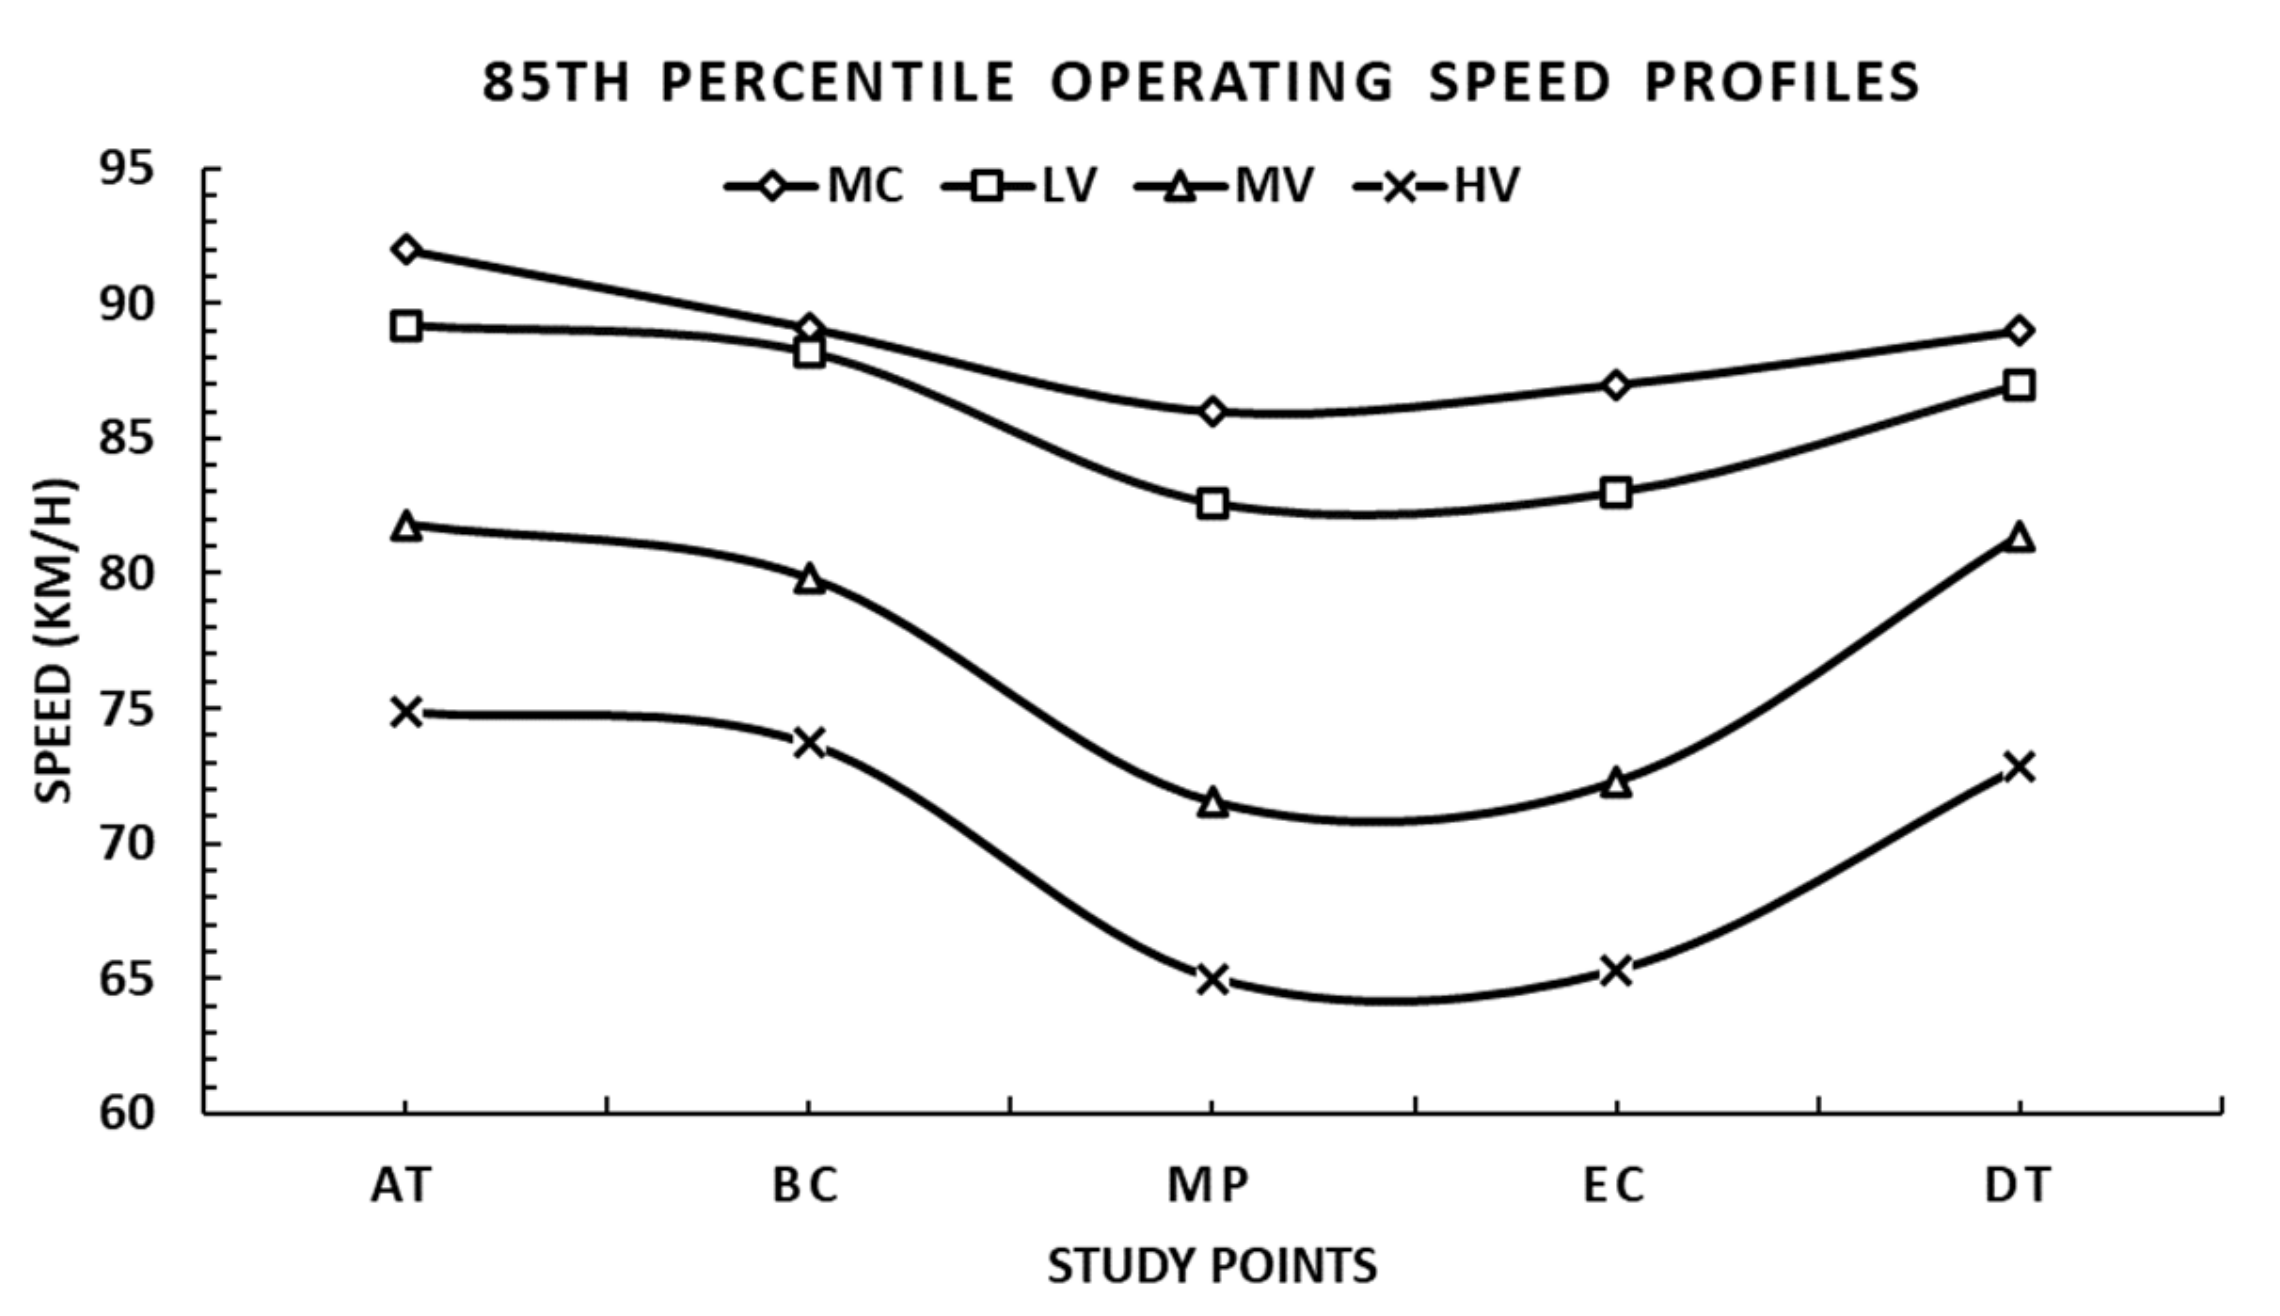
The comparison of the 85th percentile speed of vehicle classes at different points along the tangent and curve is presented in Figure 5. Vehicles are found to travel at a higher speed on the AT, as tangent sections on rural roads offer no geometric restrictions to drivers, and they can attain a desired speed. While entering the horizontal curve, drivers tend to reduce their speed through the BC until they attain the maximum speed reduction at the MP to negotiate the curve safely and comfortably. Vehicles with high speed on horizontal alignment tend to lose control due to the loss of frictional force [16]. Furthermore, vehicles exiting horizontal alignment are found to regain speed through the DT to attain the drivers’ desired speed for the tangent sections. This confirms that drivers vary their speed on horizontal alignment. They reduce their speed significantly when traversing from the curve to the tangent section to safely maneuver through the horizontal alignment [31]. The magnitude of speed reduction on a horizontal alignment depends on multiple factors, such as the vehicle type, the speed of the vehicle on the preceding tangent, and vehicle dynamics. Vehicle classes, such as motorcycles and light vehicles, were found to travel at higher speeds at the AT, but the speed reduction for light vehicles was greater than for motorcycles. Motorcycles are less restricted by geometric elements due to their smaller size and greater maneuverability.

4.2. Effect of Travel Direction on Speed Behavior

Another parameter influencing speed through curves is the travel direction. The effects of travel direction on the 85th percentile speed are presented in Figure 6. Directional analysis for four vehicle classes was performed at various study points. Although the vehicles traveled in the same horizontal alignment in directions AB and BA, their speed behavior differed, despite a nearly identical speed pattern. The speed behavior of the vehicles in direction AB was observed to be slightly higher than that of vehicles in direction BA. Such varying behavior implies that factors other than the radius of the horizontal alignment also affect speed behavior. Factors, such as the length of the preceding tangent and the vehicle approach speed at the curve section, influence speed behavior; a longer preceding tangent results in higher speed at the AT. In addition to the tangent section length, vehicle dynamics, such as braking efficiency and vehicle dimension, affect speed [45].

4.3. Effect of Time of Day on Speed Behavior

Speed behavior varies depending on the time of day. Figure 7 illustrates the daytime and nighttime 85th percentile operating speeds at the tangent and the curve. The results indicate that drivers behave very differently at night than during the day, with their speed found to be higher during the daytime. The choice of speeds is closely related to the driver’s ability to see the road. Daytime, during which drivers have an abundance of visual information and road guidance, may lead to increased driving speed. Moreover, by its very nature, daytime driving is safer than nighttime driving. At night, a driver’s primary means of guidance is the roadway and its delineation. A driver’s sight distance is reduced to the vehicle’s headlight illumination distance, thus resulting in compromised vision due to a lack of ambient light, which causes drivers to employ slower speeds than daytime [46]. In this study, all vehicle classes showed a similar pattern of speed reduction when traversing the curve, except for motorcycles. Motorcycles exhibited significant speed reductions at night, while minimal speed reductions are observed during the day. The speed varies between day and night because motorcycle headlights are not very effective compared to other vehicles, and riders are not comfortable maintaining the speed behavior they maintain in daylight.

4.4. Effect of Curve Radius on Speed Behavior

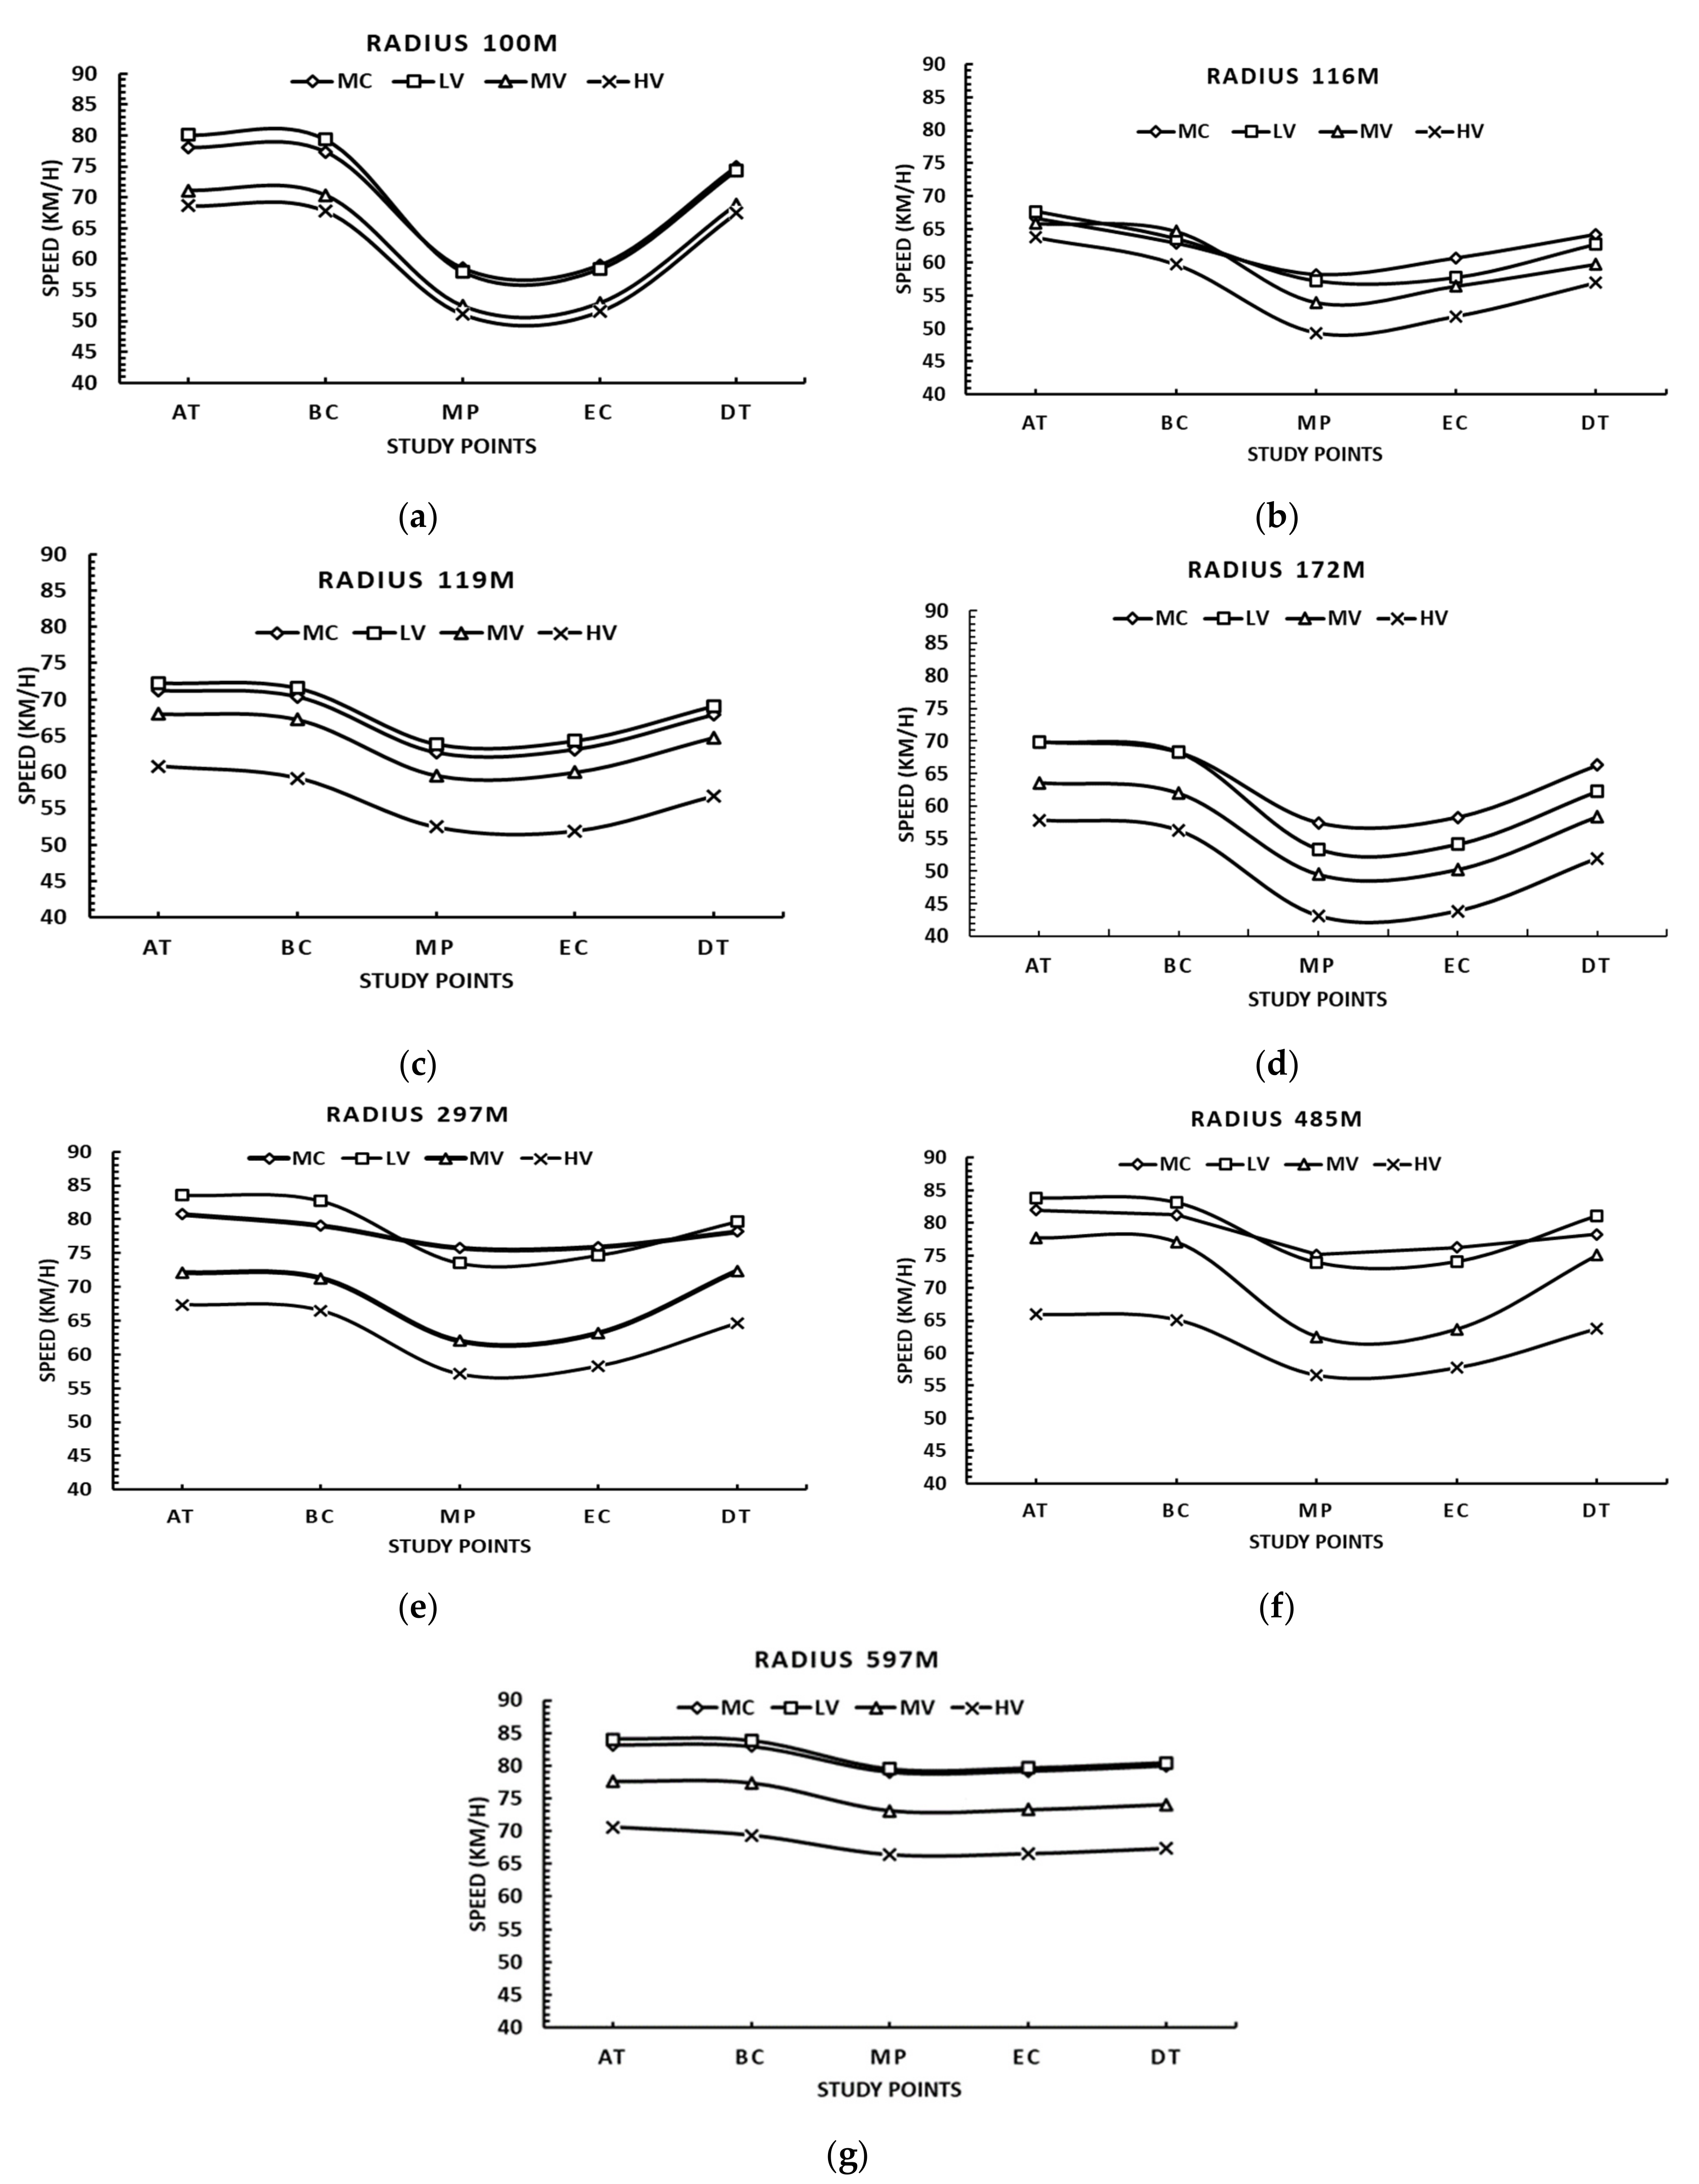
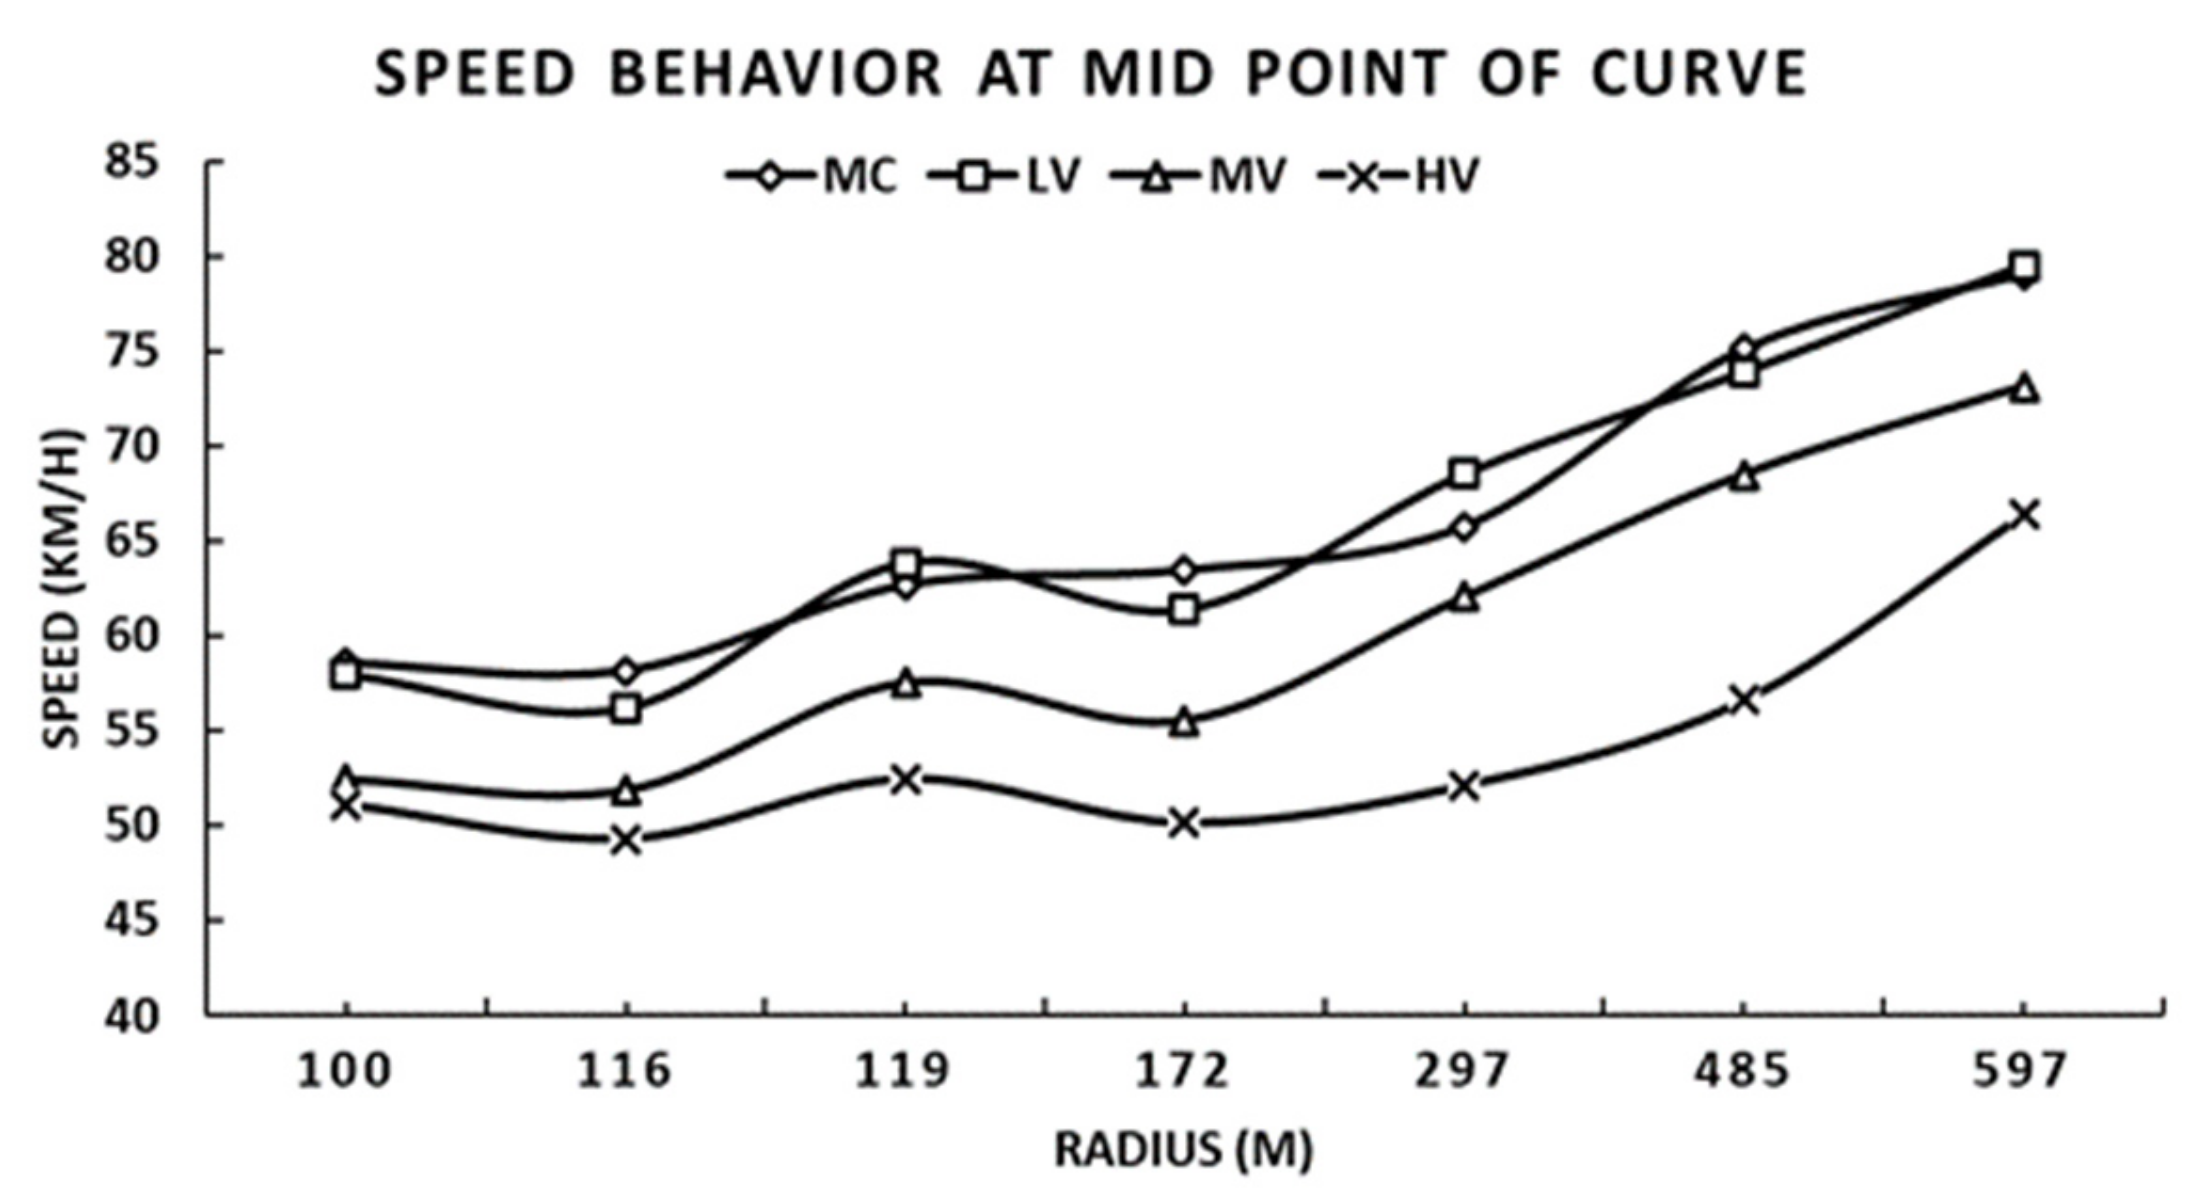
The radius is the key feature of a curve. It is also a key element in drivers’ selection of their speed. Figure 8 shows the impact of varying the horizontal curve radii on the operating speed of the various vehicle classes. It was observed that a maximum difference in operating speed occurred between the AT and the MP for all curve radii. However, the impact differs for the smallest and biggest curve radii. The 100 m curve radius shows a large speed reduction. A radius of 597 m has less effect on a vehicle’s speed. Drivers typically slow down when the radius of the horizontal alignment is sharp to safely negotiate the curve. A sharp horizontal curve leads to the maximum difference in operating speed if the AT speed is high. Radii of horizontal alignment less than 100 m have a significant influence on speed [47]. Furthermore, the driving workload is primarily generated during the maneuver stage, and a radius of horizontal alignment of less than 500 m imposes an additional driving workload, which adversely affects the driver’s performance [48]. The results of the study also confirm that a radius ≤500 m significantly affects vehicle speed. Several researchers have found that a sharp horizontal alignment is a significant contributor to differences in speed between tangent and curve sections [33,47].
Drivers of all vehicle classes reduced their speed at the midpoint of the curve and accelerated or increased their speed while exiting the curve. Light vehicles have higher speeds than motorcycles, medium vehicles, and heavy vehicles. Drivers of motorcycles exhibit speed behavior similar to that of drivers of light vehicles. However, unlike light vehicles, motorcycle speed does not appear to decrease significantly at the midpoint of the curve, which is in line with Goyani et al.’s [49] results. The data collected at the MP, as presented in Figure 9, show that all vehicle classes travel at slower speeds on sharp curve radii and higher speeds as the radius of the curve increases. Although the differences in the radius values between 100 m, 116 m, and 119 m are marginal, they exhibit distinct speed behaviors. The main factor is the speed at the approach tangent. Due to high geometric standards and design speeds of ≥80 km/h, speeds at curve radii of 100 m and 119 m were found to be higher than those at a curve radius of 116 m.

4.5. Statistical Analysis

A one-way ANOVA test was conducted to compare the mean of the 85th percentile speed of different vehicle classes with varying study sites, study points, time of day, direction of travel, and radius. At the 95% confidence level, one-way ANOVA revealed a statistically significant difference in the speeds of the vehicle classes at different study points, time of day, travel direction, and radius of the curve (p < 0.05). The ANOVA results are presented in Table 4.
Although the ANOVA results highlight that the study points, time of day, travel direction, and radius of the curve significantly impact the speeds of different vehicle classes, the limitation of the analysis is that it does not identify the differences in speed that occur between vehicle classes. Therefore, the Tukey post hoc test was applied to investigate the differences in the mean of the 85th percentile operating speed among the vehicle classes at different study points. The results are presented in Table 5. The comparison between vehicle classes at the five study points demonstrates that there is a significant difference in speed between all vehicle classes at the 95% confidence level (p < 0.05).
It was discovered that the 85th percentile speed differed for various vehicle classes at various research points, travel direction, time of day, and horizontal curve radius. Horizontal alignment plays a pivotal role in speed behavior across all vehicle classes. Light vehicles were observed to have higher operating speeds than other vehicle classes. However, compared to medium vehicles and heavy vehicles, the operating speed reduction of motorcycles and light vehicles is substantially lower. The operating speed reduction from the tangent to the curve for heavy vehicles was greater than for the other vehicle classes. Among vehicle classes, the most vulnerable group in the traffic stream is motorcycles, due to the higher risk of crashes. The speed variation of motorcycles, which differs from other groups of vehicles in the traffic stream, poses a significant safety risk. On two-lane rural roads, vehicle speed is affected by other vehicles. For instance, if the lead vehicle reduces its speed, it impedes the traffic behind it. Therefore, the speed of a vehicle is an important factor in road safety.

5. Conclusions

This study focuses on the differences in operating speeds among different vehicle classes on two-lane rural roads in Malaysia. The study sites were comprised mainly of light vehicles, which account for 73% of the traffic. The results reveal that the observed vehicle speeds were highest on the tangent section where the radius is infinity, and vehicle speeds were significantly reduced on the horizontal curve with maximum difference in operating speed at the middle point of the curve. Despite the similarities in radius between directions AB and BA, all vehicle classes operate at considerably different speeds. The speed behavior on horizontal curves seems to depend on factors other than the radius. These factors include the vehicle’s speed at the approach tangent and the length of the preceding tangent. The results indicate that drivers reduce their speed during the night due to a lack of ambient light. The Tukey post hoc test results indicate that different vehicle classes in traffic streams have different operating speeds at the study sites. The results show that the horizontal curve radius significantly contributes to the differences in operating speed among different vehicle classes. The difference in operating speed is higher on roads with a lower horizontal curve radius than on roads with a higher radius. All vehicle classes (motorcycles, light vehicle, medium vehicle, and heavy vehicle) tend to have a significant impact on the other classes’ speed behavior.
Differences in operating speeds between traffic streams have long been recognized as a safety concern. The importance of safety for achieving sustainable development is acknowledged in global environmental policies, and it should be a need for mobility, especially in developing countries where the rate of traffic fatalities is still too high. A safe and affordable transportation system may boost economic growth and increase accessibility, making safer mobility and transportation essential to sustainable development. Sustainable development in transportation helps to lower harmful carbon dioxide (CO2) emissions, which in turn helps to lower atmospheric pollution and enhance city air quality. In light of this, understanding speed behavior is an area with significant potential to benefit society, the economy, and the environment.
It is imperative to identify horizontal curves with speed variations to obtain a comprehensive understanding of the speed behavior of heterogeneous traffic on two-lane rural roads. As this study is limited to two-lane rural roads in the Johor state of Malaysia, future research should explore other states in Malaysia to obtain more holistic speed behavior of traffic on two-lane rural roads. This study compared the speed behavior of tangent and curve sections, which can be used to assess the consistency of the alignments and provide a geometric design consistency model. Future studies can explore the effect of horizontal curve on speed behavior under adverse weather conditions and other geometric features of the curve. In addition, the findings show that the directions AB and BA display varied speed behavior, indicating the need for additional research to consider variables, such as vehicle dynamics and the length of the preceding tangent when evaluating speed behavior.

Author Contributions

Methodology, S.A.H.; Software, N.M.; Formal analysis, R.U.F.; Writing—original draft, R.U.F.; Writing—review & editing, N.M. and S.A.H.; Supervision, N.M. and S.A.H. All authors have read and agreed to the published version of the manuscript.

Funding

This research was funded by the Ministry of Higher Education, Malaysia under the Fundamental Research Grant Scheme (FRGS/1/2020/TK02/UTM/02/5).

Acknowledgments

We thank the Ministry of Higher Education, Malaysia for awarding a Fundamental Research Grant Scheme (FRGS/1/2020/TK02/UTM/02/5) to conduct this research. The findings shared in this paper is part of this project.

Conflicts of Interest

The authors declare no conflict of interest.

References

  1. World Health Organization (WHO). World Health Organization (WHO) Global Status Report on Road Safety 2018: Summary; World Health Organization: Geneva, Switzerland, 2018. [Google Scholar]
  2. Touahmia, M. Identification of Risk Factors Influencing Road Traffic Accidents. Eng. Technol. Appl. Sci. Res. 2018, 8, 2417–2421. [Google Scholar] [CrossRef]
  3. Weber, S.; Tschech, K.; Ernstberger, K.; Labenski, V.; Blum, K. Different Types of Distraction Causing Accidents. In Proceedings of the 6th International Conference on Driver Distraction and Inattention, Gothenburg, Sweden, 15–17 October 2018. [Google Scholar]
  4. Singh, H.; Kathuria, A. Analyzing Driver Behavior under Naturalistic Driving Conditions: A Review. Accid. Anal. Prev. 2021, 150, 105908. [Google Scholar] [CrossRef] [PubMed]
  5. Ali, Y.; Bliemer, M.C.J.; Zheng, Z.; Haque, M.M. Comparing the Usefulness of Real-Time Driving Aids in a Connected Environment during Mandatory and Discretionary Lane-Changing Manoeuvres. Transp. Res. Part C Emerg. Technol. 2020, 121, 102871. [Google Scholar] [CrossRef]
  6. Distefano, N.; Leonardi, S.; Pulvirenti, G.; Romano, R.; Merat, N.; Boer, E.; Woolridge, E. Physiological and Driving Behaviour Changes Associated to Different Road Intersections. Eur. Transp. Trasp. Eur. 2020, 77, 1–12. [Google Scholar] [CrossRef]
  7. Ali, Y.; Bliemer, M.C.J.; Zheng, Z.; Haque, M.M. Cooperate or Not? Exploring Drivers’ Interactions and Response Times to a Lane-Changing Request in a Connected Environment. Transp. Res. Part C Emerg. Technol. 2020, 120, 102816. [Google Scholar] [CrossRef]
  8. Papantoniou, P.; Yannis, G.; Christofa, E. Which Factors Lead to Driving Errors? A Structural Equation Model Analysis through a Driving Simulator Experiment. IATSS Res. 2019, 43, 44–50. [Google Scholar] [CrossRef]
  9. Eboli, L.; Forciniti, C.; Mazzulla, G. Factors Influencing Accident Severity: An Analysis by Road Accident Type. Transp. Res. Procedia 2020, 47, 449–456. [Google Scholar] [CrossRef]
  10. Jacob, A.; Dhanya, R.; Anjaneyulu, M.V.L.R. Geometric Design Consistency of Multiple Horizontal Curves on Two-Lane Rural Highways. Procedia Soc. Behav. Sci. 2013, 104, 1068–1077. [Google Scholar] [CrossRef] [Green Version]
  11. Wu, L.; Dadashova, B.; Geedipally, S.; Pratt, M.P.; Shirazi, M. Using Naturalistic Driving Study Data to Explore the Association between Horizontal Curve Safety and Operation on Rural Two-Lane Highways. J. Transp. Saf. Secur. 2019, 13, 896–913. [Google Scholar] [CrossRef]
  12. Calvi, A.; D’Amico, F.; Bianchini Ciampoli, L.; Ferrante, C. Evaluating the Effectiveness of Perceptual Treatments on Sharp Curves: A Driving Simulator Study. Traffic Inj. Prev. 2019, 20, S13–S19. [Google Scholar] [CrossRef]
  13. Hummer, J.E.; Rasdorf, W.; Findley, D.J.; Zegeer, C.V.; Sundstrom, C.A. Curve Collisions: Road and Collision Characteristics and Countermeasures. J. Transp. Saf. Secur. 2010, 2, 203–220. [Google Scholar] [CrossRef]
  14. Albin, R.B.; Brinkly, V.; Cheung, J.; Julian, F.; Satterfield, C.; Stein, W.J.; Donnell, E.T.; McGee, H.W.; Holzem, A.; Albee, M. Low-Cost Treatments for Horizontal Curve Safety 2016; United States Federal Highway Administration, Office of Safety: Washington, DC, USA, 2016. [Google Scholar]
  15. Himes, S.; Porter, R.J.; Hamilton, I.; Donnell, E. Safety Evaluation of Geometric Design Criteria: Horizontal Curve Radius and Side Friction Demand on Rural, Two-Lane Highways. Transp. Res. Rec. 2019, 2673, 516–525. [Google Scholar] [CrossRef]
  16. Hamilton, I.; Himes, S.; Porter, R.J.; Donnell, E. Safety Evaluation of Horizontal Alignment Design Consistency on Rural Two-Lane Highways. Transp. Res. Rec. 2019, 2673, 628–636. [Google Scholar] [CrossRef]
  17. Malaghan, V.; Pawar, D.S.; Dia, H. Modeling Operating Speed Using Continuous Speed Profiles on Two-Lane Rural Highways in India. J. Transp. Eng. Part A Syst. 2020, 146, 04020124. [Google Scholar] [CrossRef]
  18. Federal Highway Administration, (FHWA). Factors Influencing Operating Speeds and Safety on Rural and Suburban Roads; Publication No. FHWA-HRT-15-030; Turner-Fairbank Highway Research Center: McLean, VA, USA, 2015. [Google Scholar]
  19. AASHTO. A Policy on Geometric Design of Highways and Streets, 2011; Green book; American Association of State Highway and Transportation Officials: Washington, DC, USA, 2011. [Google Scholar]
  20. Lamm, R.; Smith, B.L. Curvilinear Alinement: An Important Issue for More Consistent and Safer Road Characteristic. Transp. Res. Rec. 1994, 1445, 12–21. [Google Scholar]
  21. Bird, R.N.; Hashim, I.H. Operating Speed and Geometry Relationships for Rural Single Carriageways in the UK. In Proceedings of the 3rd International Symposium on Highway Geometric Design, Chicago, IL, USA, 29 June–1 July 2005. [Google Scholar]
  22. Malaghan, V.; Pawar, D.S.; Dia, H. Speed Prediction Models for Heavy Passenger Vehicles on Rural Highways Based on an Instrumented Vehicle Study. Transp. Lett. 2020, 14, 39–48. [Google Scholar] [CrossRef]
  23. Llopis-Castelló, D.; González-Hernández, B.; Pérez-Zuriaga, A.M.; García, A. Speed Prediction Models for Trucks on Horizontal Curves of Two-Lane Rural Roads. Transp. Res. Rec. 2018, 2672, 72–82. [Google Scholar] [CrossRef]
  24. Ersan, Ö.; Üzümcüoğlu, Y.; Azık, D.; Fındık, G.; Kaçan, B.; Solmazer, G.; Özkan, T.; Lajunen, T.; Öz, B.; Pashkevich, A.; et al. Cross-Cultural Differences in Driver Aggression, Aberrant, and Positive Driver Behaviors. Transp. Res. Part F Traffic Psychol. Behav. 2020, 71, 88–97. [Google Scholar] [CrossRef]
  25. Bobermin, M.P.; Silva, M.M.; Ferreira, S. Driving Simulators to Evaluate Road Geometric Design Effects on Driver Behaviour: A Systematic Review. Accid. Anal. Prev. 2021, 150, 105923. [Google Scholar] [CrossRef]
  26. Bongiorno, N.; Bosurgi, G.; Pellegrino, O.; Sollazzo, G. How Is the Driver’s Workload Influenced by the Road Environment? Procedia Eng. 2017, 187, 5–13. [Google Scholar] [CrossRef]
  27. Haghighi, N.; Liu, X.C.; Zhang, G.; Porter, R.J. Impact of Roadway Geometric Features on Crash Severity on Rural Two-Lane Highways. Accid. Anal. Prev. 2018, 111, 34–42. [Google Scholar] [CrossRef] [PubMed]
  28. Altamira, A.; García, Y.; Echaveguren, T.; Marcet, J. Acceleration and Deceleration Patterns on Horizontal Curves and Their Tangents on Two-Lane Rural Roads. In Proceedings of the 93rd Transportation Research Board Meeting, Washington, DC, USA, 12–16 January 2014; p. 15. [Google Scholar]
  29. Ryan, A.; Ai, C.; Fitzpatrick, C.; Knodler, M. Crash Proximity and Equivalent Property Damage Calculation Techniques: An Investigation Using a Novel Horizontal Curve Dataset. Accid. Anal. Prev. 2022, 166, 106550. [Google Scholar] [CrossRef] [PubMed]
  30. Eboli, L.; Guido, G.; Mazzulla, G.; Pungillo, G. Experimental Relationships between Operating Speeds of Successive Road Design Elements in Two-Lane Rural Highways. Transport 2017, 32, 138–145. [Google Scholar] [CrossRef] [Green Version]
  31. Pérez-Zuriaga, A.M.; Camacho-Torregrosa, F.J.; García, A. Tangent-to-Curve Transition on Two-Lane Rural Roads Based on Continuous Speed Profiles. J. Transp. Eng. 2013, 139, 1048–1057. [Google Scholar] [CrossRef]
  32. McFadden, J.; Elefteriadou, L. Evaluating Horizontal Alignment Design Consistency of Two-Lane Rural Highways: Development of New Procedure. Transp. Res. Rec. 2000, 1737, 9–17. [Google Scholar] [CrossRef]
  33. Sil, G.; Maji, A.; Nama, S.; Maurya, A.K. Operating Speed Prediction Model as a Tool for Consistency Based Geometric Design of Four-Lane Divided Highways. Transport 2019, 34, 425–436. [Google Scholar] [CrossRef] [Green Version]
  34. Lamm, R.; Choueiri, E.M.; Hayward, J.; Paluri, A. Possible Design Procedure to Promote Design Consistency in Highway Geometric Design on Two-Lane Rural Roads. Transp. Res. Rec. J. Transp. Res. Board 1988, 1195, 111–121. [Google Scholar]
  35. Anderson, I.B.; Krammes, R.A. Speed Reduction as a Surrogate for Accident Experience at Horizontal Curves on Rural Two-Lane Highways. Transp. Res. Rec. 2000, 1701, 86–94. [Google Scholar] [CrossRef]
  36. Montella, A.; Pariota, L.; Galante, F.; Imbriani, L.L.; Mauriello, F. Prediction of Drivers’ Speed Behavior on Rural Motorways Based on an Instrumented Vehicle Study. Transp. Res. Rec. 2014, 2434, 52–62. [Google Scholar] [CrossRef] [Green Version]
  37. García, A.; Llopis-Castelló, D.; Camacho-Torregrosa, F.; Pérez-Zuriaga, A. New Consistency Index Based on Inertial Operating Speed. Transp. Res. Rec. 2013, 2391, 105–112. [Google Scholar] [CrossRef]
  38. Llopis-Castelló, D.; Bella, F.; Camacho-Torregrosa, F.J.; García, A. New Consistency Model Based on Inertial Operating Speed Profiles for Road Safety Evaluation. J. Transp. Eng. Part A Syst. 2018, 144, 04018006. [Google Scholar] [CrossRef] [Green Version]
  39. Misaghi, P.; Hassan, Y. Modeling Operating Speed and Speed Differential on Two-Lane Rural Roads. J. Transp. Eng. 2005, 131, 408–418. [Google Scholar] [CrossRef]
  40. Bastos, S.Q.A.; Gama, F.; de Paula Assis, T.; Milosz, M. Is There a Relationship between the Use of Motorcycles and the Level of Development of Countries? Bull. Geogr. Socio-Econ. Ser. 2020, 50, 43–53. [Google Scholar] [CrossRef]
  41. Morris, C.M.; Donnell, E.T. Passenger Car and Truck Operating Speed Models on Multilane Highways with Combinations of Horizontal Curves and Steep Grades. J. Transp. Eng. 2014, 140, 04014058. [Google Scholar] [CrossRef]
  42. Maji, A.; Sil, G.; Tyagi, A. 85th and 98th Percentile Speed Prediction Models of Car, Light, and Heavy Commercial Vehicles for Four-Lane Divided Rural Highways. J. Transp. Eng. Part A Syst. 2018, 144, 04018009. [Google Scholar] [CrossRef]
  43. Public Work Department. Statistik Jalan Malaysia Edisi; Public Work Department: Kuala Lumpur, Malaysia, 2021; ISSN 1985-9619. [Google Scholar]
  44. JKR. Arahan Teknik (Jalan) 8/86 A Guide on Geometric Design of Roads; Public Works Department Malaysia: Kuala Lumpur, Malaysia, 2015. [Google Scholar]
  45. Fadhloun, K.; Rakha, H.; Loulizi, A.; Abdelkefi, A. Vehicle Dynamics Model for Estimating Typical Vehicle Accelerations. Transp. Res. Rec. 2015, 2491, 61–71. [Google Scholar] [CrossRef]
  46. Wood, J.M. Nighttime Driving: Visual, Lighting and Visibility Challenges. Ophthalmic Physiol. Opt. 2020, 40, 187–201. [Google Scholar] [CrossRef] [Green Version]
  47. Cvitanić, D.; Maljković, B. Determination of Applicable Adjacent Horizontal Curve Radii Using Operating Speed. Promet Traffic Transp. 2019, 31, 443–452. [Google Scholar] [CrossRef]
  48. Liu, H.; Xu, J.; Zhang, X.; Gao, C.; Sun, R. Evaluation Method of the Driving Workload in the Horizontal Curve Section Based on the Human Model of Information Processing. Int. J. Environ. Res. Public Health 2022, 19, 7063. [Google Scholar] [CrossRef]
  49. Goyani, J.; Chaudhari, P.; Arkatkar, S.; Joshi, G.; Easa, S.M. Operating Speed Prediction Models by Vehicle Type on Two-Lane Rural Highways in Indian Hilly Terrains. J. Transp. Eng. Part A Syst. 2022, 148, 04022001. [Google Scholar] [CrossRef]
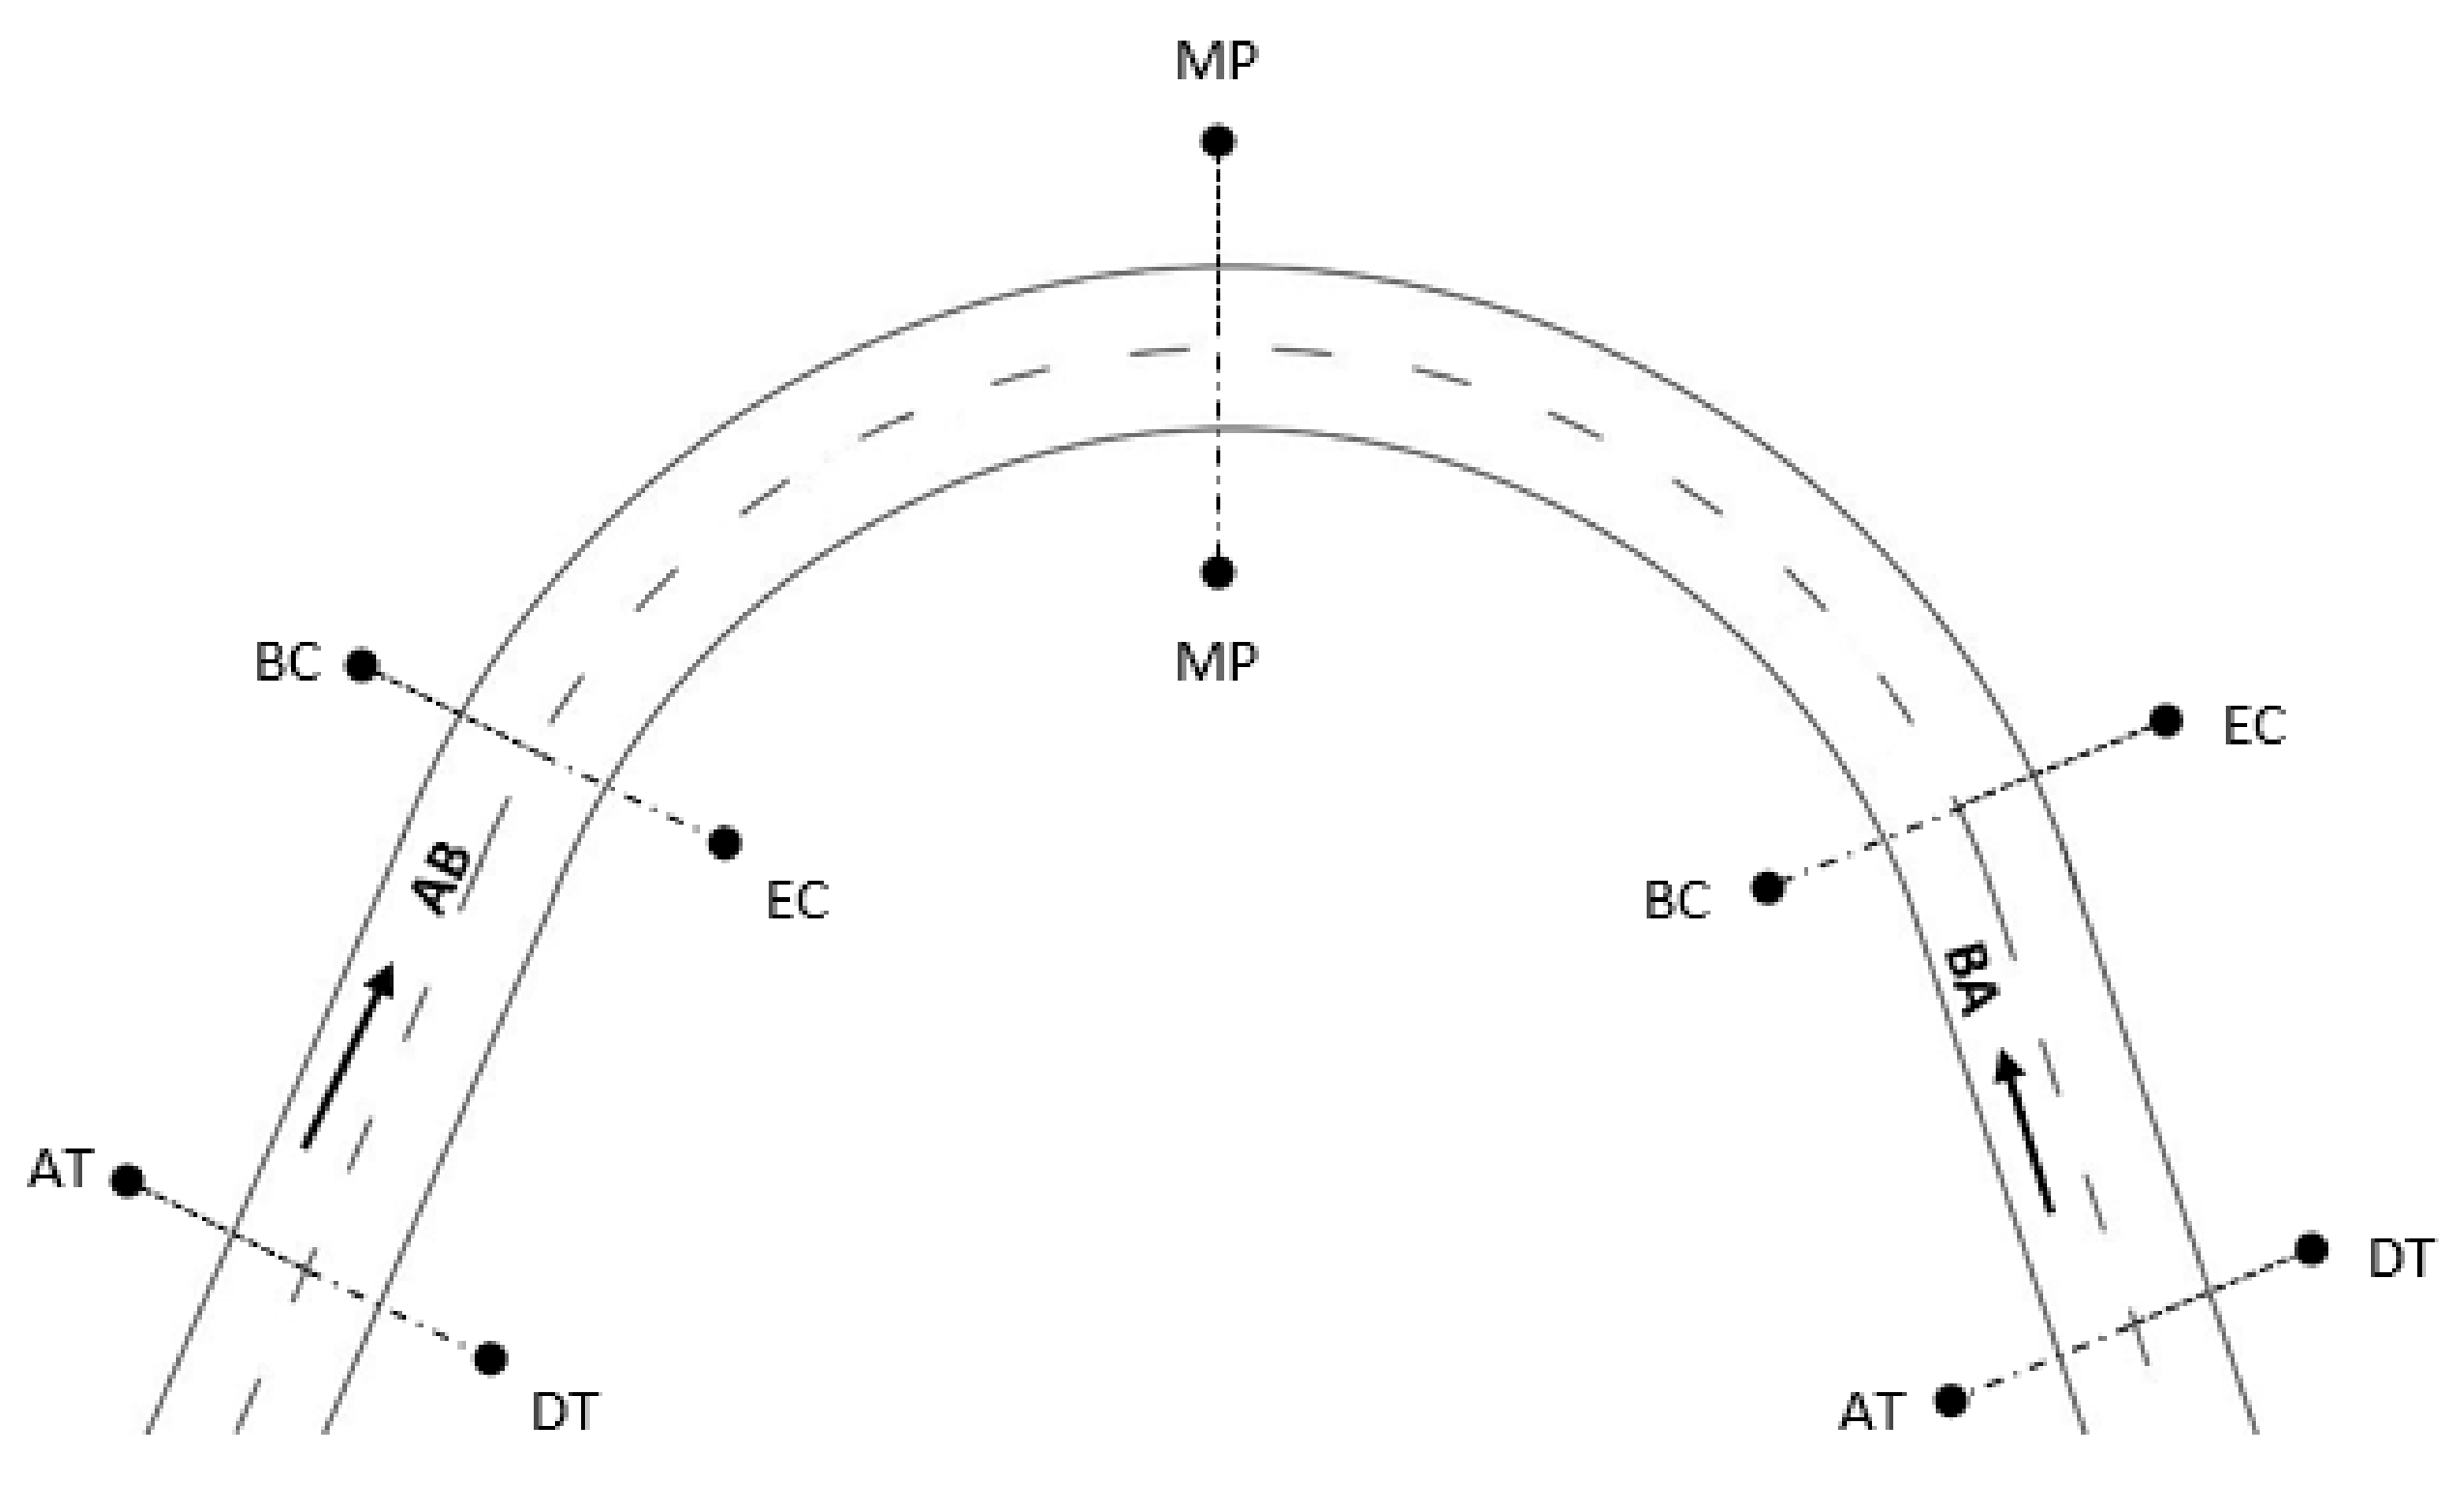
Figure 1. Sketch of the observation points at the tangent and the curve.
Sustainability 14 16144 g001
Figure 2. Estimation of the 85th percentile operating speed.
Sustainability 14 16144 g002
Figure 3. Typical conditions at a study site.
Sustainability 14 16144 g003
Figure 4. Traffic composition.
Sustainability 14 16144 g004
Figure 5. The 85th percentile operating speed profiles at the tangent curve section.
Sustainability 14 16144 g005
Figure 6. The 85th percentile operating speed based on the travel direction: (a) AB direction; (b) BA direction.
Sustainability 14 16144 g006
Figure 7. The 85th percentile operating speed based on the time of day: (a) daytime; (b) nighttime.
Sustainability 14 16144 g007
Figure 8. The 85th percentile operating speed at different radii: (a) radius 100 m; (b) radius 116 m; (c) radius 119 m; (d) radius 172 m; (e) radius 297 m; (f) radius 485 m; and (g) radius 597 m.
Sustainability 14 16144 g008
Figure 9. Speed behavior at mid-point based on radius.
Sustainability 14 16144 g009
Table 1. Vehicle classes and descriptions.
Vehicle ClassSymbolDescription
MotorcycleMCMotorcycle, scooter
Light VehicleLVSedan, wagon, 4 WD utility and light van, caravan, short towing truck
Medium VehicleMVTwo-axle truck or bus, three-axle truck or bus, four-axle truck
Heavy VehicleHVThree-axle articulated vehicle or rigid vehicle and trailer, four-axle articulated vehicle or rigid vehicle and trailer, five-axle articulated vehicle or rigid vehicle and trailer, six- or more axle articulated vehicle or rigid vehicle and trailer, B double or heavy truck and trailer, double road train or heavy truck, two tailer and triple road train or heavy truck, and three tailers
Table 2. Description of the geometric features of the study sites.
DistrictRoad NameDesign StandardLane Width
(m)
Radius
(m)
Curve Length
(m)
PontianJ-109R33116138
PontianJ-7R33172216
Kota Tinggi91R43.255971164
Kota TinggiJ-173R33297189
Kota TinggiJ-173R33485575
Kulai JayaJ-8R53.5100144
Kulai JayaJ-8R53.5119150
Table 3. Descriptive statistics of the speed data.
Study
Point
Vehicle ClassMin Speed
(km/h)
Max Speed
(km/h)
Mean
(km/h)
Std Dev
(km/h)
ATMC20.8124.771.5516.28
LV15.6135.273.6315.30
MV16.4105.667.4616.32
HV9.895.265.5713.01
BCMC19.3117.270.4716.12
LV14.6131.772.4815.27
MV15.6136.965.9516.10
HV9.993.460.9212.92
MPMC13.8118.161.9714.06
LV11.3134.765.2815.57
MV11.6127.858.5717.73
HV7.282.451.7812.72
ECMC16.2118.563.0613.87
LV13.9136.066.2215.30
MV14.0131.059.4617.53
HV7.883.152.3912.42
DTMC18.4119.270.3213.43
LV11.5137.172.5714.20
MV24.7134.167.6016.84
HV8.288.159.3013.03
Table 4. Results of the one-way ANOVA test.
Sum of Squares (SS)Degree of Freedom (df)Mean Square (MS)Fp-Value
Study points
AT180,900.487360,300.162250.2880.000
BC202,258.973367,419.658282.7730.000
MP161,943.431353,981.144220.2010.000
EC164,521.22354,841.407231.1490.000
DT112,671.613337,557.204179.2580.000
Direction of travel
AB vs. BA21.48037.16029.1980.000
Time of day
Day vs. Night33.307311.10265.3960.000
Radius of horizontal curve
Radius476.1183158.70639.5670.000
Note. The difference is significant if p-value less than 0.05.
Table 5. Multiple comparison (Tukey post hoc test).
Study Point Vehicle ClassStd Err/SigStd Err/SigStd Err/SigStd Err/Sig
MCLVMVHV
ATMCNA0.29730/0.0000.37611/0.0000.75587/0.000
LV0.29730/0.000NA0.27658/0.0000.71160/0.000
MV0.37611/0.0000.27658/0.000NA0.74796/0.000
HV0.75587/0.0000.71160/0.0000.74796/0.000NA
BCMCNA0.29911/0.0000.37692/0.0000.74790/0.000
LV0.29911/0.000NA0.27579/0.0000.70239/0.000
MV0.37692/0.0000.27579/0.000NA0.73888/0.000
HV0.74790/0.0000.70239/0.0000.73888/0.000NA
MPMCNA0.35570/0.0000.45765/0.0000.96235/0.000
LV0.35570/0.000NA0.33977/0.0000.91221/0.000
MV0.45765/0.0000.33977/0.000NA0.95657/0.000
HV0.96235/0.0000.91221/0.0000.95657/0.000NA
ECMCNA0.33462/0.0000.42500/0.0000.88251/0.000
LV0.33462/0.000NA0.31207/0.0000.83401/0.000
MV0.42500/0.0000.31207/0.000NA0.87420/0.000
HV0.88251/0.0000.83401/0.0000.87420/0.000NA
DTMCNA0.33462/0.0000.42500/0.0000.88251/0.000
LV0.33462/0.000NA0.31207/0.0000.83401/0.000
MV0.42500/0.0000.31207/0.000NA0.87420/0.000
HV0.88251/0.0000.83401/0.0000.87420/0.000NA
Publisher’s Note: MDPI stays neutral with regard to jurisdictional claims in published maps and institutional affiliations.