Article

Corrosion Inhibition of Rumex vesicarius Mediated Chitosan-AgNPs Composite for C1018 CS in CO2-Saturated 3.5% NaCl Medium under Static and Hydrodynamic Conditions

1
Interdisciplinary Research Center for Advanced Materials, King Fahd University of Petroleum and Minerals (KFUPM), Dhahran 31261, Saudi Arabia
2
Department of Bioengineering, King Fahd University of Petroleum and Minerals (KFUPM), Dhahran 31261, Saudi Arabia
*
Author to whom correspondence should be addressed.
Sustainability 2022, 14(23), 16142; https://doi.org/10.3390/su142316142
Submission received: 17 November 2022 / Revised: 21 November 2022 / Accepted: 28 November 2022 / Published: 2 December 2022
(This article belongs to the Section Sustainable Materials)

Abstract

:
Rumex vesicarius (RVE) mediated chitosan–AgNPs composite was produced in situ by using an aqueous extract of Rumex vesicarius leaves as the reducing agent to reduce Ag+ to Ag0. The synthesized composite was evaluated as a sweet (CO2) corrosion inhibitor (CI) for C1018 carbon steel (CS) in 3.5 wt% NaCl solution under static and hydrodynamic conditions. The corrosion inhibitive performance was evaluated using electrochemical impedance spectroscopy (EIS), linear polarization resistance (LPR), and potentiodynamic polarization (PDP) techniques, as well as scanning electron microscopy (SEM)/energy dispersive X-ray spectroscopy (EDAX), and atomic force microscopy (AFM) on corroded C1018 CS without and with additives. The effect of concentration, immersion time, temperature, and rotation speed on the CI performance of the composite was also investigated. The corrosion inhibitive effect increased with increasing composite dosage, with the highest inhibition efficiency (IE) acquired at the maximum composite dosage of 0.3%. Beyond this concentration, the IE decline with increasing concentration. Furthermore, IE was found to increase with immersion time and decline with a temperature rise from 25 to 40 °C, with the optimum temperature of 60 °C found to accelerate corrosion without and with RVE-mediated Chi–AgNPs composite. Under high shear stress, the Chi–AgNPs composite exhibits moderate corrosion inhibition under hydrodynamic conditions. The surface analysis results validate the formation of a protective covering due to composite adsorption on the CS surface. The RVE-mediated chitosan–AgNPs composite could be recommended as a CI for C1018 CS in sweet (CO2) corrosion environments at ambient temperature.

1. Introduction

Internal corrosion of CS oilfield equipment is a major concern because it has the potential to cause disastrous failure. Such deterioration is frequently fueled by CO2 in brine solution (sweet environment), which combines with oil and gas (valuable hydrocarbons) [1,2,3]. This dissolved CO2 causes corrosion by producing a weak acid, namely carbonic acid (H2CO3 (aq)), as follows:
CO2 (aq) + H2O (l) ⇌ H2CO3 (aq) ⇌ HCO3 (aq) + H+ (aq).
The ensuing aqueous phase species largely propel corrosion by providing reagents for the cathodic reaction, i.e., H2 (g) evolution; Fe dissolution takes place at anodic areas. Controlling the pace of this sweet corrosion is critical to preserving the structural integrity of oilfield facilities, and the most preferred option is always the introduction of one or more organic substances to suppress corrosion [4,5,6]. In general, application of CIs can prevent disruptions in production, extend equipment life, help avoid product contamination, and maintain aesthetic appearance.
Hitherto, chromates, phosphates, and nitrites have been frequently used as inhibitors because of their high inhibitory efficacy. They were, however, discovered to be poisonous. Chromates, for example, have been banned for causing cancer [7]. Following this, much emphasis was placed on organic Cis, such as imidazolines, amides, amines, and their derived salts [8,9,10]. However, the majority of historically used CIs are recognized to be hazardous and harmful to the environment. There is a need to reduce the usage of these hazardous substances and to work to protect our environment from its current vulnerable state. As a result, focus has shifted to the development of innovative CIs based on ecological principles. Significant efforts have been made in recent years to investigate the corrosion prevention efficacy of several natural and manmade polymers [11,12]. However, the problems encountered in the use of neat polymers alone, such as moderate corrosion inhibition performance, incapacity to perform well at high temperatures, and low shelf-life, especially for naturally occurring polymers, has necessitated the search for ways to enhance their corrosion inhibition capacity; chief among them is compositing.
Previous investigations explored both synthetic and natural polymer–AgNPs composites as CIs for CS and aluminum in acid environments. In this regard, carboxylmethyl cellulose–AgNPs composite [13], dextran–AgNPs composite [14], chitosan–AgNPs composite [15], gum Arabic–AgNPs composite [16], polypropylene glycol–AgNPs composite [17], and poly (methacrylic acid)–AgNPs composite [18,19] have been investigated and were promising as effective CIs in acid media. Recently, corrosion protection capacity of carboxymethyl cellulose (CMC)–Ni, CMC–Cu, and CMC–Fe nanocomposites for CS in 2 N HCl solution has been reported by Abd El-Lateef et al. [20]. Furthermore, according to John et al. [21], a chitosan–ZnO nanocomposite may provide 73.80% protection to mild steel surfaces in 0.1 N HCl solution, compared to 32.47% protection provided by chitosan alone. It has been reported that an olive leaf extract-mediated chitosan–CuO nanocomposite with different amounts of chitosan (0.5, 1.0, and 2.0 g) was tested as a CI for X60 CS in a 5% HCl solution [22]. It was found that the corrosion protection performance was in the order CHT1.0–CuO (90.35%) > CHT0.5–CuO (90.16%) > CHT2.0–CuO (89.52%) nanocomposite from impedance measurements. An investigation of chitosan–cobalt (chitosan–Co) and chitosan–SnS2 anticorrosion nanocomposites for mild steel in 1 M HCl has been published by Srivastava and co-workers [23]. While in its purest form, chitosan provided 77% protection, and the nanocomposites chitosan–Co or chitosan–SnS2 increased this to more than 95% and 80%, respectively, in terms of protection. Gravimetric and electrochemical methods were used by Fetouh et al. [24] to investigate the chitosan–AgNps CI’s potential in cooling water for mild steel. The gravimetric data showed that a dosage of 150 ppm resulted in an IE of 97–98%. Almond gum (AG)–silver (Ag) nanocomposite (AG-AgNC) was investigated as CI for mild steel in 1 M HCl by Mobin et al. [25]. Results obtained showed that AG-AgNC exhibited an optimum IE of 96.5% at 60 °C at 150 ppm, which is almost double the IE offered by the pristine AG.
From the preceding, it can be seen that the investigations were limited to acid media (HCl and H2SO4), and there is no report to the best of our knowledge on the use of polymer–AgNPs composite to impede the corrosion of low CS in CO2-saturated brine environments. To expand the applicability of polymer–AgNPs in corrosion inhibition, this work was undertaken to evaluate the corrosion inhibition potential of Rumex vesicarius (RVE) mediated chitosan–Ag composite for C1018 CS in CO2-saturated 3.5% NaCl solution under static and hydrodynamic conditions. This study is innovative in comparison to previously described efforts in the literature since it uses a straightforward approach to synthesize the chitosan–Ag composite. Rumex vesicarius leaf extract was used as a reductant, and water was used as a solvent in the synthesis. The merit is that plant extract-assisted synthesis is the quickest, most economical, and most ecologically friendly of all facile synthesis procedures.

2. Experimental

2.1. Materials

The following materials were used: chitosan with a degree of deacetylation of 75–85% and a MW of 50,000–190,000 Da, silver nitrate (AgNO3) (Merck, Rahway, NJ, USA), and acetic acid (CH3COOH) (Merck). They were utilized as received without being subjected to further purification. On the campus of KFUPM, fresh Rumex vesicarius leaf was collected. Here, C1018 CS, which has the following chemical composition—C (0.18), Mn (0.80), S (0.004), P (0.012), Cu (0.14), Si (0.028), Cr (0.05), Mo (0.010), Ni (0.04), Cr (0.05), and Fe (balance) [26]—was employed as the substrate metal.

2.2. Preparation and Characterization of Rumex vesicarius Mediated CHT-Ag Composite

Using an in situ method, a chitosan–AgNPs composite was created using Rumex vesicarius as a mediator. Reducing agent was an aqueous extract of Rumex vesicarius leaves, and AgNO3 was utilized as a precursor to silver nanoparticles. This chitosan–Ag composite was prepared and characterized using Rumex vesicarius as the mediating agent, and the specifics can be found in our previous paper [27]. The initial step was to combine 2.0 g of chitosan with 100 mL of 1% CH3COOH solution, which was then agitated. Secondly, 0.02 g (1 mM equivalent) of AgNO3 was added to the previously prepared polymer solution. The chitosan AgNO3 solution was stirred for 3 h at 150 rpm. The third step was to combine 5 mL of Rumex vesicarius extract with the chitosan and AgNO3. Afterwards, the Rumex vesicarius extract, chitosan, and AgNO3 solution was left at room temperature with constant agitation for 24 h. Gradual colour changes, validated by UV–Vis measurement, confirmed the formation of the chitosan–AgNPs composite [27].

2.3. Corrosion Inhibition Studies

For the static sweet corrosion tests, C1018 CS cylindrical coupons with an exposed surface area of 5.23 cm2 were used. Hydrodynamic testing was carried out by utilizing rotating cylinder electrode (RCE) coupons having a combined exposed surface area of 3.14 cm2. The C1018 steel samples (in both conditions) were abraded with successive SiC abrasive papers of different grit sizes down to #800 grit size. They underwent a comprehensive cleaning process using distilled water, followed by ethanol-based degreasing, acetone-based rinsing, and warm air drying. The test solution was 3.5% NaCl saturated with CO2 under 1 atm of pressure at 25 °C. Rumex vesicarius mediated chitosan–AgNPs composite was deployed as the CI in the dosage range of 0.1–1.0%.
A VERSASTAT 3 (Princeton Applied Research, Oak Ridge, TN, USA) and the ZSimpWin data analysis software package were used for all electrochemical measurements. The setup for the electrochemical corrosion measurements included a corrosion cell with a 250 mL capacity, compartments for a reference electrode made of Ag/AgCl (3M KCl), a counter electrode made of graphite rods, a purge gas tube for CO2, and a working electrode made of a cylindrical C1018 carbon steel coupon. A PARSTAT speed rotator was connected to the working electrode (model RDE 616B Rotating Electrode). Rotation speed was adjusted for the hydrodynamic experiment to be between 0 and 2000 rpm. In order to saturate the brine solution and maintain a working pH of 3.83, the test solution was bubbled for 1 h with CO2 gas under 1 atm partial pressure before installing the working electrode. As soon as the working electrode was installed, the CI was swiftly added to the brine solution, and CO2 gas was constantly bubbled for the whole of the experiment. The working electrode was treated to 1 h of free corrosion before the electrochemical tests in order to achieve a consistent open circuit potential (OCP). With a voltage amplitude of 10 mV, EIS was performed in the frequency range of 100 kHz to 0.1 Hz. Using a scan rate of 0.125 mV/s, LPR measurements were made within ±15 mV of the OCP value. By using a scan rate of 0.5 mV/s and a potential range of ±250 mV with respect to the OCP, the PDP measurement was recorded. For the corrosion testing in the absence and presence of the composite under static conditions, the influence of immersion time (1, 6, 12, and 24 h) and temperature (25, 40 and 60 °C) was also explored.

2.4. Surface Analysis

After 24 h of immersion in static conditions, the morphology of the corroded steel surface in the absence and presence of 0.3% of the composite was acquired with a SEM JEOL JSM-6610 LV (Tokyo, Japan) using an accelerated voltage of 20 kV and an irradiation current of 10 μA. The surface properties of the C1018 CS specimen following corrosion in CO2-saturated 3.5% NaCl solution devoid of and with 0.3% RVE-mediated chitosan–AgNPs composite was further examined using an atomic force microscope (N9498S, Agilent Technologies, Wokingham, UK). At ambient temperatures, the AFM instrument was used in contact mode.

3. Results and Discussion

3.1. Corrosion under Static Conditions

3.1.1. Open Circuit Potential

Figure 1 depicts the change in C1018 CS potential with time during the attainment of an open circuit potential (OCP) in a CO2-saturated 3.5% NaCl solution devoid of and with different dosages of RVE-mediated Chi–AgNPs composite used as a CI. In the presence of the composite as the CI, the C1018 CS exhibits more positive OCP values than the blank solution. This indicates that the composite reduces the steel’s proclivity to become dissoluble in corrosive brine solution. The graphs show that the steel sample could reach a quasi-stable OCP in 1 h immersion time. As a result, all electrochemical measurements in this study were preceded by a 1 h OCP measurement.

3.1.2. Effect of Concentration

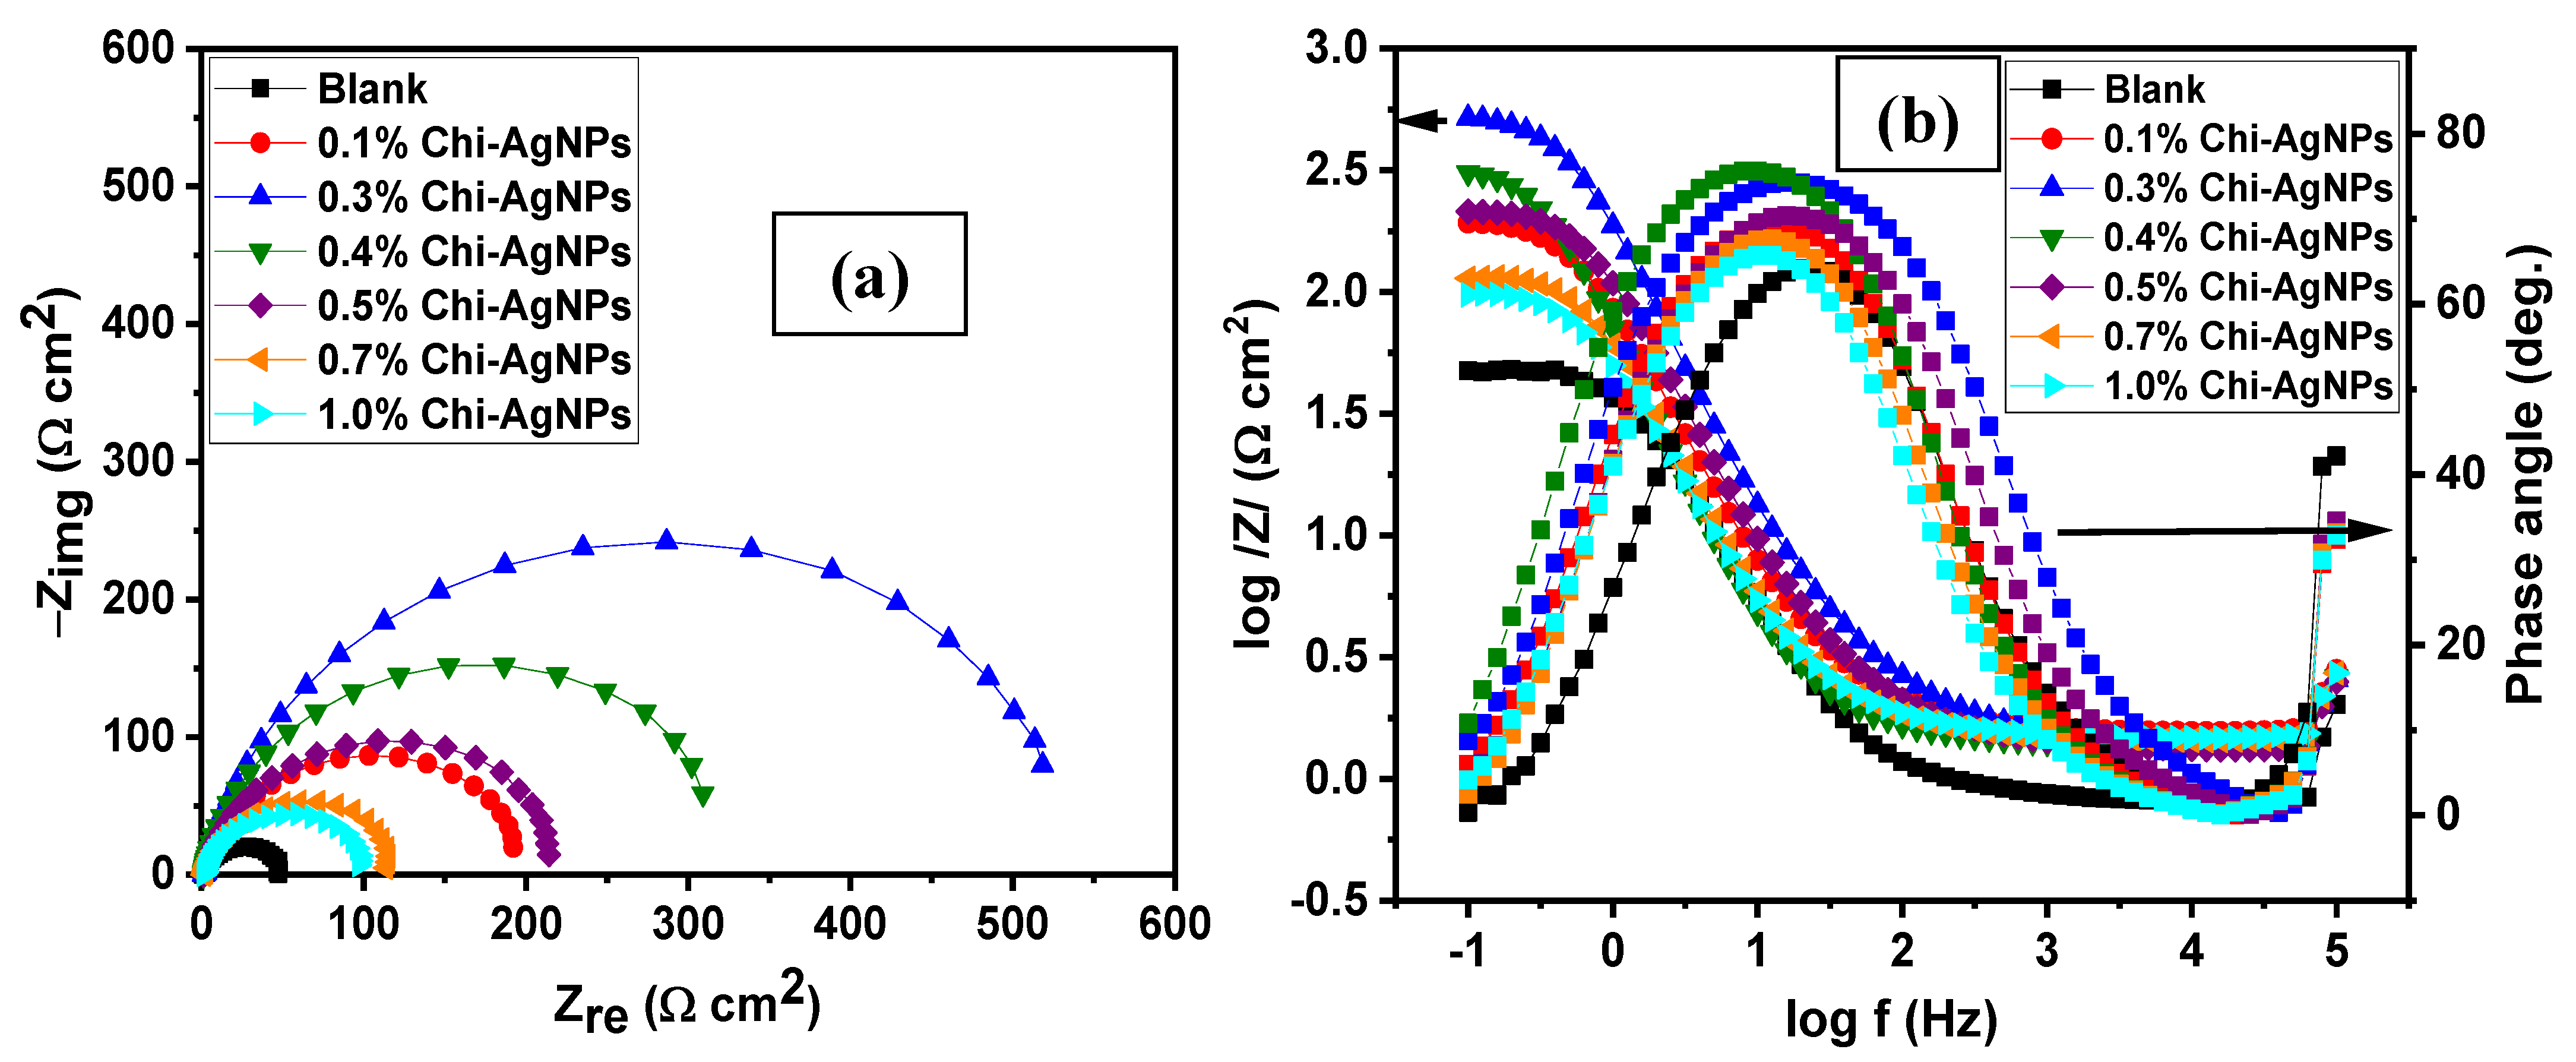
The impedance spectra measured at different concentrations of RVE-mediated Chi–AgNPs composite are presented as Nyquist plots in Figure 2a and in Bode formats in Figure 2b. The Nyquist plots, in Figure 2a, are depressed semi-circles both in the unrestrained and inhibited solutions. The explanation for the relative distortions of the semi-circles could be ascribed to the unevenness of the metal surface, and this phenomenon has been widely expatiated elsewhere [28]. The introduction of the composite as a CI enlarges the size of the semicircle relative to the blank solution, and the increase is more remarkable with the composite dosage of 0.3%. Beyond this concentration, a progressive decrease in the diameter of the semicircle from 0.4% to 1.0% composite concentration is observed. The commensurate Bode plots, Figure 2b, show absolute impedance values which also rise in magnitude as a consequence of the introduction of the inhibitor. The magnitude of the impedance is noted to upsurge from 0.1% to 0.3%, but progressively declined with increase in the dosage of the composite from 0.4% to 1.0%. The increase in the diameter of capacitive loop is due to the increase in the corrosion resistance property of C1080 CS in the presence of an inhibitor, which is related to the adsorption of the inhibitor molecule on the CS surface.
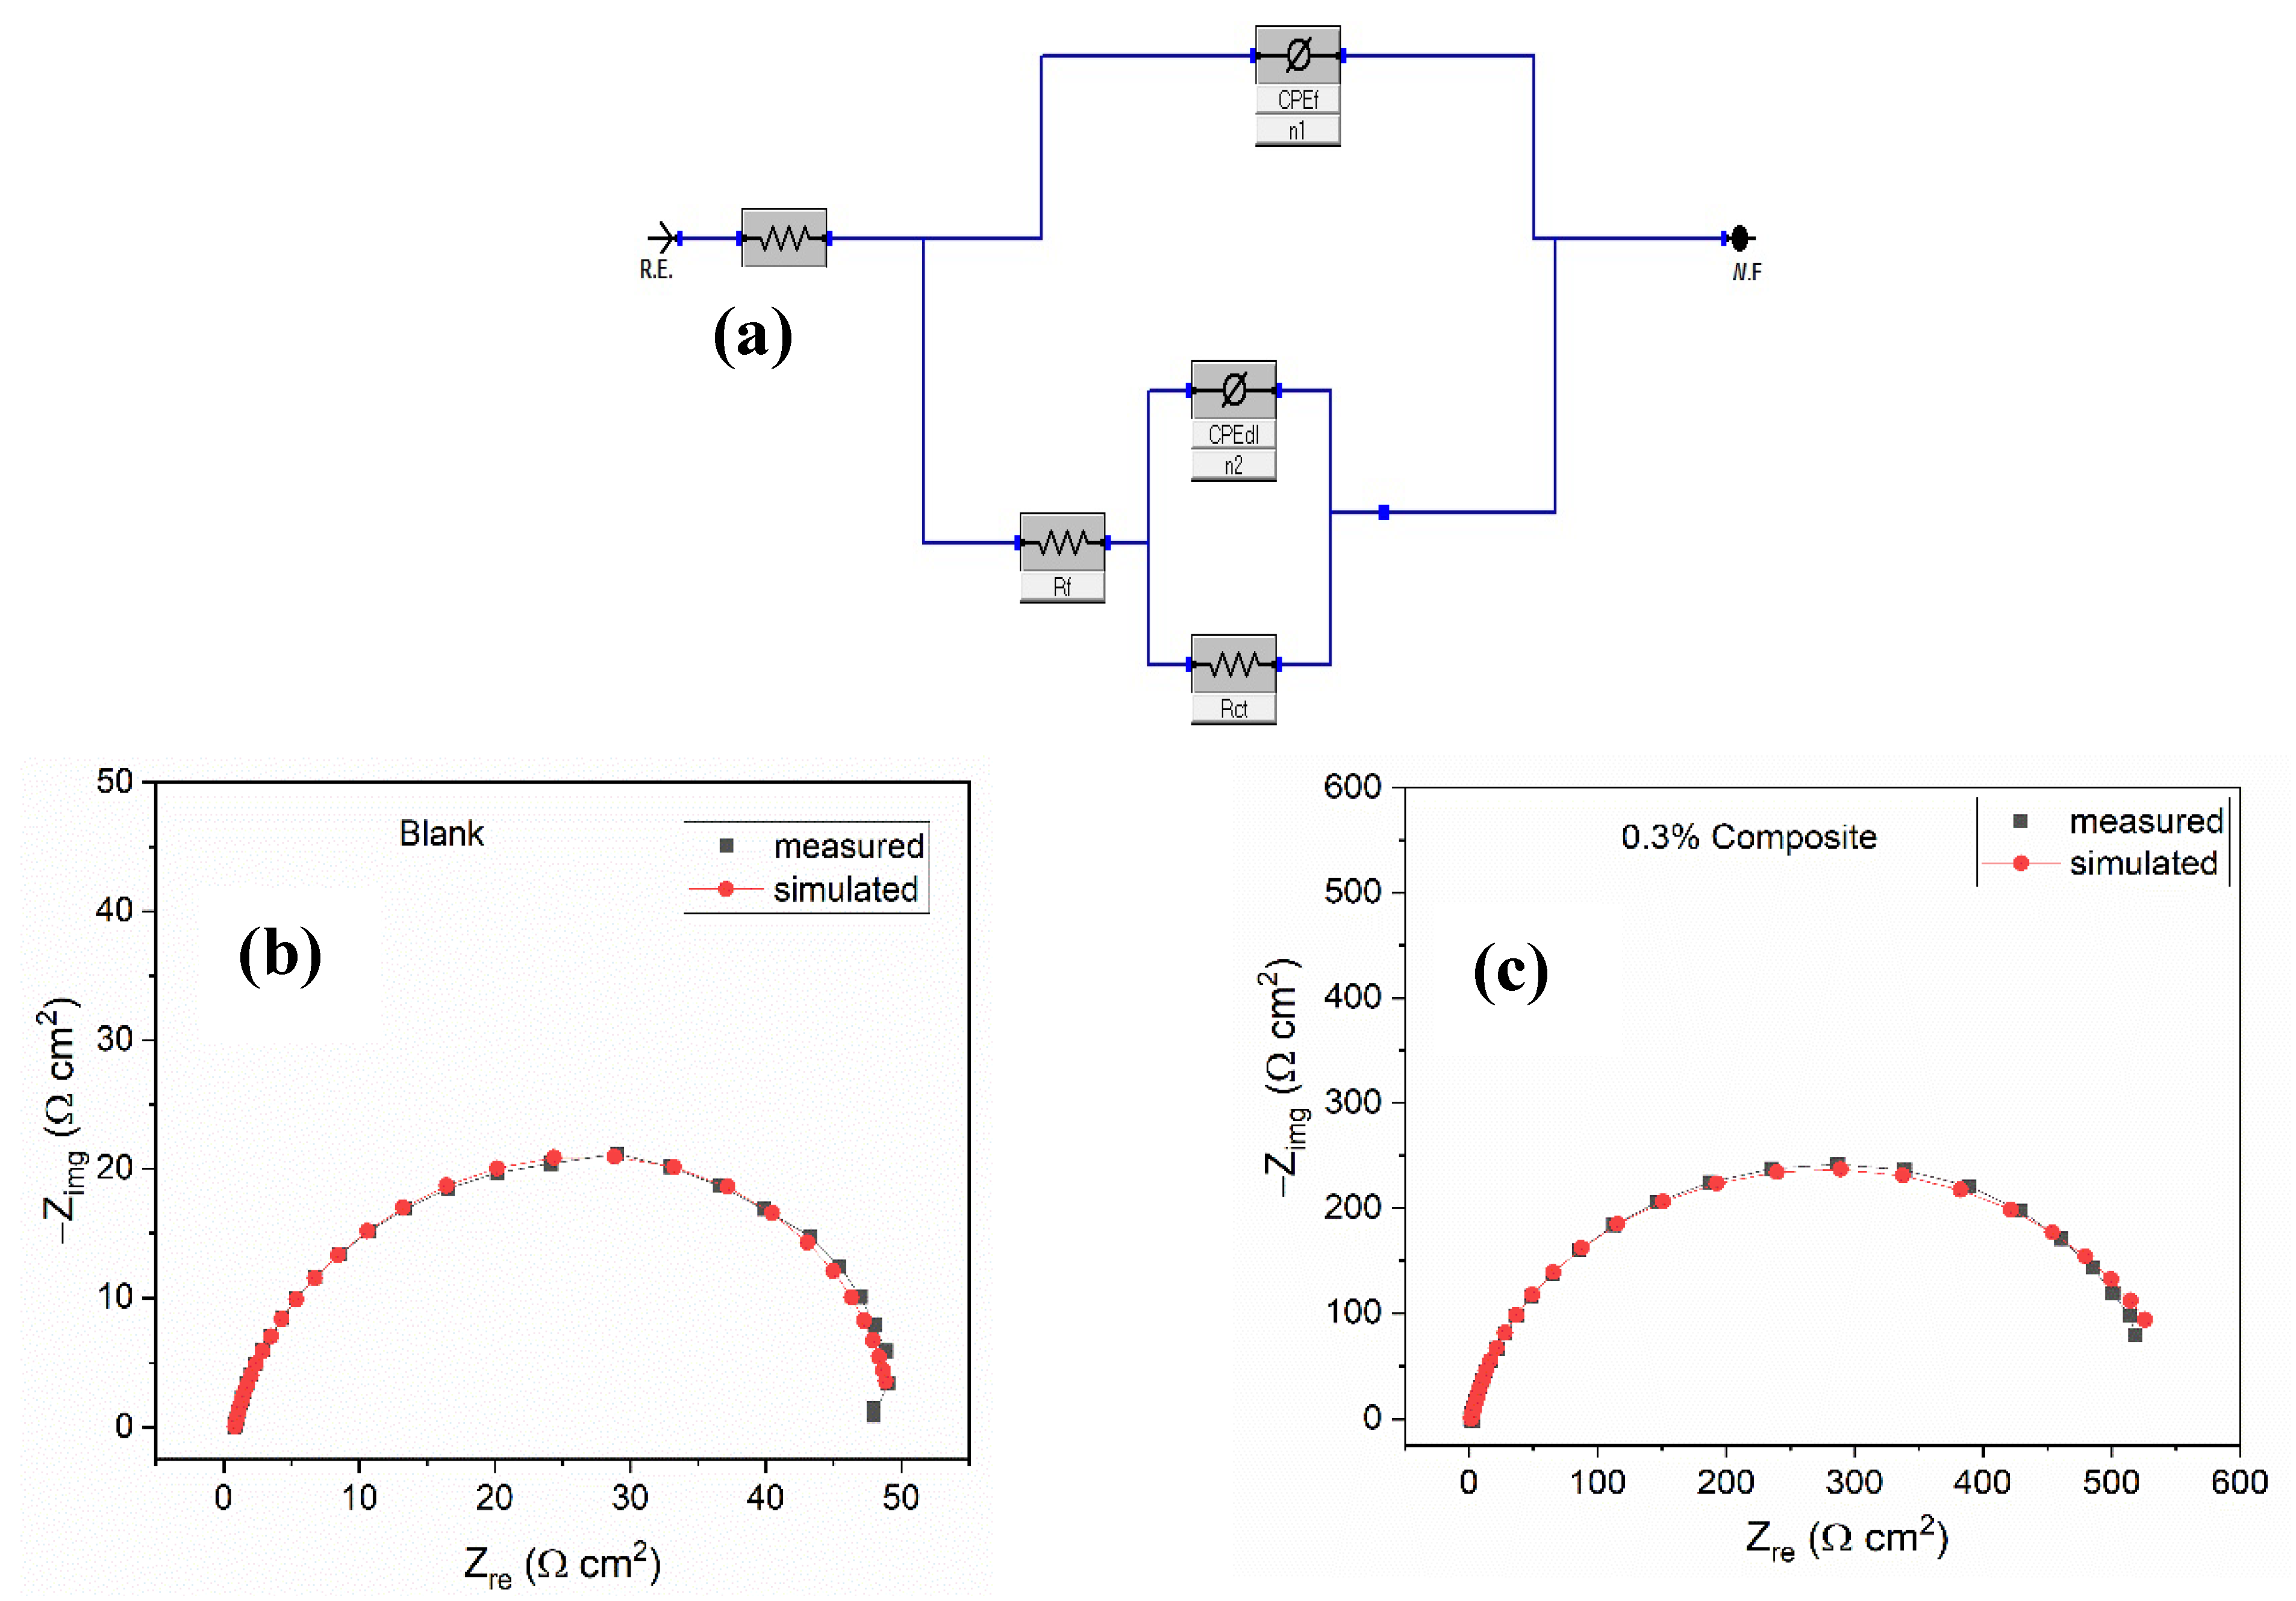
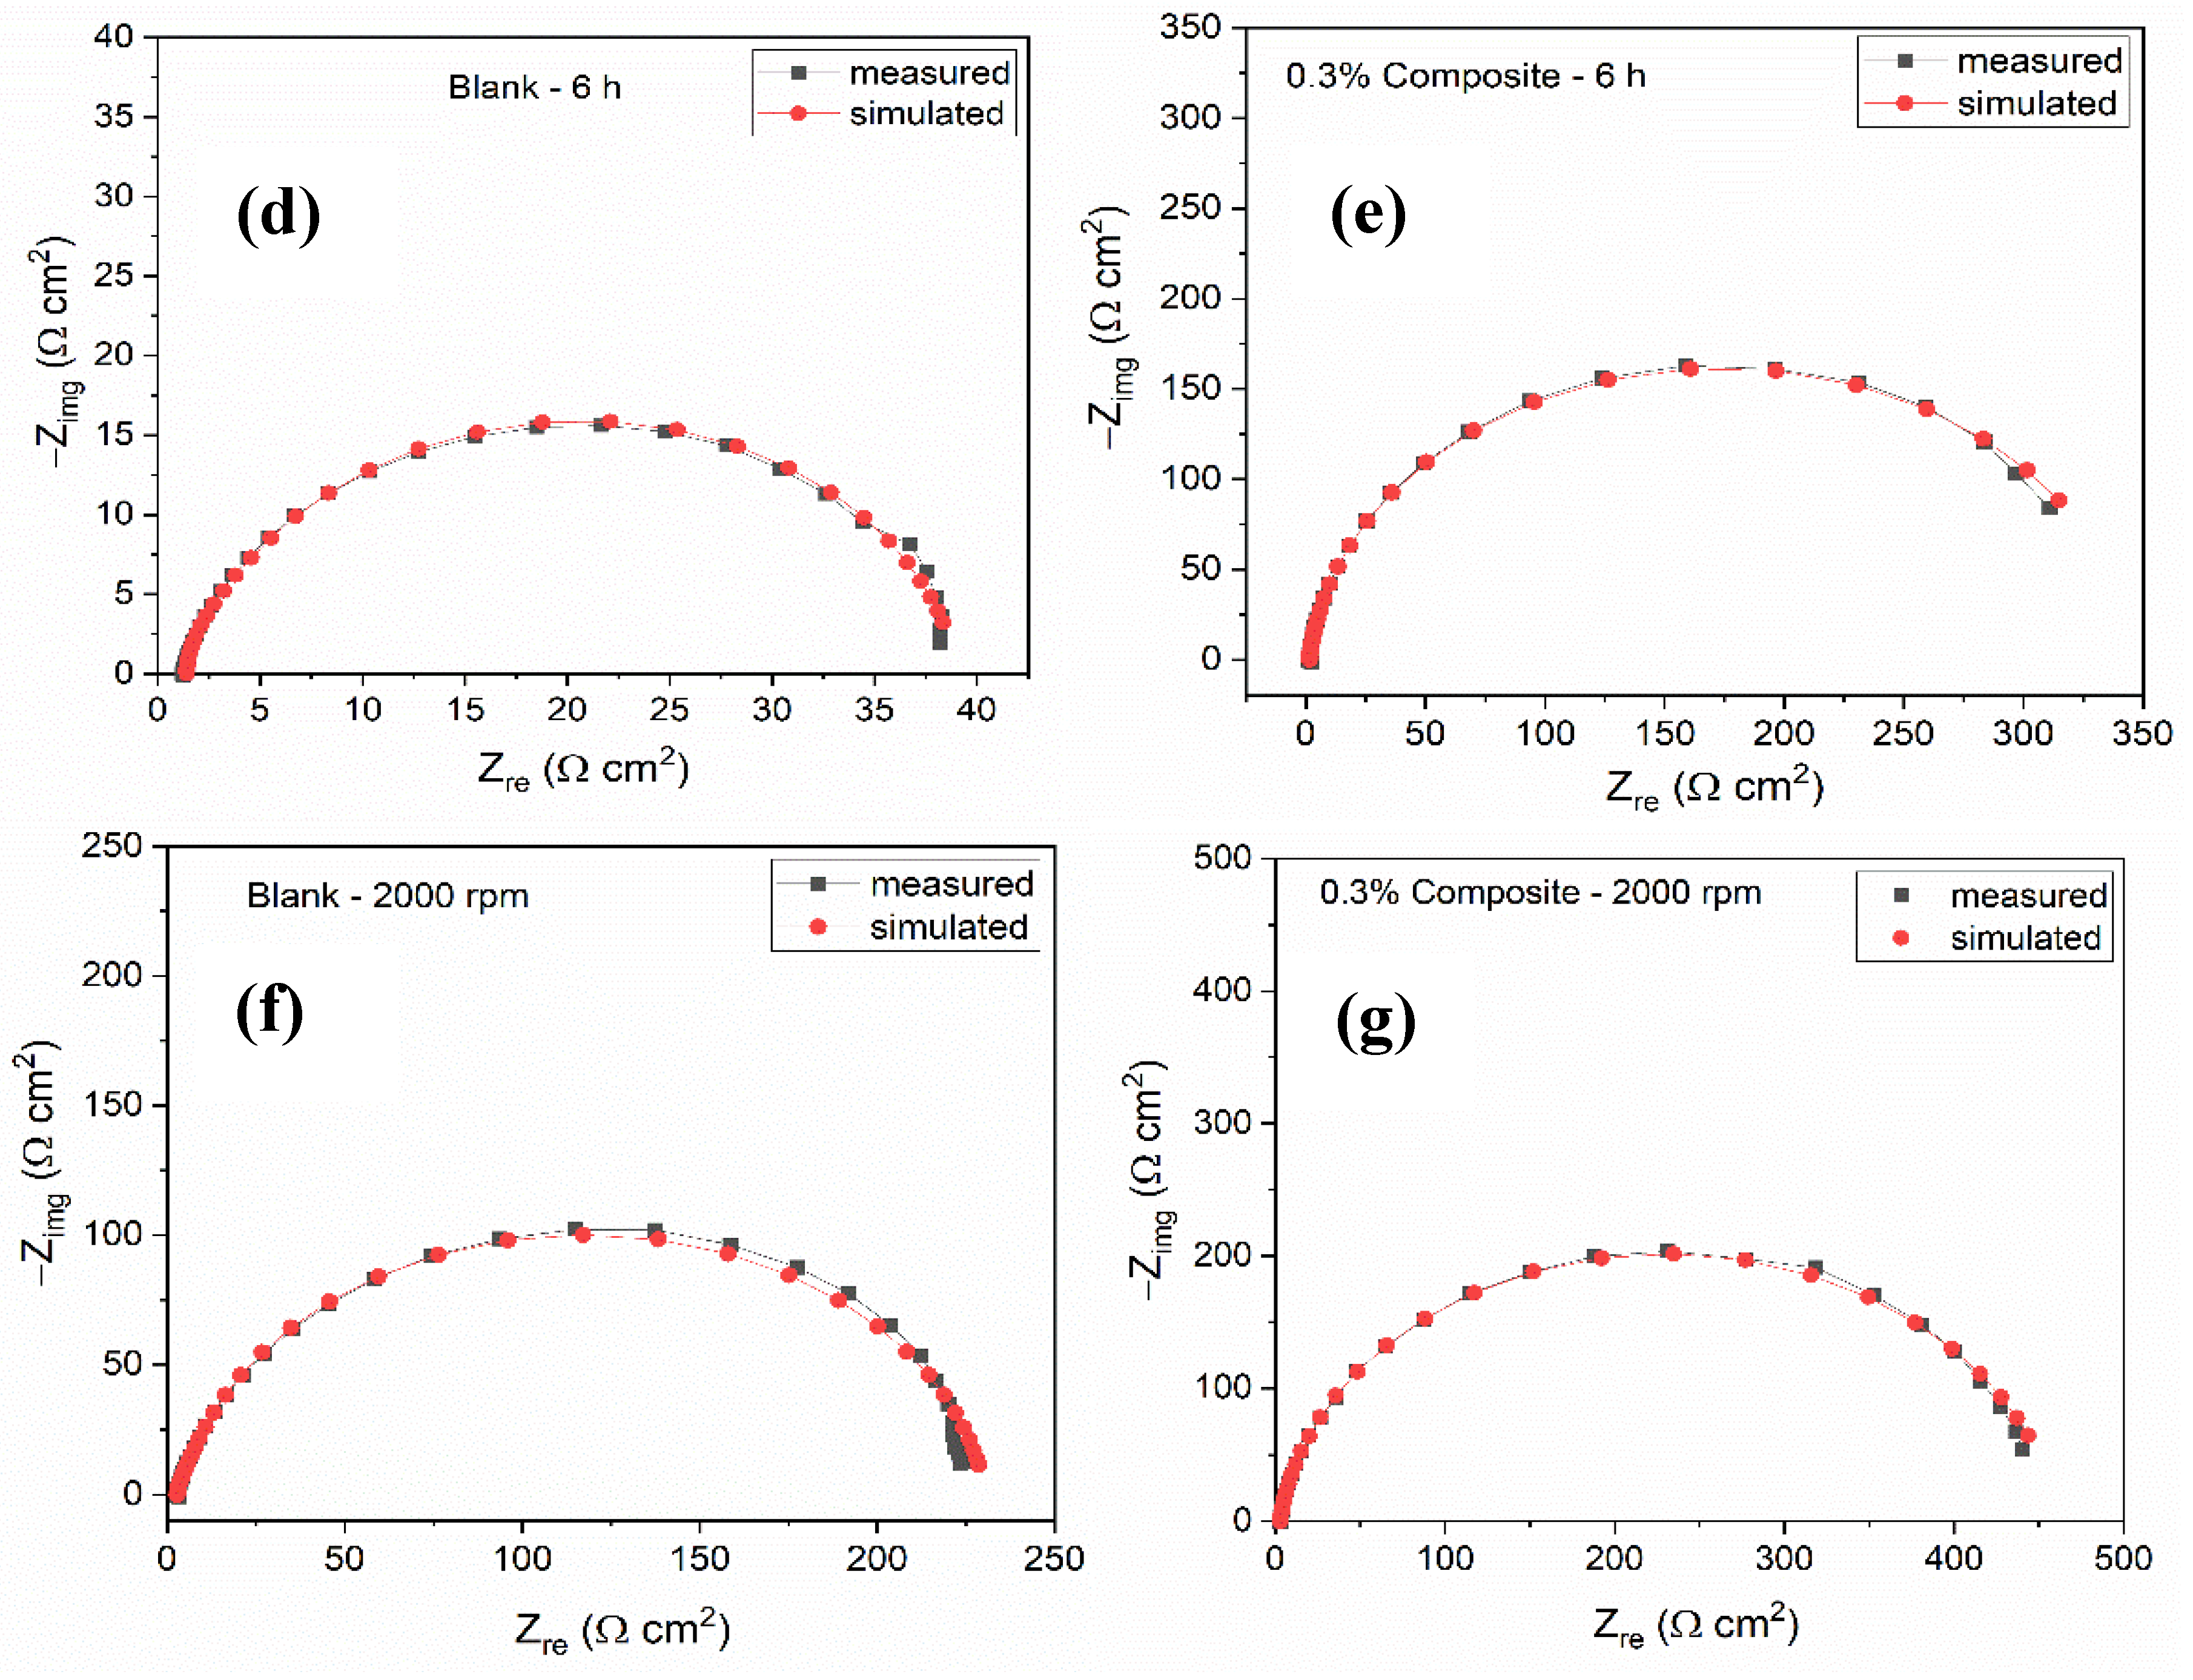
The importance of the differences in impedance characteristics that result from each response that is determined from the EIS spectra can be better understood with the use of equivalent circuit models. The equivalent circuit model utilized in fitting experimental data for the inhibiting system (Figure 3a) is comprised of Rf and CPEf in parallel, representing the adsorbed species forming films on the surface of C1018 steel in the solution of the electrolyte with resistance (Rs); the charge transfer resistance (Rct) and its double layer constant phase element component (CPEdl) in parallel to the first set of components. The formula for calculating the polarization resistance, denoted by the symbol Rp, for a circuit equivalent to this nature is Rp = Rf + Rct [29]. The simulated and experimentally generated impedance graphs for C1018 CS in CO2-saturated 3.5% NaCl solution devoid of and with 0.3% composite concentration at varied experimental conditions (concentration, immersion time, and rotating speed) are depicted in Figure 3b–g. For all experimental results, this model offered the best fit. It is clear from looking at the picture that the impedance plot that was seen coincides with the one that was estimated using the equivalent circuits that are presented in Figure 3a. Because of the non-uniform nature of the working electrode surface, the CPE is employed in place of a capacitor to compensate for the departures from perfect dielectric behaviour that are caused by the working electrode surface. The following expression describes the impedance of the CPE [30]:
Z CPE = Y 1 jw n
where Y is the CPE constant and n the CPE exponent; j = (−1)½, which is an imaginary number, and ω is the angular frequency in rad/s (ω = 2πf), where f is the frequency in Hz. The CPE can be a resistance, capacitance, Warburg impedance, or inductance if n is equal to 0, 1, 0.5, or −1, respectively.
Table 1 contains a listing of the electrochemical parameters that can be retrieved from the fittings. According to the electrochemical data that was compiled, it was discovered that the concentration of the inhibitor had to be at least 0.3% for there to be an increase in the values of Rp that were measured at the electrode/electrolyte interface. On the other hand, the steady decline in Rp values that occurred with increasing concentrations of the composite, with the lowest values being achieved at 1% concentration of the composite, suggests that the adsorbed film at the electrode surface has reached saturation. At this dosage, the adsorbed species must have saturated the electrode surface, which resulted in the electrode being porous as a result of the continuous corrosive attack caused by the presence of CO2 gas. Once again, the confirmation of corrosion inhibition is provided by an Increase in the values of Rp with increasing concentrations of the inhibitors. Inhibition efficiency was derived from the EIS technique by comparing the Rp values in the unrestrained and restrained solutions, utilizing the following expression:
IE = 1 R p 0 R p × 100
where R p 0 represents the polarization resistance in the unrestrained solution, and Rp represents the polarization resistance in the restrained solution. The results obtained are also listed in Table 1. It is noted from the table that the IE is influenced by the concentration of RVE-mediated Chi–AgNPs composite. It is found to increase with rising inhibitor dosage, reaching a peak value of 92.67% at the composite concentration of 0.3%. Further increases in concentration reveals a gradual decline in IE, with the optimum studied concentration (1.0%) giving the lowest IE of 52.58%.
The following relationships, shown in Equation (4), can be used to correlate Cdl with the fit parameters (Yo and n) in the definition of the impedance Z of a CPE, as in Equation (2), when Cdl is considered as a surface distributed parameter [31]. The calculated values of Cdl are listed in Table 1. Equation (4) is as follows:
C dl = Y dl 1 / n dl 1 R s + 1 R p ( n dl 1 / n dl )
When compared to the blank in Table 1, it noted that the C1018 CS sample demonstrates extremely low values of Cdl when the RVE-mediated Chi–AgNPs composite is present. This suggests that the interaction between the steel substrate and the CO2-saturated brine solution is drastically reduced as a result of the CI’s adsorption. The decrease in Cdl value can be ascribed to a decline in the local dielectric constant and/or a rise in the thickness of the electrical double layer. This suggests that the inhibitor molecules function via adsorption at the metal/solution interface as a result of the inhibitor molecules replacing water molecules. Alternatively, the increase in thickness of the electrical double layer can be attributed to a decrease in the local dielectric constant. This fits in with the Helmholtz model, given as follows in Equation (5):
C dl = ε 0 ε d S
where ε0 is the permittivity of air, ε is the local dielectric constant, d is the film thickness, and S is the electrode surface area.
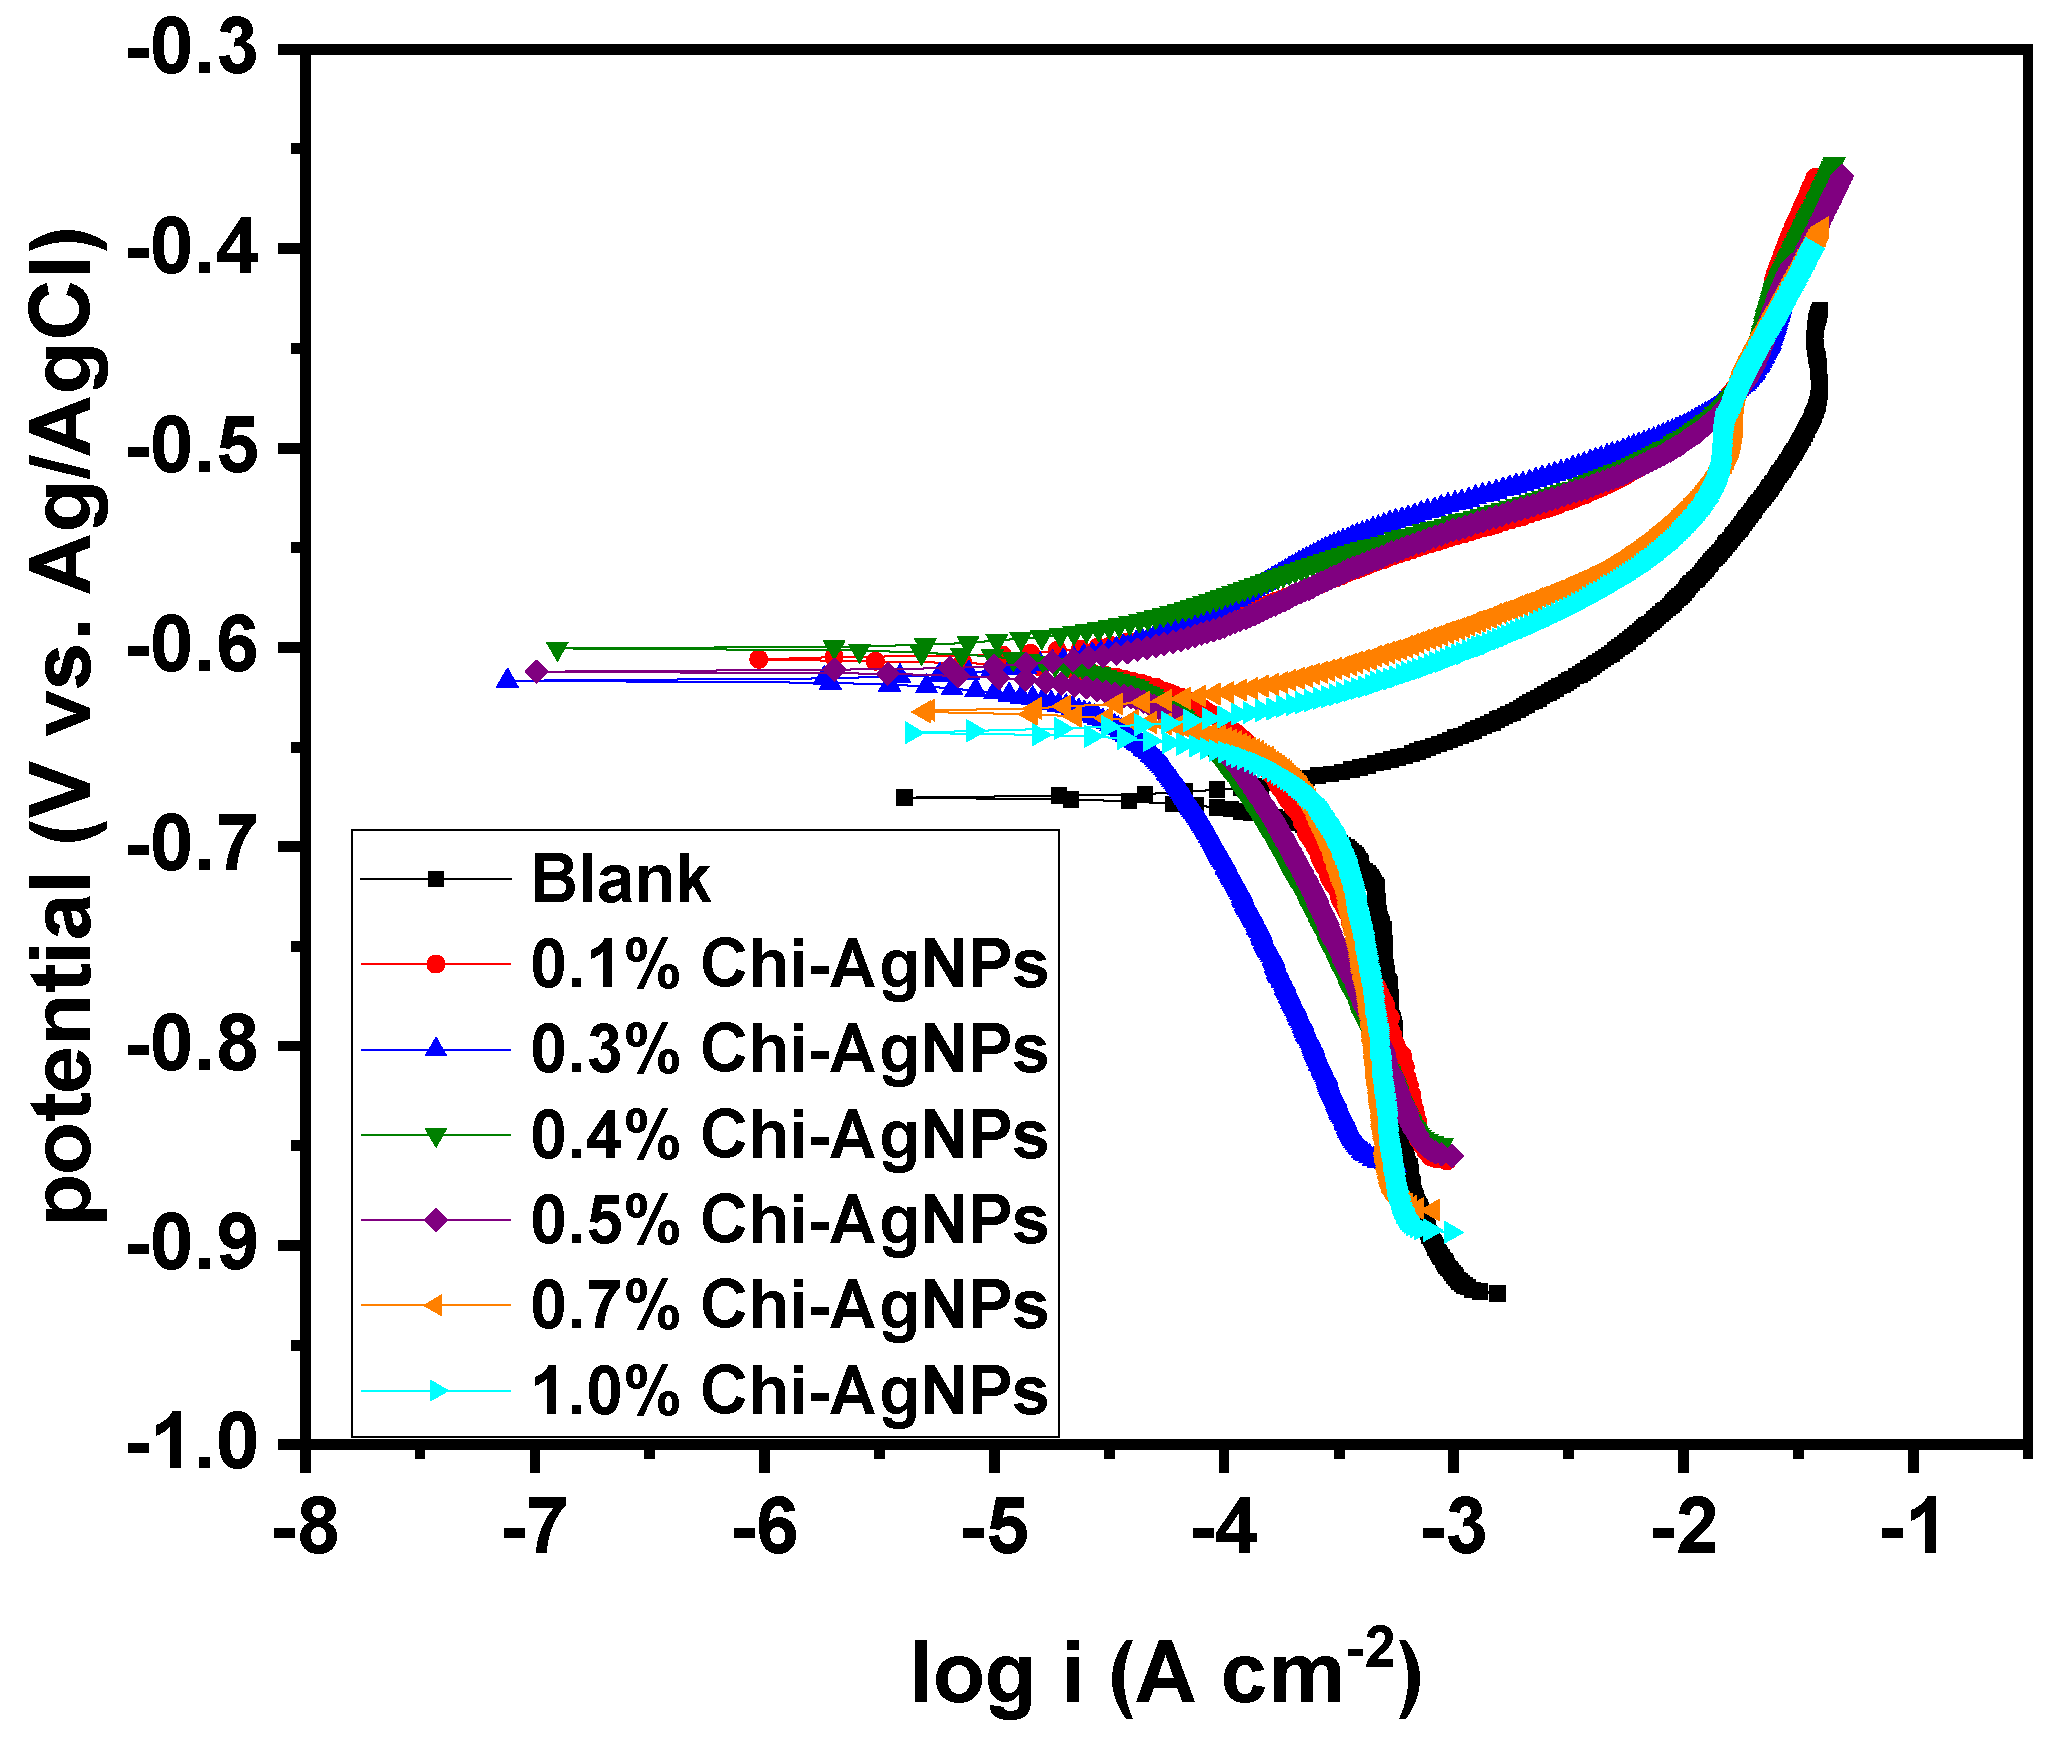
Potentiodynamic polarization curves for C1018 CS, in the blank and in the presence of various dosages of RVE-mediated Chi–AgNPs composite in CO2-saturated 3.5% NaCl solution under static conditions, are shown in Figure 4. Inspection of Figure 4 shows that the icorr of the anodic and cathodic branches are activation-controlled and diffusion controlled, respectively. As can be seen, the anodic icorr of inhibited solutions which are independent of the composite dosage are lower than the uninhibited solution, particularly below the desorption potential. In cathodic branches, the current densities decrease when increasing the composite concentration, which is more pronounced at the composite concentration of 0.3%. It is also noted that the corrosion potential shifts towards the positive values in the presence of the different concentrations of the composite in comparison to the blank. The corrosion parameters extracted from polarization curves including icorr, Ecorr, and βa are presented in Table 2. In comparison to the unrestrained solution, the values of icorr declined with the dosage of the composite; the 0.3% dosage of the composite inhibitor had the lowest value (implying that it was the most protective) for C1018 CS in CO2-saturated 3.5% solution. Above this optimum dosage, the values of icorr are noted to rise with the increase in the composite dosage, with the highest value noted for 1% composite dosage. This affirmation is also reflected in the IE values, which increased from 81.16% to 90.42% when the concentration was raised from 0.1 % to 0.3%. Thereafter, the IE declined gradually with the increase in dosage, with the lowest value of 16.75% obtained at 1% composite dosage. The IE was computed by comparing the icorr in the absence of the CI with that in the presence of the CI, using a previously reported formula [32].
To further study the corrosion inhibition of C1018 CS in CO2-saturated 3.5% NaCl solution by RVE-mediated Chi–AgNPs composite, a linear polarization resistance (LPR) technique was deployed. The results obtained are displayed in Table 2. From the table, it is seen that polarization resistance increased from 54.46 Ω cm2 in the uninhibited solution to 219.97 Ω cm2 on the introduction of 0.1% composite to the corrosive medium, corresponding to an IE of 75.24%. This observation further confirms the inhibiting effect of RVE-mediated Chi–AgNPs composite occasioned by its adsorption on the metal surface [27]. However, as noted in the results from other techniques (Table 1 and Table 2), the inhibiting ability of the RVE-mediated Chi–AgNPs composite is a function of concentration. As could be seen in Table 2, a further increase in the composite concentration to 0.3% resulted in an increase in polarization resistance (573.97 Ω cm2) and inhibition efficiency (90.51%). Beyond the concentration of 0.3%, a gradual decrease in Rp and a corresponding decrease in IE with increasing composite concentration can be clearly observed, which again could be due to the saturation of the system. The results obtained from the LPR technique are consistent with results from other electrochemical methods (Table 1, Table 2 and Table 3).

3.1.3. Effect of Immersion Time

The results from the applied techniques (Table 1, Table 2 and Table 3) established that the 0.3% concentration of the composite is the optimum concentration and provided the highest corrosion protection to C1018 CS in CO2-saturated 3.5% NaCl solution under static conditions. In an effort to assess the impact of immersion time on the composite’s ability to suppress corrosion, this concentration was used. A steady-state situation should be reached during immersion time in order to determine the inhibitor’s genuine behaviour after lengthy exposure to the CO2 corrosion medium. In this regard, the corrosion behaviour of C1018 CS in the CO2 corrosion solution without and with 0.3% composite after 1, 6, 12, and 24 h of immersion was investigated using electrochemical methods.
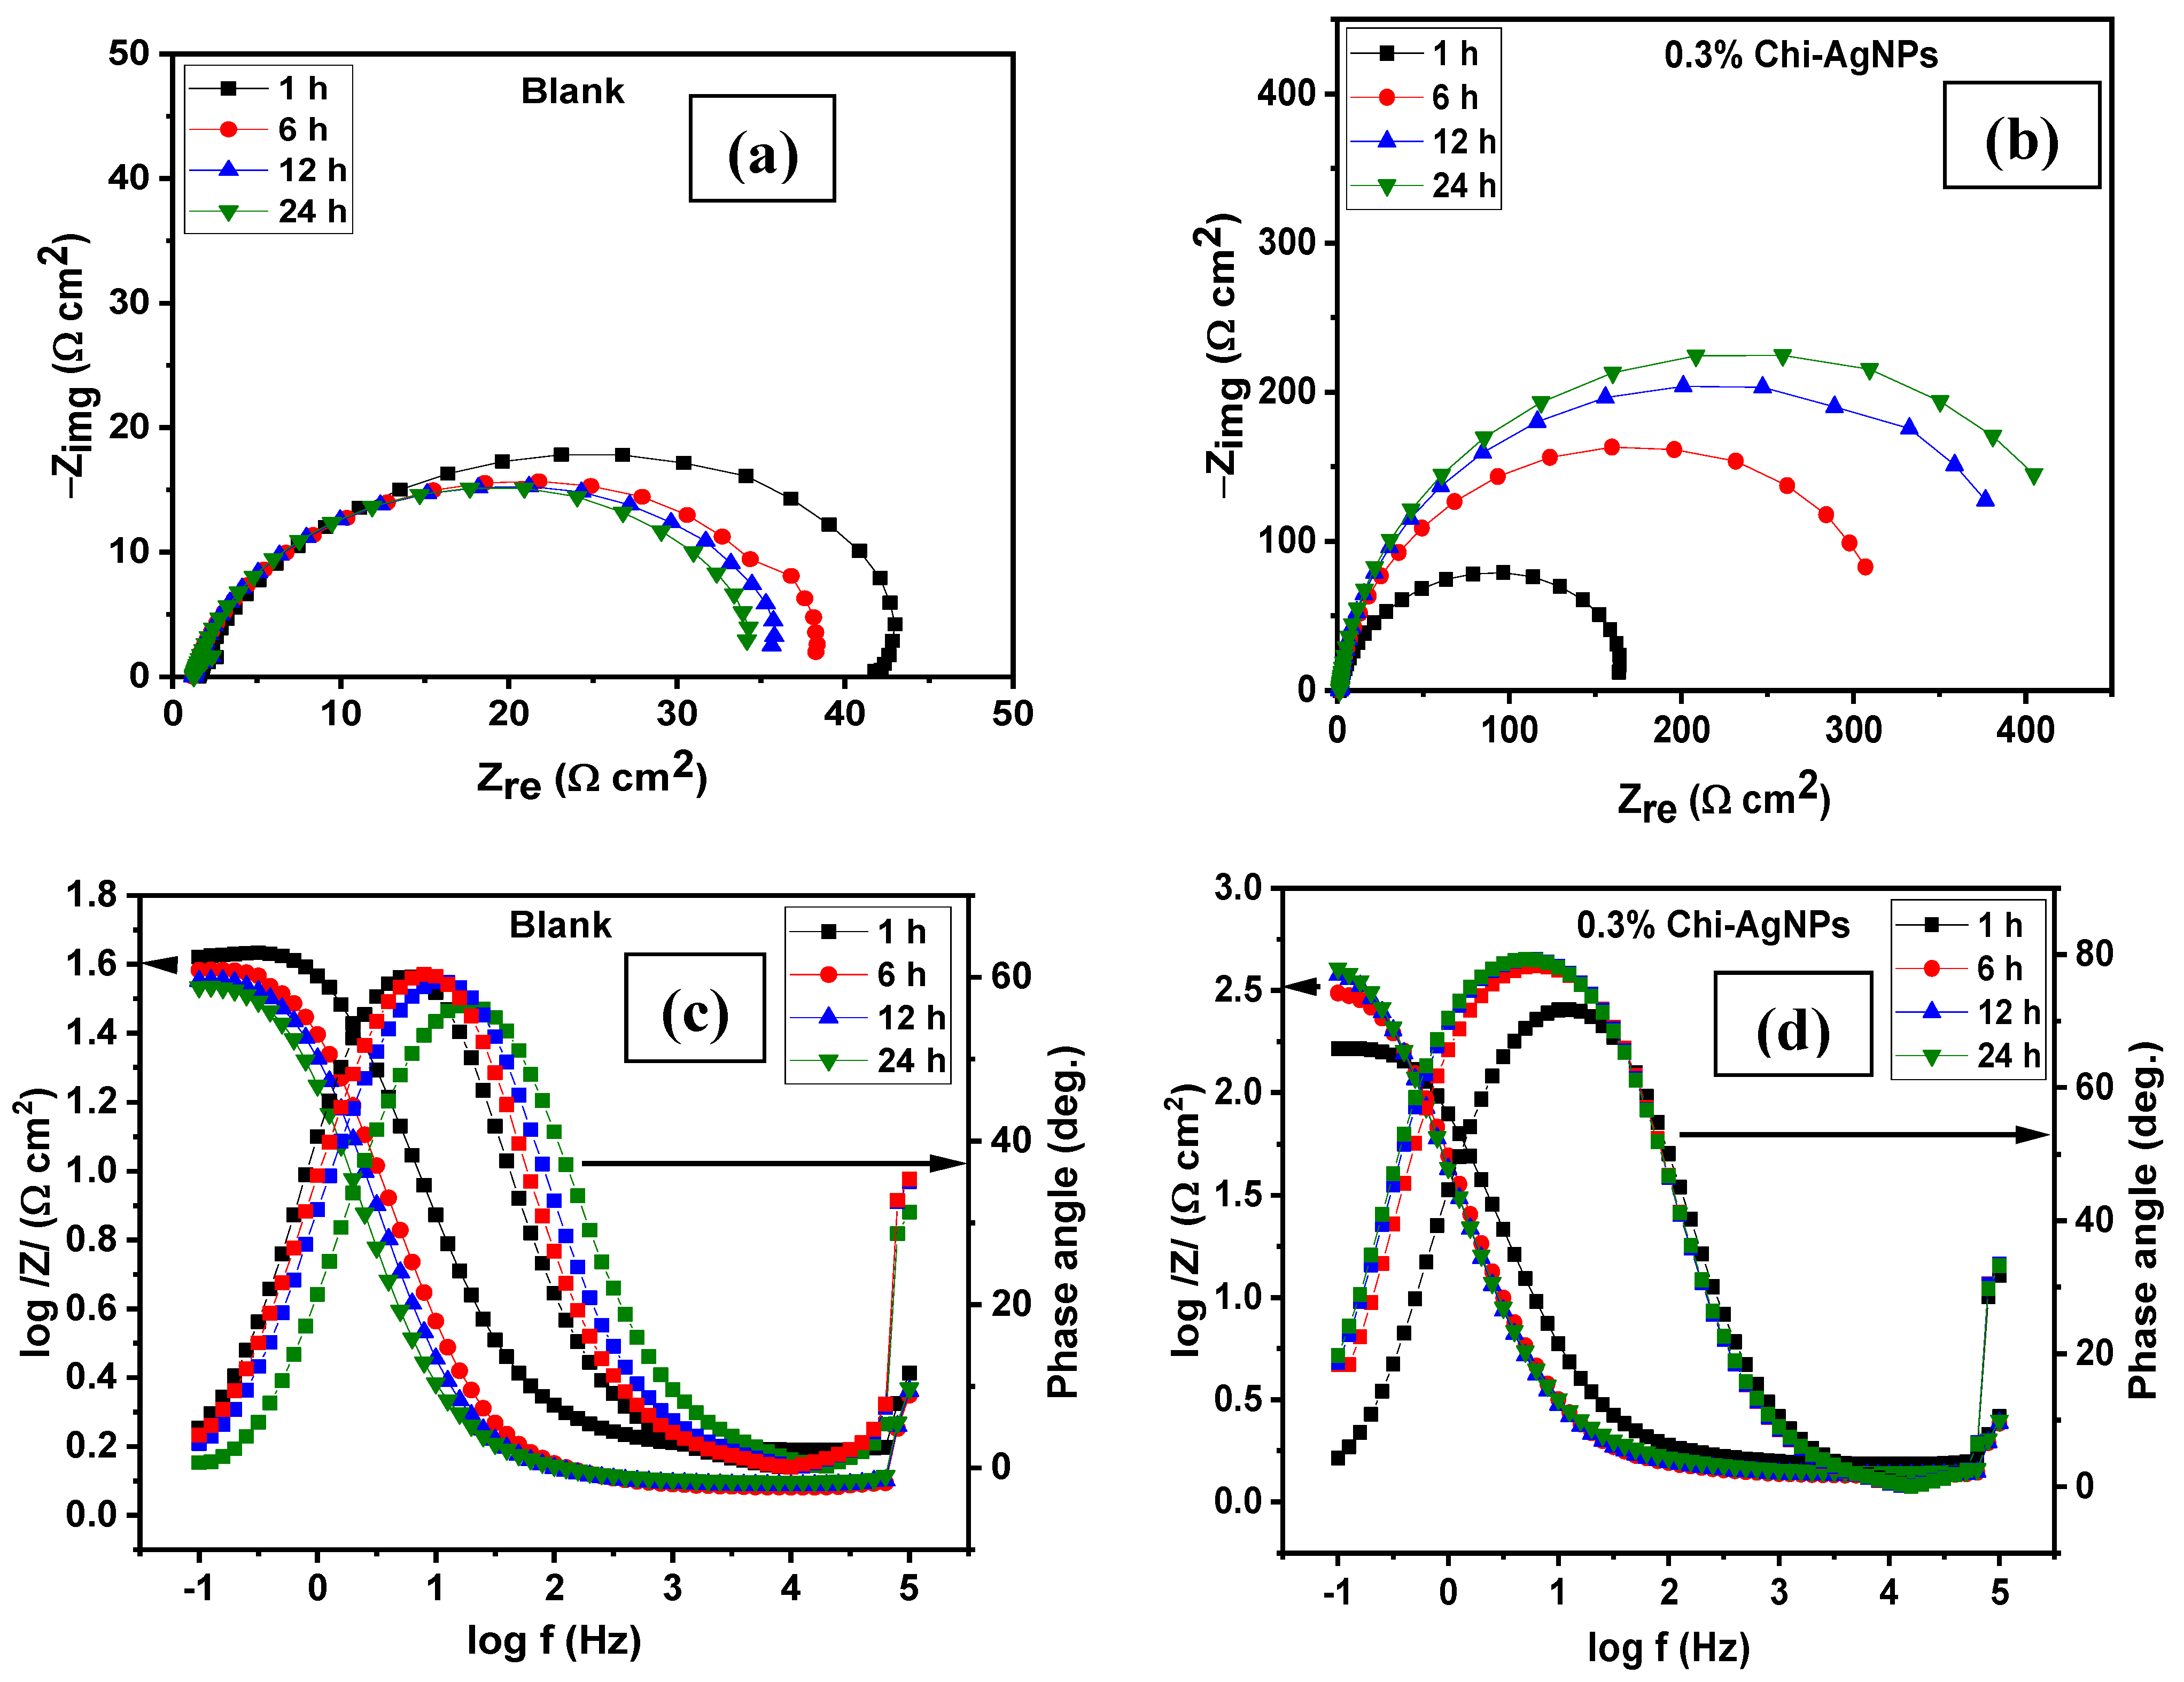
The typical Nyquist plots for C1018 steel in CO2-saturated 3.5% NaCl solution without and in solution containing 0.3% RVE-mediated Chi–AgNPs composite at varying immersion times at 25 °C are depicted in Figure 5a,b, respectively. Similar plots in Bode representation are given in Figure 5c,d respectively. Examination of Figure 5a reveals that in the uninhibited solution, there is a progressive decrease in the diameter of the Nyquist curves with the increasing immersion time from 1 to 24 h. The phase angle maximum and absolute impedance in the corresponding Bode plots (Figure 5c) are lowered as well, and the phase angle moves to the low-frequency zone. A similar observation was reported by Obot et al. [32]. The authors explained that, the longer the exposure duration, the weaker the interfacial interaction between the adsorbed Fe-CO2(ads) species and the steel surface resulting in the detachment or thin out of the adsorbed species and the exposure of the active sites on the steel surface for corrosion assault. On the other hand, as shown in Figure 5b, C1018 steel is much better protected from CO2 corrosion in a saline solution with 0.3% Chi–AgNPs composite when immersed for longer periods of time. When compared to the observation made after 1 h of immersion, the size of the Nyquist loop grows steadily up to 24 h. The phase angle maxima and absolute Bode modulus rise considerably with increasing immersion in the corresponding Bode graphs.
Presented in Table 3 are the EIS parameters for C1018 CS after prolonged corrosion in a CO2-saturated 3.5% NaCl solution devoid of and with 0.3% RVE-mediated Chi–AgNPs composite. The values of Rct and Rp progressively increase with increasing immersion time, with the highest value obtained at 24 h, indicating that the composite’s inhibitive property improves over time. The increase in Rp is accompanied by an increase in IE, with values of 72.23, 88.99, 91.22, and 92.67% obtained after 1, 6, 12, and 24 h of immersion, respectively. Furthermore, the Cdl values increase with increase in immersion time in the absence of the composite as the CI. However, regardless of the length of immersion, the Cdl values are decreased in the presence of the composite, suggesting that enormous surface coverage by the CI improves the hydrophobicity of the steel surface [33,34].
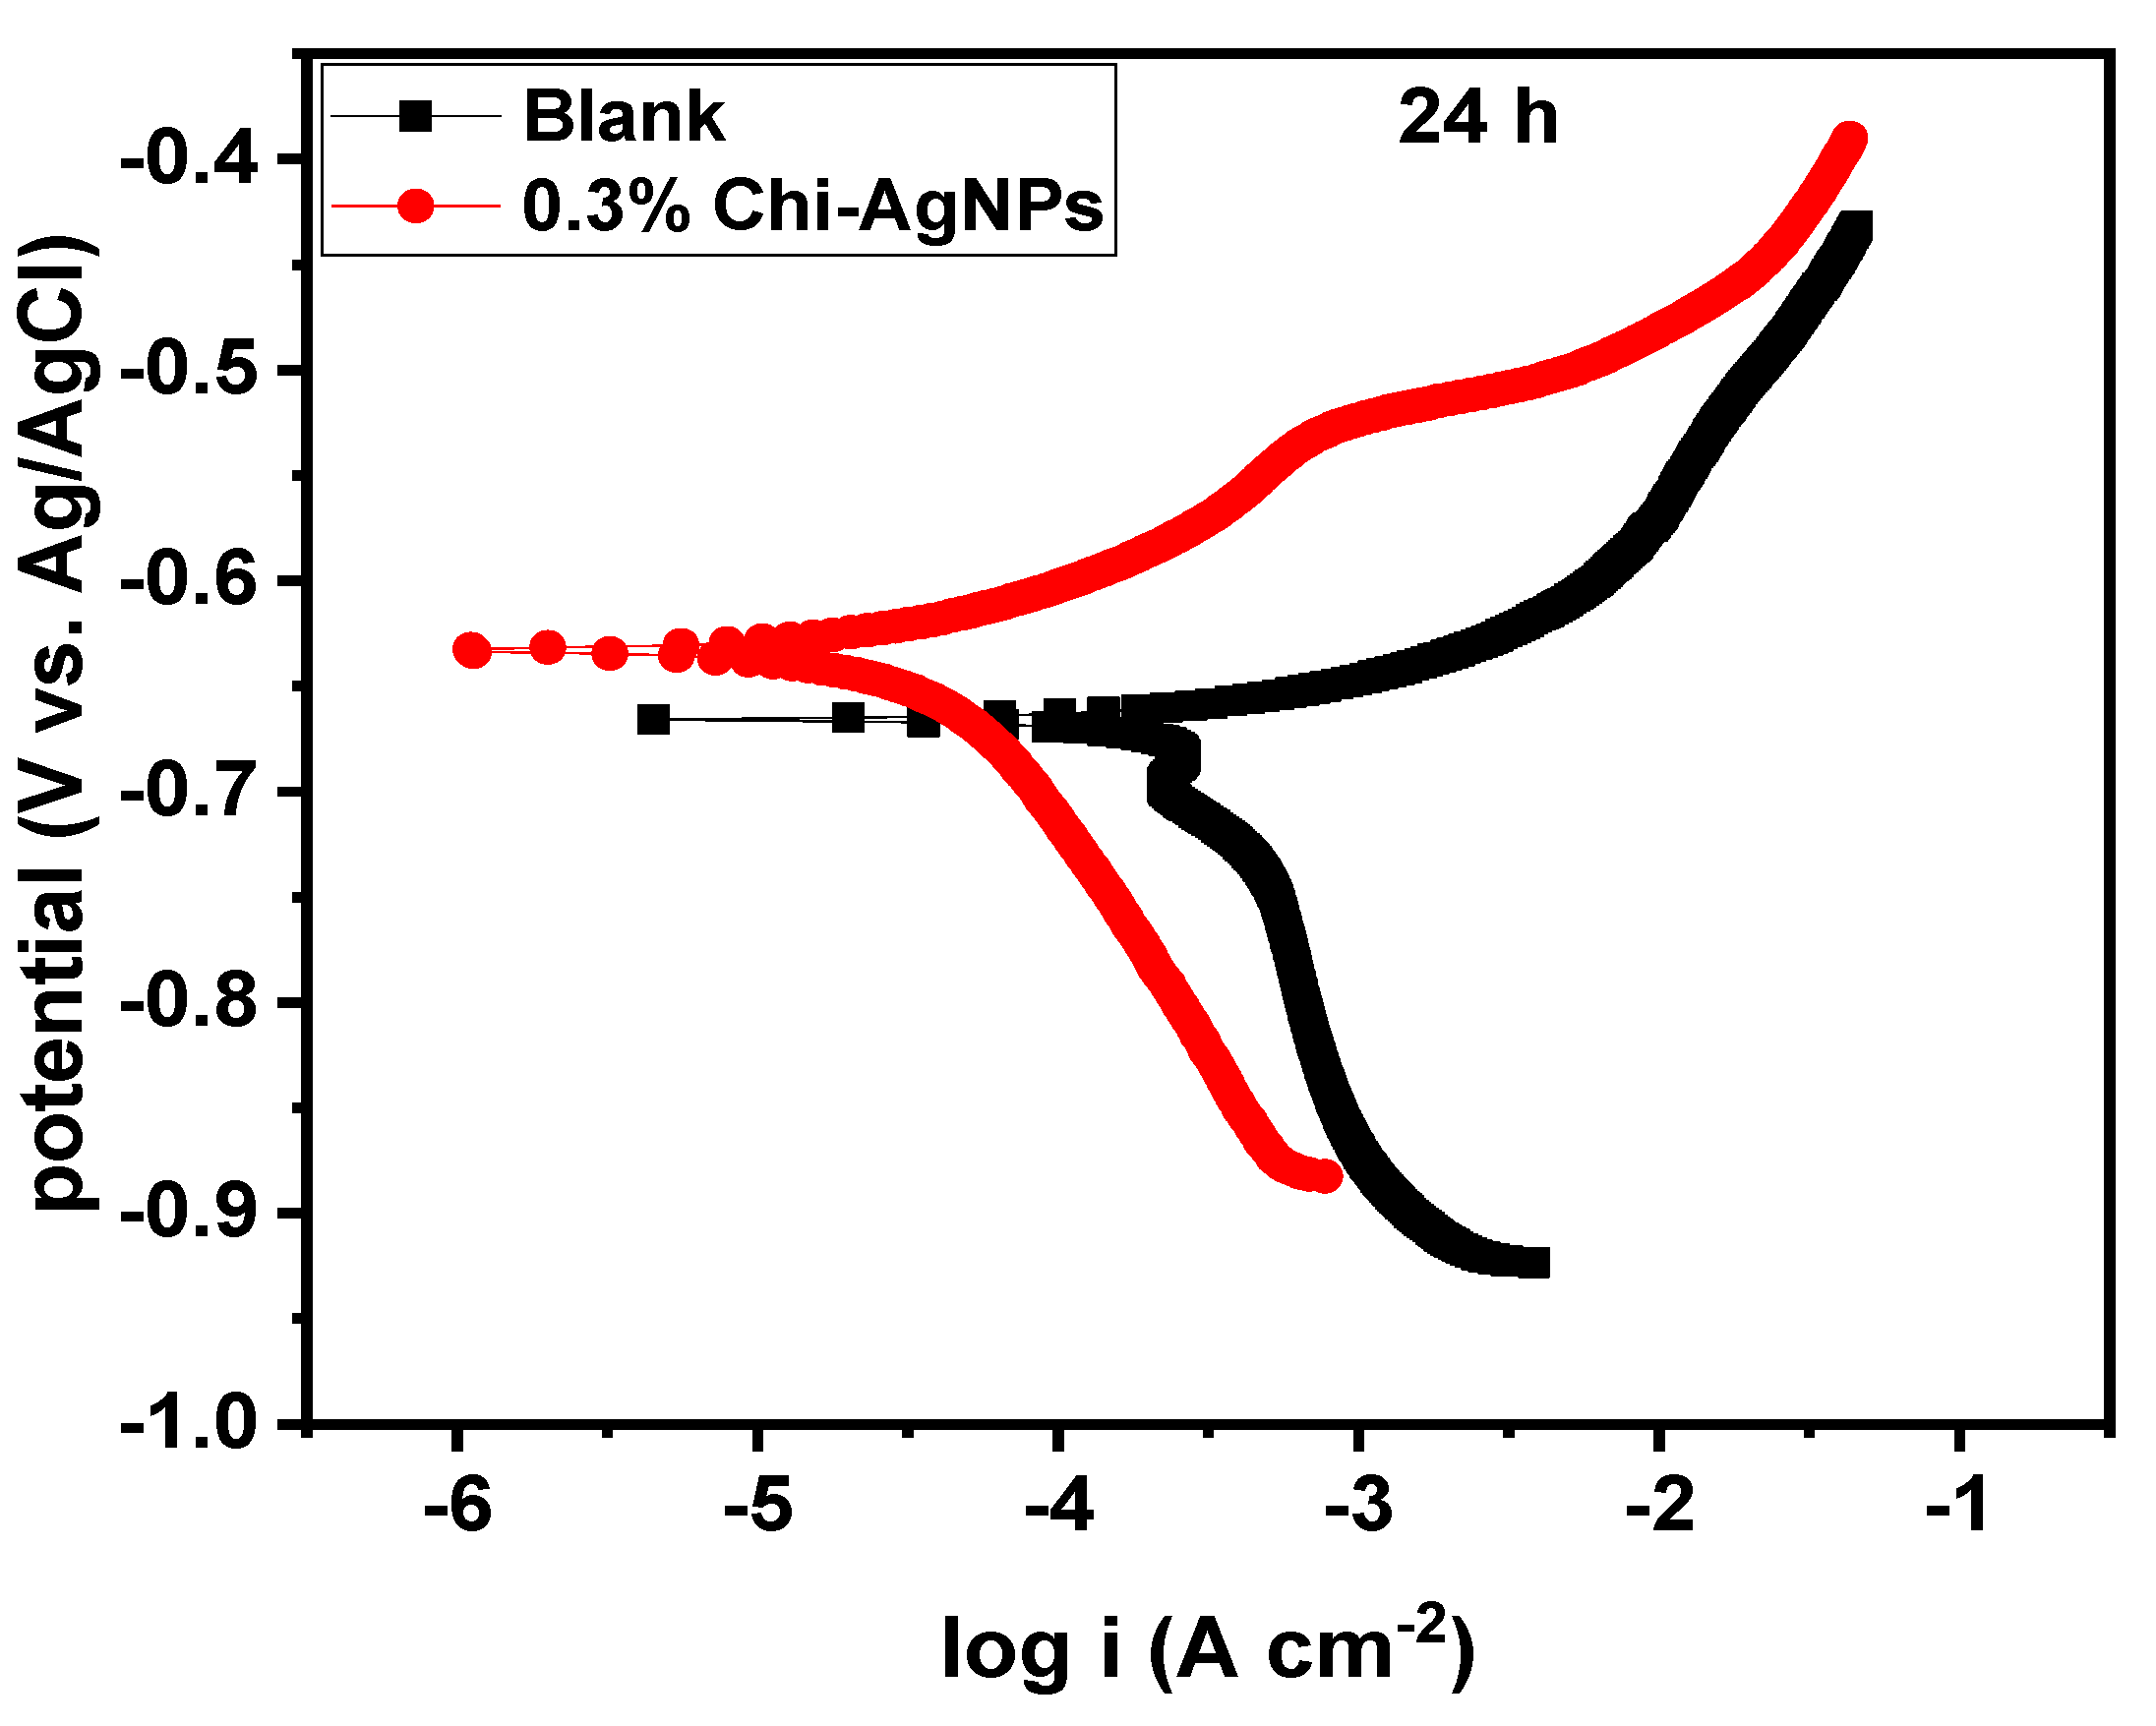
Figure 6 depicts the PDP curves obtained after 24 h of immersion in a CO2-saturated 3.5% NaCl solution without and with RVE-mediated Chi–AgNPs composite inhibitor during sweet corrosion of C1018 CS. The anodic arms of the polarization curves are characteristic of activation-controlled events associated to Fe → Fe2+ transformation under all conditions studied. The charge transfer (Tafel) region directly below the OCP on the cathodic arm is poorly characterized.
The addition of Chi–AgNPs composite to the CO2-saturated 3.5% NaCl solution causes the cathodic and anodic arms of the polarization curve to be displaced towards lower icorr values under the explored experimental conditions. In the presence of Chi–AgNPs composite inhibitor, Ecorr is seen to move to the positive direction as compared to the blank. The polarization parameters, such as the Ecorr, icorr, and βa, were, thus, determined from the Tafel area on the anodic branch of the curve, for such cathodic polarization curves with not well defined Tafel regions. The values are shown in Table 4. After 24 h of CO2 corrosion in the presence of 0.3% Chi–AgNPs composite, the cathodic and anodic currents are reduced. This validates the idea that the loss of Fe-CO2(ads) from the steel/electrolyte interface promotes inhibitor adsorption. The adsorbed Chi–AgNPs combination provides increased surface coverage, which reduces cathodic reactions. As a result, the transport of electrons from anodic (Fe → Fe2+ + 2e) to cathodic areas in the course of the electrochemical corrosion phenomenon is inhibited, resulting in a significantly lower anodic icorr. On the basis of the obtained electrical parameters (given in Table 4), the corrosion rate is reduced from 38.28 mpy in the uninhibited solution to 4.29 mpy in the inhibited solution containing 0.3% Chi–AgNPs composite, corresponding to an IE of 88.79% after 24 h submersion.
Increased adsorption of the CI on the steel surface over lengthy exposure can be imputed to the boosted corrosion protection afforded to the C1018 CS surface in the presence of the inhibitors in the CO2-saturated saline electrolyte. Exposure times of the C1018 CS in the CO2-saturated saline solution containing the inhibitors determine the effectiveness of the inhibitors. The strong molecule adsorption and improved protective film at the steel/electrolyte interface may also be seen in the enhanced IE with extended exposure durations.
Table 4 also shows the polarization resistance (Rp) and IE values deduced from LPR measurements at various exposure times. The LPR is a direct current methodology that provides accurate instantaneous information about C1018 CS corrosion by operating safely around the OCP. The LPR results show a trend that is consistent with the EIS measurements, that is, IE increases with increasing immersion time, with the highest value of 93.28% obtained after 24 h immersion time.

3.1.4. Effect of Temperature

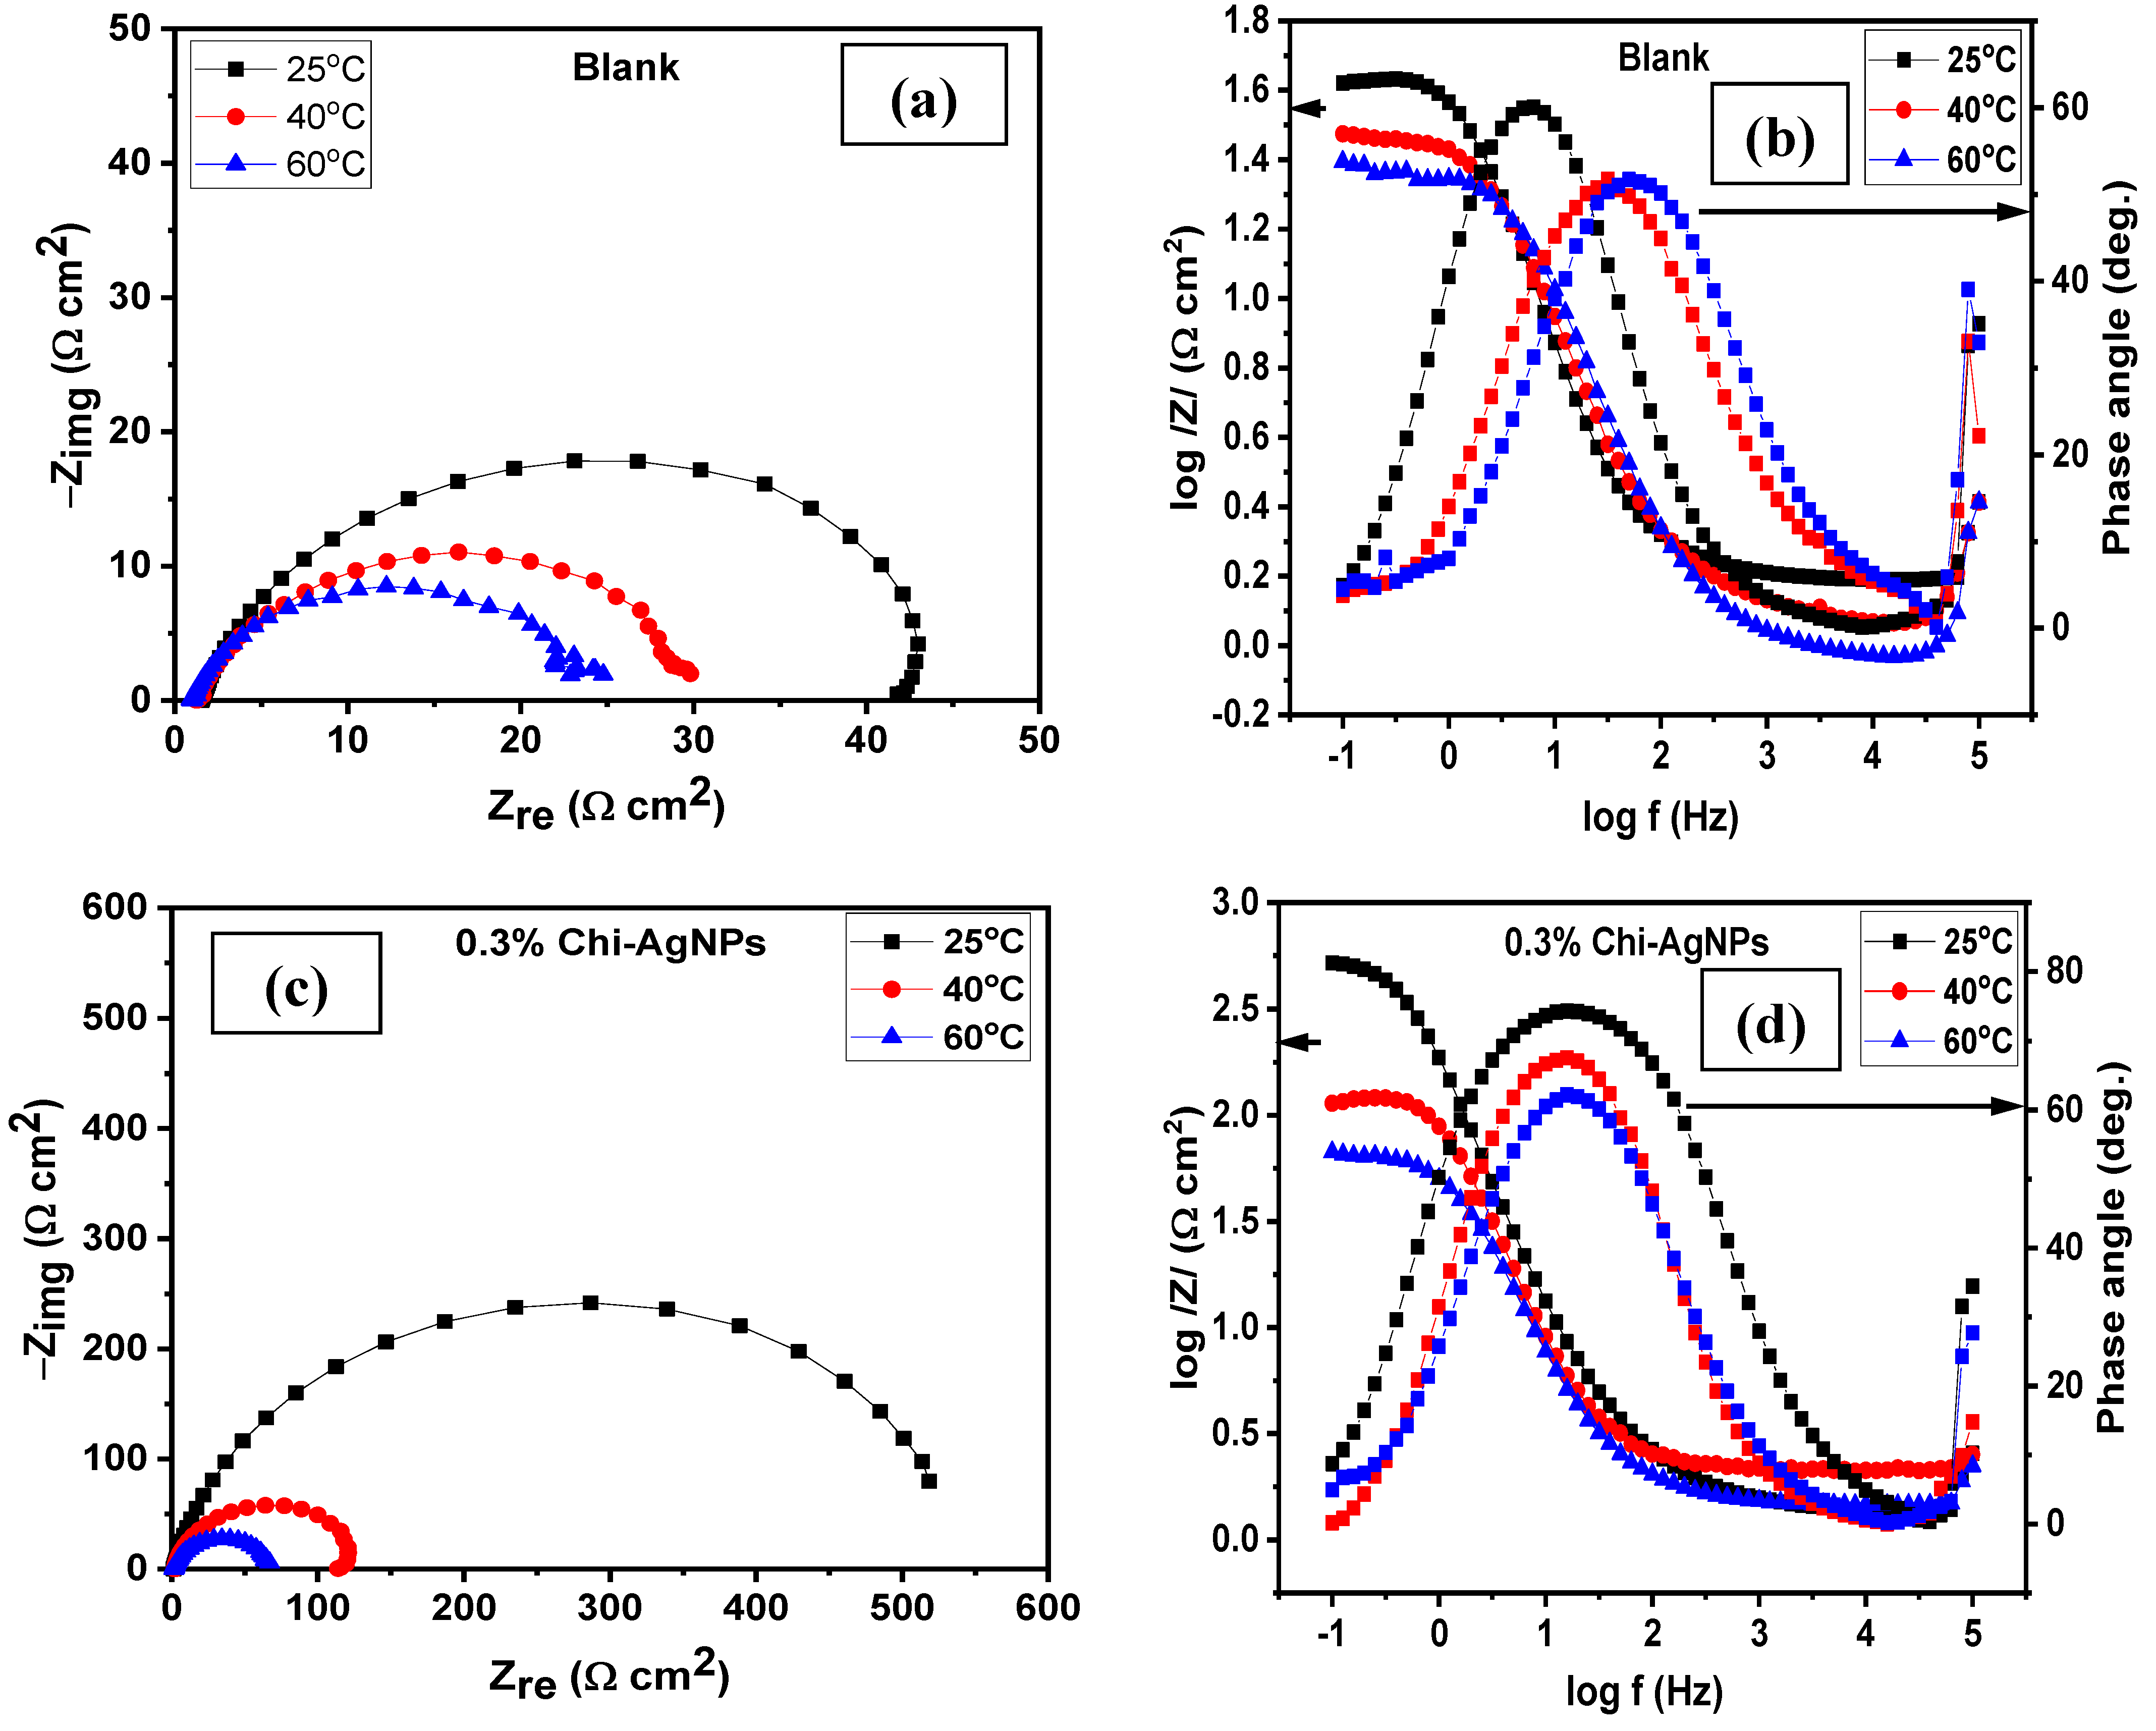
Figure 7a,b shows Nyquist and Bode plots, respectively, for C1018 CS after 1 h of immersion in CO2-saturated 3.5% NaCl solution devoid of CI at different temperatures. The effect of the addition of RVE-mediated Chi–AgNPs composite as inhibitor is exemplified in Figure 7c,d, respectively, for a concentration of 0.3%. Inspection of Figure 7 reveals that raising the temperature lowers the diameter of the semicircle, which indicates soaring corrosion rates. However, the shape of the Nyquist plot remains the same in the absence and presence of the inhibitors. The same equivalent circuit depicted in Figure 3a was utilized to analyze the experimental data to obtain the electrochemical parameters of interest, and the values are listed in Table 5. Examination of the table shows that both Rct and Rp decline with a rise in temperature. Furthermore, IE decline with a rise in temperature, with values of 92.67, 55.49, and −0.70% obtained at 25, 40, and 60 °C. respectively. This suggests the desorption of the adsorbed composite molecules from the metal surface [35].
From Table 5, it is noted that, as Rct increases, the Cdl also increases in the solution that is free of inhibitor. However, after 0.3% of the composite inhibitor is added to the solution, Rct increases and Cdl decreases upon increasing the temperature.
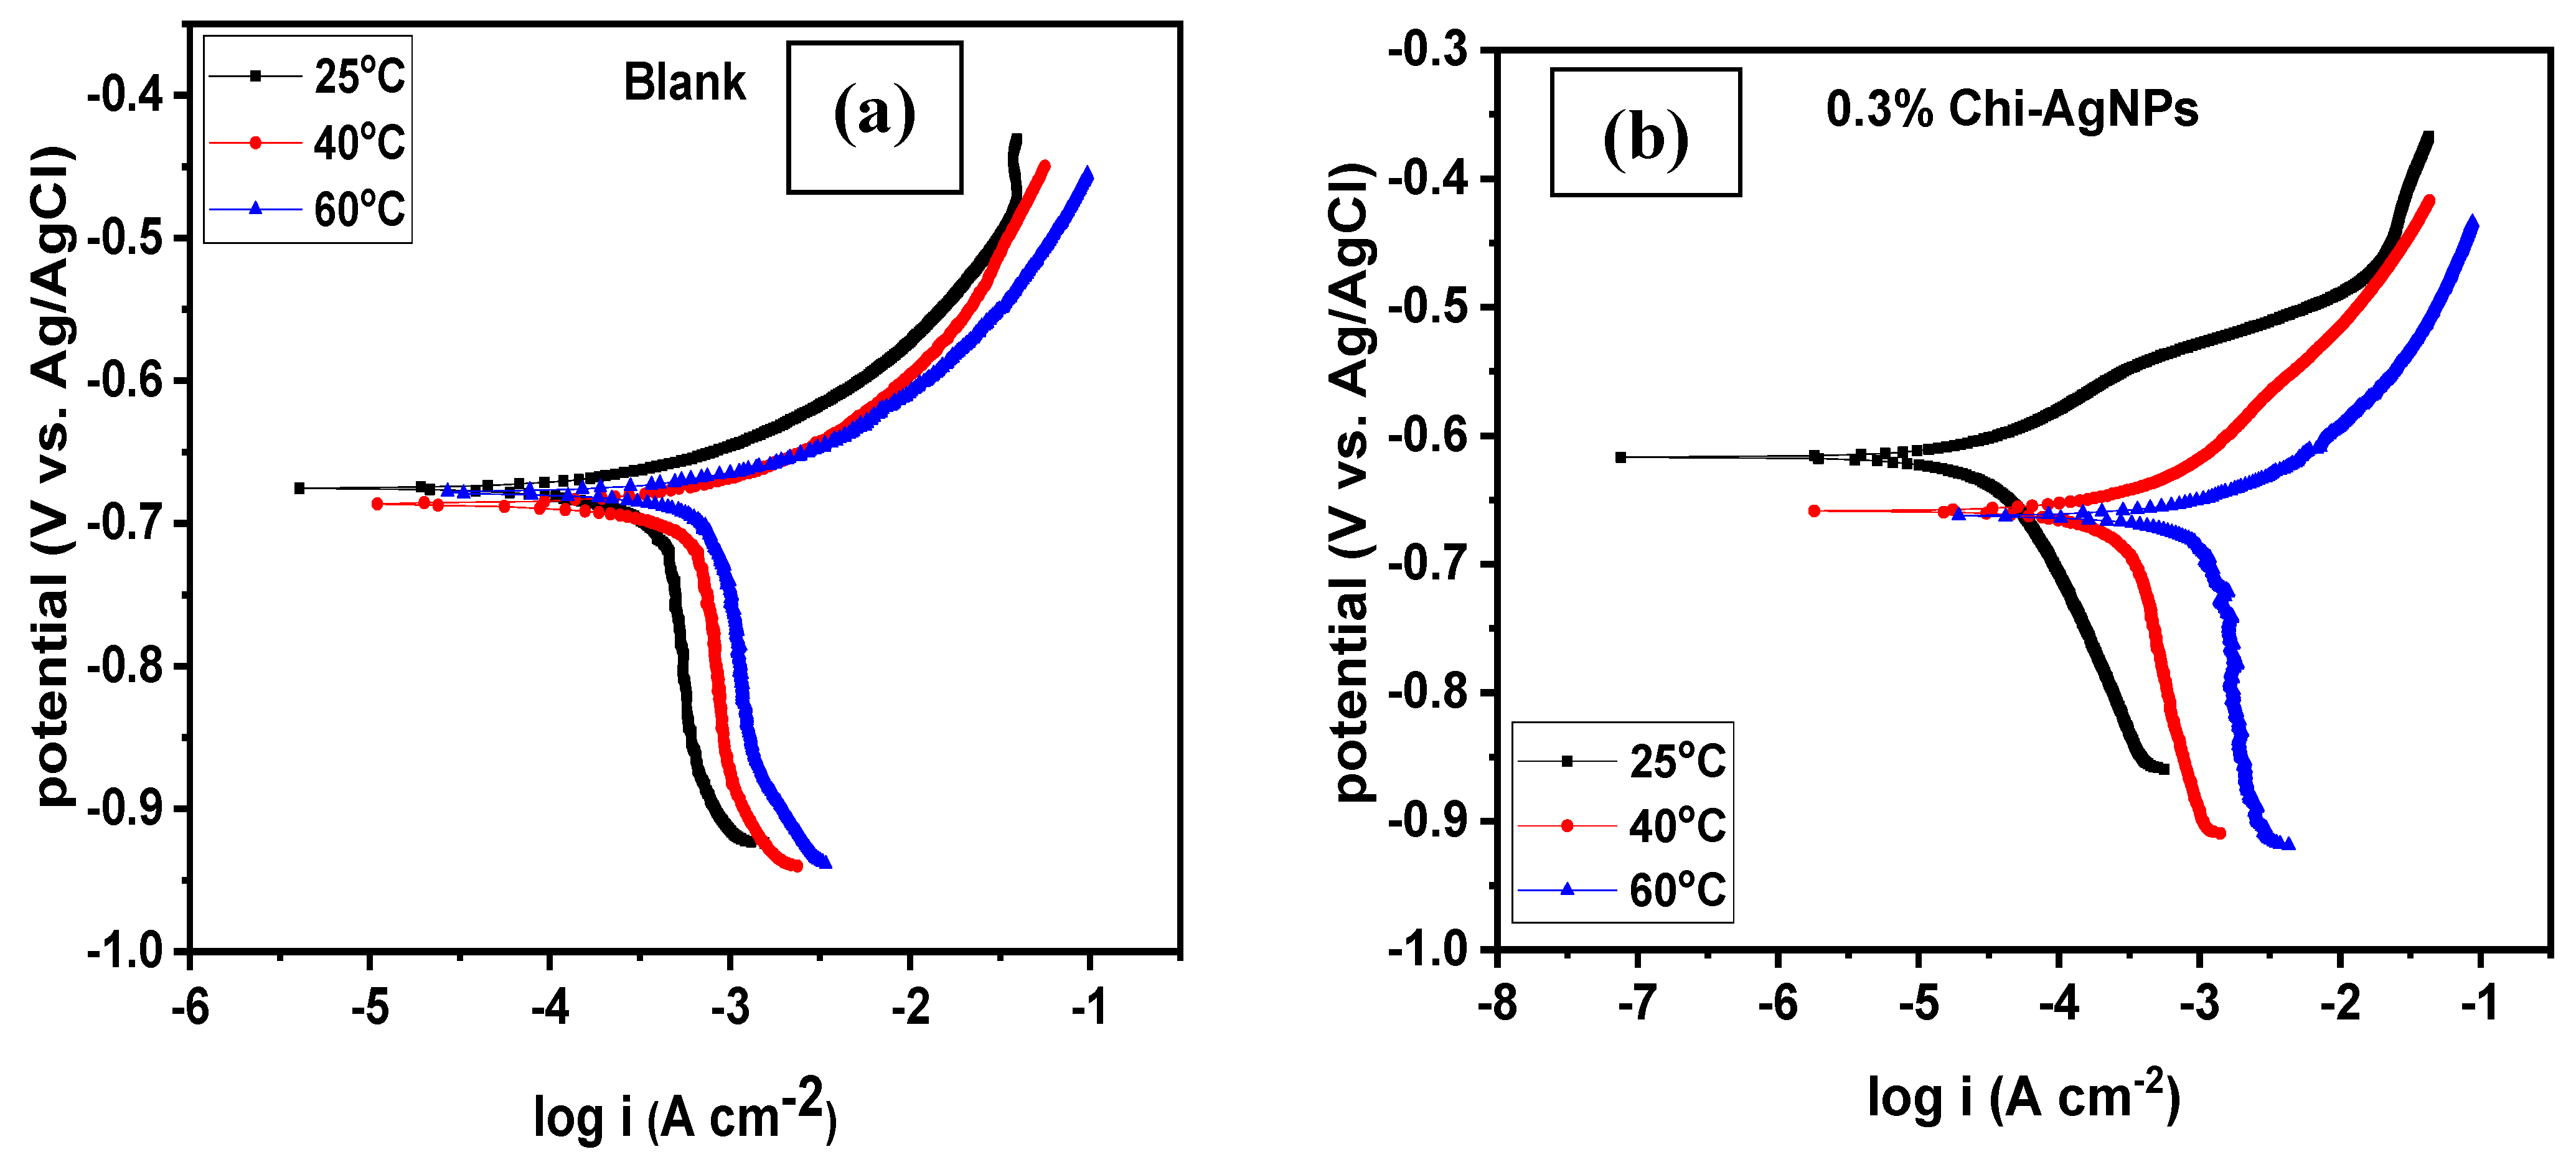
Potentiodynamic polarization was also deployed to investigate the corrosion characteristics of C1018 CS exposed to CO2-saturated 3.5% NaCl at 25, 40, and 60 °C with and without 0.3% Chi–AgNPs composite. Figure 8 displays the polarization curves. Both the anodic and cathodic processes, in both uncontrolled and inhibited solutions, are seen to speed up with increasing temperature, as determined by this figure’s analysis. Brine containing carbon dioxide has shown similar outcomes in prior studies [36]. An abrupt change in the slope of the anodic curve and an increase in current may be seen at a certain potential for each temperature investigated (Figure 8b). When the polarization potential is rather high, the potential at which the current density suddenly spikes is known as the Edes potential [37]. In Figure 8b, Edes is seen to decrease as temperature rises, suggesting that higher temperatures favor desorption of the inhibitor molecules from the CS surface. Since there is no Tafel dependency in the cathode area of the potentiodynamic curves produced for a C1018 steel electrode in a CO2-saturated brine solution, the corrosion current is calculated graphically by extrapolating from the anodic polarization curves. Table 6 lists the polarization values. Table 6 shows that both the current density and the corrosion rate increase with increasing temperature in uncontrolled and inhibited solutions. The values for inhibitory efficiency decline proportionally with temperature, with a value of −80.38% recorded at 60 °C, indicating a temperature-induced acceleration of corrosion [35].
The electrochemical parameters derived from LPR measurements are also listed in Table 6. It is seen from the table that polarization resistance decreased with the increase in temperature both in the absence and presence of the Chi–AgNPs composite. For instance, in the inhibited solution, the polarization resistance decreases from 573.97 Ω cm2 at 25 °C to 75.94 Ω cm2 and 17.89 Ω cm2, at 40 and 60 °C respectively. The decrease in polarization resistance with increasing temperature also results in a corresponding decrease in IE with the values of 90.51, 57.45, and −50.08% obtained at 25, 40 and 60 °C, respectively. The results obtained from all the electrochemical techniques are in good agreement, revealing that the RVE-mediated chitosan–AgNPs composite is a good CI at room temperature and corrosion accelerator at elevated temperatures for C1018 CS in a CO2-saturated brine solution.
Table 6 shows that the rate of corrosion in unprotected solutions rises as the temperature rises. This behavior could be explained by the fact that the electrochemical reactions, chemical reactions, and transfer process of reactive species to the metal surface are all accelerated by a rise in temperature [35]. Given that temperature is a major issue in corrosion due to many changes occurring on the inhibited metal surface (including rapid etching and desorption of inhibitor, and the inhibitor itself possibly undergoes decomposition and/or rearrangement [38]), the overall influence of temperature on the corrosion inhibitive performance of the composite in the current investigation is not all that surprising.

3.2. Corrosion under Hydrodynamic Condition

The corrosion inhibition performance of RVE-mediated Chi–AgNPs composite was assessed under hydrodynamic conditions utilizing RCE. The RCE approach is a useful approach for studying corrosion and corrosion inhibition in hydrodynamic and flow regimes. The rotation of the RCE at varied speeds produces varying amounts of turbulence, which conveys a varying extent of shear stress, which can alter the adherence of CI molecules on the steel surface. The ability to establish a consistent flow situation with guided mass transport rates to the electrode surface is one of the advantages of adopting RCE. This guarantees that the current potential distribution is controlled and uniform in the vicinity of the corroding metal surface [32].
As previously described [39], a measurable account of the rate of momentum transfer at the RCE wall during CO2 corrosion tests under varying hydrodynamic situation was established using wall shear stress (Pa). In addition, an evaluative assessment of the hydrodynamic situation as being either laminar or turbulent flow has been presented on the basis of the values of the dimensionless Reynolds number (Re) computed from the formula reported elsewhere [40,41]. The calculated hydrodynamic parameters based on the sample rotation speed in the course of the corrosion of C1018 CS in CO2-saturated 3.5% NaCl solution is listed in Table 7. Based on the data presented in the table, it is clear that the test was performed under an excessively turbulent situation. For comparison purposes, test under static condition was also carried out.
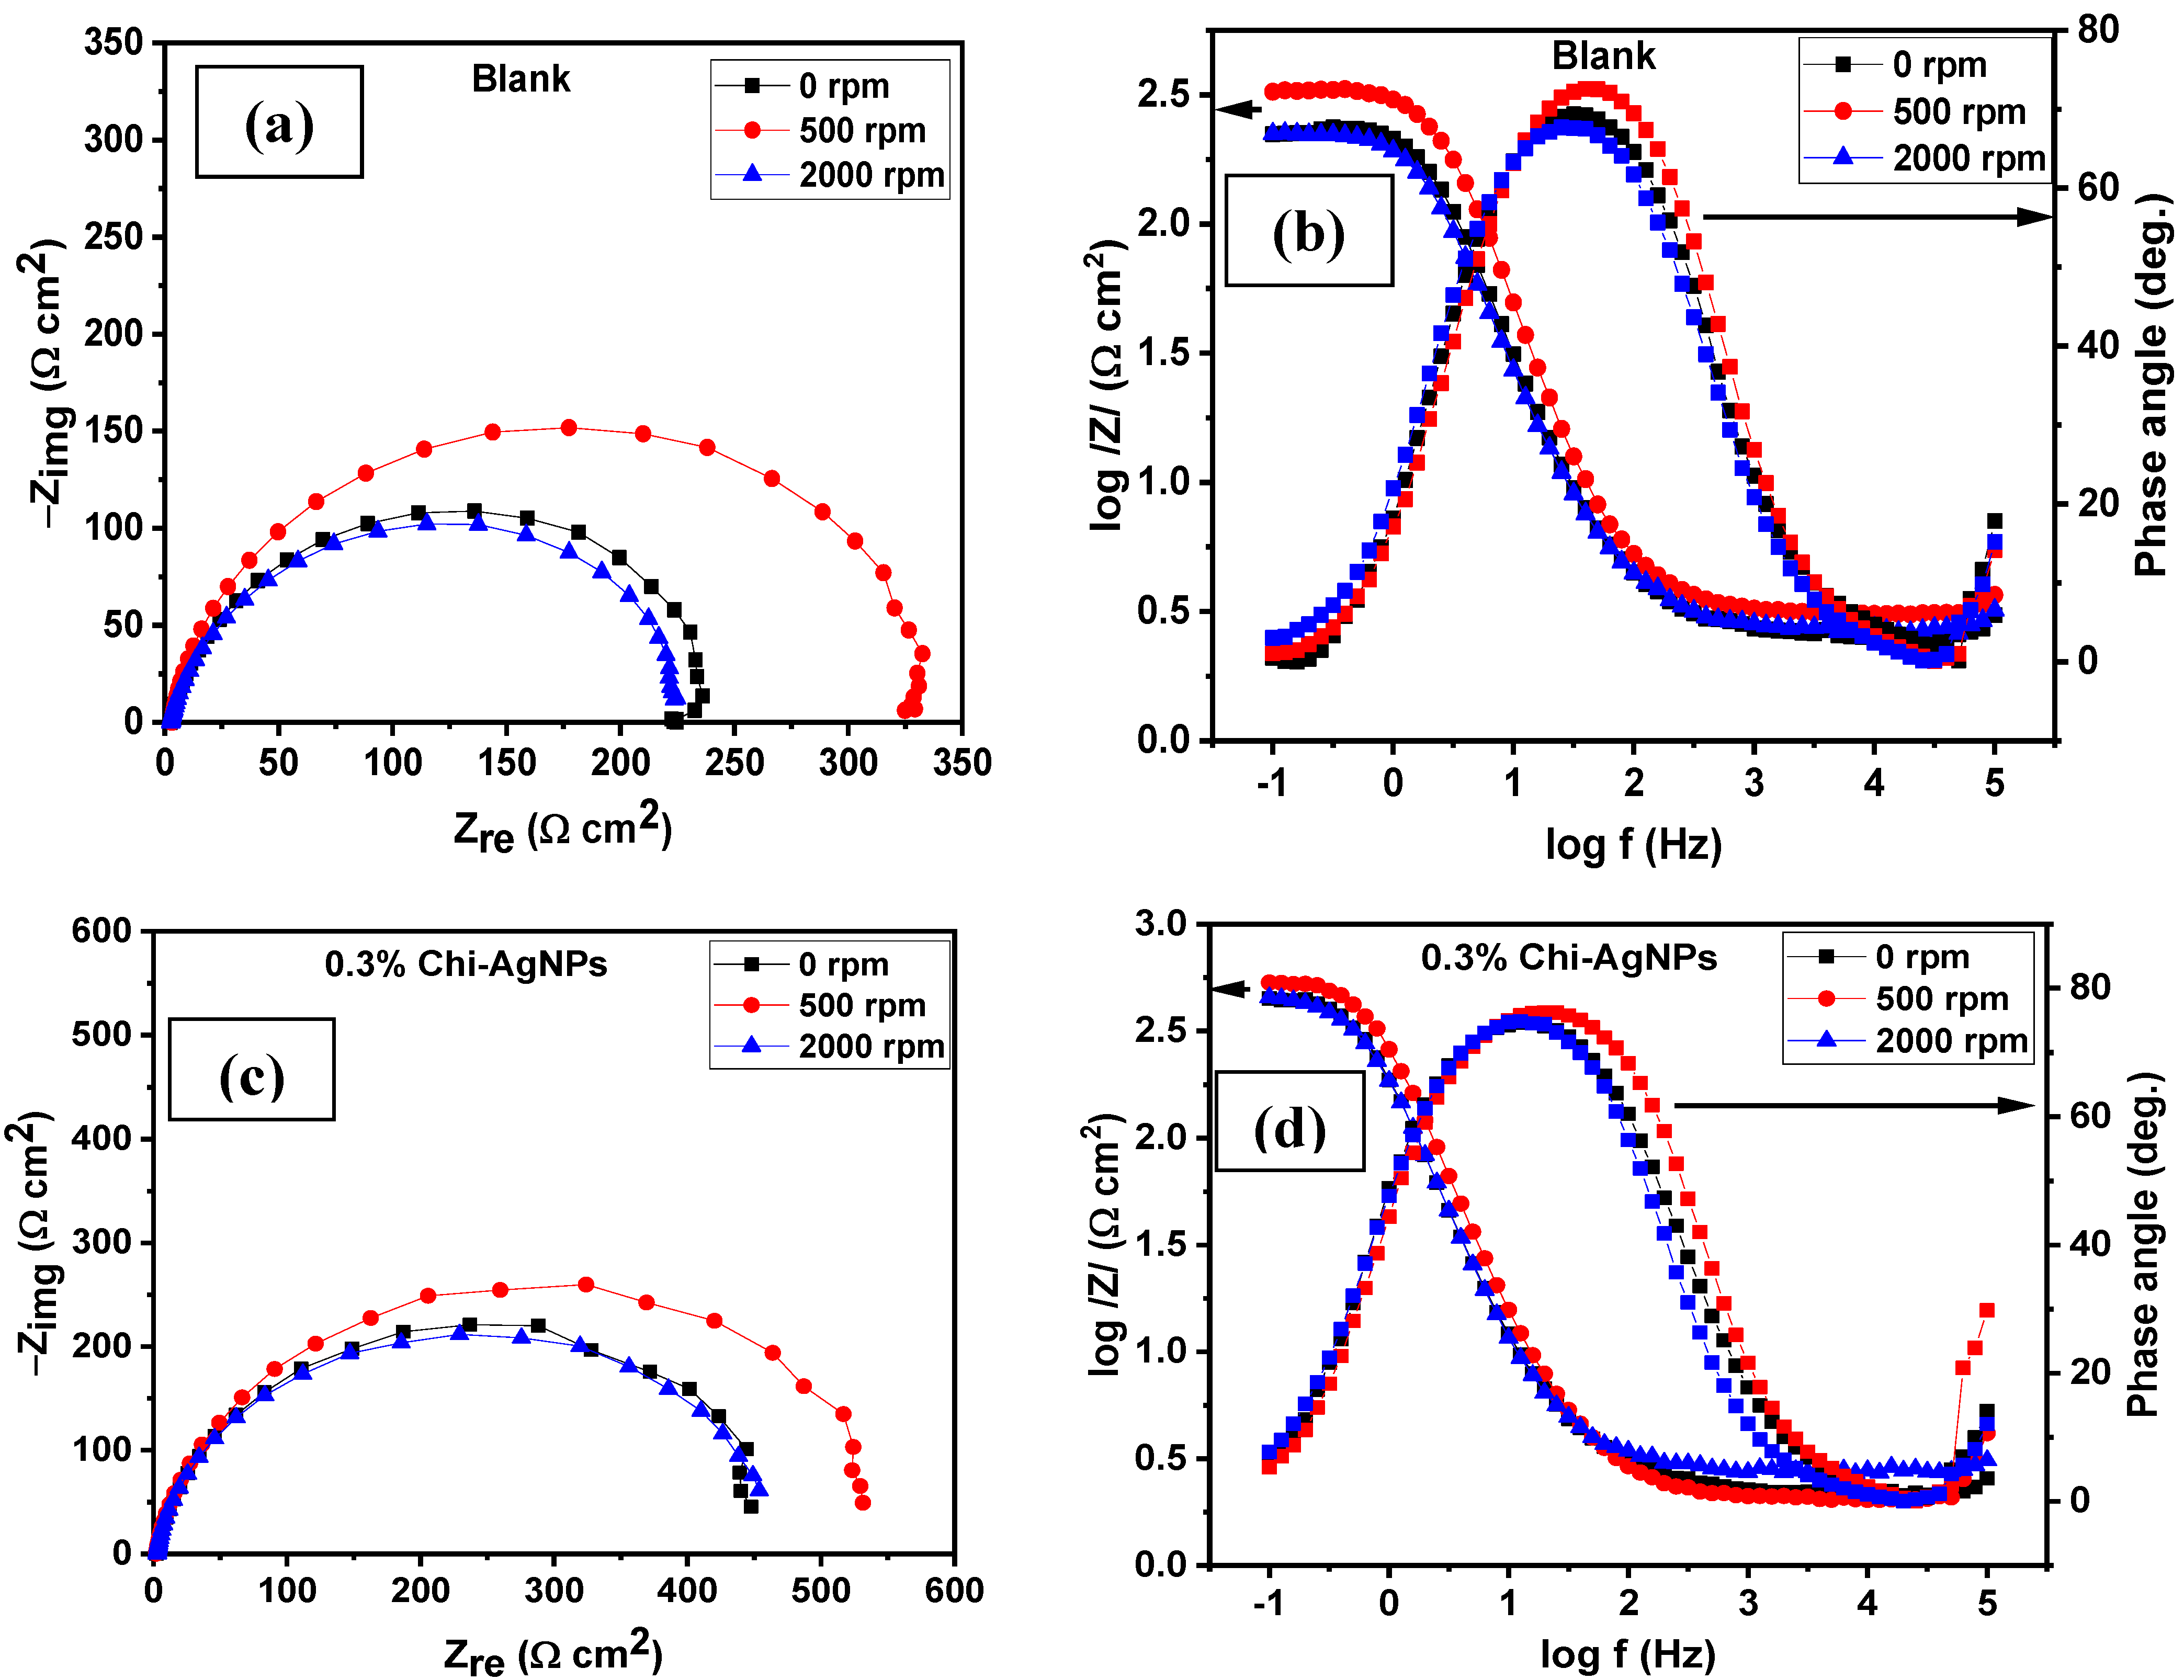
Figure 9a,b shows Nyquist and Bode diagrams for the unrestrained solution at various rotation speeds, respectively, while Figure 9c,d shows corresponding plots for the inhibited solution containing 0.3% of the composite. A capacitive semicircle that results from the charge transfer from the metal to electrolyte through the double electrochemical layer can be seen on Nyquist diagrams in both the blank and on the introduction of the inhibitor. When the rotation speed is raised from 0 rpm to 500 rpm, the diameter of these semicircles increases; when the rotation speed is raised to 2000 rpm, the diameter decreases. For the steel in the unrestrained solution, it is conceivable that an upsurge in the mass transfer of H2CO3/HCO3 species occurs on the basis of the following equation: 2H2CO3(aq) + 2e → H2(g) + 2HCO3 (pH 4–6), from the bulk solution to the steel surface, which could also stimulate FeCO3 precipitation and, as a result, account for the apparent reduction in corrosion rate with increasing speed of rotation up to 500 rpm. The protective species, namely HCO3 species in the unrestrained solution and both HCO3 species and CI molecules in the restrained solution, adhere to the steel surface more effectively when the rotation speed is increased. Higher Rct values are produced as the rotation speed approaches 500 rpm due to a slowdown in the rate of charge transfer across the double layer. Electrical equivalent circuit displayed in Figure 3a was deployed to analyze the experimental data, and the results are displayed in Table 8. The data in the table indicate that there is no appreciable change in IE with increasing rotation speed. For instance, at 0, 500 and 2000 rpm, the IE values are 51.99, 51.42, and 52.25% respectively. Similar observations were noted for other experimental techniques. This could be ascribed to the negative influence of the excessive shear stress as a consequence of high velocity.
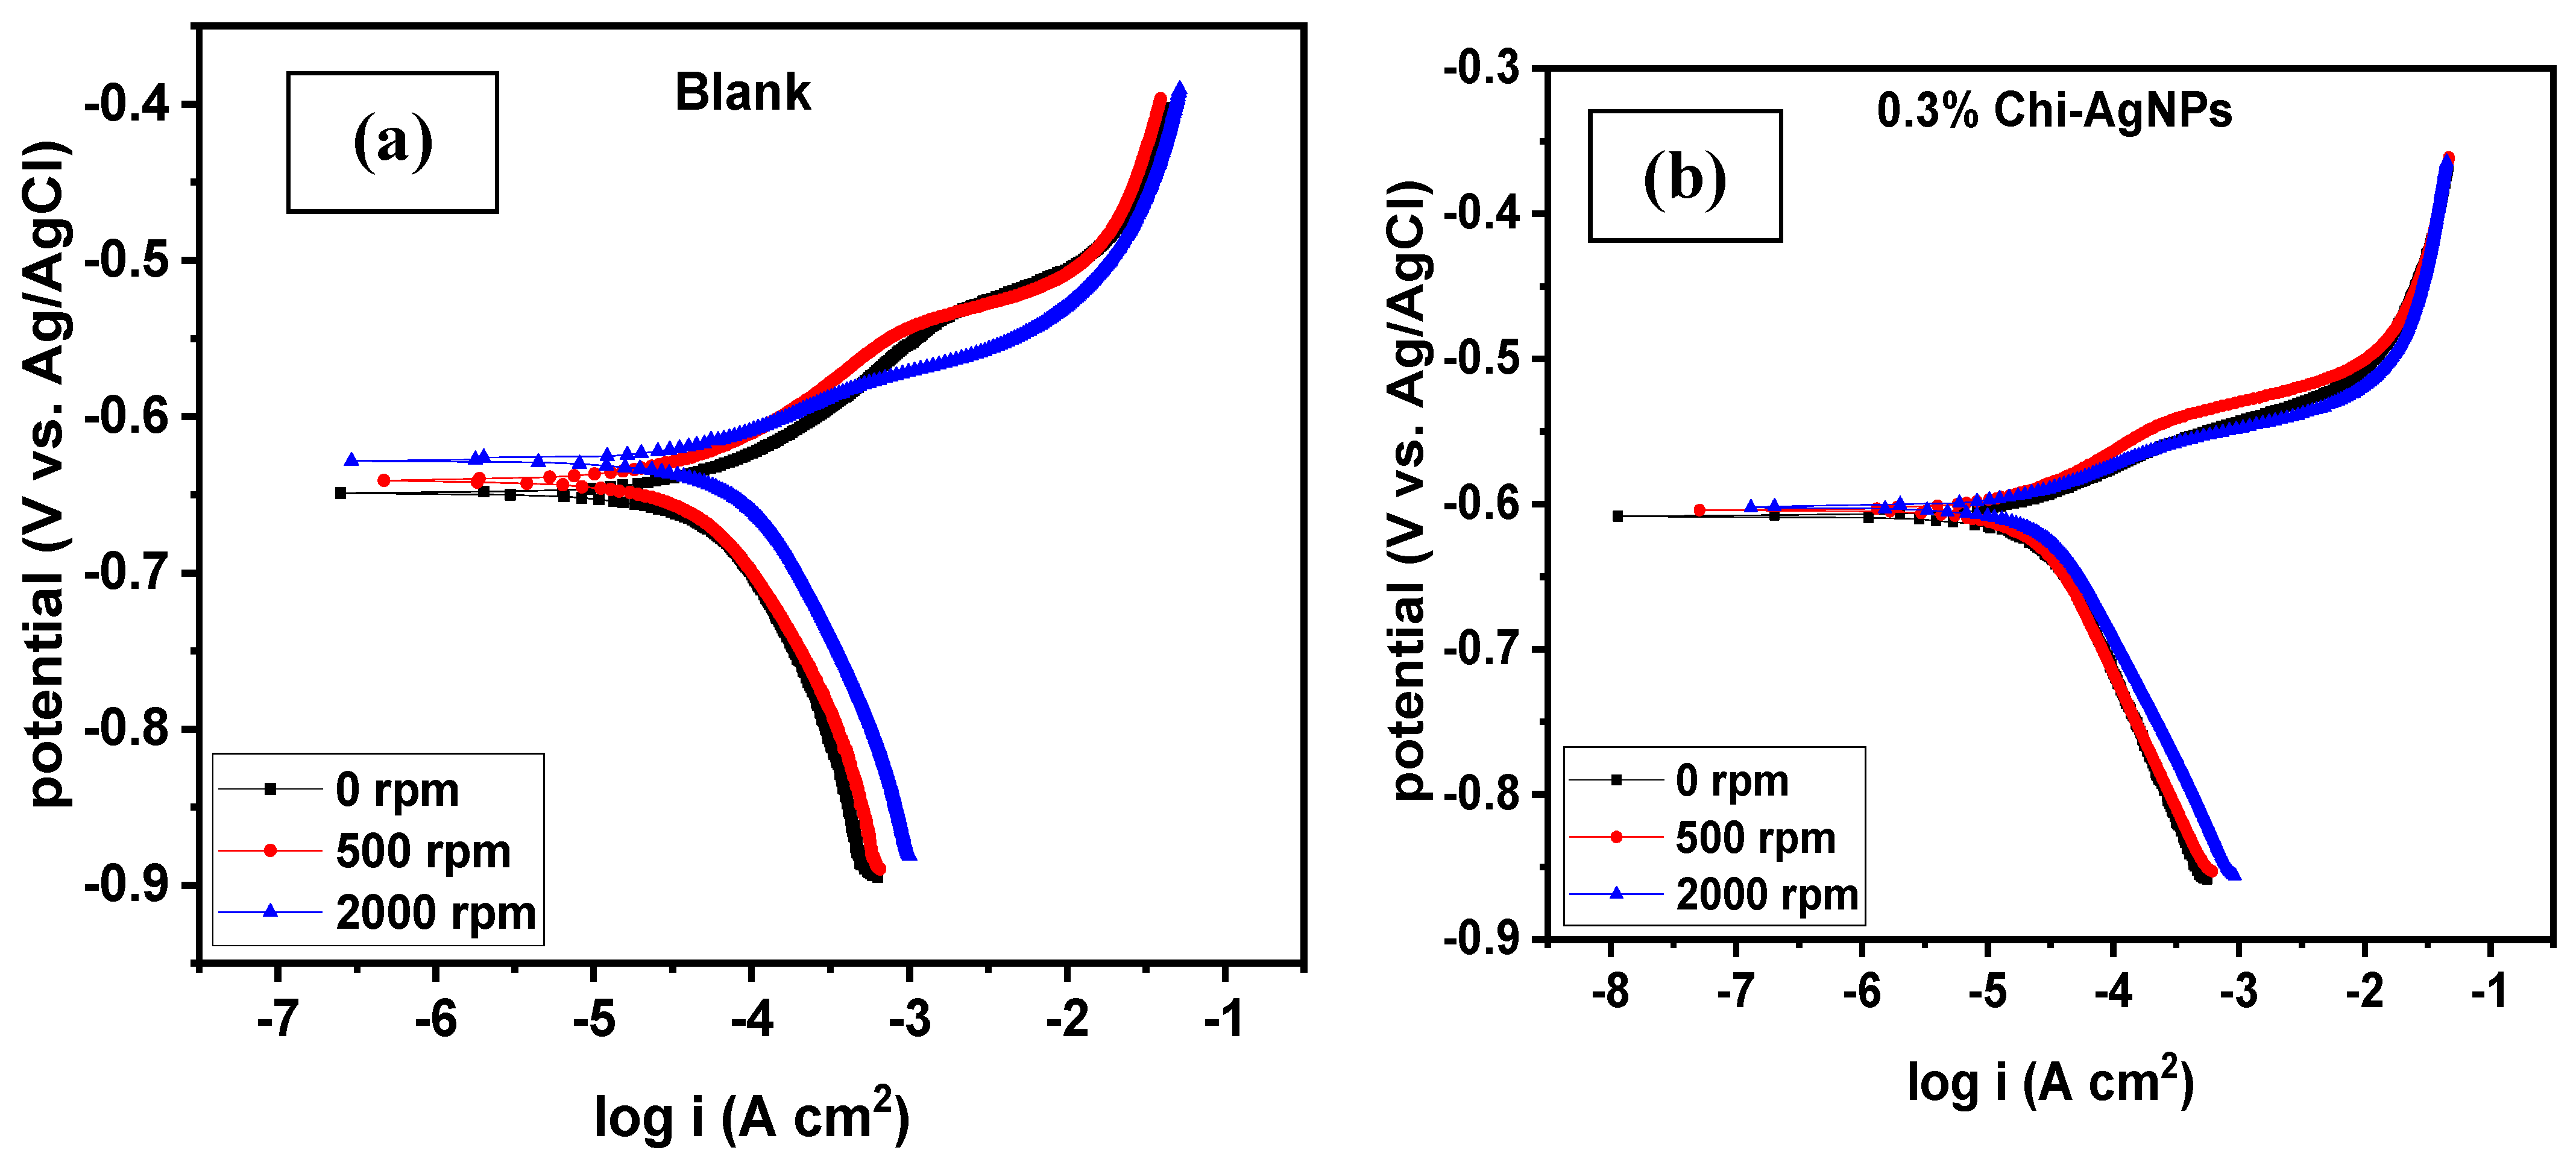
Figure 10a displays the potentiodynamic polarization curves for C1018 CS in uninhibited 3.5% NaCl solution that is CO2-saturated in both stagnant and stirred solutions. In this illustration, the anodic arm of the curve exhibits active behaviour, with the current rising with the applied potential and no passive layer present. Regardless of the rotational speed, the anodic current density value remains roughly unchanged. The hydration of CO2 into carbonic acid, on the other hand, causes the cathodic current density to exhibit a limit value that rises with rotation speed [42]. Since the solution is de-aerated, the reduction of H+ ions, which are supplied by the dissociation of carbonic acid, is the predominant cathodic reaction [3]. Thus, the diffusion of H+ ions is what causes this cathodic limit’s current value. As the rotational speed rises, the corrosion current density, icorr, rises, and the free corrosion potential, Ecorr, becomes more noble. On the other hand, as the rotation speed increases, the icorr value rises and the Ecorr value becomes nobler for the inhibited solution (Figure 10b).
It can be seen from an examination of the data in Table 8 and Table 9 that the RVE-mediated Chi–AgNPs composite performed moderately well in terms of inhibition. There are various effects on the performance of inhibition under different flow conditions, as follows:
(i) Flow can increase the mass transport of inhibitor molecules, increasing the amount of inhibitor present at the surface of metal. This impact may enhance the effectiveness of the inhibitor [43];
(ii) The presence of the [Fe-Inh]2+ complex on the electrode may decrease due to an increase in the mass transport of metal ions (Fe2+) created during metal dissolution from the electrode surface to the bulk solution; this has a negative impact on the effectiveness of inhibition;
(iii) High shear stress due to high flow velocity can also separate the layer of adsorbed [Fe-Inh]2+ complex and lead to more desorption from the metal surface, which is detrimental to the inhibitor’s effectiveness [43]. Changes in inhibitor efficiency with rotation rate are caused by how well the aforementioned effects balance one another.
Table 9. Potentiodynamic polarization and linear polarization resistance parameters for the corrosion of C1018 carbon steel in CO2-saturated 3.5% NaCl solution without and with 0.3% chitosan–AgNPs composite at different rotation speeds.
PDP MeasurementsLPR Measurements
System/
Concentration
Rotation Speed
(rpm)
–Ecorr
(mV/Ag/AgCl)
icorr
(µA cm−2)
βa
(mV dec−1)
Corrosion Rate (mpy)IE (%)Rp
(Ω cm2)
IE
(%)
Blank
0649.6274.8280.7910.88-283.32-
500621.2459.8373.428.60-386.23-
2000628.0491.8466.4413.35-254.48-
0.3% composite
0608.3928.5051.934.1461.91561.8049.57
500604.2426.4562.053.8555.79672.3042.55
2000603.0729.8147.804.3367.54497.1848.81

3.3. Surface Analysis

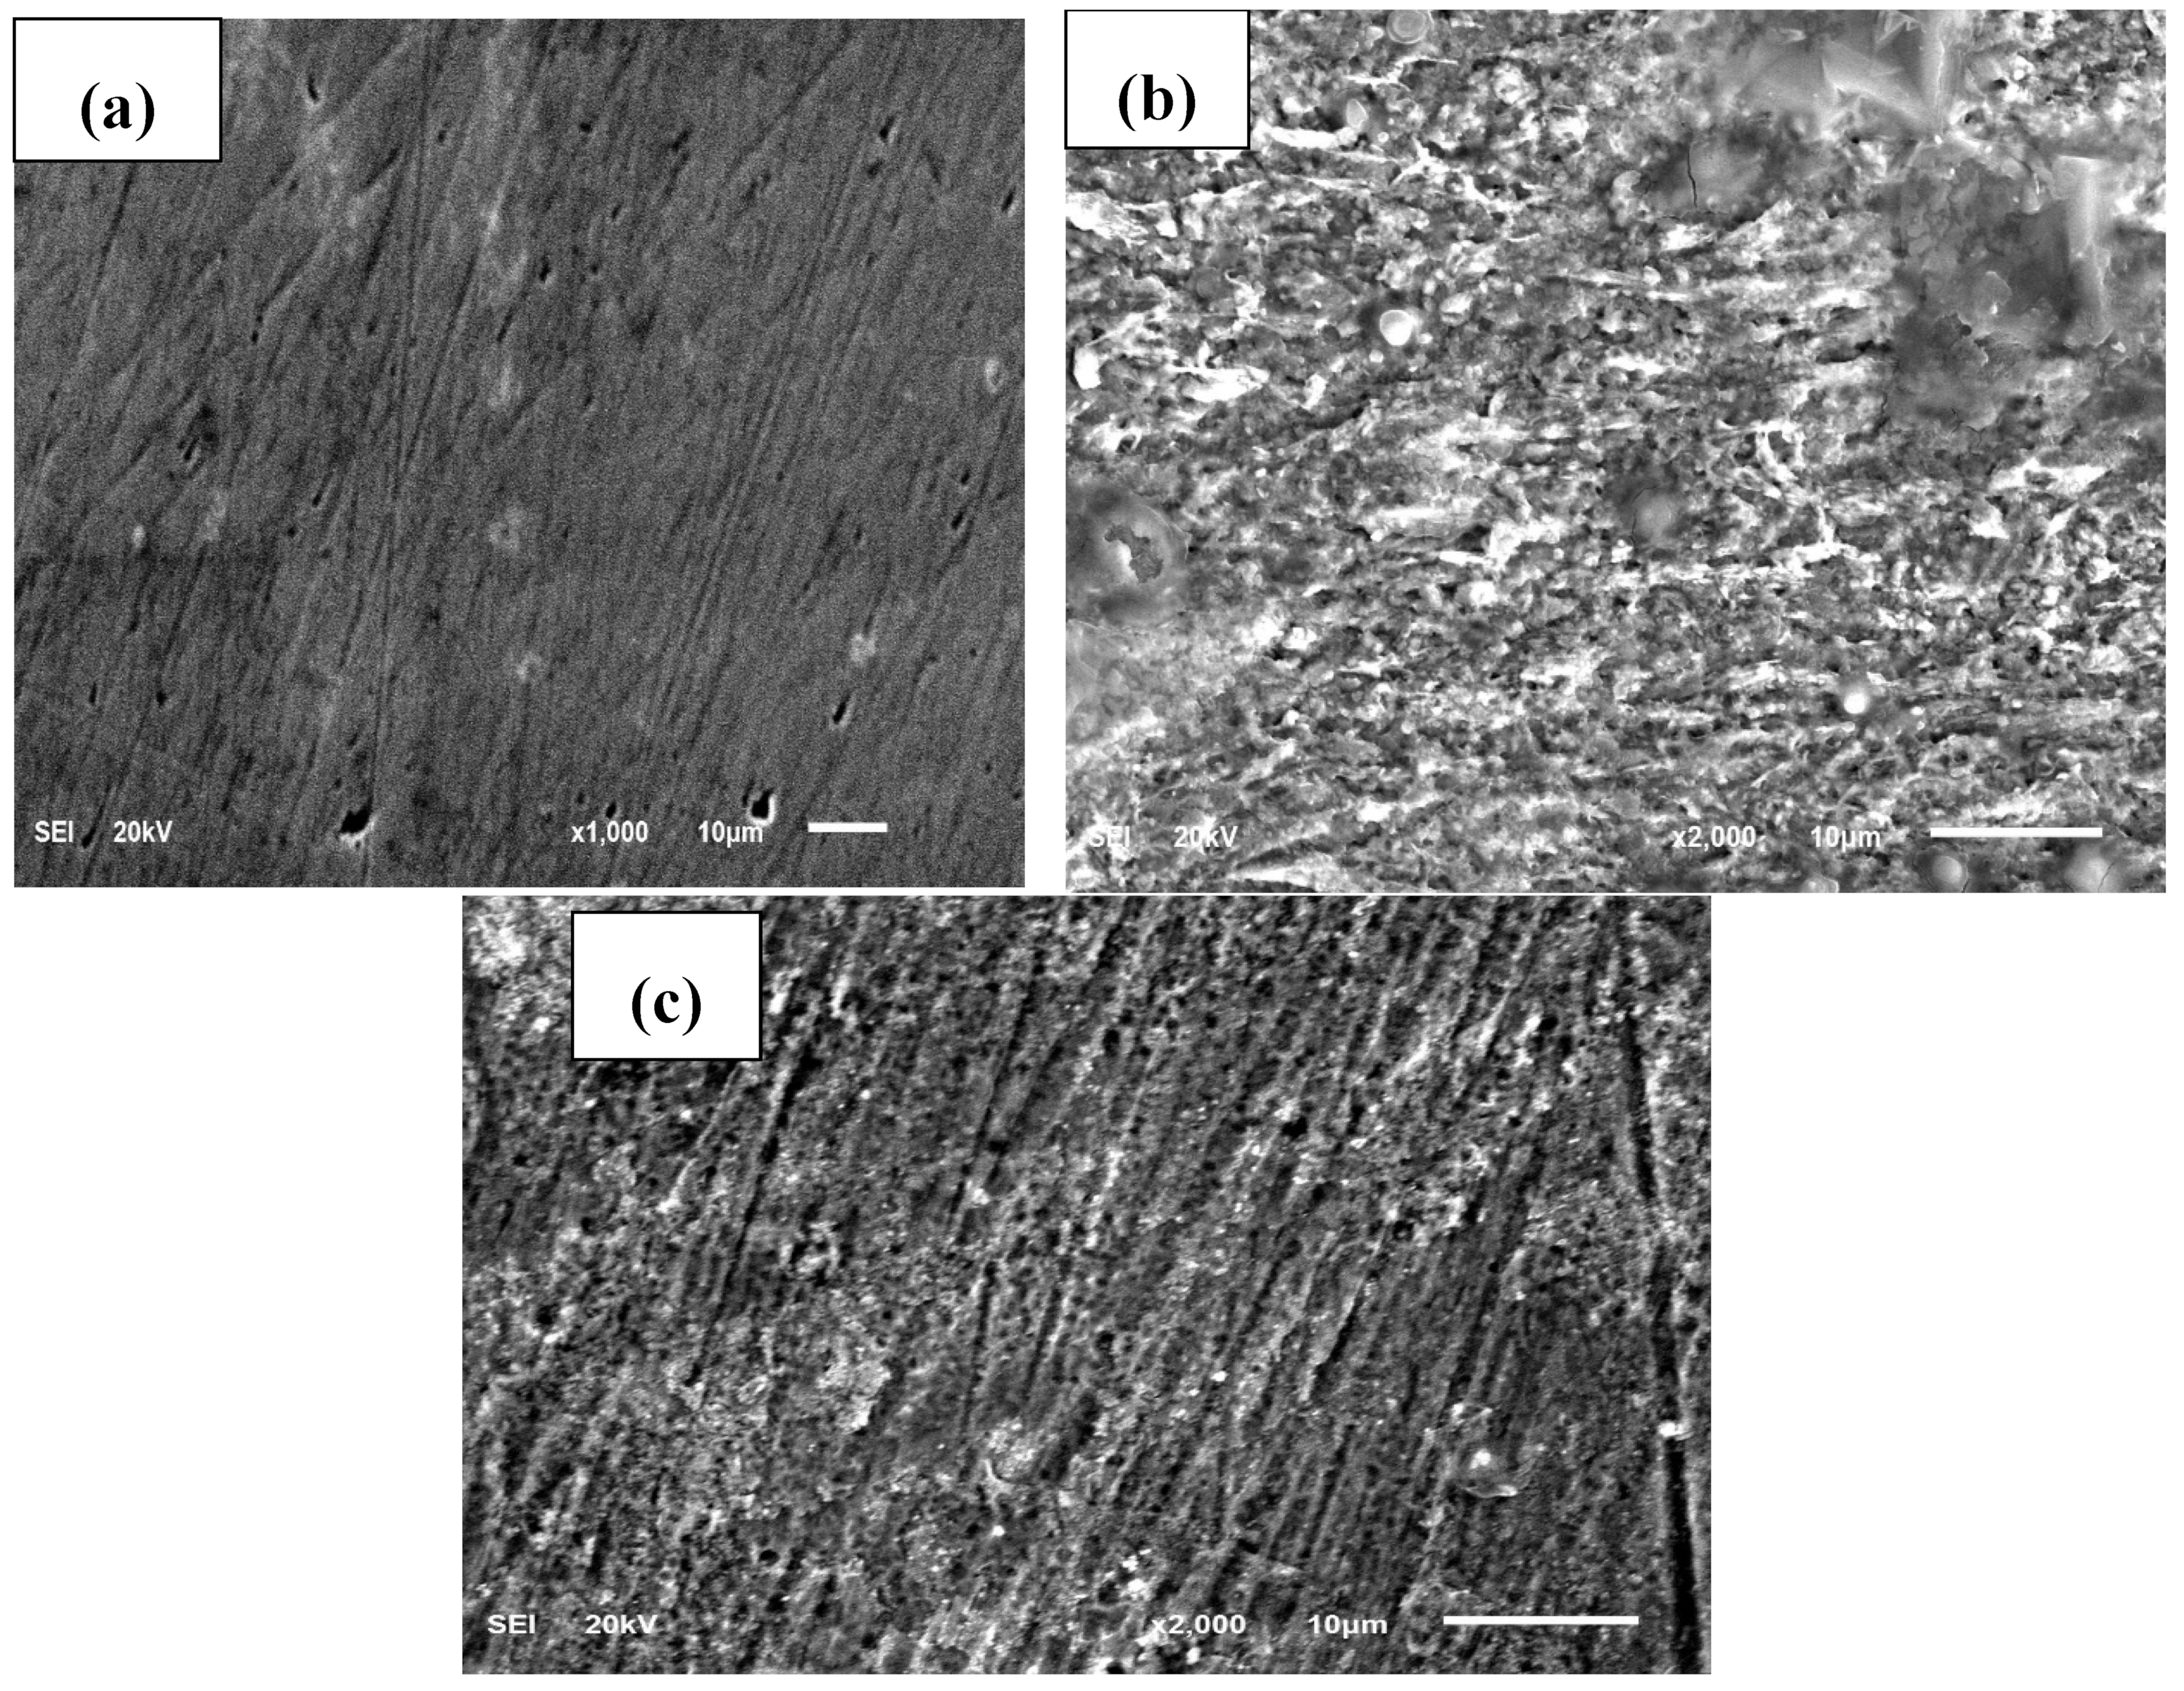
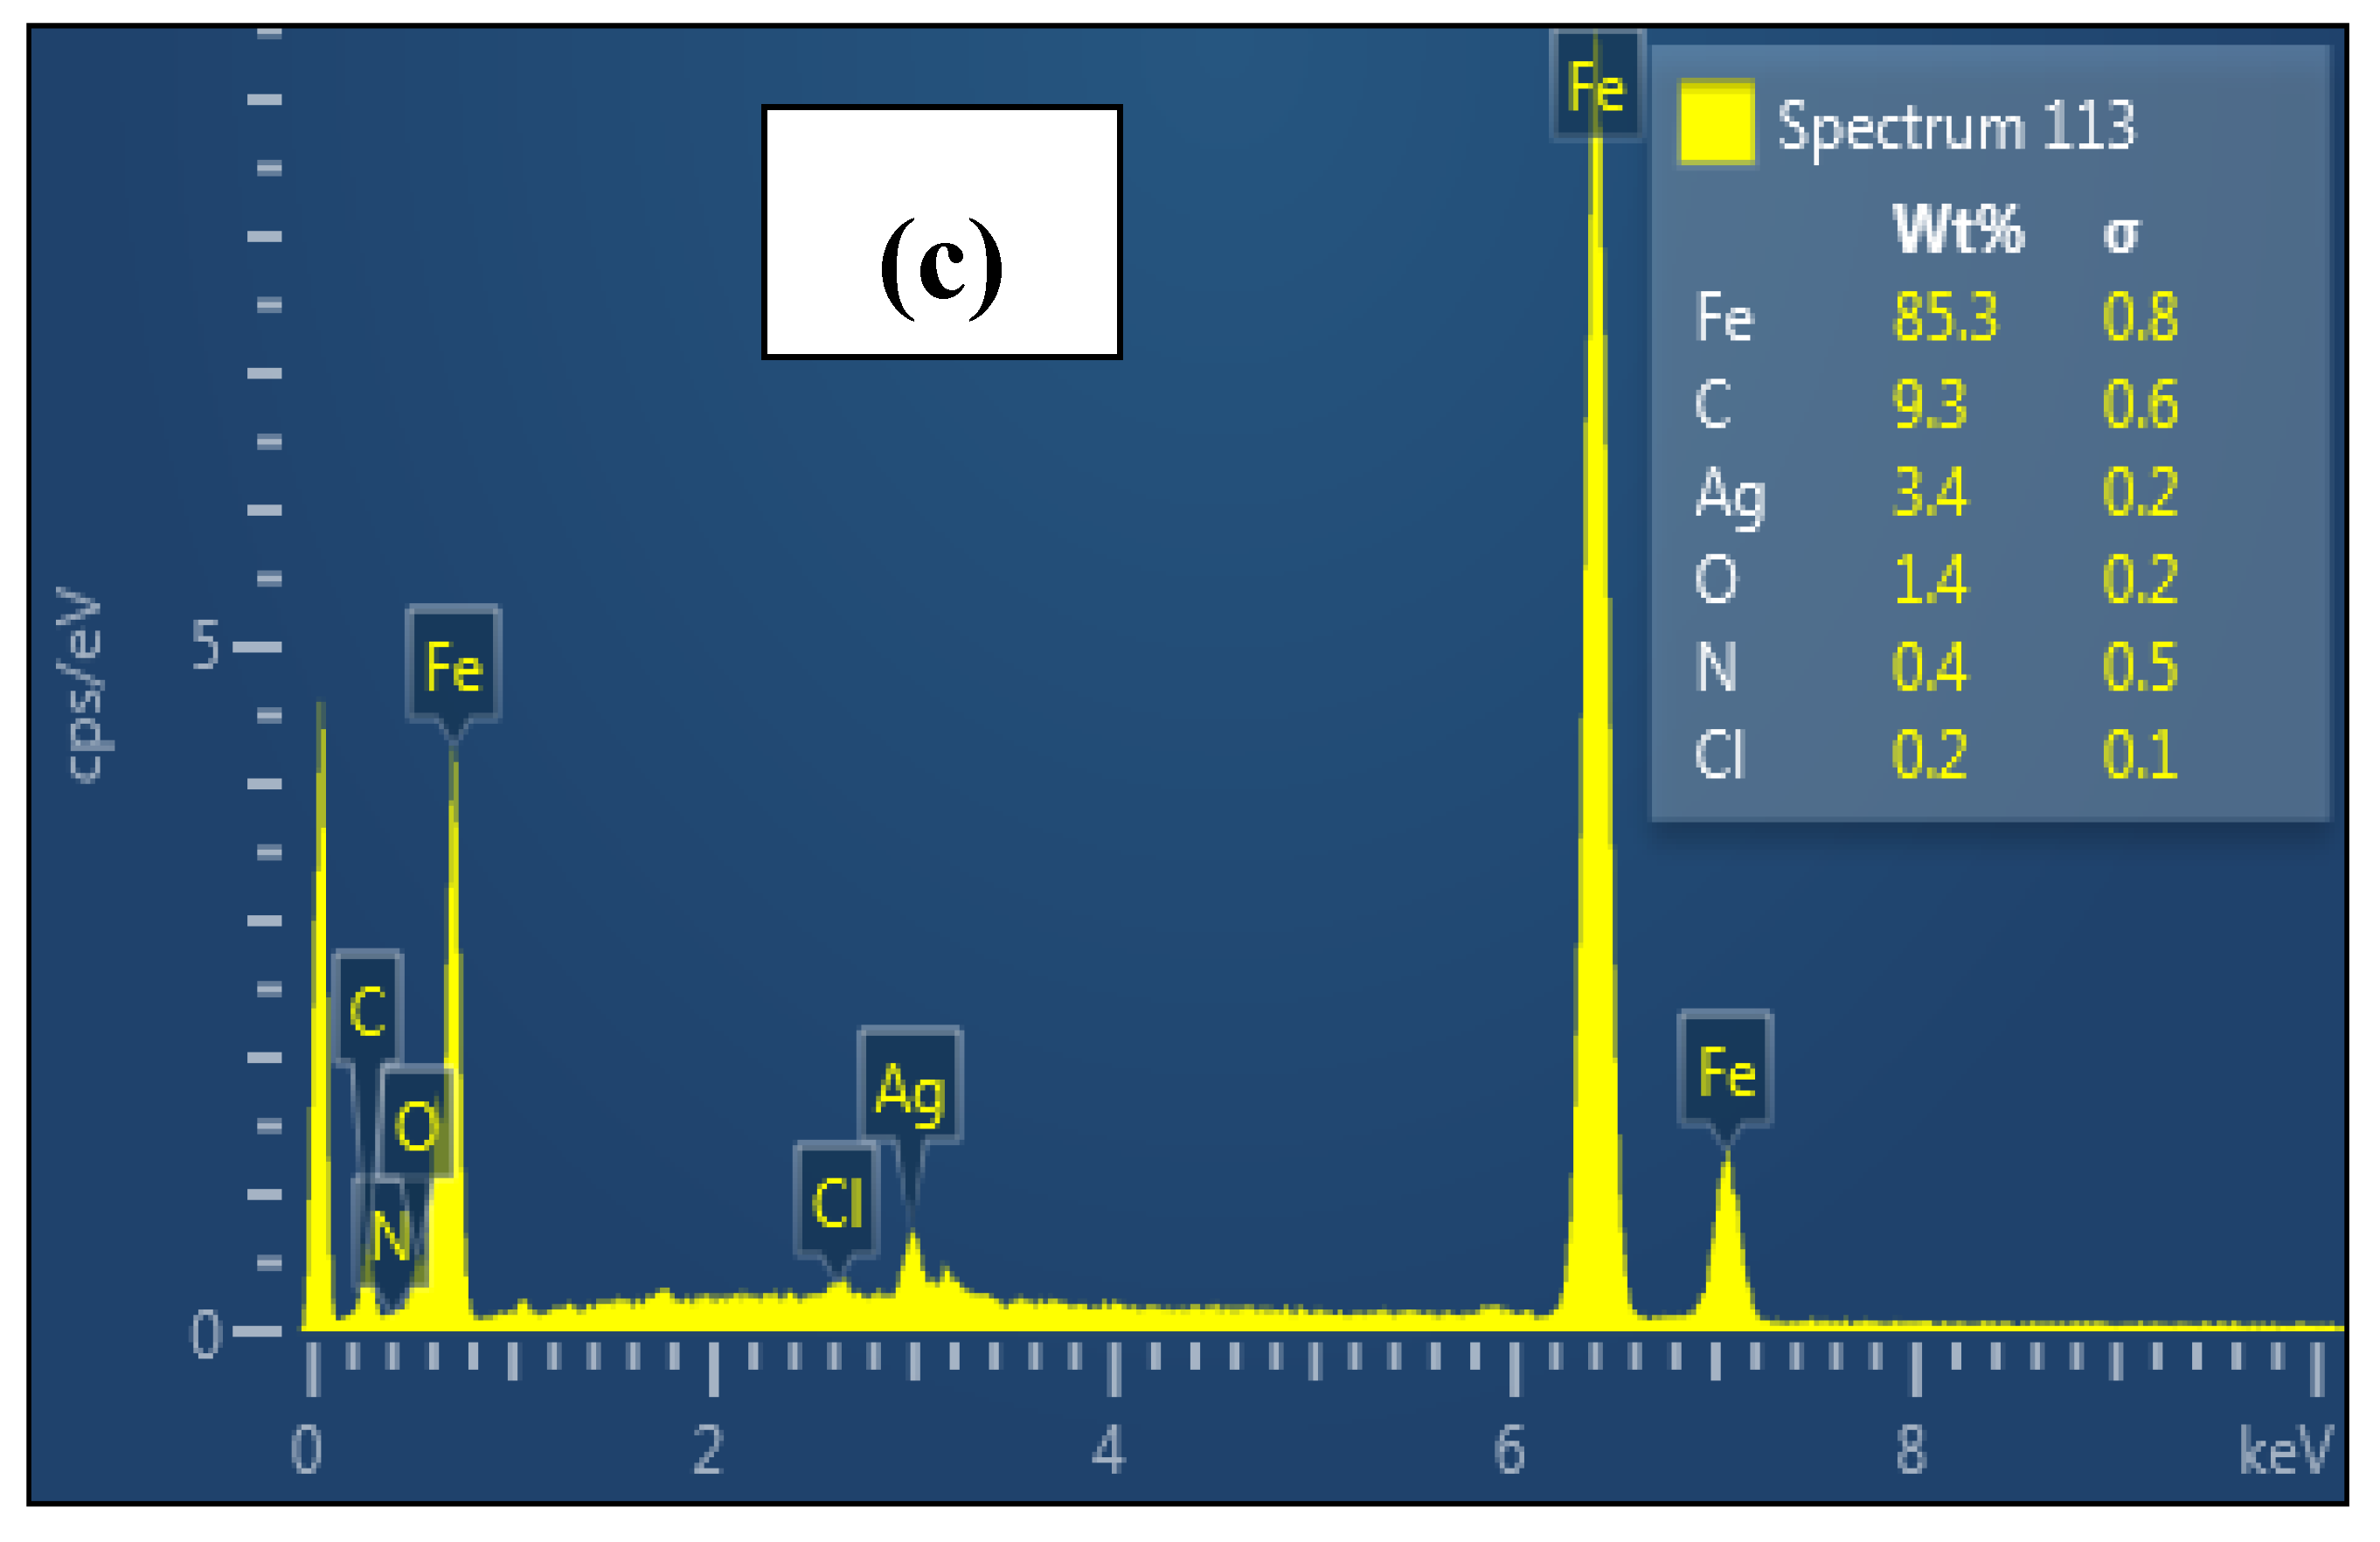
The SEM images of C1018 at the polished state and after immersion in CO2-saturated 3.5% NaCl solution without and with 0.3% Chi–AgNPs composite are depicted in Figure 11. The corresponding EDAX spectra are presented in Figure 12. A rough and damaged surface is seen in Figure 11b in comparison to Figure 11a, which is because of corrosion attack [34,44]. Unarguably, the metal sample was protected from the corrosive attack in the sweet corrosion environment containing the RVE-mediated chitosan–Ag composite as an inhibitor. This is deduced from the relative smooth surface of Figure 11c in comparison to Figure 11b [34,44].
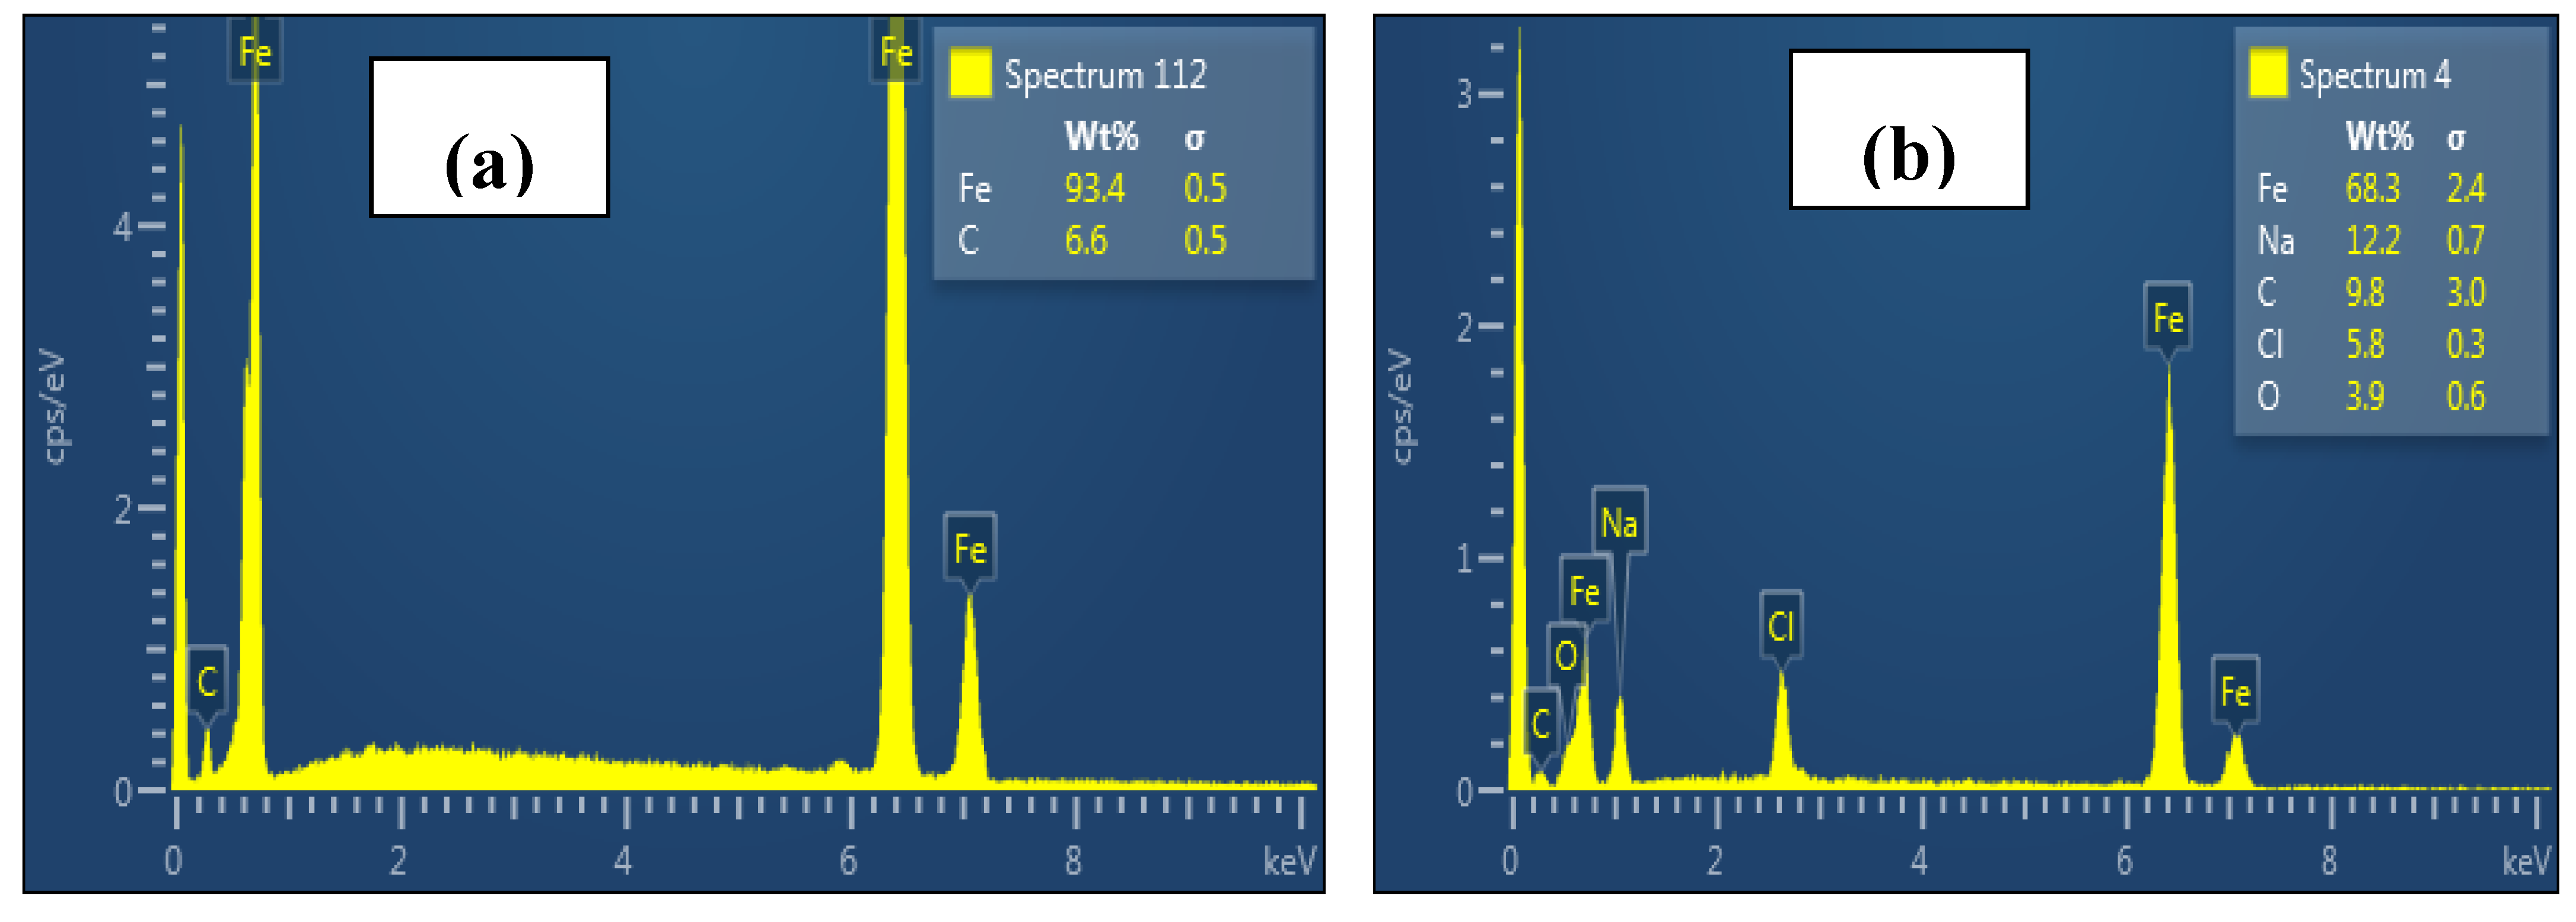
The EDAX spectrum in Figure 12b disclose that the corrosion product is likely to be a mixture of chlorides, oxides, and carbonates. In comparison to the EDAX spectrum in Figure 12a, the Fe content was reduced from 93.4% to 68.3%, while the C contents increased from 6.6% to 9.8%, indicating the breakdown of Fe because of corrosion in the saline environment as the root cause for the observed decrease in the atomic percentage of the Fe content. Additional signals of Na, Cl, and O can also be seen in the EDAX spectrum of Figure 12b. The Cl, Na, and O signals emanate from the corrodent and the corrosion products, respectively. The EDAX spectrum shows that the atomic percentage of Fe was increased compared to the uncontrolled corrodent in the presence of the 0.3% RVE-mediated Chi–AgNPs composite (Figure 12c). There was also an additional Ag element, which may be attributed to composite adsorption. This demonstrates that the composite was adsorbed onto the surface of the C1018 CS to create a shield that prevents further Fe dissolution.
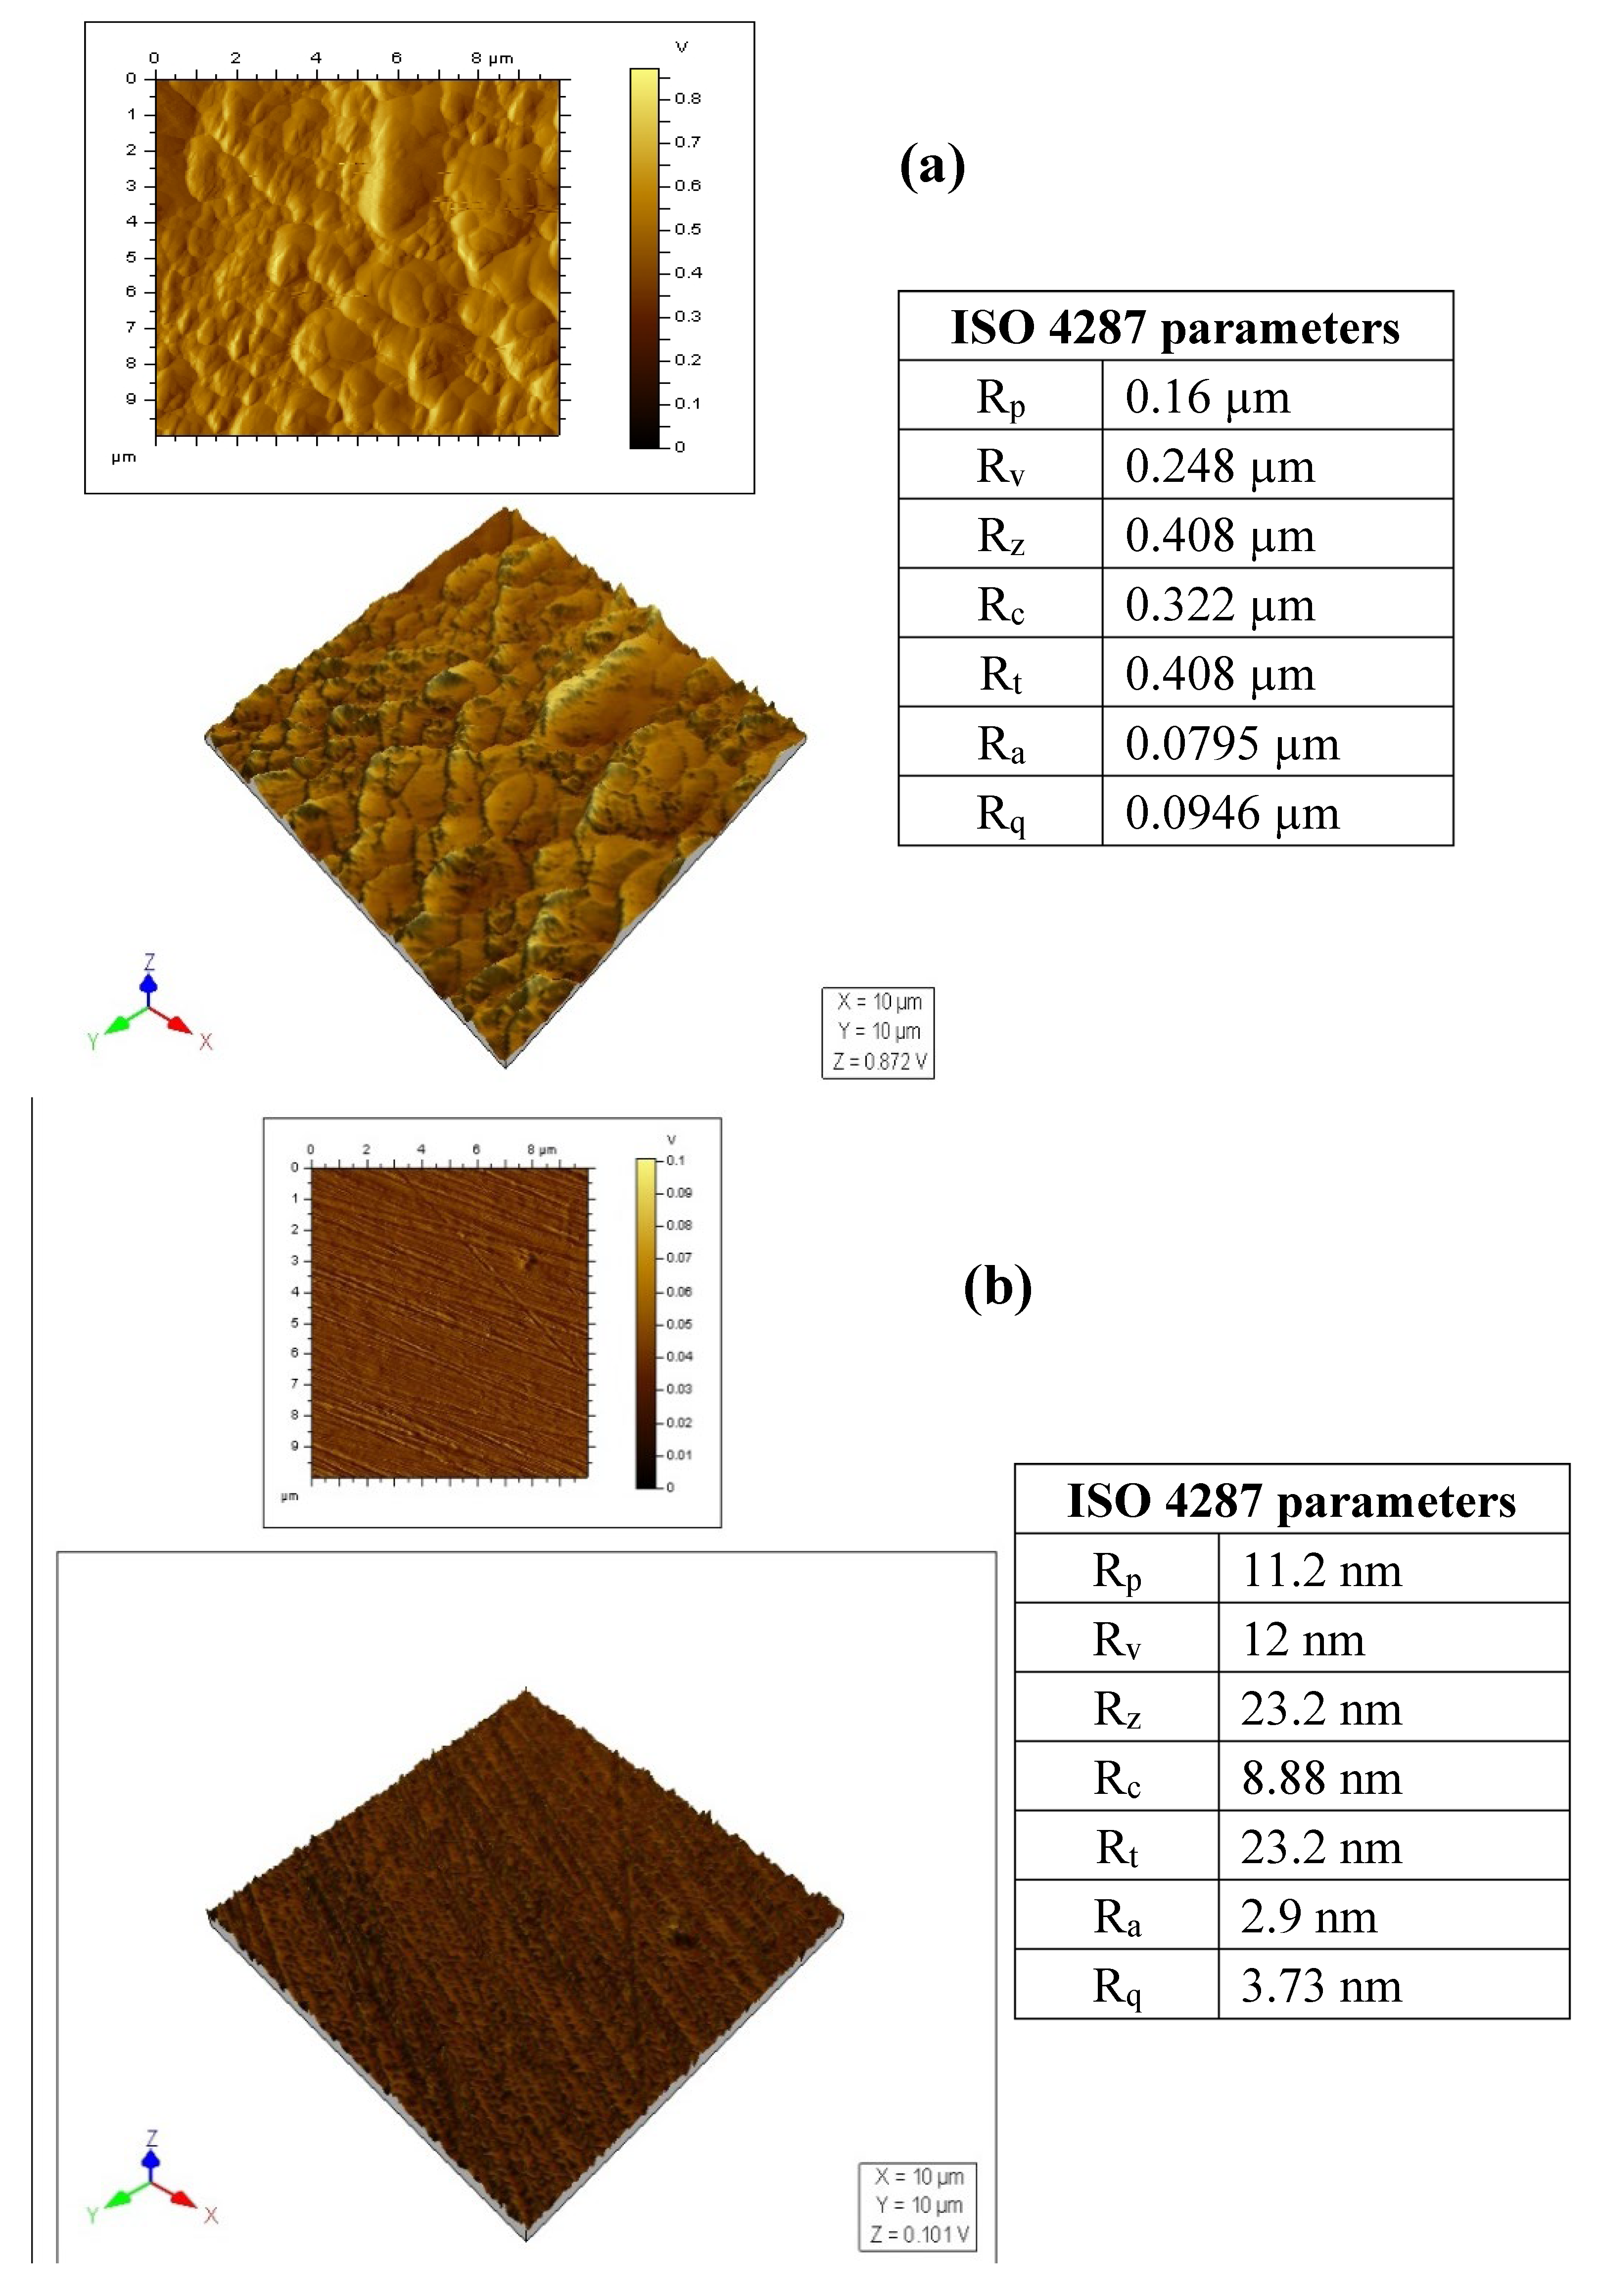
The AFM is a useful tool for correlating corrosion phenomena with surface roughness on corroded surfaces. Figure 13 shows the surface topographies of the C1018 CS after 24 h of sweet corrosion without and with the 0.3% RVE-mediated Chi–Ag composite as 2D and 3D images with corresponding tabulated roughness parameters defined according to ISO 4287 [45]. According to the ISO 4287 classification, there are a number of roughness parameters that can be used to determine the degree of roughness on a surface, including the arithmetic mean roughness (Ra), total height of the roughness profile (Rt), which describes the largest peak-to-valley height, mean roughness depth (Rz), maximum peak height (Rp), average peak-to-valley height (Rz), and root-mean-square deviation of a roughness profile (Rq). Two R values that are frequently used to describe the roughness of a surface are Rt and Rp. Rougher surfaces are indicated by Rt and Rp values of a higher magnitude. The steel surface corroding in the uninhibited 3.5% NaCl solution that is CO2-saturated has the roughest surface and the greatest Rt and Rp values, as shown in Figure 13. As can be seen in Figure 13b, adding 0.3% RVE-mediated Chi–AgNPs composite as a CI significantly reduces the roughness of the corroded steel surface as well as the associated Rt and Rp values.

4. Conclusions

The following conclusions can be drawn based on the results obtained from the study:
RVE-mediated chitosan–AgNPs composite functions as a CI for C1018 CS in sweet (CO2) corrosion environments at ambient temperature;
Inhibition efficiency increased with the rise in dosage up to 0.3% and, thereafter, gradually decline with increase in dosage;
The IE was also found to increase with an increase in immersion time, but decrease with the increase in temperature, with the optimum temperature of 60 °C s found to accelerate corrosion without and with the RVE-mediated Chi–AgNPs composite;
Under hydrodynamic conditions, the chitosan–AgNPs composite shows moderate corrosion inhibition effect under high shear stress;
Surface analysis results from SEM, EDAX, and AFM clearly show that chitosan–AgNPs composite was adsorbed onto the metal surface to produce protective film.

Author Contributions

Conceptualization, S.A.U., M.M.S., A.N. and I.B.O.; Methodology, S.A.U. and M.M.S.; Validation, A.N. and I.B.O.; Formal analysis, S.A.U. and M.M.S.; Investigation, S.A.U., M.M.S. and I.B.O.; Resources, S.A.U. and A.N.; Data curation, S.A.U. and M.M.S.; Writing–original draft, S.A.U.; Writing–review & editing, M.M.S., A.N. and I.B.O.; Project administration, S.A.U. and A.N.; Funding acquisition, S.A.U., A.N. and I.B.O. All authors have read and agreed to the published version of the manuscript.

Funding

This research was funded by Deanship of Research Oversight Coordination, KFUPM, grant number DF181019.

Institutional Review Board Statement

Not applicable.

Informed Consent Statement

Not applicable.

Data Availability Statement

The data presented in this study are available on request from the corresponding author.

Acknowledgments

The authors gratefully acknowledge the support received from the Deanship of Research Oversight and Coordination (DROC), King Fahd University of Petroleum and Minerals (KFUPM), under the project DF 181019.

Conflicts of Interest

The authors declare no conflict of interest.

References

  1. Kermani, M.B.; Morshed, A. Carbon dioxide corrosion in oil and gas production—A compendium. Corrosion 2003, 59, 659–683. [Google Scholar] [CrossRef]
  2. Crolet, J.L.; Bonis, M.R. pH measurements in aqueous CO2 solutions under high pressure and temperature. Corrosion 1983, 39, 39–46. [Google Scholar] [CrossRef]
  3. De Waard, C.; Milliams, D.E. Carbonic acid corrosion of steel. Corrosion 1975, 31, 177–181. [Google Scholar] [CrossRef]
  4. Papavinasam, S.; Revie, R.W.; Bartos, M. Testing methods and standards for oilfield corrosion inhibitors. In Proceedings of the CORROSION, New Orleans, LA, USA, 26–30 March 2004. [Google Scholar]
  5. Guan, H.; Jenkins, A. Testing equipment and procedures suitable to evaluate deepwater scale and corrosion inhibitors. In Proceedings of the CORROSION, Houston, TX, USA, 10–14 March 2011. [Google Scholar]
  6. Ramachandran, S.; Tsai, B.L.; Blanco, M.; Chen, H.; Tang, Y.; Goddard, W.A. Self-assembled monolayer mechanism for corrosion inhibition of iron by imidazolines. Langmuir 1996, 12, 6419–6428. [Google Scholar] [CrossRef]
  7. Shchukin, D.G.; Zheludkevich, M.; Yasakau, K.; Lamaka, S.; Ferreira, M.G.S.; Möhwald, H. Layer-by-layer assembled nanocontainers for self-healing corrosion protection. Adv. Mater. 2006, 18, 1672–1678. [Google Scholar] [CrossRef]
  8. Liu, D.; Qiu, Y.B.; Tomoe, Y.; Bando, K.; Guo, X.P. Interaction of inhibitors with corrosion scale formed on N80 steel in CO2-saturated NaCl solution. Mater. Corros. 2011, 62, 1153–1158. [Google Scholar] [CrossRef]
  9. Öztürk, S.; Yıldırım, A.; Çetin, M.; Tavaslı, M. Synthesis of quaternary, long-chain n-alkyl amides and their corrosion inhibition in acidic media. J. Surfactants Deterg. 2014, 17, 471–481. [Google Scholar] [CrossRef]
  10. Rihan, R.; Shawabkeh, R.; Al-Bakr, N. The effect of two amine-based corrosion inhibitors in improving the corrosion resistance of carbon steel in sea water. J. Mater. Eng. Perform. 2014, 23, 693–699. [Google Scholar] [CrossRef]
  11. Umoren, S.A.; Eduok, U.M. Application of carbohydrate polymers as corrosion inhibitors for metal substrates in different media: A review. Carbohydr. Polym. 2016, 140, 314–341. [Google Scholar] [CrossRef]
  12. Umoren, S.A.; Solomon, M.M. Recent developments on the use of polymers as corrosion inhibitors-a review. Open Mater. Sci. J. 2014, 8, 39–54. [Google Scholar] [CrossRef]
  13. Solomon, M.M.; Gerengi, H.; Umoren, S.A. Carboxymethyl cellulose/silver nanoparticles composite: Synthesis, characterization and application as a benign corrosion inhibitor for St37 steel in 15% H2SO4 medium. ACS Appl. Mater. Interfaces 2017, 9, 6376–6389. [Google Scholar] [CrossRef]
  14. Solomon, M.M.; Umoren, S.A.; Obot, I.B.; Sorour, A.A.; Gerengi, H. Exploration of dextran for application as corrosion inhibitor for steel in strong acid environment: Effect of molecular weight, modification, and temperature on efficiency. ACS Appl. Mater. Interfaces 2018, 10, 28112–28129. [Google Scholar] [CrossRef]
  15. Solomon, M.M.; Gerengi, H.; Kaya, T.; Umoren, S.A. Enhanced corrosion inhibition effect of chitosan for St37 in 15% H2SO4 environment by silver nanoparticles. Int. J. Biol. Macromol. 2017, 104, 638–649. [Google Scholar] [CrossRef]
  16. Solomon, M.M.; Gerengi, H.; Umoren, S.A.; Essien, N.B.; Essien, U.B.; Kaya, E. Gum Arabic-silver nanoparticles composite as a green anticorrosive formulation for steel corrosion in strong acid media. Carbohydr. Polym. 2018, 181, 43–55. [Google Scholar] [CrossRef]
  17. Solomon, M.M.; Umoren, S.A.; Israel, A.U.; Ebenso, E.E. Polypropylene glycol-silver nanoparticle composites: A novel anticorrosion material for aluminium in acid medium. J. Mater. Eng. Perform. 2015, 24, 4206–4218. [Google Scholar] [CrossRef]
  18. Solomon, M.M.; Umoren, S.A.; Abai, E.J. Poly(methacrylic acid)/silver nanoparticles composites: In-situ preparation, characterization and anticorrosion property for mild steel in H2SO4 solution. J. Mol. Liq. 2015, 212, 340–351. [Google Scholar] [CrossRef]
  19. Solomon, M.M.; Umoren, S.A. Performance assessment of poly (methacrylic acid)/silver nanoparticles composite as corrosion inhibitor for aluminium in acidic environment. J. Adhes. Sci. Technol. 2015, 29, 2311–2333. [Google Scholar] [CrossRef]
  20. El-Lateef, H.M.A.; Albokheet, W.A.; Gouda, M. Carboxymethyl cellulose/metal (Fe, Cu and Ni) nanocomposites as non-precious inhibitors of C-steel corrosion in HCl solutions: Synthesis, characterization, electrochemical and surface morphology studies. Cellulose 2020, 27, 8039–8057. [Google Scholar] [CrossRef]
  21. John, S.; Joseph, A.; Jose, A.J.; Narayana, B. Enhancement of corrosion protection of mild steel by chitosan/ZnO nanoparticle composite membranes. Prog. Org. Coat. 2015, 84, 28–34. [Google Scholar] [CrossRef]
  22. Umoren, P.S.; Kavaz, D.; Umoren, S.A. Corrosion inhibition evaluation of chitosan–CuO nanocomposite for carbon steel in 5% HCl solution and effect of KI addition. Sustainability 2022, 14, 7981. [Google Scholar] [CrossRef]
  23. Srivastava, M.; Srivastava, S.K.; Nikhil; Ji, G.; Prakash, R. Chitosan based new nanocomposites for corrosion protection of mild steel in aggressive chloride media. Int. J. Biol. Macromol. 2019, 140, 177–187. [Google Scholar] [CrossRef] [PubMed]
  24. Fetouh, H.A.; Hefnawy, A.; Attia, A.M.; Ali, E. Facile and low-cost green synthesis of eco-friendly chitosan-silver nanocomposite as novel and promising corrosion inhibitor for mild steel in chilled water circuits. J. Mol. Liq. 2020, 319, 114355. [Google Scholar] [CrossRef]
  25. Mobin, M.; Ahmad, I.; Aslam, R.; Basik, M. Characterization and application of almond gum-silver nanocomposite as an environmentally benign corrosion inhibitor for mild steel in 1 M HCl. Mater. Chem. Phys. 2022, 289, 126491. [Google Scholar] [CrossRef]
  26. Obot, I.B.; Ul-Haq, M.I.; Sorour, A.A.; Alanazi, N.M.; Al-Abeedi, T.M.; Ali, S.A.; Al-Muallem, H.A. Modified-polyaspartic acid derivatives as effective corrosion inhibitor for C1018 steel in 3.5% NaCl saturated CO2 brine solution. J. Taiwan Instig. Chem. Eng. 2022, 135, 104393. [Google Scholar] [CrossRef]
  27. Umoren, S.A.; Solomon, M.M.; Nzila, A.; Obot, I.B. Preparation of silver/chitosan nanofluids using selected plant extracts: Characterization and antimicrobial studies against gram-positive and gram-negative bacteria. Materials 2020, 13, 1629. [Google Scholar] [CrossRef] [Green Version]
  28. Khaled, K.F.; Babić-Samardžija, K.; Hackerman, N. Cobalt(III) complexes of macrocyclic-bidentate type as a new group of corrosion inhibitors for iron in perchloric acid. Corros. Sci. 2006, 48, 3014–3034. [Google Scholar] [CrossRef]
  29. Umoren, S.A.; AlAhmary, A.A.; Gasem, Z.M.; Solomon, M.M. Evaluation of chitosan and carboxymethyl cellulose as ecofriendly corrosion inhibitors for steel. Int. J. Biol. Macromol. 2018, 117, 1017–1028. [Google Scholar] [CrossRef]
  30. Jeyaprabha, C.; Sathiyanarayanan, S.; Venkatachari, G. Influence of halide ions on the adsorption of diphenylamine on iron in 0.5 M H2SO4 solutions. Electrochim. Acta 2006, 51, 4080–4088. [Google Scholar] [CrossRef]
  31. Alvarez, P.E.; Fiori-Bimbi, M.V.; Valenti, R.V.; Ruiz Hidalgo, J.; Brandán, S.A.; Gervasi, C.A. Improved electrochemical strategy to characterize adsorption and corrosion inhibition related to biomolecules from plant extracts: The case of Annona cherimola. Results Chem. 2022, 4, 100233. [Google Scholar] [CrossRef]
  32. Obot, I.B.; Onyeachu, I.B.; Umoren, S.A. Alternative corrosion inhibitor formulation for carbon steel in CO2-saturated brine solution under high turbulent flow condition for use in oil and gas transportation pipelines. Corros. Sci. 2019, 159, 108140. [Google Scholar] [CrossRef]
  33. Palimi, M.J.; Tang, Y.; Alvarez, V.; Kuru, E.; Li, D.Y. Green corrosion inhibitors for drilling operation: New derivatives of fatty acid-based inhibitors in drilling fluids for 1018 carbon steel in CO2-saturated KCl environments. Mater. Chem. Phys. 2022, 288, 126406. [Google Scholar] [CrossRef]
  34. Loganathan, K.T.; Thimmakondu, V.S.; Nagarajan, S.; Natarajan, R. Corrosion inhibitive evaluation and DFT studies of 2-(Furan-2-yl)-4,5-diphenyl-1H-imidazole on mild steel at 1.0 M HCl. J. Indian Chem. Soc. 2021, 98, 100121. [Google Scholar]
  35. Desimone, M.P.; Gordillo, G.; Simison, S.N. The effect of temperature and concentration on the corrosion inhibition mechanism of an amphiphilic amido-amine in CO2 saturated solution. Corros. Sci. 2011, 53, 4033–4043. [Google Scholar] [CrossRef] [Green Version]
  36. Okafor, P.C.; Liu, X.; Zheng, Y.G. Corrosion inhibition of mild steel by ethylamino imidazoline derivative in CO2-saturated solution. Corros. Sci. 2009, 51, 761–768. [Google Scholar] [CrossRef]
  37. Zhang, X.; Wang, F.; He, Y.; Du, Y. Study of the inhibition mechanism of imidazoline amide on CO2 corrosion of Armco iron. Corros. Sci. 2001, 43, 1417–1431. [Google Scholar] [CrossRef]
  38. Bentiss, F.; Lebrini, M.; Lagrenée, M. Thermodynamic characterization of metal dissolution and inhibitor adsorption processes in mild steel/2, 5-bis (n-thienyl)-1, 3, 4-thiadiazoles/hydrochloric acid system. Corros. Sci. 2005, 47, 2915–2931. [Google Scholar] [CrossRef]
  39. Poulson, B. Electrochemical measurements in flowing solutions. Corros. Sci. 1983, 23, 391–430. [Google Scholar] [CrossRef]
  40. Onyeachu, I.B.; Obot, I.B.; Sorour, A.A.; Abdul-Rashid, M.I. Green corrosion inhibitor for oilfield application I: Electrochemical assessment of 2-(2-pyridyl) benzimidazole for API X60 steel under sweet environment in NACE brine ID196. Corros. Sci. 2019, 150, 183–193. [Google Scholar] [CrossRef]
  41. Onyeachu, I.B.; Obot, I.B.; Adesina, A.Y. Green corrosion inhibitor for oilfield application II: The time–evolution effect on the sweet corrosion of API X60 steel in synthetic brine and the inhibition performance of 2-(2-pyridyl) benzimidazole under turbulent hydrodynamics. Corros. Sci. 2020, 168, 108589. [Google Scholar] [CrossRef]
  42. Nesic, S.; Postlethwaite, J.; Olsen, S. An electrochemical model for prediction of corrosion of mild steel in aqueous carbon dioxide solutions. Corrosion 1996, 52, 280–294. [Google Scholar] [CrossRef]
  43. Branzoi, V.; Branzoi, F.; Baibarac, M. The inhibition of the corrosion of Armco iron in HCl solutions in the presence of surfactants of the type of N-alkyl quaternary ammonium salts. Mater. Chem. Phys. 2000, 65, 288–297. [Google Scholar] [CrossRef]
  44. Iravani, D.; Esmaeili, N.; Berisha, A.; Akbarinezhad, E.; Aliabadi, M.H. The quaternary ammonium salts as corrosion inhibitors for X65 carbon steel under sour environment in NACE 1D182 solution: Experimental and computational studies. Colloids Surf. A Physicochem. Eng. Asp. 2023, 656, 130544. [Google Scholar] [CrossRef]
  45. ISO 4287:1997. Geometrical Product Specifications (GPS)—Surface Texture: Profile Method—Terms, Definitions and Surface Texture Parameters. ISO. Available online: https://www.iso.org/standard/10132.html (accessed on 11 October 2022).
Figure 1. OCP—time plot for C1018 carbon steel in CO2-saturated 3.5% NaCl without and with different concentrations of RVE-mediated chitosan–AgNPs composite at 25 °C.
Sustainability 14 16142 g001
Figure 2. Impedance plots for C1018 carbon steel in CO2-saturated 3.5% NaCl without and with different concentrations of RVE-mediated Chi–AgNPs composite at 25 °C in (a) Nyquist and (b) Bode formats.
Sustainability 14 16142 g002
Figure 3. (a) Equivalent circuit used to fit experimental data; simulated and experimentally generated impedance diagrams for C1018 carbon steel in CO2-saturated 3.5% NaCl (b,c) without and with 0.3% composite; (d,e) without and with 0.3% composite after 6 h immersion time, and (f,g) without and with 0.3% composite at 2000 rpm all at 25 °C.
Sustainability 14 16142 g003aSustainability 14 16142 g003b
Figure 4. Potentiodynamic polarization plot for C1018 carbon steel in CO2-saturated 3.5% NaCl without and with different concentrations of RVE-mediated Chi–AgNPs composite at 25 °C.
Sustainability 14 16142 g004
Figure 5. Impedance plots for C1018 carbon steel in CO2-saturated 3.5% NaCl without (a,b) and with 0.3% concentration of RVE-mediated Chi–AgNPs composite (c,d) at 25 °C at different immersion times in Nyquist and Bode formats.
Sustainability 14 16142 g005
Figure 6. Potentiodynamic polarization plots for C1018 carbon steel in CO2-saturated 3.5% NaCl without and with 0.3% concentration of RVE-mediated Chi–AgNPs composite at 25 °C after 24 h immersion.
Sustainability 14 16142 g006
Figure 7. Impedance plots for C1018 carbon steel in CO2-saturated 3.5% NaCl without (a,b) and with 0.3% concentration of RVE-mediated Chi–AgNPs composite (c,d) at different temperatures in Nyquist and Bode formats.
Sustainability 14 16142 g007
Figure 8. Potentiodynamic polarization plots for C1018 carbon steel in CO2-saturated 3.5% NaCl (a) without and (b) with 0.3% concentration of RVE-mediated Chi–AgNPs composite at different temperatures.
Sustainability 14 16142 g008
Figure 9. Impedance plots for C1018 carbon steel in CO2-saturated 3.5% NaCl without (a,b) and with 0.3% concentration of RVE-mediated Chi–AgNPs composite (c,d) at different rotation speeds in Nyquist and Bode formats.
Sustainability 14 16142 g009
Figure 10. Potentiodynamic polarization plots for C1018 carbon steel in CO2-saturated 3.5% NaCl (a) without and (b) with 0.3% concentration of RVE-mediated Chi–AgNPs composite at different rotation speeds.
Sustainability 14 16142 g010
Figure 11. SEM micrographs of C1018 carbon steel in (a) polished state, (b) immersed in CO2-saturated 3.5% NaCl solution, and (c) immersed in CO2-saturated 3.5% NaCl solution containing 0.3% Chi–AgNPs composite at 25 °C.
Sustainability 14 16142 g011
Figure 12. EDAX spectra of C1018 carbon steel in (a) polished state, (b) immersed in CO2-saturated 3.5% NaCl solution, and (c) immersed in CO2-saturated 3.5% NaCl solution containing 0.3% Chi–AgNPs composite at 25 °C.
Sustainability 14 16142 g012aSustainability 14 16142 g012b
Figure 13. AFM micrographs of C1018 carbon steel (a) immersed in CO2-saturated 3.5% NaCl solution and (b) immersed in CO2-saturated 3.5% NaCl solution containing 0.3% Chi–AgNPs composite at 25 °C.
Sustainability 14 16142 g013
Table 1. Electrochemical impedance spectroscopy parameters for the corrosion of C1018 carbon steel in CO2-saturated 3.5% NaCl solution without and with different concentrations of chitosan–AgNPs composite at 25 °C.
Conc.Rs
(Ω cm2)
CPEfRf
(Ω cm2)
CPEdlRct
(Ω cm2)
(Rp = Rf + Rct)
(Ω cm2)
Cdl
(µFcm−2)
χ2
(×10−3)
IE (%)
Yf
(µFcm−2 sn−1)
nfYdl
(µF cm−2 sn−1)
ndl
Blank1.22895.01.0016.001990.00.9132.148.101069.084.60
0.1%1.82519.61.0018.68773.00.79184.6203.28293.041.4276.34
0.3%1.68217.01.0018.59319.40.80541.8560.39114.047.7792.67
0.4%1.63684.31.0029.73588.10.81305.8335.48309.052.7685.66
0.5%1.62385.31.0016.77598.30.82221.1237.82243.051.0079.77
0.7%1.69791.91.0019.64971.90.8699.3118.94540.050.1659.56
1.0%1.74931.01.0013.621400.00.8088.3101.93584.045.5152.80
Table 2. Potentiodynamic polarization and linear polarization resistance parameters for the corrosion of C1018 carbon steel in CO2-saturated 3.5% NaCl solution without and with different concentrations of chitosan–AgNPs composite at 25 °C.
PDP MeasurementsLPR Measurements
System/
Concentration
–Ecorr
(mV/Ag/AgCl)
icorr
(µA cm−2)
βa
(mV dec−1)
Corrosion Rate (mpy)IE (%)Rp
(Ω cm2)
IE
(%)
Blank675.36545.5362.7747.63-54.46-
0.1% composite606.25102.7575.398.9781.16219.9775.24
0.3% composite616.9752.2587.284.5690.42573.9790.51
0.4% composite600.4955.5660.954.8589.82372.6185.38
0.5% composite612.4788.9778.667.7783.69281.0080.62
0.7% composite634.64411.11105.6635.8924.64121.2555.08
1.0% composite644.18454.1494.8439.6516.75101.8646.53
Table 3. Electrochemical impedance spectroscopy parameters for the corrosion of C1018 carbon steel in CO2-saturated 3.5% NaCl solution without and with 0.3% chitosan–AgNPs composite at different immersion times at 25 °C.
System/
Time
Rs
(Ω cm2)
CPEfRf
(Ω cm2)
CPEdlRct
(Ω cm2)
(Rp = Rf + Rct)
(Ω cm2)
Cdl
(mFcm−2)
χ2
(×10−3)
IE (%)
Yf
(µFcm−2 sn−1)
nfYdl
(µF cm−2 sn−1)
ndl
Blank
1 h1.78818.01.009.291698.00.8532.7041.99764.033.53-
6 h1.421860.01.0011.183658.00.8226.5537.731589.053.09-
12 h1.542504.01.0011.974456.00.8026.2438.211938.042.42-
24 h1.463368.01.0010.884281.50.8722.7433.622659.053.89-
0.3% Composite
1 h1.74684.11.0025.23597.50.85144.3169.53369.036.3775.23
6 h1.56975.61.0045.42477.30.84297.4342.82403.045.5088.99
12 h1.57969.11.0034.87400.50.84400.5435.32378.045.0091.22
24 h1.61943.30.9949.22379.60.87408.8458.02395.043.1292.67
Table 4. Potentiodynamic polarization and linear polarization resistance parameters for the corrosion of C1018 carbon steel in CO2-saturated 3.5% NaCl solution without and with 0.3% chitosan–AgNPs composite at different immersion times at 25 °C.
PDP MeasurementsLPR Measurements
System/
Concentration
Immersion
Time (h)
–Ecorr
(mV/Ag/AgCl)
icorr
(µA cm−2)
βa
(mV dec−1)
Corrosion Rate (mpy)IE (%)Rp
(Ω cm2)
IE
(%)
1-----55.08-
Blank6-----41.23-
12-----37.78-
24682.29438.5077.9938.28-34.94-
1-----186.1270.41
0.3% composite6-----365.1888.71
12-----474.2692.03
24633.4949.1471.594.2988.79519.6393.28
Table 5. Electrochemical impedance spectroscopy parameters for the corrosion of C1018 carbon steel in CO2-saturated 3.5% NaCl solution without and with 0.3% chitosan–AgNPs composite at different temperatures.
System/
Temperature
Rs
(Ω cm2)
CPEfRf
(Ω cm2)
CPEdlRct
(Ω cm2)
(Rp = Rf + Rct)
(Ω cm2)
Cdl
(mFcm−2)
χ2
(×10−3)
IE (%)
Yf
(µFcm−2 sn−1)
nfYdl
(µF cm−2 sn−1)
ndl
Blank
25 °C1.22895.01.0016.001990.00.9132.1048.101069.084.60-
40 °C1.202624.00.890.852399.00.7429.0729.92667.01.58-
60 °C0.902000.00.800.201085.00.8123.3023.50311.01.42-
0.3% Composite
25 °C1.68217.01.0018.59319.40.80541.8560.39114.047.7792.67
40 °C1.60626.51.005.35130.450.7860.7766.12151.021.9555.49
60 °C0.922416.00.847.351495.00.966.4613.81962.00.68−0.70
Table 6. Potentiodynamic polarization and linear polarization resistance parameters for the corrosion of C1018 carbon steel in CO2-saturated 3.5% NaCl solution without and with 0.3% chitosan–AgNPs composite at different at temperatures.
PDP MeasurementsLPR Measurements
System/
Concentration
Temperature
(°C)
–Ecorr
(mV/Ag/AgCl)
icorr
(µA cm−2)
βa
(mV dec−1)
Corrosion Rate (mpy)IE
(%)
Rp
(Ω cm2)
IE
(%)
25675.36545.5362.7747.63-54.46-
Blank40686.92743.0648.4464.87-32.31-
60678.77828.2740.1772.31-26.85-
25616.9752.2587.284.5690.42573.9790.51
0.3% composite40658.19358.2262.2231.2751.7975.9457.45
60662.441494.0060.11130.48−80.3817.89−50.08
Table 7. Hydrodynamic parameters calculated as a function of sample rotation speed during the sweet corrosion of C1018 carbon steel in CO2-saturated 3.5% NaCl solution.
Rotation Speed (rpm)u (m/s)Reτ (Pa)
5000.36652470.831
20001.46521,0028.780
Table 8. Electrochemical impedance spectroscopy parameters for the corrosion of C1018 carbon steel in CO2-saturated 3.5% NaCl solution without and with 0.3% chitosan–AgNPs composite at different rotation speeds.
System/
Rotation Speed
Rs
(Ω cm2)
CPEfRf
(Ω cm2)
CPEdlRct
(Ω cm2)
(Rp = Rf + Rct)
(Ω cm2)
Cdl
(mFcm−2)
χ2
(×10−3)
IE (%)
Yf
(µFcm−2 sn−1)
nfYdl
(µF cm−2 sn−1)
ndl
Blank
0 rpm2.56223.30.9572.6585.60.99153.5226.15121.06.59-
500 rpm3.6359.41.0037.32138.20.81228.5265.7742.935.89-
2000 rpm2.77227.20.9639.25181.90.86184.1223.3597.54.13-
0.3% Composite
0 rpm2.21304.00.9716.25181.70.86454.8471.00121.03.7451.99
500 rpm2.47209.21.0091.73165.70.87455.4547.13110.047.0951.42
2000 rpm2.64297.50.9922.78232.30.79446.1468.83108.02.3752.24
Publisher’s Note: MDPI stays neutral with regard to jurisdictional claims in published maps and institutional affiliations.