Article

The Fuel Cycle Carbon Reduction Effects of New Energy Vehicles: Empirical Evidence Based on Regional Data in China

Economics and Management School, Wuhan University, Wuhan 430072, China
*
Author to whom correspondence should be addressed.
Sustainability 2022, 14(23), 16003; https://doi.org/10.3390/su142316003
Submission received: 11 October 2022 / Revised: 26 November 2022 / Accepted: 29 November 2022 / Published: 30 November 2022
(This article belongs to the Section Sustainable Transportation)

Abstract

:
With ever-growing energy demands and increasing greenhouse gas (GHG) emissions, carbon emission reduction has attracted worldwide attention. This article establishes a bottom-up method using regional data from 2010 to 2020 to quantify the carbon reduction effects of new energy vehicles (NEVs) in the fuel cycle. From this, a generalized Bass model with outstanding performance was created (with a goodness-of-fit of 99.7%) to forecast CO2 emission reduction potential in 2030 and 2050. The results are as follows: (1) there are regional differences in the fuel cycle carbon reduction effects of NEVs in all six regions, with the Central China power grid having the strongest ability to reduce emissions, while the Northeast and Northwest grids have relatively low carbon reduction effects. (2) Battery electric vehicles (BEVs) have the strongest CO2 emission reduction effect, while fuel cell vehicles (FCVs) have the most potential. (3) Under the baseline scenario, the carbon reduction of NEVs will be 2992 million tons in 2030 and reach 11,559 million tons in 2050, which is far from carbon neutrality. Further, policy implications, including the tailoring of policies to specific regions and upgrading the energy mix, are proposed to reduce further carbon emissions.

1. Introduction

There is consensus in the scientific community that economic growth is closely related to energy demand. As major economies continue to rely heavily on fossil fuels as their main energy source, the detrimental impacts of this on climate change cannot be ignored [1]. Since the Paris Agreement was signed, a series of research pieces have shown that a reduction in energy demand contributes to reducing carbon emissions and mitigating climate change [2,3,4]. Yet, global energy demand continues to increase, and in 2021, the growth rate reached 4.6%, surpassing pre-COVID-19 levels [5]. In the face of the daunting problems of energy sustainability, the innovation and adoption of clean energy technologies has been accelerated to ensure transit to net zero emissions among all industries. The transport sector, with the highest reliance on fossil fuels of any sector, plays a crucial role in reducing carbon emissions. The adoption and promotion of new energy vehicles (NEVs), including battery electric vehicles (BEVs), plug-in hybrid vehicles (PHEVs), and fuel cell vehicles (FCVs), are considered to represent a major approach for the decarbonization of road transport [6].
Whether or not NEVs have carbon emission reduction effects has long been questioned. Thus, examining the effectiveness of NEVs in carbon reduction with high accuracy is of vital importance. In response, numerous scholars have actively explored such an area and proved that electric vehicles are zero-emission vehicles when in use. Moriarty and Wang (2017) demonstrated that NEVs are effective in reducing GHGs for road transport in urban areas [7]. Yuan, Liu, and Zuo (2015) also came to the same conclusion, believing that NEVs can reduce the energy dependence of the transport sector on petroleum, thereby reducing carbon emissions [8]. Helmers determined that BEVs are useful for mitigating CO2 emissions by using data from 59 countries and regions [9]. However, from the perspective of the whole life cycle, some scholars argue that NEVs transfer carbon emissions to vehicle and battery production, power generation, and charging. Ma et al. (2012) suggested that a life cycle assessment (LCA) should be conducted to properly assess the true ability of NEV contribution towards GHG emissions reduction [10]. A number of studies have adopted the WTW approach, a specific type of LCA for policy support, to analyze the energy consumption and GHG emissions of NEVs [11,12]. A well-to-wheel (WTW) analysis, considering the fuel cycle on buses, carried out by Jwa and Lim (2018) showed the advantages of NEVs over internal combustion engine vehicles (ICEVs) in terms of energy use and emissions [13]. Campanari et al. (2009) performed a WTW analysis of BEVs and FCVs and concluded that BEVs were efficient only for a limited driving range since a long driving distance required larger battery capacities and heavier batteries, which directly rely on the operating condition [14].
In order to further forecast the carbon emission reduction potential of NEVs, their ownership should be forecasted preliminarily. To date, studies on NEV ownership forecasts mainly fall into two categories: the influencing factors for NEV ownership and those forecasting methods referencing ICEVs [15,16,17,18]. As for the factors influencing NEV ownership, there are three main aspects in previous research: consumer preferences, policies and regulations, and NEV-related technologies. Among such factors, the existence of available charging piles is proven to have a positive correlation with NEV ownership [19]. As for forecasting methods, they typically include logistic curve forecasting models, random utility-based models, regression analysis methods, GM (1,1) models, BP neural network models, etc. [20,21,22]. Among them, the Bass model is the most promising, resulting in high prediction accuracy.
For China, which is the largest carbon emitter and a highly energy-dependent importer, a transition to low-carbon emissions is vital for carbon reduction around the world. In 2021, China’s total carbon dioxide emissions reached 11.9 billion tons, with 11% contributed by the transportation sector. According to the China Energy Statistical Yearbook (2021), in 2020, the proportion of petroleum used in the transportation industry was the largest, which accounted for 80.87%. Additionally, natural gas and electricity were also significant at 12.59% and 5.88%, respectively. Based on the definition from the China Association of Automobile Manufacturers (CAAM), the BEVs discussed in this study represent the type of electric vehicle that is powered only by the chemical energy stored in the rechargeable battery packs without using other secondary energy sources. PHEVs expand on the concept of the standard hybrid vehicle by being partially powered by fossil fuels, meaning they have both an internal combustion engine and a battery-powered electric motor. The battery pack used in this type of car can be charged by plugging the charging cable into an external power source, or it can also be charged by the alternator powered by the on-board internal combustion engine. FCVs represent a type of vehicle that is powered by its own fuel cell. The fuel cell used in this type of vehicle uses the electric energy generated by the redox reaction of oxygen and compressed hydrogen in the air as the power source. In 2020, the penetration of BEVs, PHEVs, and FCVs accounted for 81.6%, 18%, and 0.3%, respectively. At the general debate of the 75th session of the United Nations General Assembly (UNGA), China pledged to achieve a peak in emissions by 2030 and strive toward carbon neutrality by 2060 [23]. CO2 emissions are dependent on the CO2 intensity of the generation mix and also on the emission control technology in thermal power plants. Although previous studies mainly focused on carbon emission reduction in China overall without analyzing regional situations, the generation mix varies considerably in different regions, as does the power generation process connecting different power grids. When taking this into consideration, regional data are more suitable for the analysis of the effects of CO2 emission reduction in China and other similar countries with vast territories.
In order to address the carbon reduction effects of NEVs, this study first implemented a bottom-up method to quantify the fuel cycle CO2 emission reduction for NEVs by dividing China into six regions based on the location of the six largest interprovincial power grids in China. Second, this study further constructed an improved forecasting model for NEV ownership. Third, an empirical analysis was carried out using relevant data from the NEV market, with the data adjusted by introducing the exogenous shock of COVID-19 [24]. Finally, differentiated implementation policies for different regions are provided for the development of NEVs.

2. Data and Methodology

2.1. Data

This study takes China, a major carbon emitter, as the study object for its large sample size and practical importance. As discussed above, three types of NEV technologies in the 4-wheel (4W) segment are emphasized in this study according to the classification of the China Association of Automobile Manufacturers (CAAM) as BEVs, PHEVs, and FCVs, representing the current mainstream electrification pathways for road vehicles in China.
To assess the regional carbon reduction effects in the fuel cycle, regional data on NEV stock was obtained from the Traffic Administration Bureau of the Ministry of Public Security (TABMPS) in China [25]. For missing data, we used regional population and regional Gross Domestic Product (GDP) to estimate the NEV stock. The regional population and GDP were retrieved from the 7th population census and the 2020 China Statistical Yearbook. The mileage data of the NEVs was obtained from “New Energy Vehicle Big Data Research Report” [26] and the “New Energy Vehicle National Big Data Alliance Briefing” [27] released by the National Big Data Alliance of New Energy Vehicles (NDANEV), including the annual accumulative mileage classified by vehicle type (passenger cars, buses, and trucks) and NEV technologies (BEVs, PHEVs, and FCVs). Based on solid previous research, in this study, charging piles were used to represent the infrastructure condition. The data represents charging pile stocks, and the charging data were obtained from the China Electric Vehicle Charging Infrastructure Promotion Alliance (EVCIPA). The time span for the data used for prediction is from 2010 to 2020. All the data in the research were measured annually. To process the data and improve assessment accuracy, the data in 2020 was adjusted by introducing the strike of COVID-19 to reflect the true value of that year. The main indicators used for the assessment of the carbon reduction effects and NEV stock are listed in Table 1.

2.2. Methodology

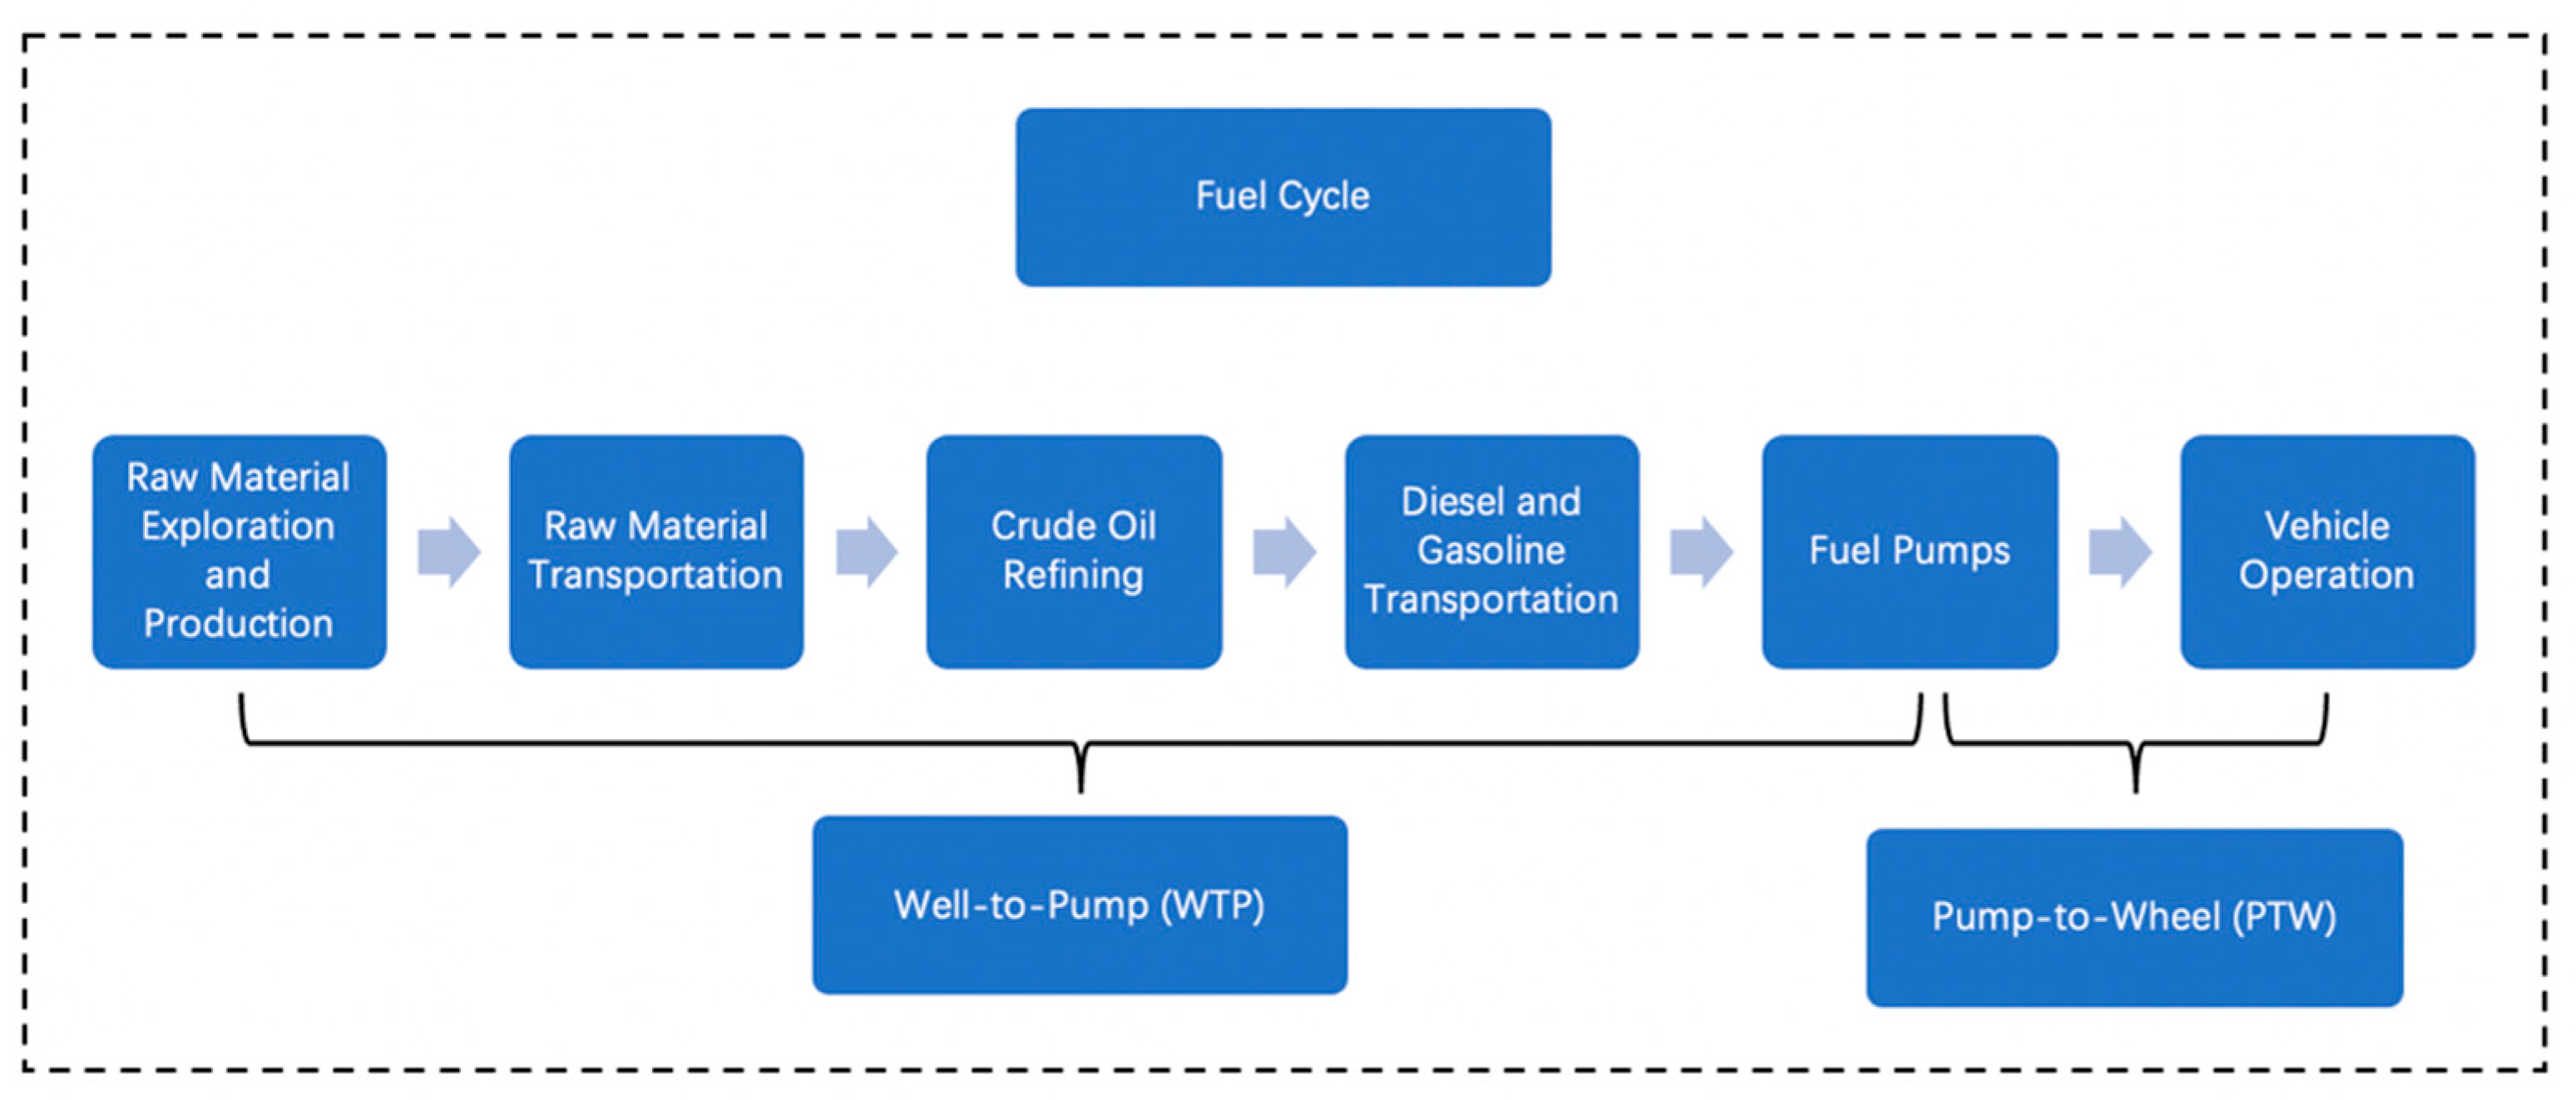
2.2.1. Fuel Cycle Carbon Reduction Effects

Fuel cycle analysis is a dominant method used to assess GHGs and energy savings in the transport sector, especially when assessing policy options or regulation efficiency [12,28]. Also known as the well-to-wheels (WTWs) method, it covers the life cycle of fuel, including its end use in the vehicle [10]. The fuel cycle or WTW approach has two stages: the well-to-tank (WTT) stage and the tank-to-well (TTW) stage. The WTT stage describes the fuel production processes, and the TTW stage is related to fuel delivery. The process of the overall fuel cycle is shown in Figure 1.
In contrast to previous, commonly used top-down approaches, in this study, we used a bottom-up approach to calculate carbon emissions based on the IPCC guide for regional CO2 to provide a thorough analysis and explore the underlying logic. As is with the 2006 IPCC Guidelines, the underlying logic for the most commonly adopted approach is to combine information on human activities with coefficients to quantify emissions per unit of activity [29]. The basic equation is Equation (1).
E m i s s i o n s = A D × E F
where AD is the activity data used to quantify human activity, and EF is the emission factors.
Thus, the total carbon emissions calculated through the method equal the total carbon emissions for every energy source by integrating energy unit conversion, energy carbon emission factors, and converted energy consumption.
For the WTW stage, the CO2 emissions of BEVs, PHEVs, and FCVs are calculated separately first, before being integrated together. BEVs are powered by pure electricity from rechargeable battery packs with no secondary source of power. The total power consumption of BEVs is the sum of the electricity consumed by the BEVs and the losses in the electricity transmission process, which can be calculated using Equation (2).
P C B E V = β B E V × L γ t r a n
where P C B E V denotes the total power consumption of BEVs; β B E V denotes the power consumption per km; L is the driving distance, and γ t r a n is the power transmission efficiency. For PHEVs, both fuel and electricity are consumed, resulting in an operation that is divided into the charge-depleting (CD) range and the charging sustaining (CS) range [30]. In the CD range, PHEVs operate on electricity, while in the CS range, they rely on fuel. The utility factor (UF) of the PHEVs is defined to measure the ratio of the CD range to the total driving distance, as shown in Equation (3).
U F = L E L E + L F = L E L
where UF denotes the utility factor of PHEVs; L E is the CD range; L F is the CS range, and L is the total driving distance.
Then, the total power consumption of PHEVs can be estimated by Equation (4).
P C P H E V = β P H E V × L × U F γ t r a n
where UF is the utility factor of PHEVs; L E is the CD range; L F is the CS range, and L is the total driving distance.
For FCVs, the fuel cells are used to power their onboard electric motors by generating electricity from oxygen and compressed hydrogen. Thus, the total power consumption of FCVs is 0: P C P H E V = 0 .
The total power consumption of NEVs is the sum of the total power consumption of BEVs, PHEVs, and FCVs, which can be estimated by Equation (5).
P C N E V = P C B E V + P C P H E V
WTT CO2 emissions of NEVs can be assessed as in Equation (6):
E W T T ,     N E V = P C N E V × α T P × 1 2 A i H i ( c 1 i + c 2 i )
where E W T T ,   N E V is the CO2 emission in the WTT stage; α T P is the share of thermal power generation in the region; A i is the share of coal and natural gas in thermal power generation; H i is the amount of fuel required to produce 1 k Wh electricity; c 1 i is the CO2 emissions during fuel production; c 2 i is the CO2 emissions during fuel combustion; and i = 1 ,   2 represents the coal and natural gas, respectively, in the region.
The production of fuel consumed by ICEVs also emits a certain amount of CO2, which can be estimated by Equation (7).
E W T T , I C E V = β I C E V × L × c 1
where β I C E V is the fuel consumption per km for ICEVs; L is the driving distance, and c 1 is the CO2 emissions in the fuel production.
For the TTW stage, BEVs and FCVs do not generate CO2 in the process of driving, so their CO2 emission in the TTW stage is zero. PHEVs only emit CO2 in the CS range, but their CD range matters the most. Therefore, in this paper, we only focus on CO2 emission reduction during the driving distance powered by electricity. Therefore, in the TTW stage of the PHEVs, the CO2 emissions are 0. The CO2 emissions of the PHEVs in the TTW stage are also considered to be zero, so the CO2 emissions of NEVs in the TTW stage are zero, that is, E T T W , N E V = 0 .
The CO2 emissions of ICEVs come from the combustion of fuel, and it can be estimated by Equation (8):
E W T T , I C E V = β I C E V × L × c 2
where c 2 is the CO2 emissions from fuel combustion.
Following the above process, the carbon emission reduction of NEVs in a region can be obtained by Equation (9).
C R W T W = E W T T , I C E V + E T T W , I C E V E T T W , N E V
where C R W T W is the CO2 emission reduction of NEVs during the WTW phase.

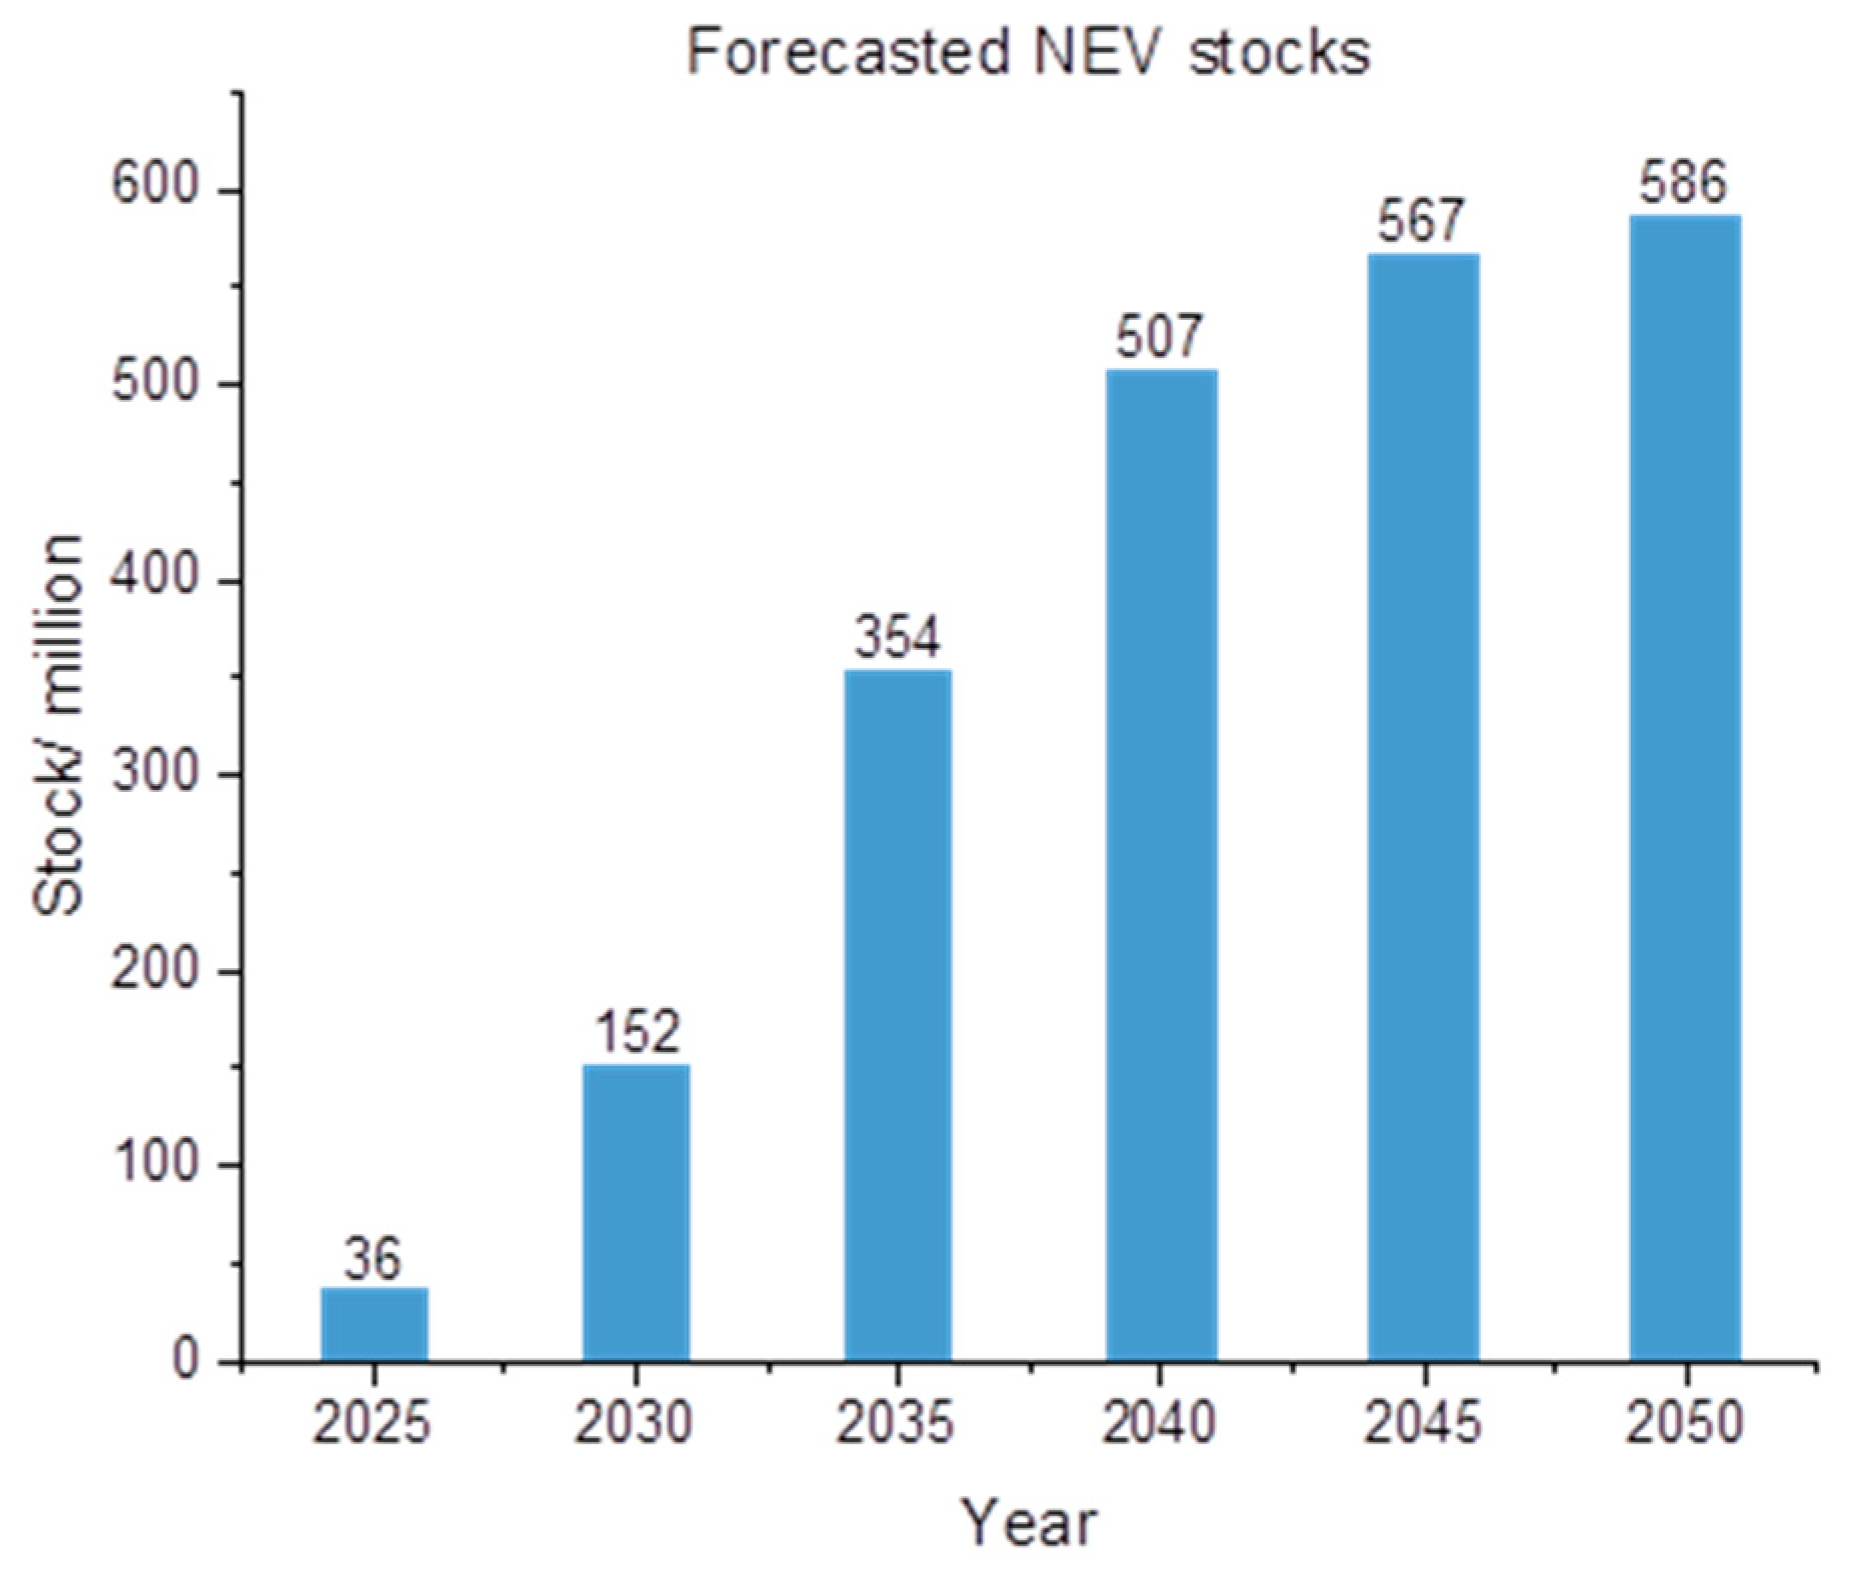
2.2.2. Forecast of NEVs

The Bass model is a commonly used approach for predicting the growth trend of new products by applying innovation diffusion theory [31]. When forecasting the diffusion of a new product, three parameters are implemented in the Bass model: the maximum market potential, the innovation coefficient, and the imitation coefficient. The basic expression of the Bass model is as follows:
d N ( t ) d t = p ( m N ( t ) ) + q N ( t ) m ( m N ( t ) )
where m is the maximum market potential, which denotes the number of all adopters when the new product is completely diffused; p is the innovation coefficient, which denotes the degree to which innovators receive external influence; and q is the imitation coefficient, which denotes the degree of internal influence.
By inputting the variables into the basic expression of the Bass model, the equation can be written as follows:
f ( t ) 1 F ( t ) = p + q F ( t )
where f ( t ) denotes the probability density function of buyers at time t , meaning the probability of buying at time t ; F ( t ) represents the cumulative density function of buyers at time t .
From the first-order differential equation of Equation (1), the integral can be obtained as
F ( t ) = 1 e ( p + q ) t 1 + q p e ( p + q ) t
Therefore, the cumulative number of buyers at time t is
N ( t ) = m F ( t ) = m 1 e ( p + q ) t 1 + q p e ( p + q ) t
However, the traditional Bass model does not integrate the external factors that affect market diffusion in the approach, such as costs, technologies, and so on. Further, the impacts of some basic economic variables cannot be modeled. Thus, to overcome the limitations of the Bass model, a generalized Bass model is proposed [31,32], as shown in Equations (9) and (10).
f ( t ) 1 F ( t ) = [ p + q F ( t ) ] x ( t )
F ( t ) = 1 e ( p + q ) X ( t ) 1 + q p e ( p + q ) X ( t )
where f ( t ) denotes the probability density function of buyers at time t , meaning the probability of buying at time t ; F ( t ) represents the cumulative density function of buyers at time t ; p is the innovation coefficient; q is the imitation coefficient; x ( t ) is the external factor function, and X ( t ) is the integral function of x ( t ) .
As discussed in the introduction section, the diffusion process of NEVs in China is mainly affected by infrastructure, policy incentives, and NEV-related technology. Although government subsidies played an important role in the initial stage of the diffusion, it also contributed to budget deficits. The reducing subsidies granted by the Chinese government indicates a gradual shift from policy stimulus to endogenous development. Thus, in this study, the construction of infrastructure, especially charging stations, charging piles, and hydrogen fueling stations is considered. Since the market share of BEVs in China accounted for the overwhelmingly highest proportion (81.6% in 2021), with the battery swapping model still being immature, this study focuses on the number of charging piles to analyze the impacts of infrastructure construction and NEV-related technology and on the promotion of NEVs in China.
To improve the generalized Bass model to fit such conditions, this study adds the change in the number of charging piles to the generalized Bass model; then, the expression of x ( t ) can be written as
x ( t ) = 1 + β C ( t ) C ( t 1 ) C ( t )
where C ( t ) is the number of charging piles at time t , and β is a coefficient that measures the promotion effect of infrastructure construction on the promotion and application of NEVs.
In Equation (12), the time variable t is a discrete form, and if it is changed to a continuous form, then
x ( t ) = 1 + β d C ( t ) C ( t )
Integrating the above equation from 0 to t , we can obtain
X ( t ) = t + β l n C ( t ) l n C ( 0 )

3. Results and Discussion

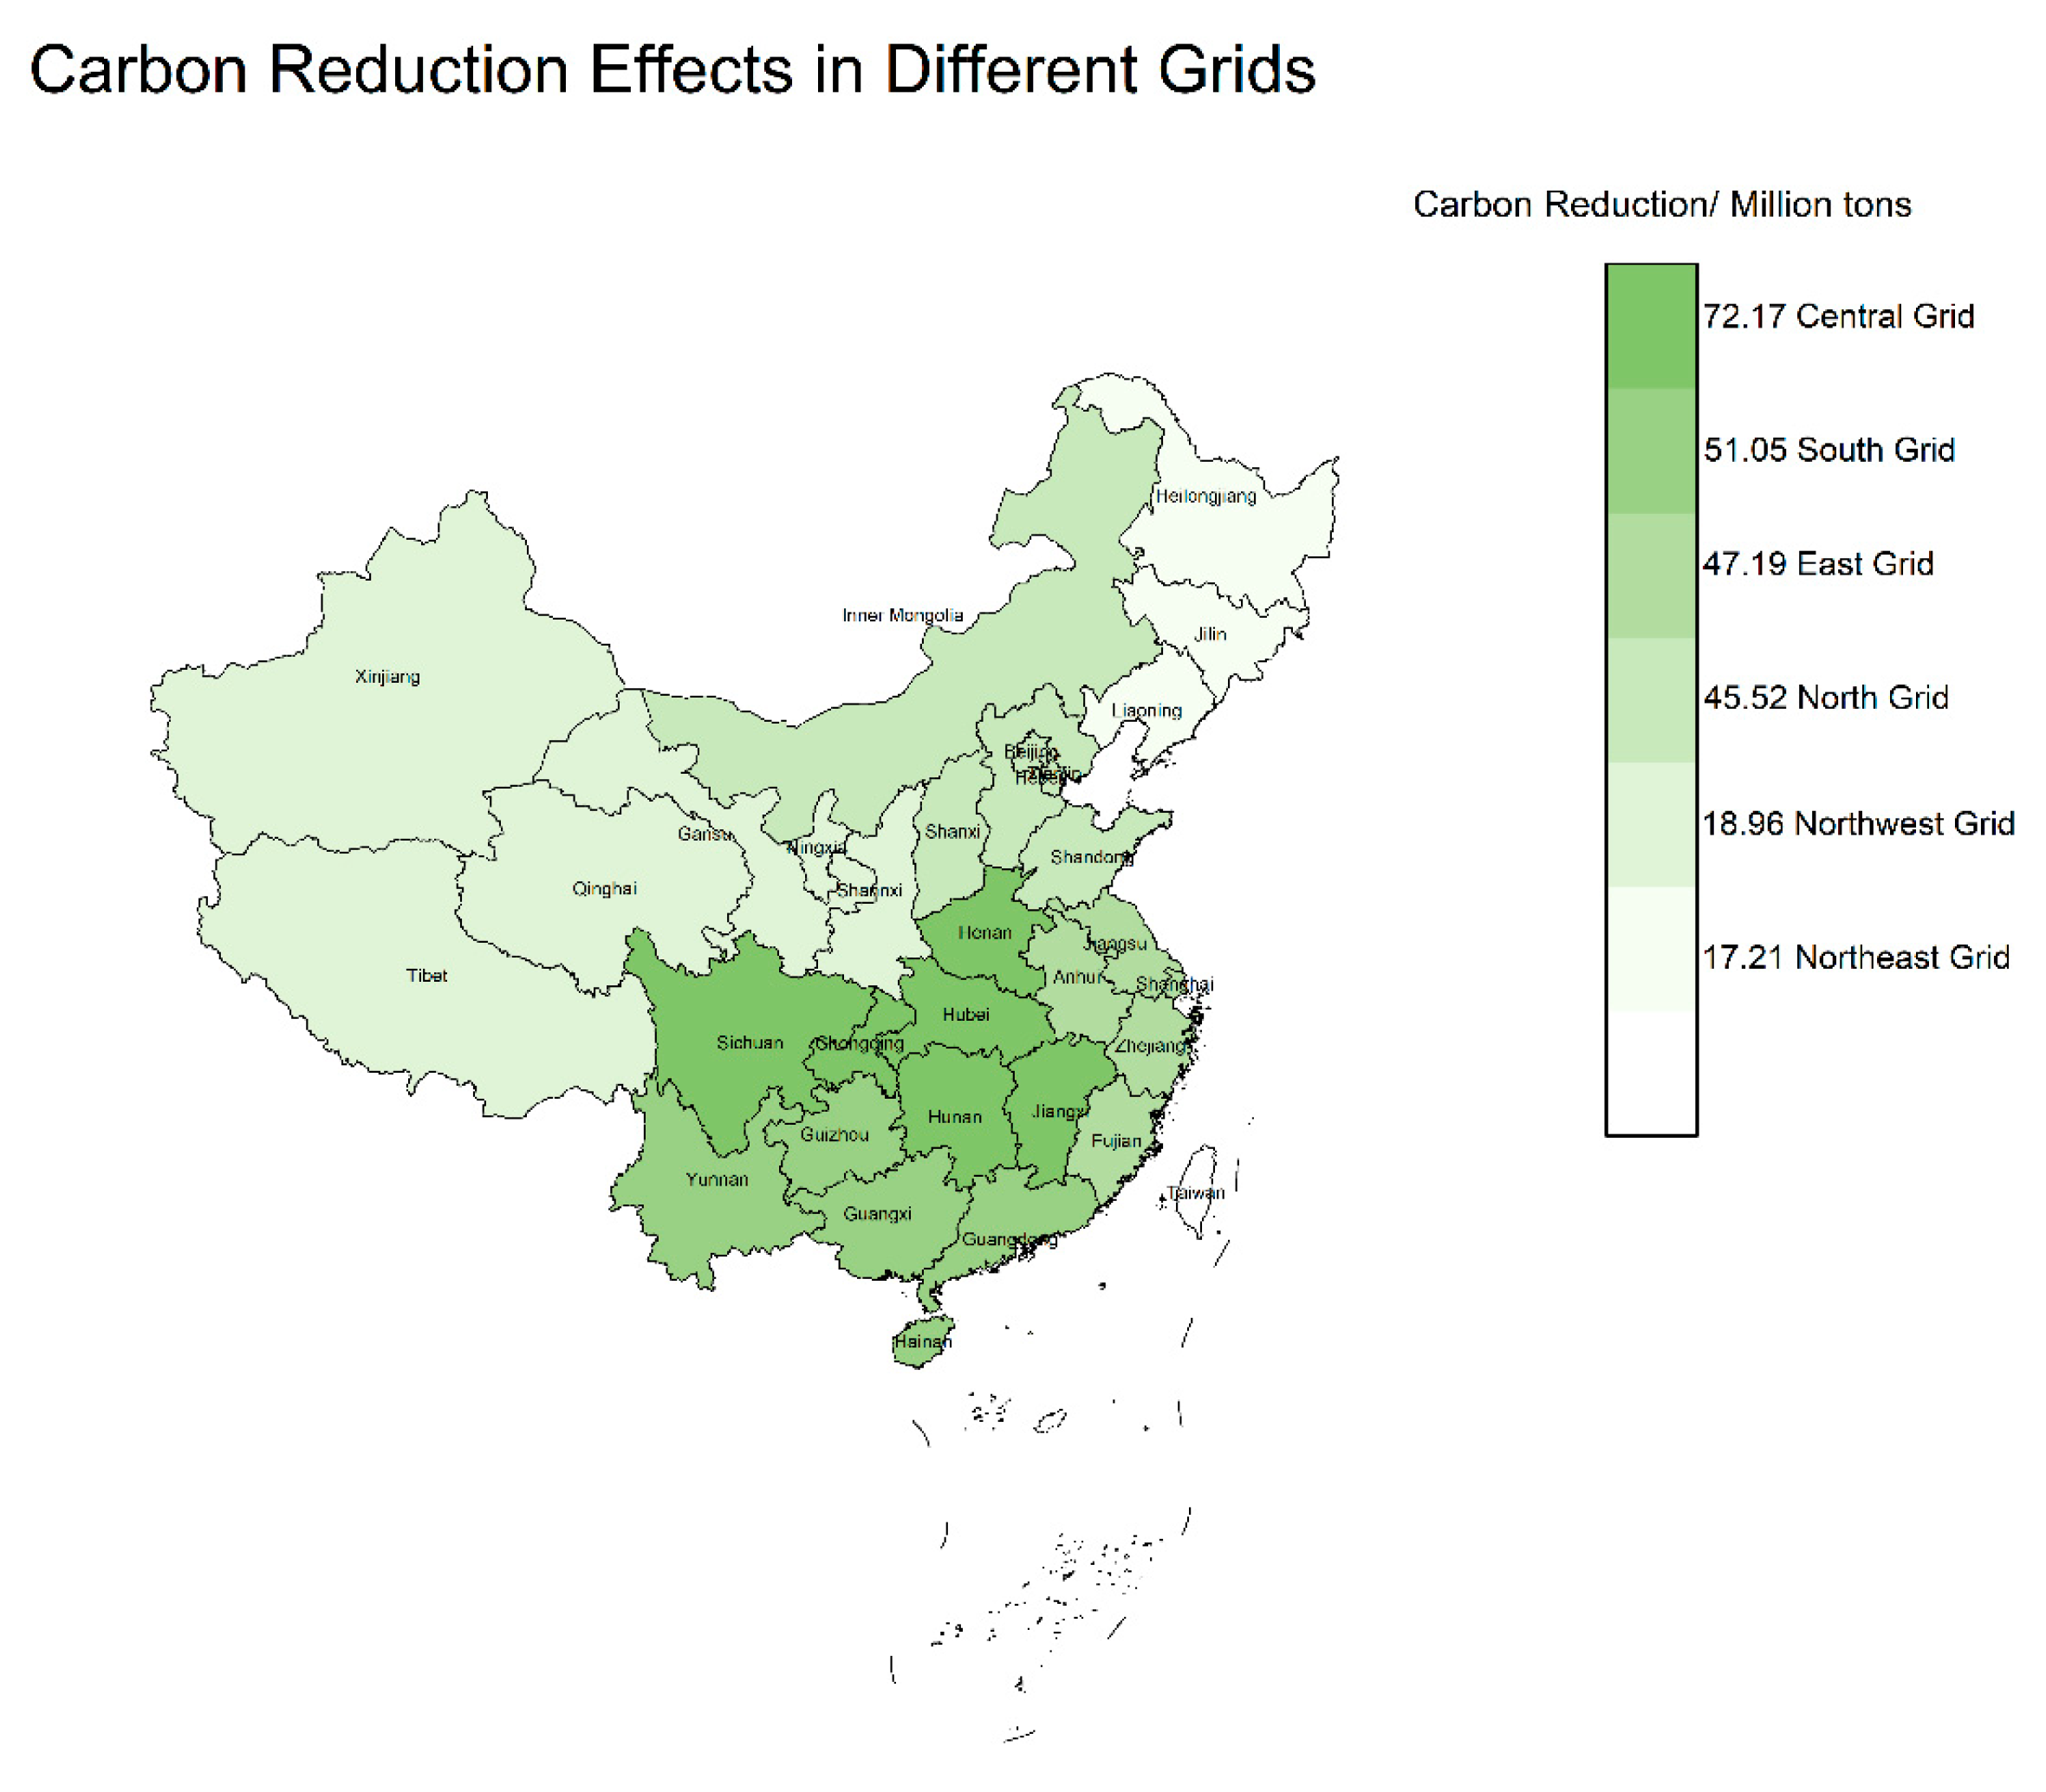
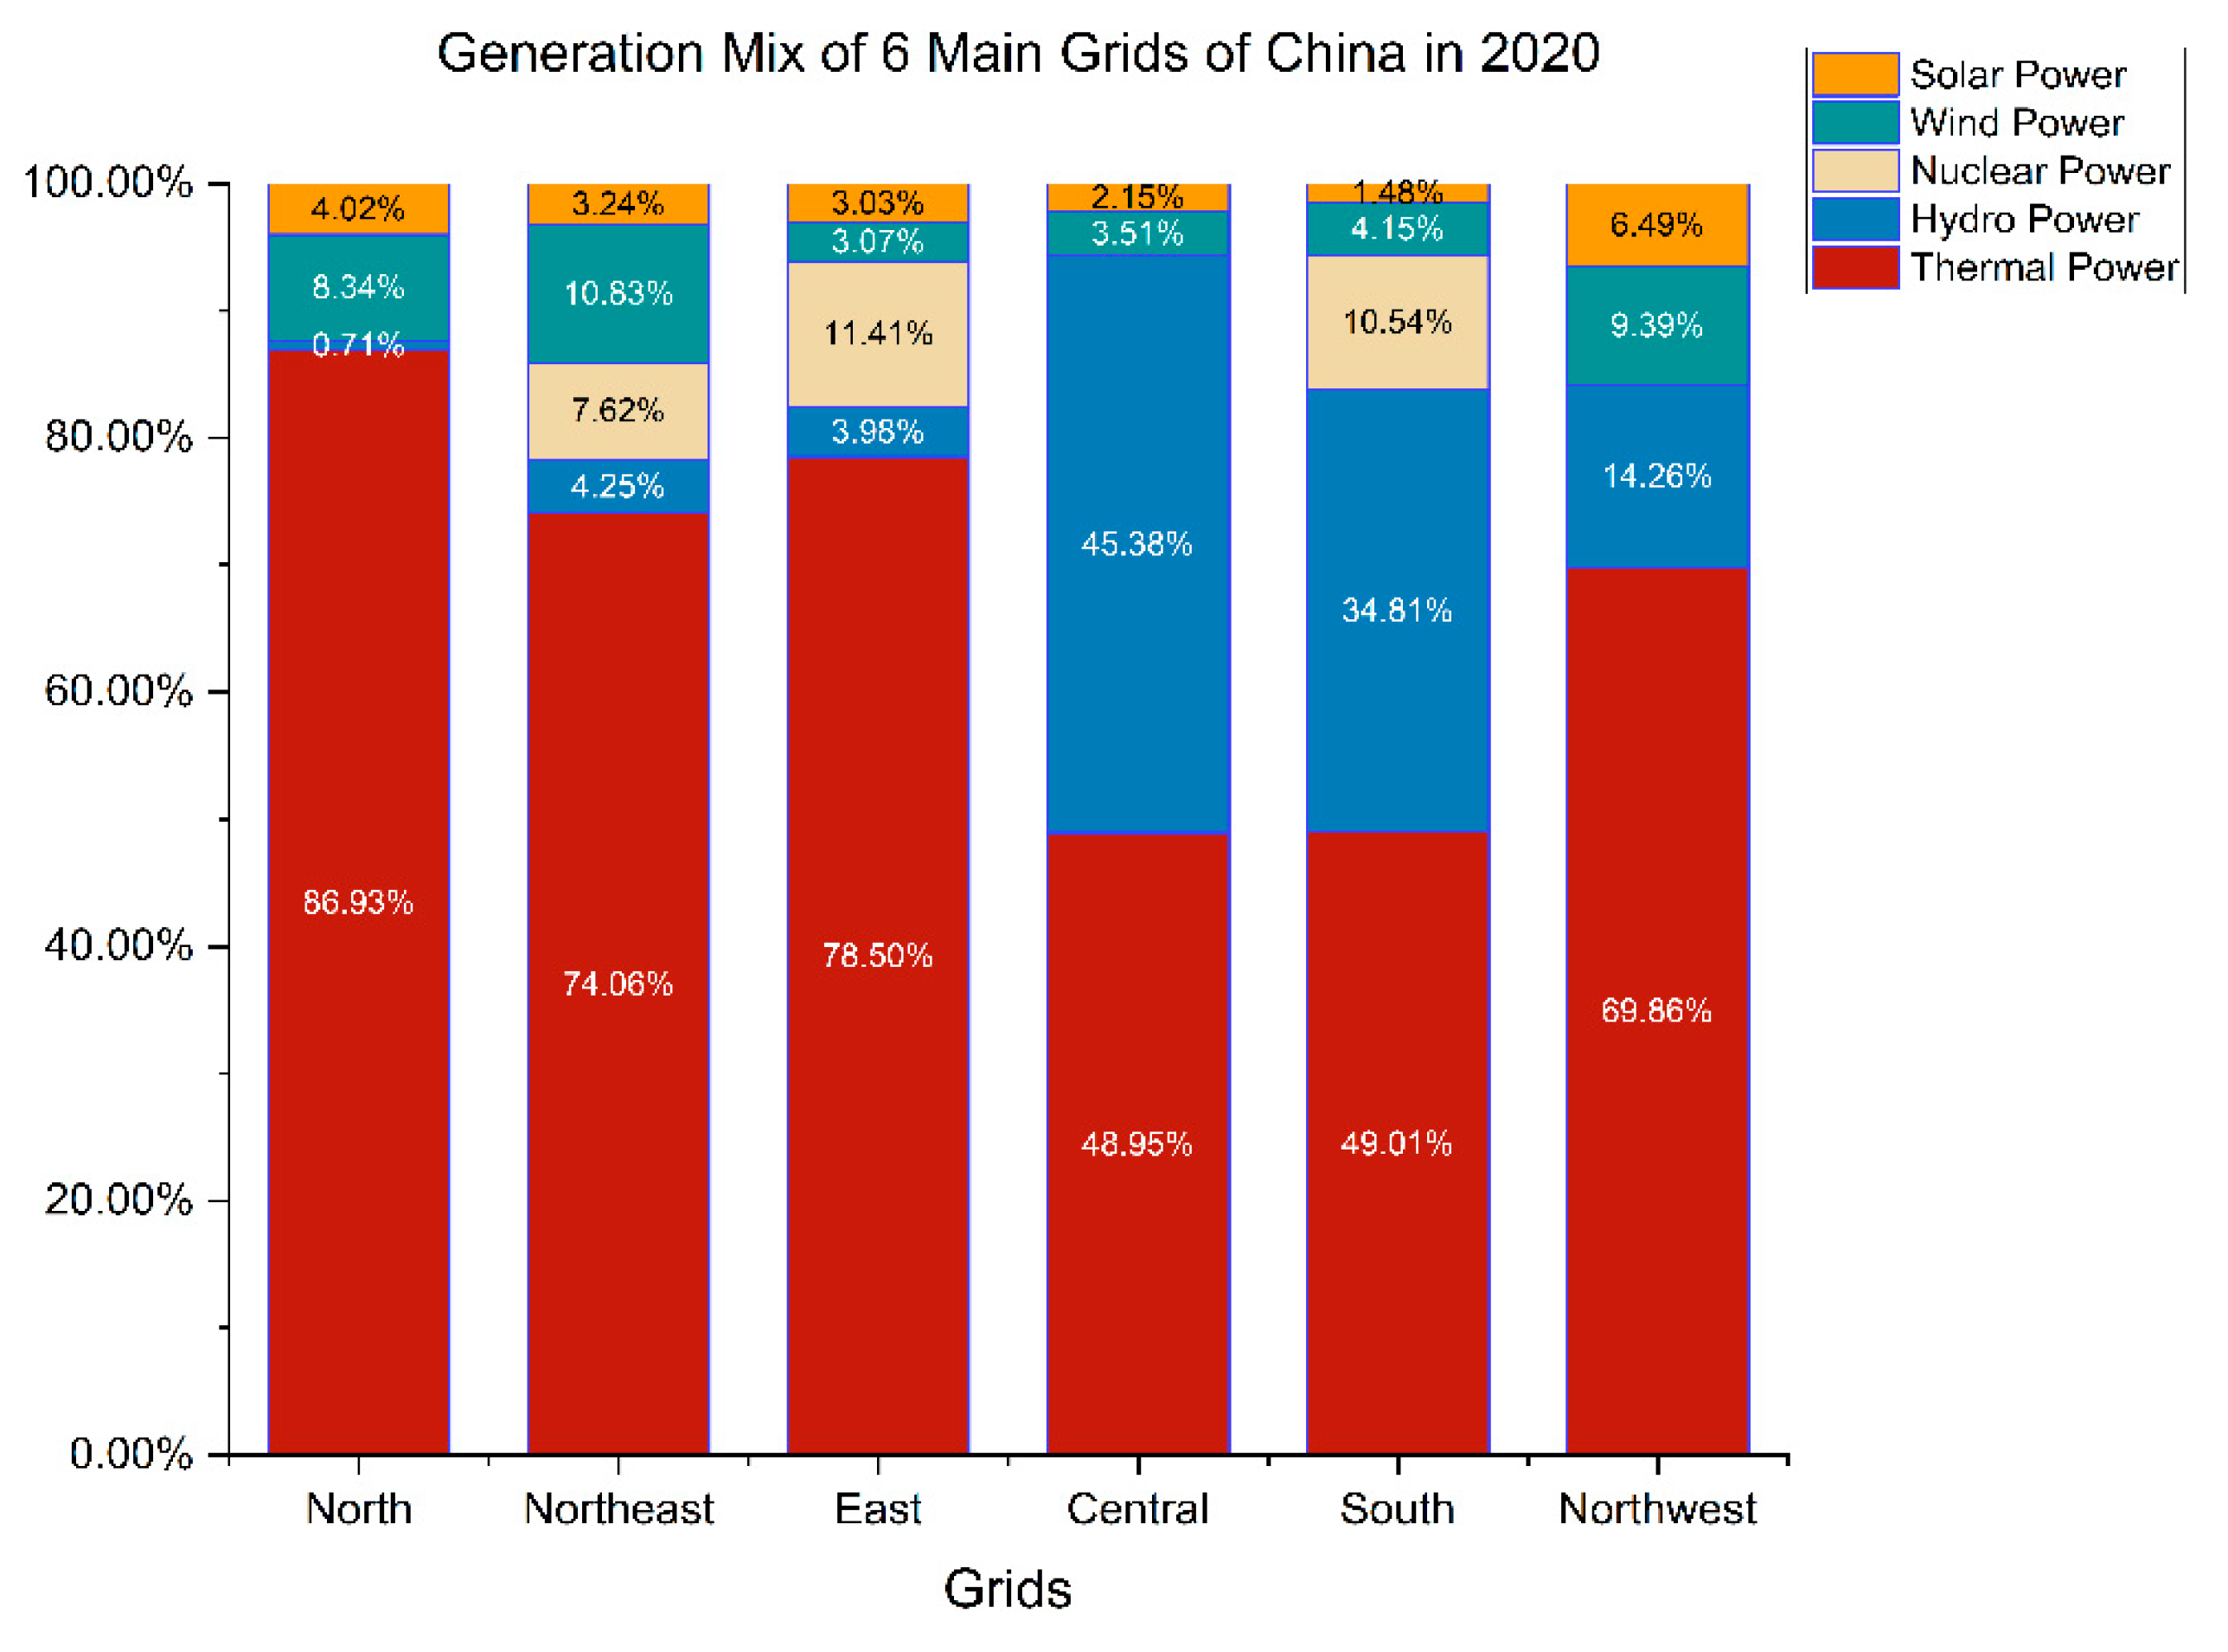
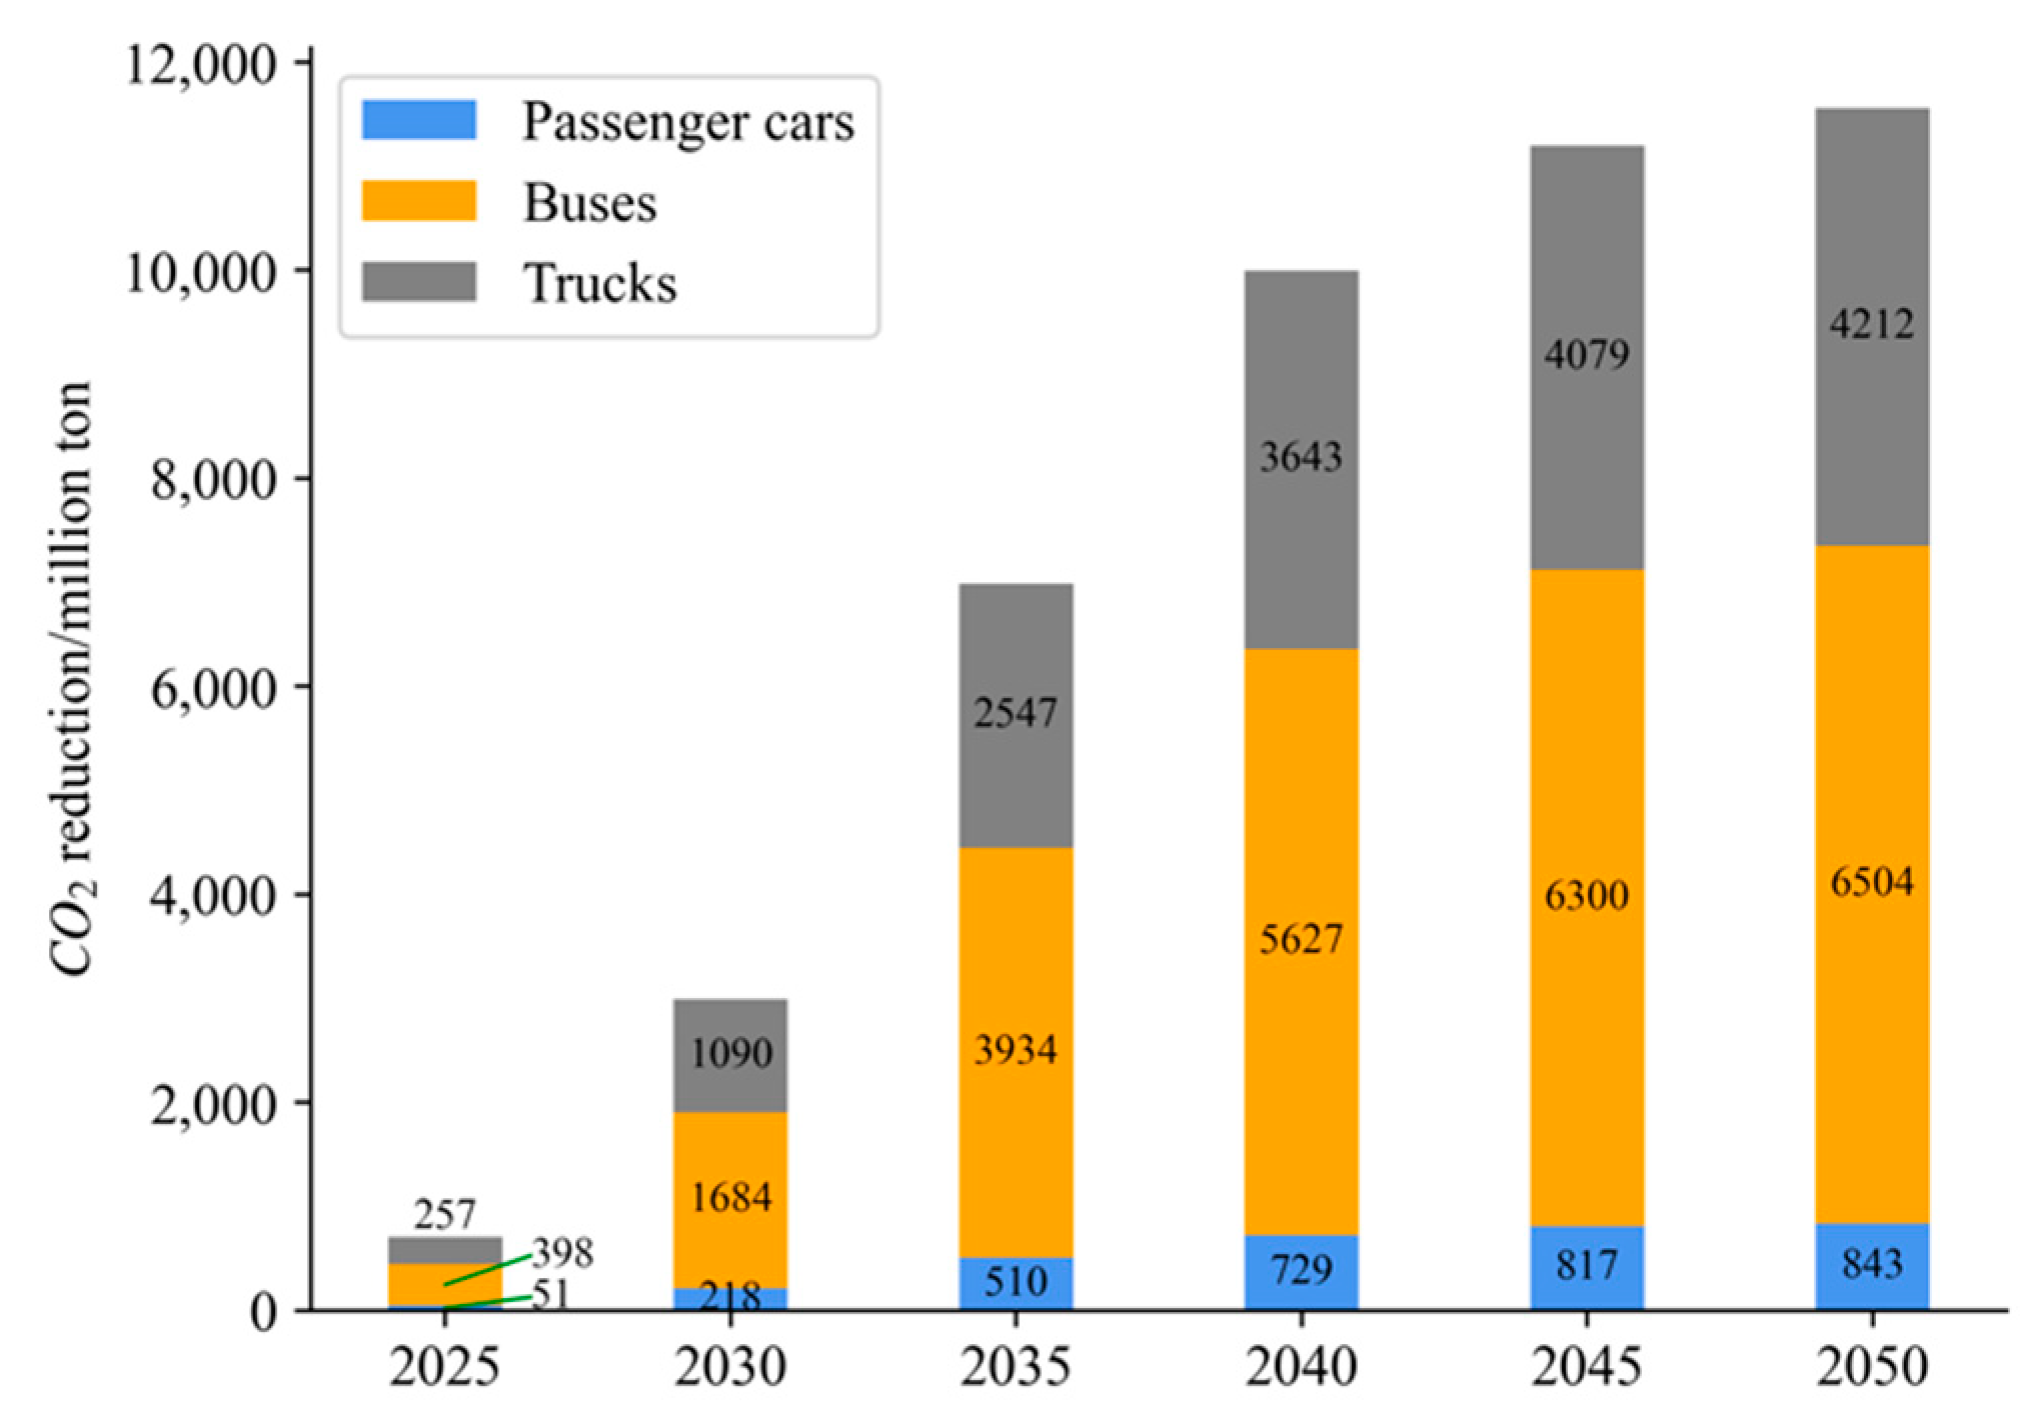
3.1. Fuel Cycle Carbon Reduction Effects

The fuel cycle is the most important emission reduction stage in the life cycle of NEVs. The carbon reduction effects of the fuel cycle in different regions, and the generation mix of the six main power grids in 2020, are shown in Figure 2 and Figure 3. In China, 31 provinces and municipalities (excluding the Hong Kong, Macao, and Taiwan regions) can be divided into six main interprovincial grids, which are named based on the regions served: Northeast China, North China, Central China, East China, Northwest China, and South China. Since one grid can buy power from another, they are not strictly independent. China’s two main energy sources for power generation are coal and hydro, with some variances in different regions. In both the Northeast, North, and East generation mixes, thermal power dominates, with proportions of 74.06%, 78.5%, and 86.93%, respectively. While thermal power still makes up the majority, hydropower in the Central and South Grids accounts for more than 30%. Nuclear power accounts for more than 10% of both the East and South grids. Wind and solar power continue to grow in China, with 9.39% wind power and 6.49% solar power in the Northwest grid.
All six power grids have carbon reduction effects within the fuel cycle, with carbon reductions ranging between 17.21 to 72.17 million tons. The Central China power grid has the strongest ability to reduce emissions, while the Northeast and Northwest grids have relatively low carbon reduction effects. This can be attributed to the following: (1) those regions with a high CO2 emission reduction capacity have relatively lower shares of thermal power generation, thereby emitting less GHGs from fossil fuel combustion; (2) although the proportions of thermal power in the Northeast and Northwest of China are not the highest, these regions have relatively abundant hydro, wind, and nuclear power, the level of economic development in these two regions is relatively low, so their adoption and promotion of NEVs lag behind other regions.
In terms of the types of NEVs, BEVs have the strongest CO2 emission reduction effects at 286.88 million tons, while that of FCVs is the lowest at 0.4 million tons. In terms of NEV types, due to BEVs accounting for the largest ownership in China, their reduction effect was the highest. PHEVs account for approximately 20% of overall NEV ownership but are restricted by the low proportion of pure electric mileage during the driving process. Most of them still rely on fossil fuels in the CS range, so their contribution to emission reduction has been relatively small. FCVs, having the lowest ownership, also have low levels of contribution. However, the fuel cells used by FCVs produce electricity by using more environmentally-friendly compressed hydrogen and oxygen as reactants, which represent sustainable energy sources [33]. The hydrogen used by the fuel cells could be a potential contributor to a more sustainable transport system, meaning that FCVs can generate purely clean and pollution-free electricity during the driving process using electrochemical reactions [34]. Therefore, FCVs are considered to have great potential for emission reduction in the future [35]. In terms of usage (as shown in Table 1), the carbon emission reduction of passenger cars is the most significant. Although the share of bus ownership and cumulative mileage are relatively low, buses with internal combustion engines consume more fossil fuels, resulting in their contribution to CO2 emission reduction being more than 37%. Similar to the aforementioned, trucks also play a significant role in reducing CO2 emissions.

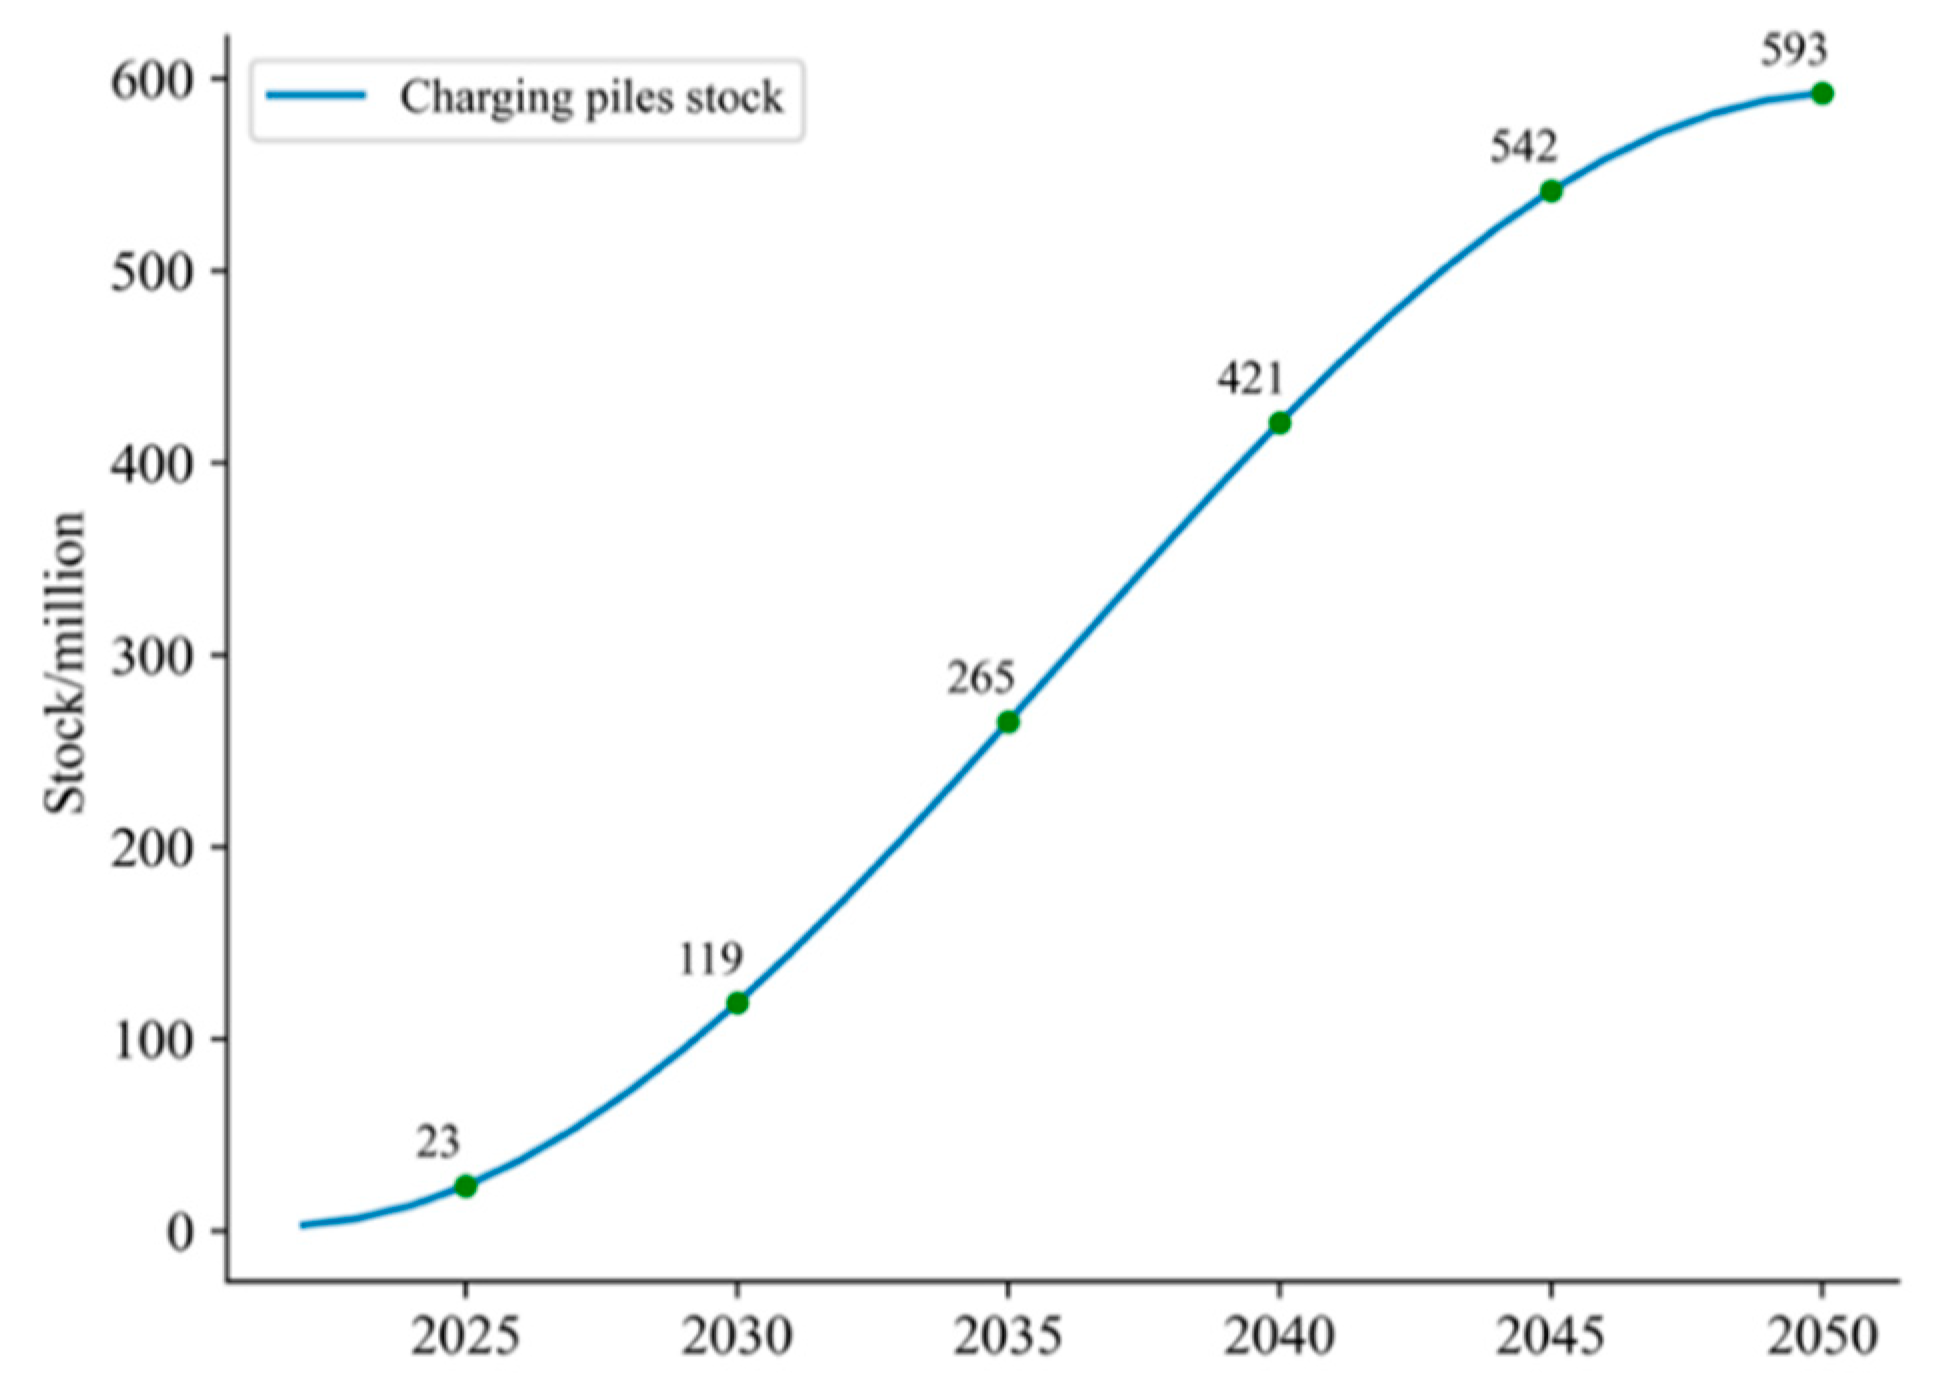
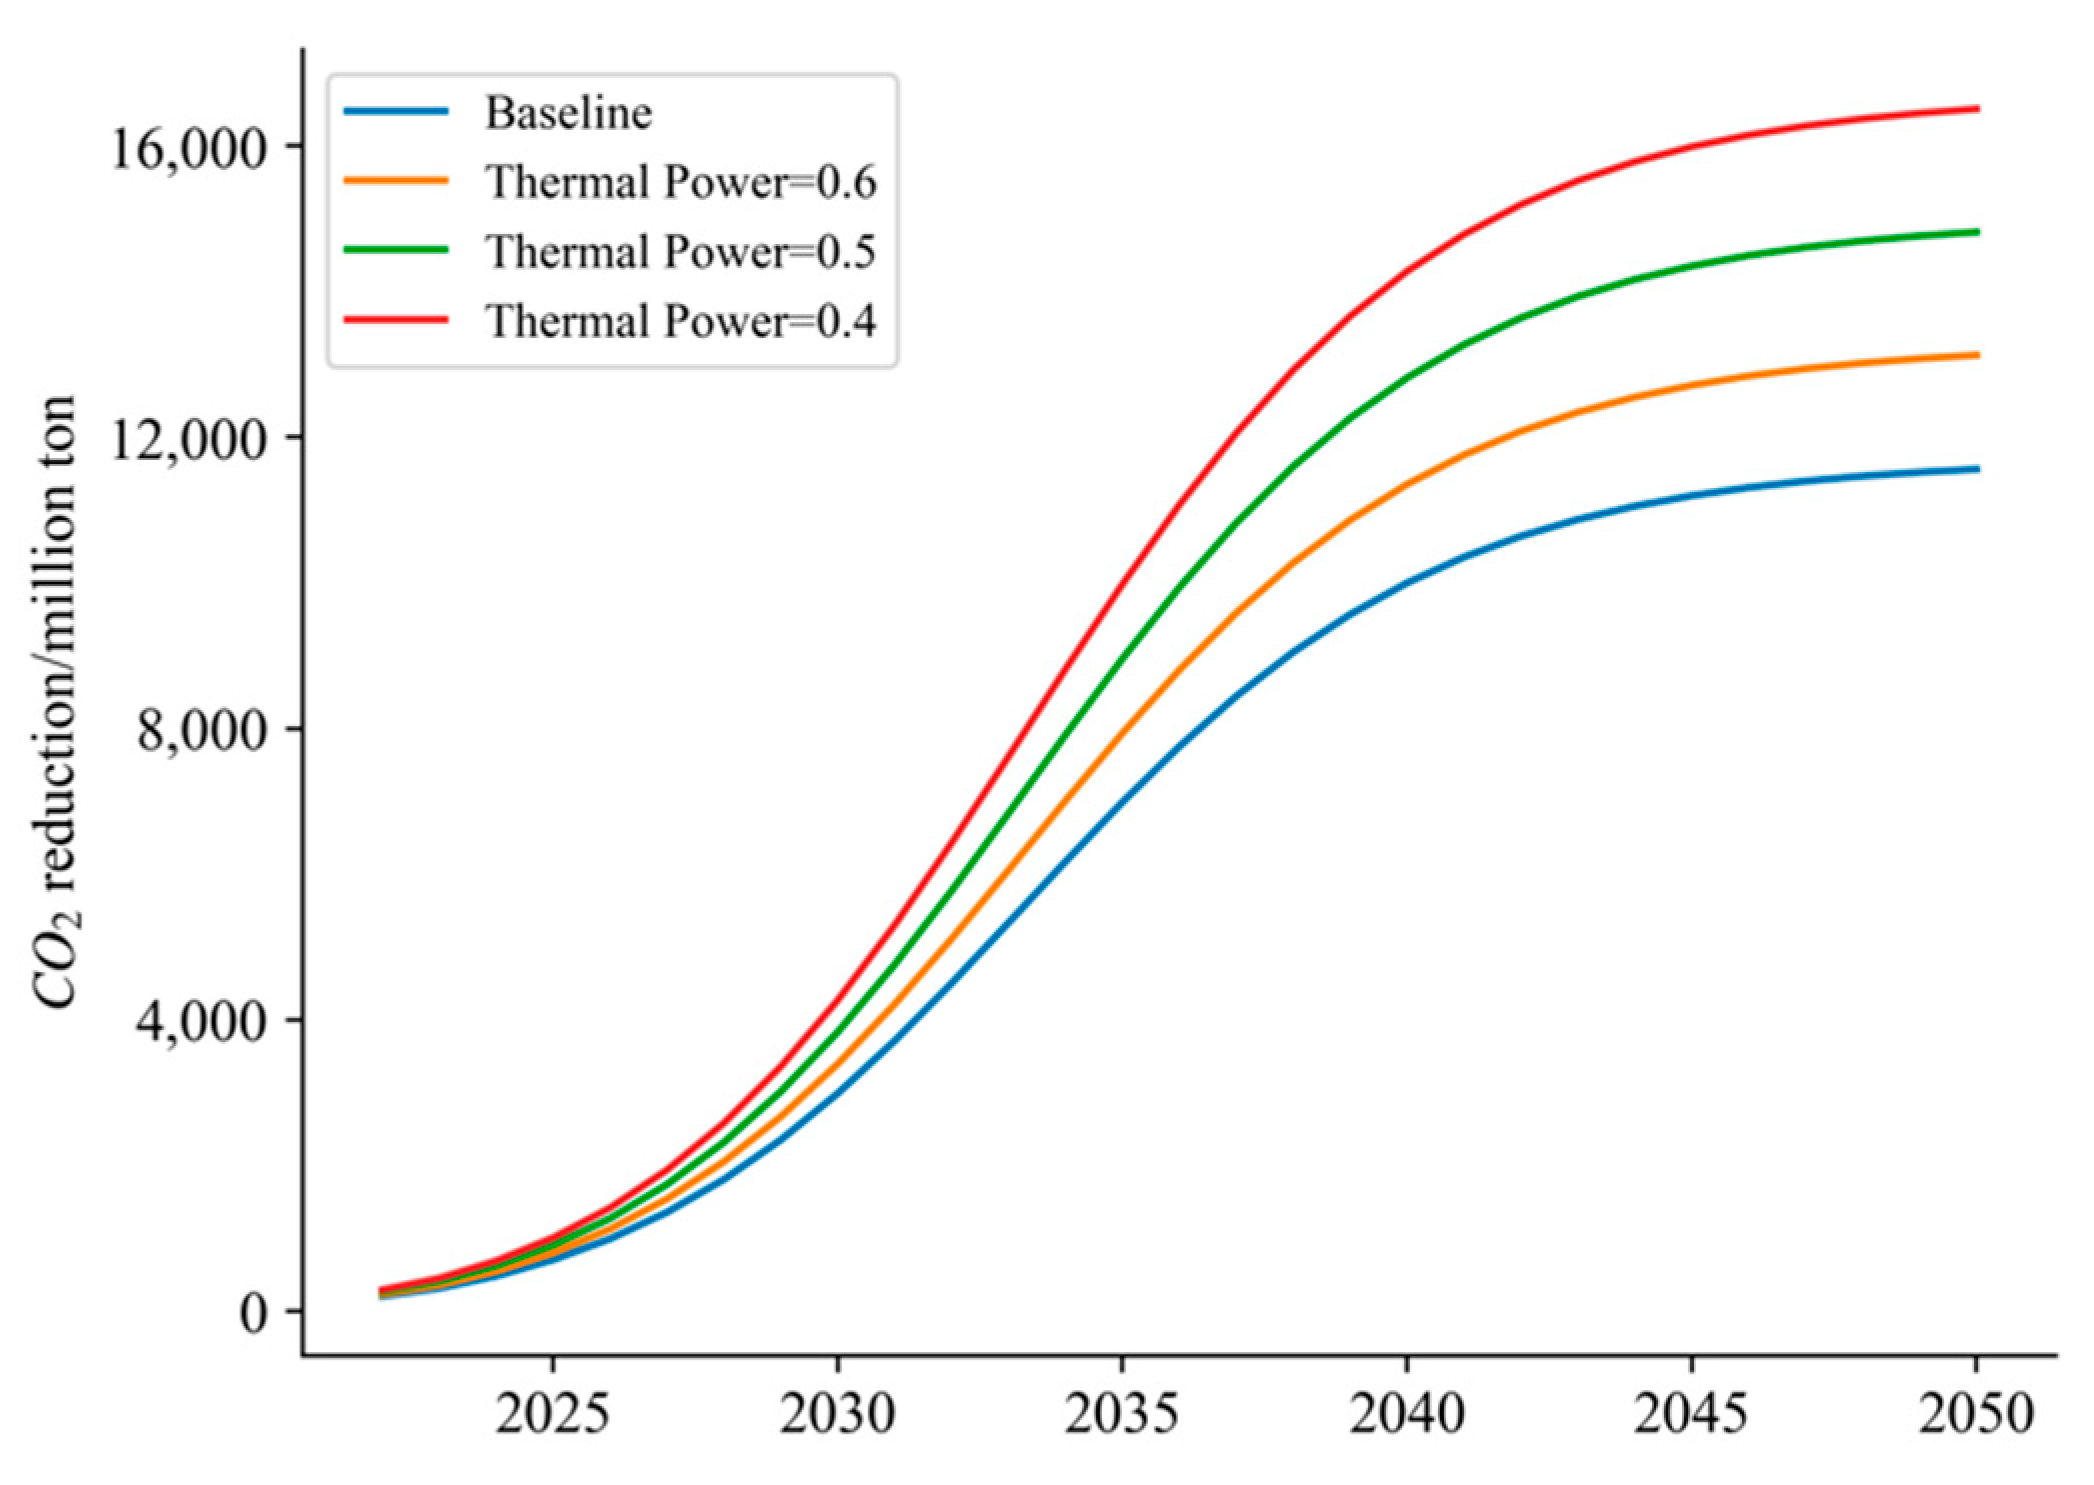
3.2. Carbon Reduction Prediction

As statistical theories and computer technology have been developing rapidly in recent decades, intelligent algorithms are available and are extremely efficient in estimating the coefficients of generalized Bass models. The most commonly used ones include sequential quadratic programming algorithms [36], machine learning [37], and genetic algorithms [38]. Among them, the genetic algorithm can be easily parallelized, with high robustness and global search capability. Therefore, it was selected in this study to estimate the coefficient of the improved generalized Bass model.
The maximum market potential, m , can be estimated from the model or exogenously given based on theoretical analysis. Referencing previous research on the same issue in China, in this study, we set m to range between 500 and 700 million [39,40,41]. The parameters of the model are shown in Table 2. The innovation coefficient, p, imitation coefficient, q, and infrastructure coefficient, β, are estimated by using the genetic algorithm. The complexity of the genetic algorithm is O (g (nm + nm + n)), where g is the number of generations, n is the population size, and m is the size of the individuals [42].
As estimated by the genetic algorithm with the settings of parameters in Table 3, the innovation coefficient p = 1.53 × 10 5 , the imitation coefficient q = 0.25 , and the infrastructure coefficient β = 2.50 , with an R 2 = 0.997 . The results show that the innovation coefficient is much smaller than the imitation coefficient, suggesting that imitation effects dominate in the diffusion of NEVs in line with the general process of innovation diffusion. The infrastructure coefficient, β , is significantly greater than 0, which indicates that the construction of the charging piles has promoted the adoption and diffusion of NEVs. The R 2 suggests the improved generalized Bass model has high accuracy in predicting NEV ownership. The model established in this study performed outstandingly well as it depicted the effects of continuously increasing trends in charging piles to reflect improvements in infrastructure, as is shown in Figure 4.
In order to verify the validity of the improved generalized Bass model established in this paper, this paper compares the performance of the basic Bass model with the generalized Bass model for forecasting NEV ownership. As shown in Figure 4, the generalized Bass is more effective than the basic Bass model (the R2 of the basic Bass model is 0.925) in predicting NEV ownership since it better describes the continuous improvement of infrastructure, which advocates for the promotion and application of NEVs.
Before forecasting the number of NEVs, the number of charging piles should be determined. Based on the New Energy Automobile Industry Development Plan of the Chinese government [43], the target for the vehicle-pile ratio is 1:1. Combined with the maximum market potential, and the change curve of charging piles displayed as an S-shaped growth trend, the figures for the charging piles is shown in Figure 5.
As shown above, although the ownership of the charging piles continues to increase, there is still a considerable gap from the ideal 1:1 (to NEV ownership) [19]. Since the early stages of NEV development, the construction of the supporting infrastructure has lagged behind the growth of NEVs. Since the construction of the supporting infrastructure has not been ahead of the NEV market, the promotion and application of NEVs will be greatly hindered [21]. Therefore, it is necessary to ensure the construction of EV infrastructure, such as charging piles, battery swap stations, and hydrogen refueling stations, to ensure convenience for NEV users and to avoid adverse effects on market diffusion.
Based on the above coefficient estimation results, NEV ownership (Million) in China at time t is
( t ) = 593.71 × 1 e ( 1.53 × 10 5 + 0.246 ) [ t + 2.5 l n C ( t ) l n C ( 0 ) ] 1 + 0.25 1.53 × 10 5 e ( 1.53 × 10 5 + 0.25 ) [ t + 2.5 l n C ( t ) l n C ( 0 ) ]
As discussed above, NEV ownership can be forecasted accurately, with the results shown in Figure 6.
As shown in Figure 6, in the future, the development of China’s NEV market can be divided into three main stages: the marketization stage (now–2025), the rapid development stage (2025–2045), and the mature stage (2045–2050). From now until 2025, the market will gradually shift from policy support to endogenous development. At this stage, although the industrial technology will be further developed, the overall effects on EV innovation and advancement will be relatively flat since key performance parameters, such as battery energy density and cruising range, will not have reached the high-end level. When combining this fact with Figure 5, it should be noted that the scale of related infrastructure construction, such as charging piles, cannot fully meet the demands of the increasing NEV market. From 2025 to 2045, the NEV market will experience explosive growth. The related technologies of new energy vehicles will be mature, and the construction of the supporting infrastructure will also reach an ideal level, resulting in NEV ownership increasing rapidly. Starting in 2045, China’s NEV market will enter maturity as the growth in population and urbanization will have directly led to the auto market gradually becoming saturated. By then, NEV ownership in China will reach a level of 586 million units, entering a slow development stage.
The relevant literature also supports the efficiency of the generalized Bass model in forecasting diffusion trends on a global scale [44,45]. Kumar, Guha, P, and Chakraborty (2022) compared four commonly used diffusion models, namely the Gompertz, logistic, Bass, and generalized Bass models, in predicting future NEV diffusion and concluded that the generalized Bass model has high efficiency in Japan, the UK, Canada, Chile, China, Brazil, Finland, France, Germany, Japan, Mexico, Portugal, and Sweden [46]. From a global perspective, NEV markets around the world, especially in the EU countries, will also follow a similar trend, and charging stations are identified as having outstanding impacts on accelerating the diffusion of NEVs [47].
In order to estimate the carbon reduction potential of NEVs in 2030 and 2050, a baseline scenario is set with the assumption that policy and technology will remain as is until 2050. This scenario acts as a reference for comparing the related impacts caused only by a change in NEV ownership with the other parameters maintained in accordance with the data in 2020. Based on the data on the accumulated mileage of NEVs, the annual mileage of passenger cars in 2020 was 14,401 km, that of buses was 34,520 km, and that of trucks was 14,288 km. The driving distance per NEV is assumed to remain stable since driving distance is determined by the demand of the users, which is constant according to historical figures. Figure 7 shows the CO2 emission reduction potential under the baseline scenario.
In the baseline scenario, when policies, technologies, and all other factors remain the same as they were in 2020, the carbon reduction of NEVs will be 2992 million tons in 2030 and reach 11,559 million tons in 2050. Compared with the predicted overall carbon dioxide emissions at 26,010 million tons in 2050, this is far from carbon neutral. Thus, taking other measures to promote the application of NEVs is urgently needed in the transport sector.
Further, to evaluate the impacts of policy changes in abating carbon emissions, a sensitivity analysis was performed for the power generation mix and traveling distance. Sensitivity analysis is used to study the uncertainty in the output of the model apportioned to different sources of uncertainty in the model input. Wilson (2013) compared the carbon emissions of electric vehicles in 20 major countries around the world, emphasizing that electric vehicles must be combined with low-carbon power generation mixes in order to abate carbon emissions [48]. Wolfram and Lutsey (2016) took the European new energy vehicle market as the research object and found that, although the emission reduction potential of FCVs and PHEVs is low, the carbon emissions of BEVs are about half of the average emissions of ICEVs due to a more sustainable power generation mix [49]. The sensitivity analysis performed in the study shows that, with a coal-dominated electricity supply, the carbon emissions from electric vehicles are four times higher than with low-carbon electricity supplies. As shown in Figure 8, when the thermal power ratio reduced from the baseline scenario to 40%, as indicated by the Stated Policies Scenario of IEA [50], the CO2 reduction of NEVs increases remarkably. From this, we can deduce that the target of carbon neutrality will be approached from a cleaner power structure.
It is also worth mentioning that traveling distance (TD), a key factor of driving mode, is considered to play a crucial role in carbon reduction in a series of pieces of literature [51]. Aggressive driving of NEVs reduces energy consumption compared with that of ICEVs, thereby reducing carbon emission despite the more frequent charging of the batteries. As shown in Figure 9, carbon intensity varied regarding different mileages traveled. Although not noticeable when the traveling distance increases from 20% to 40%, carbon reduction increases significantly when the traveling distance increases above 60%. With the continuous diffusion and technological advances in NEVs, a longer distance will be traveled up until 2050, thereby reducing CO2 emissions considerably.

4. Policy Implications

Based on the above results and discussions, some policy implications can be drawn:
(1)
Maintaining policy support in the current diffusion stage:
The intensity of policy support has significant impact on the diffusion of NEVs in the marketization stage. However, China’s current new energy vehicle-related policy support has been declining year-on-year, which will negatively affect the development of the NEV industry. Thus, purchase subsidies, tax incentives, and vehicle licensing policies should still be provided to promote the rapid development of the NEV market;
(2)
Improving R&D investment to promote the technological advancement of core components:
Compared with developed industrialized countries, China lacks self-owned technologies, and has high external dependence, especially in terms of pure electric driving range, core components, engine technology, and integration level. The level of technology readiness plays a more significant role in the development of NEVs in the middle and late stages of diffusion and can advance the year in which maximum NEV sale volume occurs, contributing to the achievement of the “carbon peak” goal for the transportation industry.
Moreover, since their power source is not completely clean, the power consumption of BEVs determines their carbon reduction ability in the WTT phase. Thus, by reducing power consumption and improving battery efficiency, the carbon emissions of road transport can be reduced to a large extent. For PHEVs, their current electric driving mileage (or CD range) accounts for a relatively low proportion, contributing to a low UF. Thus, encouraging PHEV owners to adopt an electric driving mode and increasing the CD range can promote carbon reduction effects. For FCVs, their current low carbon reduction effects are attributed to low ownership levels, but they should be promoted for their great potential and high level of sustainability since there is pollution created in the processes of their power source operation;
(3)
Enhancing the corresponding infrastructure:
According to the above analysis, the construction of energy vehicle infrastructure greatly affects the growth rate of NEV ownership. Due to the current low charging pile-to-car ratio in China, it is of vital importance to build the infrastructure network and to explore the charging mode and battery swapping mode;
(4)
Tailoring NEV promotion policies for different regions:
As the results show, the promotion of NEV in 31 provinces can bring certain carbon reduction effects. However, the regional differences indicate different policies should be enacted and adopted. For regions with a high CO2 emission reduction capacity, including the Central China power grid and East China power grid, the priority should be promoting FCVs, R&D, and the exploration of the charging mode and battery swapping mode to be the leading pilots for future diffusion all over the country. For regions with relatively low CO2 emission reduction capacities, the relevant departments should pour more support towards boosting the diffusion of NEVs and reducing the thermal power generation ratio;
(5)
Phasing out thermal power generation to improve the cleanliness of the power structure:
According to the sensitivity analysis performed in the study, due to the current high share of thermal power generation in China, even if road transportation is fully electric, it will still generate a certain degree of carbon emissions. Therefore, in order to promote the realization of the “dual carbon” goal in the transportation sector, in addition to vigorously promoting the diffusion of NEVs, the power structure should be upgraded, and gradually adopt clean energy to replace thermal power generation before 2060.

5. Conclusions

This paper proposes an effective bottom-up method to assess the fuel cycle carbon emission reductions of NEVs in different regions and to assess the carbon reduction potential of NEVs in 2030 and 2050. Additionally, we further improve the Bass model by introducing charging piles as a key factor in measuring the development of infrastructure. The relevant literature also proves the efficiency of the generalized Bass model for forecasting diffusion trends from a global perspective. Although the adoption and diffusion of NEVs has an influence on the carbon reduction effect in all six regions, the effects have regional differences. The carbon reduction effect in the six main interprovincial grids suggests that it is reasonable and effective to adopt and promote NEVs as a central approach toward the decarbonization of the transportation sector. However, the regional differences indicate a high proportion of thermal power and underdevelopment in some regions, making the promotion of NEVs difficult, along with effectively reducing carbon emissions in some regions. A sensitivity analysis was further conducted to capture the impacts of the power generation mix changes and traveling distance, showing that a reduction in the thermal power ratio and an increase in traveling distance contribute to carbon neutrality. Therefore, in the future, based on the distinctions of carbon emission reduction effects in different regions, it is necessary to formulate a corresponding NEV promotion plan in the high and medium emission reduction regions. The adoption and promotion of NEVs should be vigorously supported, and the subsidies and support in such areas should not be reduced; in low-emission reduction regions, the energy structure of the power generation process should be fundamentally optimized to increase the proportions of clean energy in the power generation mix, e.g., hydro, wind, and nuclear energy.
With the ability to be replicated in other countries, the prediction framework in our study was applied to the empirical data of China, a country highly reliant on fossil fuels as its main energy source, where we analyzed carbon reduction from a quantitative perspective. Compared to ICEVs, NEVs can significantly reduce carbon emissions in the fuel cycle. As was calculated in the baseline scenario, the carbon reduction will only be 11,560 million tons, which is far from carbon neutrality, meaning that the government should enact relevant policies and facilitate technological development to foster the application of NEVs. At the current stage, policy support should be maintained to stimulate the diffusion of NEVs. Research and development investment should be improved to advance the technology of the core NEV components. As discussed, infrastructure also plays a crucial role in the promotion and application of NEVs, so charging piles, battery swap stations, and hydrogen refueling stations should be emphasized at the initial stage of the diffusion.
In terms of the types of NEVs, BEVs have the strongest CO2 emission reduction effects. Therefore, at the current stage, for the low-emission reduction regions, the promotion of BEVs should be prioritized. When considering the purely clean and pollution-free driving process of FCVs, despite their current low carbon reduction effects, they ought to be promoted in the high-emission reduction regions for their great potential. The currently limited contribution of PHEVs to emission reduction can be attributed to the ratio of the CS range to total mileage, i.e., the low utility factor. Research and development on PHEVs should mainly focus on improving the utility factor through technological innovation, reducing the proportion of fossil fuel consumption. In terms of usage, the carbon emission reduction effects of passenger cars are the most significant, so the adoption and promotion of passenger NEVs should be supported at the initial stage. Although the current share of bus and truck ownership and cumulative mileage are relatively low, buses running on internal combustion engines consume more fossil fuels. Consequently, their promotion has practical meaning, and the public transportation sector should also accelerate the process of adopting NEVs.
However, there is still room for improvement in the assessment of the carbon reduction effects of NEVs, especially by introducing the material cycle. In our subsequent research, we will be endeavoring to address the obtainment, production, and recycling processes of the metals used in vehicles, parts, and batteries.

Author Contributions

Conceptualization, A.C.; methodology, A.C.; software, A.C.; validation, A.C.; formal analysis, S.Y.; investigation, S.Y.; resources, A.C.; data curation, A.C.; writing—original draft preparation, A.C.; writing—review and editing, A.C. and S.Y.; visualization, A.C.; supervision, S.Y.; project administration, S.Y. All authors have read and agreed to the published version of the manuscript.

Funding

This research received no external funding.

Institutional Review Board Statement

Not applicable.

Informed Consent Statement

Not applicable.

Data Availability Statement

The datasets generated for this study are available from the Traffic Administration Bureau of the Ministry of Public Security (TABMPS) in China. The mileage data of NEVs was obtained from “New Energy Vehicle Big Data Research Report” and the “New Energy Vehicle National Big Data Alliance Briefing”, released by the National Big Data Alliance of New Energy Vehicles (NDANEV). The data on charging pile stocks and the charging data were obtained from the China Electric Vehicle Charging Infrastructure Promotion Alliance (EVCIPA). The socio-economic datasets presented in the study are available at the 7th population census and the 2020 China Statistical Yearbook.

Conflicts of Interest

The authors declare no conflict of interest.

References

  1. The International Panel on Climate Change (IPCC). The Evidence Is Clear: The Time for Action Is Now. We Can Halve Emissions by 2030. Available online: https://www.ipcc.ch/2022/04/04/ipcc-ar6-wgiii-pressrelease/ (accessed on 26 September 2022).
  2. International Energy Agency (IEA). Net Zero by 2050: A Roadmap for the Global Energy Sector. Available online: https://iea.blob.core.windows.net/assets/deebef5d-0c34-4539-9d0c-10b13d840027/NetZeroby2050-ARoadmapfortheGlobalEnergySector_CORR.pdf (accessed on 23 August 2022).
  3. Grubler, A.; Wilson, C.; Bento, N.; Boza-Kiss, B.; Krey, V.; McCollum, D.L.; Rao, N.D.; Riahi, K.; Rogelj, J.; De Stercke, S.; et al. A low energy demand scenario for meeting the 1.5 °C target and sustainable development goals without negative emission technologies. Nat. Energy 2018, 3, 515–527. [Google Scholar] [CrossRef] [Green Version]
  4. Guilyardi, E.; Lescarmontier, L.; Matthews, R.; Point, S.P.; Rumjaun, A.B.; Schlüpmann, J.; Wilgenbus, D. IPCC Special Report “Global Warming of 1.5 °C”: Summary for Teachers. 2018. Available online: https://refubium.fu-berlin.de/bitstream/handle/fub188/25436/Guilyardi_IPCC_2018.pdf;jsessionid=7CCFD6217A786BF8EEE026D4B8A0ED59?sequence=1 (accessed on 26 September 2022).
  5. International Energy Agency (IEA). Global Energy Review 2021. 2021. Available online: https://iea.blob.core.windows.net/assets/d0031107-401d-4a2f-a48b-9eed19457335/GlobalEnergyReview2021.pdf (accessed on 17 August 2021).
  6. U.S. Department of Transportation. Electric Vehicle Types. Available online: https://www.transportation.gov/rural/ev/toolkit/ev-basics/vehicle-types (accessed on 15 September 2022).
  7. Moriarty, P.; Wang, S.J. Can electric vehicles deliver energy and carbon reductions? Energy Procedia 2017, 105, 2983–2988. [Google Scholar] [CrossRef] [Green Version]
  8. Yuan, X.; Liu, X.; Zuo, J. The development of new energy vehicles for a sustainable future: A review. Renew. Sustain. Energy Rev. 2015, 42, 298–305. [Google Scholar] [CrossRef]
  9. Helmers, E.; Marx, P. Electric cars: Technical characteristics and environmental impacts. Environ. Sci. Eur. 2012, 24, 14. [Google Scholar] [CrossRef] [Green Version]
  10. Su, C.-W.; Yuan, X.; Tao, R.; Umar, M. Can new energy vehicles help to achieve carbon neutrality targets? J. Environ. Manag. 2021, 297, 113348. [Google Scholar] [CrossRef] [PubMed]
  11. Ma, H.; Balthasar, F.; Tait, N.; Riera-Palou, X.; Harrison, A. A new comparison between the life cycle greenhouse gas emissions of battery electric vehicles and internal combustion vehicles. Energy Policy 2012, 44, 160–173. [Google Scholar] [CrossRef]
  12. Moro, A.; Helmers, E. A new hybrid method for reducing the gap between WTW and LCA in the carbon footprint assessment of electric vehicles. Int. J. Life Cycle Assess. 2015, 22, 4–14. [Google Scholar] [CrossRef] [Green Version]
  13. Jwa, K.; Lim, O. Comparative life cycle assessment of lithium-ion battery electric bus and Diesel bus from well to wheel. Energy Procedia 2018, 145, 223–227. [Google Scholar] [CrossRef]
  14. Campanari, S.; Manzolini, G.; de la Iglesia, F.G. Energy analysis of electric vehicles using batteries or fuel cells through well-to-wheel driving cycle simulations. J. Power Sources 2009, 186, 464–477. [Google Scholar] [CrossRef]
  15. International Energy Agency (IEA). Global CO2 Emissions Rebounded to Their Highest Level in History in 2021. Available online: https://www.iea.org/news/global-co2-emissions-rebounded-to-their-highest-level-in-history-in-2021 (accessed on 15 August 2022).
  16. Lin, B.; Shi, L. Do environmental quality and policy changes affect the evolution of consumers’ intentions to buy new energy vehicles. Appl. Energy 2022, 310, 118582. [Google Scholar] [CrossRef]
  17. Dong, F.; Liu, Y. Policy evolution and effect evaluation of new-energy vehicle industry in China. Resour. Policy 2020, 67, 101655. [Google Scholar] [CrossRef]
  18. Martínez-Lao, J.; Montoya, F.G.; Montoya, M.G.; Manzano-Agugliaro, F. Electric vehicles in Spain: An overview of charging systems. Renew. Sustain. Energy Rev. 2017, 77, 970–983. [Google Scholar] [CrossRef]
  19. Yi, T.; Zhang, C.; Lin, T.; Liu, J. Research on the spatial-temporal distribution of electric vehicle charging load demand: A case study in China. J. Clean. Prod. 2019, 242, 118457. [Google Scholar] [CrossRef]
  20. Rietmann, N.; Hügler, B.; Lieven, T. Forecasting the trajectory of electric vehicle sales and the consequences for worldwide CO2 emissions. J. Clean. Prod. 2020, 261, 121038. [Google Scholar] [CrossRef]
  21. Lee, D.-H.; Kim, M.-S.; Roh, J.-H.; Yang, J.-P.; Park, J.-B. Forecasting of Electric Vehicles Charging Pattern Using Bayesians method with the Convolustion. IFAC-PapersOnLine 2019, 52, 413–418. [Google Scholar] [CrossRef]
  22. Yuan, X.; Cai, Y. Forecasting the development trend of low emission vehicle technologies: Based on patent data. Technol. Forecast. Soc. Chang. 2021, 166, 120651. [Google Scholar] [CrossRef]
  23. Xi, J. In Proceedings of the General Assembly Seventy-Fifth Session 4th Plenary Meeting, New York, NY, USA, 22 September 2020; Available online: https://www.un.org/en/ga/info/meetings/76schedule.shtml (accessed on 30 November 2022).
  24. Gorner, M.; Paoli, L. How Global Electric Car Sales Defied COVID-19 in 2020. Available online: https://policycommons.net/artifacts/1427492/how-global-electric-car-sales-defied-covid-19-in-2020/2042243/ (accessed on 7 November 2022).
  25. Traffic Administration Bureau of the Ministry of Public Security (TABMPS). China’s NEV Stock 2021. Available online: http://www.gov.cn/fuwu/bm/jtysb/index.htm (accessed on 26 September 2022).
  26. Sun, F.C. New Energy Vehicle Big Data Research Report 2021, 1st ed.; China Machine Press: Beijing, China, 2021; pp. 67–143. [Google Scholar]
  27. NDANEV. New Energy Vehicle National Big Data Alliance Briefing 2021. Available online: http://www.ndanev.com/ (accessed on 10 August 2022).
  28. Huo, H.; Wang, M.; Zhang, X.; He, K.; Gong, H.; Jiang, K.; Jin, Y.; Shi, Y.; Yu, X. Projection of energy use and greenhouse gas emissions by motor vehicles in China: Policy options and impacts. Energy Policy 2011, 43, 37–48. [Google Scholar] [CrossRef]
  29. IPCC. IPCC Guidelines for National Greenhouse Gas Inventories (IGES); N.G.G.I. Programme, Ed.; IPCC: Geneva, Switzerland, 2006; Available online: https://www.ipcc.ch/report/2006-ipcc-guidelines-for-national-greenhouse-gas-inventories/ (accessed on 7 November 2022).
  30. Hao, X.; Yuan, Y.; Wang, H.; Ouyang, M. Plug-in hybrid electric vehicle utility factor in China cities: Influencing factors, empirical research, and energy and environmental application. eTransportation 2021, 10, 100138. [Google Scholar] [CrossRef]
  31. Bass, F.M. A New Product Growth for Model Consumer Durables. Manag. Sci. 1969, 15, 215–227. [Google Scholar] [CrossRef]
  32. Bass, F.M.; Krishnan, T.V.; Jain, D.C. Why the bass model fits without decision variables. Mark. Sci. 1994, 13, 203–223. [Google Scholar] [CrossRef]
  33. Manoharan, Y.; Hosseini, S.E.; Butler, B.; Alzhahrani, H.; Senior, B.T.F.; Ashuri, T.; Krohn, J. Hydrogen fuel cell vehicles; current status and future prospect. Appl. Sci. 2019, 9, 2296. [Google Scholar] [CrossRef] [Green Version]
  34. Ahmadi, P.; Khoshnevisan, A. Dynamic simulation and lifecycle assessment of hydrogen fuel cell electric vehicles considering various hydrogen production methods. Int. J. Hydrog. Energy 2022, 47, 26758–26769. [Google Scholar] [CrossRef]
  35. Ren, L.; Zhou, S.; Ou, X. Life-cycle energy consumption and greenhouse-gas emissions of hydrogen supply chains for fuel-cell vehicles in China. Energy 2020, 209, 118482. [Google Scholar] [CrossRef]
  36. Xian, Y.; Xia, M.; Su, S.; Guo, M.; Chen, F. Research on the Market Diffusion of Fuel Cell Vehicles in China Based on the Generalized Bass Model. IEEE Trans. Ind. Appl. 2021, 58, 2950–2960. [Google Scholar] [CrossRef]
  37. Ramírez-Hassan, A.; Montoya-Blandón, S. Forecasting from others’ experience: Bayesian estimation of the generalized Bass model. Int. J. Forecast. 2019, 36, 442–465. [Google Scholar] [CrossRef]
  38. Zhang, C.; Tian, Y.-X.; Fan, Z.-P. Forecasting the box offices of movies coming soon using social media analysis: A method based on improved Bass models. Expert Syst. Appl. 2021, 191, 116241. [Google Scholar] [CrossRef]
  39. Massiani, J.; Gohs, A. The choice of Bass model coefficients to forecast diffusion for innovative products: An empirical investigation for new automotive technologies. Res. Transp. Econ. 2015, 50, 17–28. [Google Scholar] [CrossRef] [Green Version]
  40. Huo, H.; Zhang, Q.; Wang, M.Q.; Streets, D.G.; He, K. Environmental implication of electric vehicles in China. Environ. Sci. Technol. 2010, 44, 4856–4861. [Google Scholar] [CrossRef]
  41. Qiao, Q.; Zhao, F.; Liu, Z.; He, X.; Hao, H. Life cycle greenhouse gas emissions of Electric Vehicles in China: Combining the vehicle cycle and fuel cycle. Energy 2019, 177, 222–233. [Google Scholar] [CrossRef]
  42. Katoch, S.; Chauhan, S.S.; Kumar, V. A review on genetic algorithm: Past, present, and future. Multimed. Tools Appl. 2021, 80, 8091–8126. [Google Scholar] [CrossRef]
  43. New Energy Automobile Industry Development Plan. Available online: http://www.gov.cn/zhengce/content/2020-11/02/content_5556716.htm (accessed on 10 August 2022).
  44. MacDonald, J. Electric Vehicles to Be 35% of Global New Car Sales by 2040; Bloomberg New Energy Finance: New York, NY, USA, 2016; Volume 25, p. 4. Available online: http://www.bbhub.io/bnef/sites/4/2016/02/BNEF_EV-Forecast_2016_FINAL.pdf (accessed on 3 November 2022).
  45. Li, X.; Xiao, X.; Guo, H. A novel grey Bass extended model considering price factors for the demand forecasting of European new energy vehicles. Neural Comput. Appl. 2022, 34, 11521–11537. [Google Scholar] [CrossRef]
  46. Kumar, R.R.; Guha, P.; Chakraborty, A. Comparative assessment and selection of electric vehicle diffusion models: A global outlook. Energy 2021, 238, 121932. [Google Scholar] [CrossRef]
  47. Dhakal, T.; Min, K.-S. Macro study of global electric vehicle expansion. Foresight STI Gov. 2021, 15, 67–73. Available online: https://cyberleninka.ru/article/n/macro-study-of-global-electric-vehicle-expansion/viewer (accessed on 6 November 2022). [CrossRef]
  48. Wilson, L. Shades of green: Electric Cars’ Carbon Emissions around the Globe. 2013. Available online: http://shrinkthatfootprint.com/wp-content/uploads/2013/02/Shades-of-Green-Full-Report.pdf (accessed on 25 November 2022).
  49. Wolfram, P.; Lutsey, N. Electric Vehicles: Literature Review of Technology Costs and Carbon Emissions; The International Council on Clean Transportation: Washington, DC, USA, 2016; pp. 1–23. [Google Scholar]
  50. Lander, L.; Kallitsis, E.; Hales, A.; Edge, J.S.; Korre, A.; Offer, G. Cost and carbon footprint reduction of electric vehicle lithium-ion batteries through efficient thermal management. Appl. Energy 2021, 289, 116737. [Google Scholar] [CrossRef]
  51. Wang, D.; Coignard, J.; Zeng, T.; Zhang, C.; Saxena, S. Quantifying electric vehicle battery degradation from driving vs. vehicle-to-grid services. J. Power Sources 2016, 332, 193–203. [Google Scholar] [CrossRef]
Figure 1. Fuel Cycle Process.
Sustainability 14 16003 g001
Figure 2. The carbon reduction effects of the fuel cycle.
Sustainability 14 16003 g002
Figure 3. The generation mix of the six main power grids in 2020.
Sustainability 14 16003 g003
Figure 4. Forecast result of the improved generalized Bass model.
Sustainability 14 16003 g004
Figure 5. The Number of Charging Piles from 2025 to 2050.
Sustainability 14 16003 g005
Figure 6. Forecast for NEV ownership from 2025 to 2050.
Sustainability 14 16003 g006
Figure 7. CO2 emission reduction potential under the baseline scenario.
Sustainability 14 16003 g007
Figure 8. Sensitivity analysis for power generation mix changes.
Sustainability 14 16003 g008
Figure 9. Sensitivity analysis for increasing travel distance.
Sustainability 14 16003 g009
Table 1. Main indicators used in assessing carbon reduction effects.
CriteriaIndicatorSource
Social Economic DataGross Domestic Product (GDP) 2020 China Statistical Yearbook
Regional PopulationThe 7th Population Census in PRC
NEV StockRegional Data of NEV StockTraffic Administration Bureau of the Ministry of Public Security (TABMPS)
NEV Mileage DataAnnual Accumulative Mileage of Different Usage Classifications (Passenger Cars, Buses, and Trucks)New Energy Vehicle Big Data Research Report
Annual Accumulative Mileage of Different Technology Classifications (BEVs, FCVs, and PHEVs)New Energy Vehicle National Big Data Alliance Briefing
Charging DataCharging Pile StocksChina Electric Vehicle Charging Infrastructure Promotion Alliance (EVCIPA)
Annual Charging Data of NEVsChina Electric Vehicle Charging Infrastructure Promotion Alliance (EVCIPA)
Energy Source Related DataRegional Generation MixChina Energy Statistical Yearbook, 2020
Mining EfficiencyChina Statistical Yearbook on Electricity, 2020
Transmission EfficiencyChina Statistical Yearbook on Electricity, 2020
Power Generation EfficiencyChina Statistical Yearbook on Electricity, 2020
Table 2. CO2 emission reduction effects of different types of NEVs.
NEV TypesClassification Based on UsageCO2 Emission Reduction (Million Tons)
BEVPassenger cars110.65
Buses127.62
Trucks48.61
PHEVPassenger cars5.05
Buses5.82
Trucks2.22
FCVPassenger cars0.16
Buses0.18
Trucks0.06
Table 3. Settings of parameters of the genetic algorithm.
IterationSample SizeCrossover RateMutation Rate
5005000.80.1
Publisher’s Note: MDPI stays neutral with regard to jurisdictional claims in published maps and institutional affiliations.

