Article

Potential Allelopathic Effect of Wheat Straw Aqueous Extract on Bermudagrass Noxious Weed

by
Sameera A. Alghamdi
1,
Ashwag A. Al-Nehmi
1 and
Omer H. M. Ibrahim
2,3,*
1
Department of Biological Sciences, Faculty of Science, King Abdulaziz University, Jeddah 21589, Saudi Arabia
2
Department of Arid Land Agriculture, Faculty of Meteorology, Environment and Arid Land Agriculture, King Abdulaziz University, Jeddah 21589, Saudi Arabia
3
Department of Floriculture, Faculty of Agriculture, Assiut University, Assiut 71515, Egypt
*
Author to whom correspondence should be addressed.
Sustainability 2022, 14(23), 15989; https://doi.org/10.3390/su142315989
Submission received: 24 October 2022 / Revised: 27 November 2022 / Accepted: 28 November 2022 / Published: 30 November 2022
(This article belongs to the Special Issue Biological Invasion and Biodiversity)

Abstract

:
Residues of several crops, including wheat, have a promising allelopathic effect on noxious weed species and thus represent eco-friendly alternatives to harmful, widely applied herbicides. The current investigation deals with the effects of wheat straw aqueous extract on the growth and biochemical aspects of bermudagrass (Cynodon dactylon L.) as a model of harmful weeds for the wheat crop. The prepared aqueous extract from wheat straw was subjected to high-performance liquid chromatography (HPLC) analysis to identify and quantify phenolic and flavonoid components. In addition, the allelopathic effect of different concentrations of the extract on the germination, seedling growth, and biochemical aspects of bermudagrass was assessed. Our findings showed a significant decrease in bermudagrass seed germination percentage (ranging from 29.6 to 82.4%) and germination index (ranging from 10.07 to 32.43) in response to the extract treatments and a significant decline in all morphological growth parameters of the seedling. HPLC analysis of the extract showed the presence of seven phenolic acids and six flavonoids. The most prevalent phenolics included pyrogallol (13.75 µg/g), ferulic acid (9.82 µg/g), gallic acid (8.5 µg/g), and isoferulic acid (4.47 µg/g), while the predominant flavonoids included catechin (11.04 µg/g), luteolin (8.26 µg/g) and quercetin (7.74 µg/g). The highest extract concentrations (75% and 100%) showed a corresponding decline in the leaf content of chlorophylls a and b but a significant increase in the content of free amino acids, total protein and soluble carbohydrates. Superoxide dismutase (SOD) activity exposed a concentration-dependent reduction, while the activities of both catalase (CAT) and ascorbate peroxidase (APX) were reduced only with the highest extract concentration. The principal component analysis (PCA) showed a high correlation among the morphological growth parameters, indicating that these elements either have a common ground of variance or are inter-correlated. Accordingly, our findings suggest the possibility of combating bermudagrass weeds using the aqueous extract of wheat straw.

1. Introduction

It has been reported that the loss in crop yield caused by weeds reaches up to 25% in developing countries, which leads to the overuse of herbicides and other pesticides to prevent or at least alleviate that high loss [1]. Despite the efficiency of herbicides in combating weeds, continuous use of elevated concentrations has triggered a serious problem of weed resistance against many herbicides [2]. Moreover, herbicides represent a danger to the environment due to their negative impact on soil, water and air, which indirectly threatens human health through the consequent impact on food safety [3,4]. Because of the increasing risks from the overdependence on, and irrational use of, herbicides, much attention has recently been devoted to their impact on human health and the surrounding environment, in addition to investigating potential eco-friendly natural substitutes for weed control: of these alternatives, plant extracts with allelopathic activity have been suggested as efficient, cheap and safe substances [5,6].
Chemicals released from plants that impose allelopathic influences are termed “allelochemicals”. Allelochemicals can be present in several plant parts, which are released into the environment by root exudation, leaching from aboveground parts, and volatilization and/or decomposition of plant material [7]. Recently, field crops with allelopathic activity have assumed overwhelming importance in efforts to overcome the adverse effects of chemical herbicides on the environment and the increasing resistance of weeds to herbicides. Among the many cover crops reported for their allelopathic activity, wheat (Triticum aestivum L.) has exhibited a vigorous allelopathic effect on a wide range of weed species [8,9,10,11,12]; moreover, wheat is considered a worldwide staple food, as it contains a crucial supply of carbohydrates and several other minerals and vitamins, and is thus, the main ingredient in several foods. Several methods have been reported to exploit wheat’s ability to combat weeds, including growing wheat in a crop rotation, applying its residues as soil mulch, and exposing weeds to its aqueous extract [13,14].
There are more than 30,000 identified weed species, imposing a severe problem on crop production through their negative impact on crop yield. The competition effect of weeds on crop yield loss is about 45%, with wide variation between crops, ranging from about 34% in wheat to about 90% in vegetable crops. One of the most noxious and highly competitive weeds in the agriculture system is Cynodon dactylon, known as bermudagrass. It is a perennial grass belonging to the family Poaceae and is distributed throughout the tropical and subtropical regions. Bermudagrass spreads through seeds, runners and extensive underground rhizomes, which enables it to invade almost all kinds of crops [15]. The exact competitive potential of bermudagrass has been reported by some previous publications; Juraimi et al. [16] reported a reduction in dry weight ranging from 44 to 52% in wheat, faba bean maize and soybean crops because of the competition with bermudagrass. Some other reports recorded yield loss of about 55–64% in sunflower and 16 to 80% in cotton [16,17].
The common allelochemicals from crop plants are secondary metabolites such as phenolics, terpenoids and alkaloids. The high allelopathic activity of wheat has been attributed to hydroxamic acids and related compounds, together with phenolic acids [1], which have been reported by several previous studies [18,19,20]. Accordingly, the efficiency of wheat residue extracts in combating weed growth has been investigated by several authors as an eco-friendly alternative to the chemical herbicides widely used nowadays [21]. From an agronomic point of view, allelopathic weed management seems immediately advantageous as an alternative or a supplement to other weed management practices in crop production and thus has frequently been mentioned as environmentally favorable [18,22]. An allelopathic effect of the aqueous extract from wheat residues on some weed species, such as Lolium rigidum [20], blackgrass [23] and Avena fatua L. [24], has been reported. Several authors, such as Pethö [13], have also documented the discharge of allelochemicals from living wheat plants. Therefore, the allelopathic potential of wheat can contribute to weed management in an eco-friendly way in different cropping systems [21,25].
The current study focused on the allelopathic efficiency of the wheat straw aqueous extract against bermudagrass (C. dactylon), one of the noxious weed species growing in wheat crops. Thus, the study’s objectives were to prepare an aqueous extract from wheat straw, identify its constituents from allelochemicals and elucidate the extract’s allelopathic effect on weed control in terms of germination rate, seedling growth and biochemical aspects.

2. Materials and Methods

2.1. Preparation of Wheat Straw Aqueous Extract

The fresh straw of common wheat (T. aestivum L.) was collected from wheat fields in Hail region, Saudi Arabia, at the soft dough stage of maturity. The wheat straw was transferred to the lab at the Department of Biological Sciences, Faculty of Science, King Abdulaziz University, Saudi Arabia, where it was air-dried in shadow at room temperature (25 °C) and 65% relative humidity for ten days. Afterward, it was ground into a fine powder and stored in air-tight plastic bags in the dark until used. An aqueous extract was prepared from wheat straw using distilled water as per the method reported by Kaur and Arora [26]. Fifty grams of the dried pulverized wheat straw were suspended in 1000 mL of distilled water and shaken for 72 h by a horizontal rotary shaker (Sheldon Manufacturing Inc., Cornelius, OR, USA) at room temperature. The macerate was strained through gauze and filtered using Whatman filter paper. The filtered solution, referred to hereafter as 100% concentration, was further diluted appropriately with distilled water to give the desired extract concentrations of 25%, 50% and 75%. The solutions were kept in a dark, cool place until applied or used for further analyses. To quantify the active components in the extract using HPLC, a part of the aqueous extract (250 mL) was freeze-dried (Telstar-LyoQuest plus-55 lyophilizer) at 1.5 × 10⁻⁴ mbar for 48 h. The yield of the dried extract was calculated (9.5%) relative to the wheat straw powder, and it was then stored in dark vials at −20 °C until used.

2.2. HPLC Analysis of Wheat Extract

Identifying and quantifying phenolic acids and flavonoids in the wheat straw aqueous extract was conducted using HPLC (Agilent 1100) coupled with two LC-pumps, a UV/Vis detector, and a C18 column (125 mm × 4.60 mm, 5 µm particle size). The mobile phase utilized to separate phenolic acids was composed of methanol (solvent A) and acetic acid in water at a 1:25 ratio (solvent 2). The eluting phenolic compounds were detected at a 250 nm wavelength. For flavonoids, an isocratic elution (70:30) program was applied using a mobile phase of acetonitrile (A) and 0.2% (v/v) aqueous formic acid (B), where a detection wavelength of 360 nm was employed. The obtained chromatograms were analyzed using the Agilent ChemStation, and the final concentrations were expressed as µg/g of dry wheat straw powder. The detected compounds were identified and quantified with standard curves of authentic chemicals purchased from Sigma-Aldrich (St. Louis, MO, USA). These included p-coumaric, caffeic, p-hydroxybenzoic, pyrogallol, gallic, isoferulic, ferulic, quercetin, kaempferol, luteolin, hesperidin, catechin, and chrysoeriol.

2.3. Greenhouse Bioassay

The targeted weed species in the current study was Cynodon dactylon L., known as twitch or bermudagrass. Seeds of bermudagrass were kindly provided by the Ministry of Environment, Water and Agriculture, Saudi Arabia. A pot experiment was conducted at the nursery of King Abdulaziz University under net greenhouse conditions (50–60% shade). Seeds were sown in 15-cm plastic pots containing a mixture of 1:1 sand to peat moss. The wheat aqueous extract, previously prepared at different dilutions (25%, 50%, 75%, 100%), was used to irrigate sown seeds daily at a 50 mL/pot rate, While the pots irrigated with distilled water served as the control. Each treatment was replicated five times, with 20 seeds in each replicate. Seed germination was monitored daily, and the possible morphological and biochemical parameters were estimated. The assay was terminated after 22 days when no germination occurred for 3 consecutive days.

2.4. Determination of Morphological Parameters

2.4.1. Germination Percentage (G%)

G% was calculated as the total number of germinated seeds divided by the total number of sown seeds and expressed as a percentage.

2.4.2. Germination Index (GI)

GI was calculated by using Equation (1), where Gi is the number of germinated seeds in I [the time after cultivation (day)] [27,28,29,30].
GI = ( Gi I )

2.4.3. The Fresh and Dry Weights of Shoots and Roots

After the termination of the experiment, seedlings were washed with distilled water and gently dried with tissue paper before assessing the fresh weights (FW) of shoots and roots together with their dry weights (DW) after being air-dried until the weight was constant. At least 15 seedlings per treatment were used to determine FW and DW.

2.4.4. Shoot and Root Lengths

The average lengths of shoots and roots were measured in all 20 seedlings for each treatment.

2.4.5. Inhibition Percentages

Germination inhibition %, inhibition % of root length, inhibition % of shoot length and inhibition % of seedling growth were calculated according to Equations (2)–(5), respectively [28,29,30].
Germination   inhibition   percentage = germination   %   of   the   treatment germination   %   of   the   control germination   %   of   the   control × 100
Inhibition   %   of   root   length = root   length   of   the   treatment root   length   of   the   control root   length   of   the   control × 100
Inhibition   %   of   shoot   length = shoot   length   of   the   treatment shoot   length   of   the   control shoot   length   of   the   control × 100
Inhibition   %   of   seedling   length = seedling   length   of   the   treatment seedling   length   of   the   control seedling   length   of   the   control × 100

2.4.6. Vigor Indices

Vigor indices of shoot, root and seedling were estimated as per Equations (6)–(8), respectively [29].
Shoot   vigor   index =   germination   percentage × shoot   length
Root   vigor   index =   germination   percentage × root   length
Seedling   vigor   index =   germination   percentage × seedling   length

2.5. Determination of Physiological and Biochemical Parameters

2.5.1. Chlorophyll and Carotenoid Contents

The leaf content of chlorophylls and carotenoids was determined according to the method described by Yang et al. [31] and Braniša et al. [32]. First, a fresh leaf sample (0.05 g) was ground in 2 mL of 80% acetone (Loba Chemie Pvt Ltd., Mumbai, India), then samples were filtered through Whatman filter paper, and the final volume was completed to 10 mL. The absorbance was directly measured using the UV-vis spectrophotometer (Lambda 25, PerkinElmer, Inc., Waltham, MA, USA) at 663.6, 646.6 and 470 nm. The calculation of Chl a, Chl b and carotenoids content (mg/g FW) was performed according to Equations (9)–(11).
Chlorophyll   a   ( µ g / mL ) = 12.25   A 663.6 × 2.25   A 646.6
Chlorophyll   b   ( µ g / mL ) = 20.31   A 646.6 × 4.91   A 663.6
Total   carotenoids   ( µ g / mL ) = 1000   A 470 2.27   chl   a 81.4   Chl   b 227

2.5.2. Total Soluble Carbohydrates

The soluble carbohydrates content was estimated by the colorimetric anthrone method, where carbohydrates were dehydrated by concentrated sulfuric acid (VWR BDH CHEMICALS, Fontenay-sous-Bois, France) to form furfural which condenses with anthrone reagent (Sigma-Aldrich, Darmstadt, Germany) to form green color [33]. A mixture of 0.02 g of anthrone, 3.0 mL of distilled water, 8 mL of absolute ethyl alcohol (VWR BDH CHEMICALS, Fontenay-sous-Bois, France) and 100 mL of concentrated H2SO4 (D = 184) (Loba Chemie Pvt Ltd., Mumbai, India) was prepared in a conical flask under continuous cooling in an ice bath. In a test tube, 0.2 mL of the prepared sample extract was mixed with 4.5 mL of freshly prepared anthrone reagent mixture. The test tube was boiled at 100 °C in a water bath (Memmert GmbH, Schutzart, Schwabach, Germany) for 7 min and then directly cooled for 5 min. The absorbance of the developed blue-green color was measured at 620 nm against a blank containing 1 mL of water and anthrone reagent mixture. Different concentrations of glucose (Loba Chemie Pvt Ltd., Mumbai, India) were prepared and used to calculate the concentration of total soluble carbohydrates in plant samples (n = 5).

2.5.3. Total Soluble Proteins

Soluble protein content was estimated in the shoot extract according to the Lowry method for protein quantitation [34]. In brief, a complex-forming reagent was freshly prepared by mixing the three following reagents in the proportion of 100:1:1, respectively: reagent A; 2% (w/v) Na2CO3 (Riedel-de-Haen, Honeywell Specialty Chemicals GmbH, Seelze, Germany) in distilled water, reagent B; 1% (w/v) CuSO4.5H2O (Loba Chemie Pvt Ltd., Mumbai, India) in distilled water and reagent C; 2% (w/v) sodium potassium tartrate (Loba Chemie Pvt Ltd., Mumbai, India) in distilled water. An aliquot of 0.1 mL of the sample or standard (egg albumin) was hydrolyzed in 2 N NaOH (Al SAGGAF Pharma HOLYLAND, Riyadh, KSA) by heating in a water bath at 100 °C for 10 min. After cooling, 1 mL of freshly mixed complex-forming reagent was added and left for 10 min at room temperature. With this solution, 0.1 mL of 1 N Folin reagent (Loba Chemie Pvt Ltd., Mumbai, India) was mixed thoroughly and left at room temperature for 30 min. The extinction against the appropriate blank was read at 750 nm using the UV-vis spectrophotometer (Lambda 25, PerkinElmer Inc., Richmond, CA, USA). A standard curve was plotted of the absorptions of serial concentrations of egg albumin (Sigma-Aldrich, Steinheim, Germany) and used to determine the concentration of total soluble proteins in plant samples (n = 5) [35].

2.5.4. Total Free Amino Acids

The total free amino acids content in the shoot extract was estimated according to the method of Moore and Stein [36]. The employed reagents included ninhydrin reagent (0.25 g of ninhydrin dissolved in 100 mL of ethanol), Citrate buffer (10.5 g of citric acid in 100 mL of 2 N NaOH added dropwise to adjust the pH to 5), stannous chloride reagent (0.01 g of stannous chloride + 10 mL of citrate buffer + 10 mL of ninhydrin reagent) and diluent solvent (a mixture of equal volumes of ethanol and distilled water). One ml of stannous chloride reagent was added to 0.5 mL of the plant extract sample, and the mixture was then boiled in a water bath for 20 min and then cooled. After that, 4 mL of diluent solvent was added and mixed rapidly. The extinction of violet color was recorded spectrophotometrically (UV-vis spectrophotometer, Lambda 25, PerkinElmer Inc., CA, USA) at a wavelength of 570 nm against a blank containing all the above reagents and distilled water instead of the plant sample. Alanine (Sigma-Aldrich, Steinheim, Germany) was prepared in different concentrations and used to determine the concentration of free amino acids in plant samples (n = 5).

2.5.5. Antioxidant Enzymes

Enzyme extraction was performed according to the method reported by Cakmak and Marschner [37] with some modifications. Briefly, 0.1 g of plant leaves (n = 5) were ground in a cooled mortar in liquid nitrogen, and it was then homogenized in 3 mL of 100 mM potassium phosphate buffer (7.8 pH), which contained 0.1 g polyvinylpyrrolidone (PVP) and 0.1 mM of ethylenediaminetetraacetic acid (EDTA). The resulting homogenate was transferred to a 2 mL Eppendorf tube and was centrifuged at 18,000 rpm for 10 min at 4 °C using an MPW-260R centrifuge (MPW Med. Instruments, Warszawa, Poland). Finally, the upper phase (supernatant) was used to analyze antioxidant enzyme activity. Unless otherwise stated, all chemicals and reagents used for antioxidant enzymes were purchased from Loba Chemie Pvt Ltd., Mumbai, India, and the absorption was determined using a UV-vis spectrophotometer (Lambda 25, PerkinElmer Inc., CA, USA).
Superoxide dismutase (SOD): The activity of SOD (EC 1.15. 1.1) was estimated according to the spectrophotometric method cited by Misra and Fridovich [38]. A reaction reagent was prepared of sodium carbonate buffer (25 mM, 10.2 pH) and EDTA (0.5 mM). A volume of 2 mL of the reaction reagent was added to a cuvette, with 100 µL of the enzyme extract and 100 µL of 15 mM epinephrine (0.03 g of epinephrine in 10 mM hydrochloric acid) to start the reaction. The absorbance was measured every minute for 5 min at 480 nm, and SOD enzyme activity was calculated using the molar extinction coefficient of 43.6 mM−l cm−1.
Ascorbate peroxidase (APX): APX activity (EC 1.11.1.11) was determined according to Nakano and Asada’s spectrophotometric method [39]. The activity was determined by the decreased absorption due to ascorbate oxidation at 290 nm for 5 min at one-minute intervals. To start the reaction, a mixture was prepared of 100 µL of enzyme extract with 2.7 mL of 50 mM potassium phosphate buffer of pH 7 (PanReac AppliChem, Barcelona, Spain), 100 µL of 5 mM H2O2, 50 µL of 0.1 mM Na2-EDTA, and 100 µL of 0.5 mM ascorbic acid. The absorbance was measured at 290 nm, and the APX activity was calculated using the molar extinction coefficient of 2.8 mM−1 cm−1.
Catalase (CAT): Measuring the rate of H2O2 transformation to O2 was used to determine the activity of CAT (EC 1.11.1.6) according to a modified method by Aebi [40]. 2.4 mL of 50 mM potassium phosphate buffer (pH 7) was mixed with 500 µL of the enzyme extract and 50 µL of 10 mM H2O2 to initiate the reaction, and then the absorption was measured at 240 nm every minute for 5 min. The enzyme activity was determined by the reduction of absorptivity and was calculated using the extinction coefficient of 39.4 mM−l cm−1.

2.6. Statistical Analysis

One-way ANOVA was applied to detect differences between treatments (n = 5). The means were compared using the LSD test at p value of 0.05. All data were presented as mean ± SD. The analysis was performed using Statistix software (ver. 8.1, Analytical Software, Tallahassee, FL, USA), and Principal Components Analysis (PCA) was performed using Analyse-it Software (v. 5.6 for Excel).

3. Results

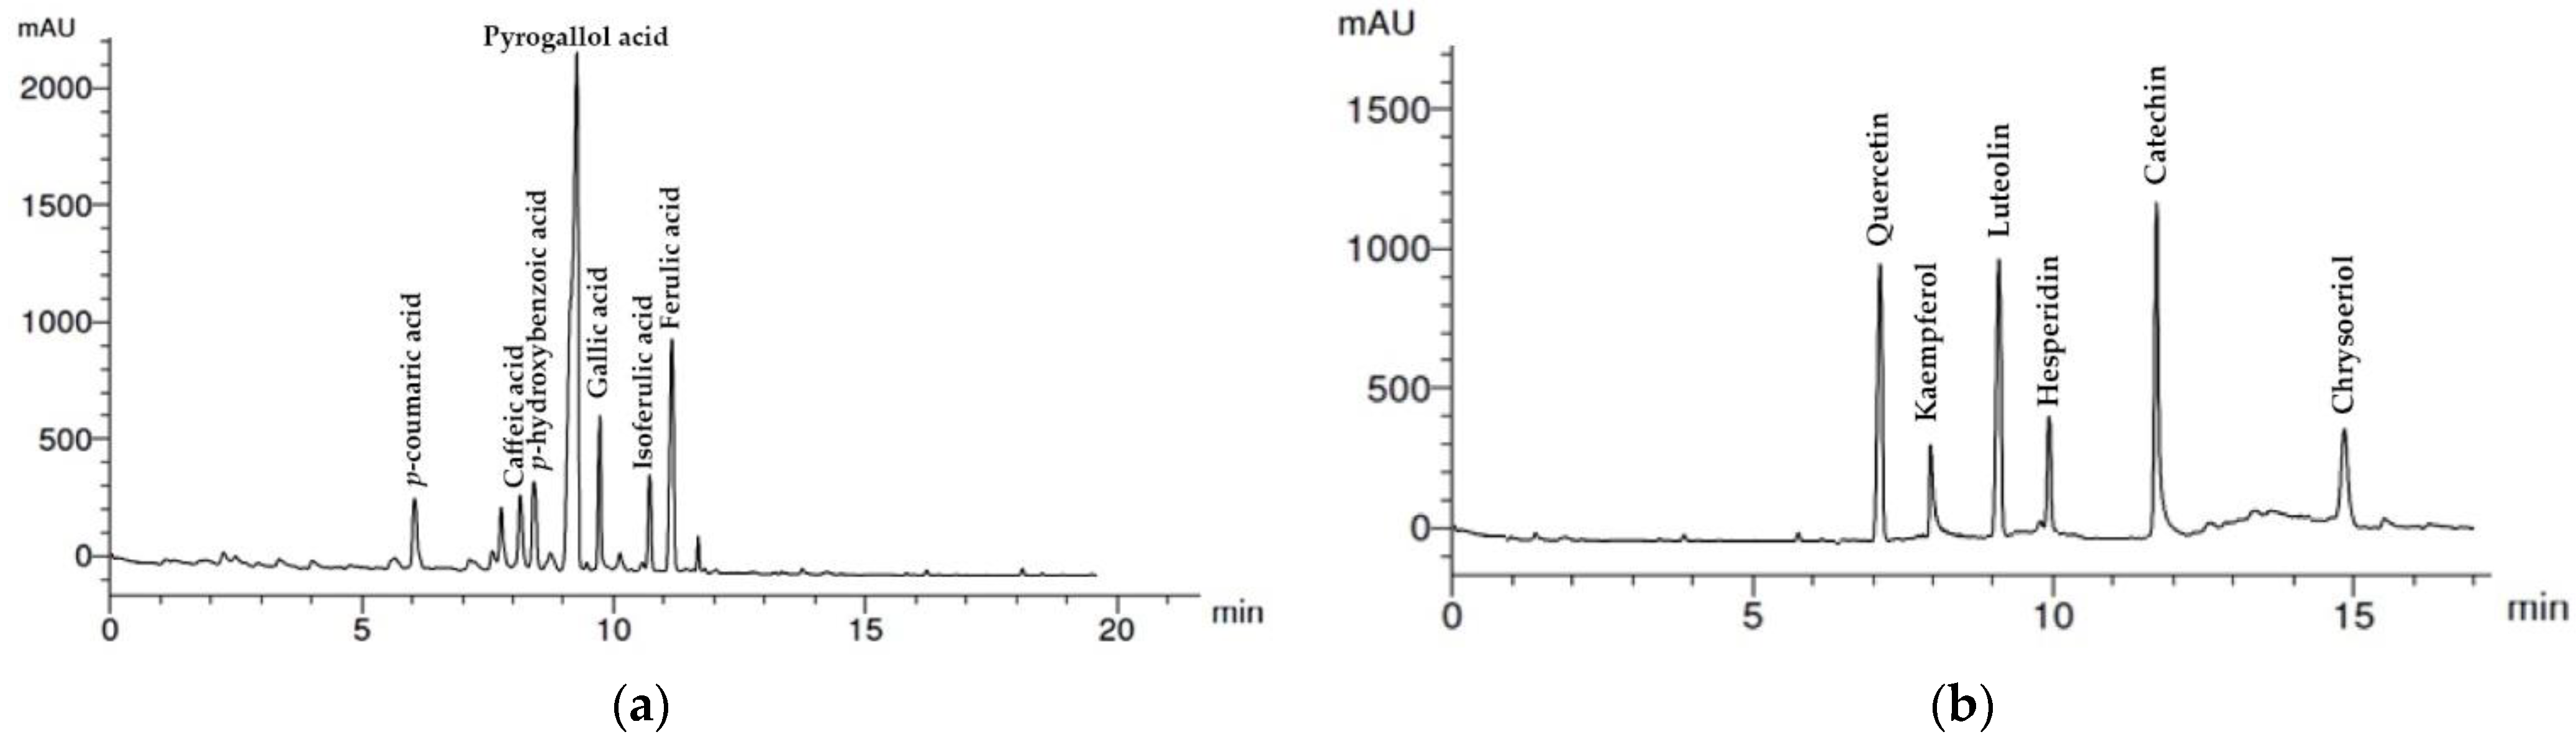
3.1. HPLC Analysis of Wheat Straw Aqueous Extract

HPLC was applied to screen phenolic and flavonoid components in the wheat straw aqueous extract, which revealed the presence of seven phenolic acids (Table 1 and Figure 1a) and six flavonoids (Table 2 and Figure 1b). The prevalent phenolic acids in the wheat straw (calculated based on a dry weight basis) were pyrogallol (13.75 µg/g), ferulic acid (9.82 µg/g), gallic acid (8.5 µg/g) and isoferulic acid (4.47 µg/g). In addition, three more acids were detected in low concentrations; p-coumaric acid (1.99 µg/g), caffeic acid (1.44 µg/g) and p-hydroxybenzoic acid (1.66 µg/g). Regarding flavonoids, catechin (11.04 µg/g), luteolin (8.26 µg/g) and quercetin (7.74 µg/g) were the most abundant, while hesperidin (3.88 µg/g), kaempferol (2.91 µg/g) and chrysoeriol (2.83 µg/g) were detected in low concentrations.

3.2. Effects on Seed Germination and Seedling Growth

The growth behavior of bermudagrass subjected to the treatment with the aqueous extract of wheat straw was traced by studying the seed germination and the morphological traits of the sprouts. G% ranged from 29.6 to 82.4% and significantly varied among various extract levels showing a concentration-dependent response (Figure 2a). Both the control treatment and the lowest extract concentration (25%) induced the highest G%, which was significantly reduced as the extract concentration was increased. Seeds irrigated with the highest extract concentration showed the greatest decrease in G%. The germination time was considered in calculating the germination index (GI), which showed a similar trend to G%. A significant reduction in GI started at 50% extract concentration or higher (75% and 100%) in a concentration-dependent manner (Figure 2b). The same extract concentrations (50%, 75%, and 100%) significantly reduced seedlings’ fresh and dry weights (Figure 2c,d). This was accompanied by a significant decrease in the lengths of shoots, roots, and seedlings (Figure 3 and Figure 4). The length of nontreated seedlings exceeded 19.0 cm compared with 17.7, 11.6, 7.9 and 6.3 cm of those treated with 25, 50, 75 and 100 extract concentrations, respectively.
The growth inhibition was quantified relative to the control and was expressed as rates of germination inhibition, shoot inhibition, root inhibition and seedling growth inhibition (Figure 5). The four parameters showed consistent responses, where the highest extract concentration induced the most substantial adverse effect on seedling growth. When G% values were multiplied by seedling growth traits (shoot, root, and seedling lengths), vigor indices were obtained (Figure 6). A significant decline in the shoot, root, and seedling indices was observed in seedlings subjected to irrigation with high extract concentrations (50%, 70% and 100%). However, the control treatment and the lowest extract concentration (25%) showed no significant differences.

3.3. Effects on Physiological and Biochemical Traits of Bermudagrass

Quantification of leaf content of photosynthetic pigments revealed an evident significant decline in the range of chlorophylls a and b in seedlings treated with 75 and 100% concentrations. Meanwhile, fluctuated values were recorded in the control treatment and the extract at 25 or 50% (Figure 7). The opposite was true for total carotenoid content, where the extract at 50, 75 and 100% showed higher content than the control but lower than the 25% extract concentration. Moreover, the highest two extract concentrations (75% and 100%) showed a significant increase in the content of free amino acids, total soluble proteins, and soluble carbohydrates, especially with the 100% concentration (Figure 8). The activity of the three oxidative enzymes assessed was varied, as inferred from the data illustrated in Figure 9. Compared with SOD activity in nontreated plants (control), the plants subjected to the 25% extract treatment showed a slight decrease, followed by a significant reduction in response to higher extract concentrations. On the other hand, fluctuation in CAT and APX activities was detected. Their values increased with the 50% extract concentration, followed by significant reductions with higher concentrations. The APX also showed the highest activity in the 50% extract treatment, while the lowest activity was recorded in the 100% extract.

3.4. Principal Component Analysis

PCA results illustrated in Figure 10 showed that the cumulative variance explained by PC1 and PC2 principal components accounts for 95.7% of the total variance of the data. Most variables were strongly represented in the plot, as was clear from the long vectors. Vectors of all morphological growth parameters, including seedling length and weight, vigor indices and inhibition ratios, were clustered together, indicating a strong positive correlation. All these traits showed a strong positive correlation with G%, GI, SOD and total carotenoid content, but medium to week correlations with Chl a, Chl b and APX and no correlation with CAT. The three parameters of soluble proteins, free amino acids and soluble carbohydrates negatively correlated with all the other parameters.

4. Discussion

Allelopathic aqueous extracts have been successfully used for organic weed management by reducing weed density and biomass [41]. When applied at high concentrations, these allelochemicals interfere with cell division, hormone biosynthesis, mineral uptake and transport [42], membrane permeability [43], stomatal oscillations, photosynthesis [44], respiration, protein metabolism [45] and plant water relations [7], which ultimately cause substantial growth reduction of the recipient crop or weed plant. In agreement with these reports, the current study’s findings showed a significant decrease in bermudagrass seed G% and GI in response to the treatment with various concentrations of wheat straw aqueous extract. In addition, a significant decline in all morphological growth parameters of the seedling was observed. Our findings are supported by the results of several previous publications, reporting a suppressive effect of wheat aqueous extracts on the germination of different weed species; Portulaca oleracea L. and Stellaria media L. [46], pigweed and perennial ryegrass [20,21,28,47,48], blackgrass [23], Avena fatua L. [24], Trianthema portulcastrum [49,50], Amaranthus retroflexus, S. media and Digitaria ciliaris [51], Eclipta prostrate L., Echinochloa crus-galli L. [52], A. fatua L. and Sisymbrium orientale L. [53], Bromus japonicus L. and Chenopodium album L. [54] and canola [55]. The decrease in weed seed germination reported in some studies reached 86% in pigweed [28,47], which is quite close to our results, where germination inhibition of bermudagrass achieved 61.7% for aqueous wheat extract. Scavo et al. [46] confirmed the reduction in seed germination and mean germination time of P. oleracea and S. media as a result of the application of aqueous extracts from various durum wheat landraces. Furthermore, water extracts of wheat straw inhibited the propagule growth of the common forest weed red raspberry (Rubus idaeus L.) by 44%, and this allelopathic effect was further verified in field experiments [48].
The current study’s findings revealed the presence of seven phenolic acids in the wheat straw aqueous extract: pyrogallol, ferulic, gallic and isoferulic acids were the most prevalent, while lower levels were detected for p-coumaric, caffeic and p-hydroxybenzoic acids. Moreover, six flavonoids were detected: catechin, luteolin and quercetin were the most abundant, while hesperidin, kaempferol and chrysoeriol were detected at lower levels. According to our results, the total content of the identified phenolic acids and flavonoids was 78.3 µg/mg DW. This value is low compared with those previously reported for total phenolic acids by Wu et al. [56], which varied from 93.2 to 453.8 µg/mg DW of wheat shoots. However, great variation has been reported for the wheat straw content of individual phenolic acids and flavonoids. In accordance with our study, Wu et al. [56] and Salomonsson et al. [57] reported the abundance of trans-ferulic and trans-p-coumaric acids in wheat tissues, while Lodhi et al. [58] demonstrated the superiority of ferulic over p-coumaric acid. Moreover, Scavo et al. [46] emphasized the critical role of total phenols and flavonoids in the allelopathic effect of the wheat extract. Ben-Hammouda et al. [59] were not successful in frequently detecting ferulic acid in sorghum plant parts; however, p-hydroxybenzoic, syringic, and vanillic acids were the predominant acids. These considerable variations can be understood and justified based on the differences among plant genotypes, environmental growth conditions, plant parts and their physiological status, together with the extraction and analytical techniques applied [56,59]. Furthermore, Fatholahi et al. [60] and Wu et al. [56] noticed a correlation between the level of phenolic acids in stems of different wheat accessions and their potential allelopathic activity against annual ryegrass. These findings suggest a substantial contribution of phenolic acids in the allelopathic potential of wheat accessions [61]. There is concrete evidence that phenolic compounds are the most widespread water-soluble allelochemicals that pose significant effects in mutual plant interactions, including allelopathy [62,63]. Likewise, flavonoids represent a clear example of defensive allelochemicals used by plants to protect against UV radiation [64]. Several previous publications have demonstrated a reduction in seed germination of different weed species in response to various phenolics and flavonoids; ferulic, caffeic, p-hydroxybenzoic, cinnamic, syringic and p-coumaric acids, hesperidin, kaempferol, catechol, vanillin, quercetin and rutin [60,63,65,66,67,68]. Furthermore, high interference ability with weed growth and biochemical aspects has been reported for p-hydroxybenzoic, caffeic and p-coumaric acids, luteolin quercetin and rutin on the shoot and root growth [63,66,69,70,71], pyrogallol, gallic, protocatechuic, caffeic and p-coumaric acids on the synthesis of chlorophyll and photosynthesis pathways [30,63,72,73,74], p-hydroxybenzoic, ferulic and p-coumaric acid on biomass accumulation [65,70].
Different mechanisms have been reported for the effect of various allelochemicals on seeding growth [75]: p-hydroxybenzoic, p-coumaric, ferulic and caffeic acids induced water stress and stomatal closure in Glycine max [76,77], hydroxamic acid showed mitotic interference in Lactuca sativa [78] and caffeic acid inhibited cell division in Euphorbia esula [79]. Additionally, Devi and Prasad [80] attributed the inhibitory effect of ferulic acid on the shoot and root growth of maize seedlings to its negative effect on hydrolytic enzymes; maltase, invertase, protease and phosphatase.
Quantifying the content of photosynthetic pigments, free amino acids, total proteins and soluble carbohydrates is another way to confirm the effect of allelochemicals on weed seedling growth. In our study, the leaf content of chlorophylls a and b revealed a significant decline in seedlings treated with 75% and 100% extracts. On the contrary, both extract concentrations showed a significant increase in the contents of free amino acids, total proteins and soluble carbohydrates, especially with the 100% concentration. In line with our results, Unal et al. [81] reported a concentration-dependent increase in total protein content in white mustard leaves in response to the treatment with sunflower and wheat root exudates. Similarly, the increase in free amino acid content has been reported in several plant species; P. oleracea leaves after the treatment with Rumex dentatus leaf extract [82] and R. dentatus as a result of Withania somnifera root extract treatment [83]. Unlike our results, several previous publications have shown a decrease in protein and sugar content with increasing extract concentration and, thus, attributed the increased free amino acid content to the degradation of highly abundant proteins [84]. However, the increased protein content recorded in our study could be justified according to the statement of Rakszegi [85], indicating that drought stress results in increased protein content, yet with considerable variation in protein composition, since the synthesis of many novel stress-specific proteins is induced under such conditions [86]. Environmental challenges increase ROS levels and thus activate defense pathways by accumulating proline and other amino acids [87,88]. Under mild stress conditions, photosynthesis is still partially active and, thus, disaccharides accumulate, which have an essential role as compatible solutes under stress conditions [89]. Increased contents of soluble carbohydrates have previously been reported in A. spinosus, Cassia tora and C. sophera treated with Eclipta alba leaf extract [90], in dodder treated with heliotrope (Heliotropium foertherianum) aqueous leaf extract [91] and in maize in response to leaf extracts of Acacia and Eucalyptus [92].
Several publications have reported a reduction in chlorophyll content by damaging the thylakoid membrane as a direct result of applying allelochemicals detected in wheat extracts; benzoic acid [93], p-coumaric, ferulic acids [94] and caffeic acid [79,95]. Inhibition of protein synthesis has also been reported in response to several phenolic acids through the reduction of the assimilation of specific amino acids into proteins [96]. Examples of that include p-coumaric, vanillic and ferulic acids in Abutilon theophrasti [95], benzoic, p-hydroxybenzoic, vanillic, cinnamic, p-coumaric and ferulic acids in soybean seedlings [93], m-tyrosine in Arabidopsis thaliana [97]. Moreover, different studies reported the inhibition of germination due to allelochemical-induced oxidative stress [98,99]. This further coincides with our findings showing varying activity of the three assessed oxidative enzymes. SOD activity exposed a concentration-dependent reduction. Meanwhile, only high extract concentrations (75% and 100%) induced a significant decline in the enzymatic activities of both CAT and APX. The stimulation of CAT and APX by the low concentrations and their inhibition by the high ones could be explained by the hormesis phenomenon, where allelochemicals induce hormesis (growth enhancement) at low doses [14,100], which is supported by the results of Unal et al. [81], Hua et al. [101] and Hong et al. [102]. It is also commonly believed that allelochemicals enhance the content of non-enzymatic antioxidants [103]. Ultimately, the high correlation among morphological growth parameters indicates that these elements either have a common ground of variance or are inter-correlated. Moreover, they are determinative characteristics for the adverse effects of the allelochemicals.
When considered comprehensively, our findings indicate the efficacy of the wheat aqueous extract in controlling bermudagrass weeds. From the practical point of view, preparing aqueous extracts is feasible for researchers in the lab and farmers on farms since it is simple, economical and eco-friendly. In addition, it allows the exploitation of wheat residues in an eco-friendly and profitable way; thus, it has environmental and economic dimensions. Our findings, together with those of previous studies, suggest the possibility of using aqueous wheat extracts to control various weed species that adversely affect wheat production. Expanding the application of plant extracts as substitutes for chemical pesticides helps to improve productivity, increase the area cultivated with a sustainable farming system, reduce production costs and increase the product’s safety. To avoid any harmful effect on wheat production, the autotoxicity of wheat extracts should be considered. Previous studies have shown considerable variations in the autotoxicity of wheat varieties [48]. Thus, more profound studies on the autotoxicity of specific varieties are needed before expanding the application of wheat extracts as natural herbicides in wheat fields.

5. Conclusions

The findings of the current investigation provided evidence-based information about the allelopathic effects of the wheat straw aqueous extract on bermudagrass weeds, which helps safely combat weeds and dispose of bothersome wheat residues. HPLC analysis revealed the presence of several phenolic acids and flavonoids in the extract, which contributed to its inhibitory effects on various attributes of germination and seedling growth of bermudagrass. Growth suppression was accompanied by a decline in the leaf content of chlorophylls a and b and SOD enzyme activity, with an increase in the content of free amino acids, total proteins and soluble carbohydrates.

Author Contributions

Conceptualization, S.A.A., A.A.A.-N. and O.H.M.I.; data curation, S.A.A., A.A.A.-N. and O.H.M.I.; investigation, A.A.A.-N.; methodology, S.A.A., A.A.A.-N. and O.H.M.I.; project administration, S.A.A. and O.H.M.I.; writing—original draft, A.A.A.-N. and O.H.M.I.; writing—review and editing, S.A.A., A.A.A.-N. and O.H.M.I. All authors have read and agreed to the published version of the manuscript.

Funding

This research received no external funding.

Institutional Review Board Statement

Not applicable.

Informed Consent Statement

Not applicable.

Data Availability Statement

The data that support the findings of this study are available on request from the corresponding author (O.H.M.I.).

Conflicts of Interest

The authors declare no conflict of interest.

References

  1. Lam, Y.; Sze, C.W.; Tong, Y.; Ng, T.B.; Tang, S.C.W.; Ho, J.C.M.; Xiang, Q.; Lin, X.; Zhang, Y. Research on the allelopathic potential of wheat. Agric. Sci. 2012, 3, 979–985. [Google Scholar] [CrossRef] [Green Version]
  2. Belz, R.G.; Carbonari, C.A.; Duke, S.O. The potential influence of hormesis on evolution of resistance to herbicides. Curr. Opin. Environ. Sci. Health 2022, 27, 100360. [Google Scholar] [CrossRef]
  3. Eisler, R. Handbook of Chemical Risk Assessment: Health Hazards to Humans, Plants, and Animals, Three Volume Set; CRC Press: Boca Raton, FL, USA, 2000. [Google Scholar]
  4. Macías, F.A.; Varela, R.M.; Torres, A.; Oliva, R.M.; Molinillo, J.G. Bioactive norsesquiterpenes from Helianthus annuus with potential allelopathic activity. Phytochemistry 1998, 48, 631–636. [Google Scholar] [CrossRef]
  5. Uremis, I.; Arslan, M.; Uludag, A.; Sangun, M. Allelopathic potentials of residues of 6 brassica species on johnsongrass [Sorghum halepense (L.) Pers.]. Afr. J. Biotechnol. 2009, 8, 3497–3501. [Google Scholar]
  6. Alsaadawi, I.S.; Hadwan, H.A.; Malih, H.M. Weed Management in Cowpea through Combined Application of Allelopathic Sorghum Residues and Less Herbicide. J. Adv. Agric. Technol. 2019, 6, 205–2011. [Google Scholar] [CrossRef]
  7. Rice, E.L. Allelopathy; Academic Press: London, UK, 1984. [Google Scholar]
  8. Lemerle, D.; Verbeek, B.; Cousens, R.; Coombes, N. The potential for selecting wheat varieties strongly competitive against weeds. Weed Res. 1996, 36, 505–513. [Google Scholar] [CrossRef]
  9. Olofsdotter, M.; Navarez, D.; Rebulanan, M. Rice Allelopathy-Where Are We and How Far Can We Get? British Crop Protection Council: Farnham, UK, 1997; Volume 1. [Google Scholar]
  10. Weston, L.A. Utilization of allelopathy for weed management in agroecosystems. Agron. J. 1996, 88, 860–866. [Google Scholar] [CrossRef]
  11. Tursun, N.; Işık, D.; Demir, Z.; Jabran, K. Use of living, mowed, and soil-incorporated cover crops for weed control in apricot orchards. Agronomy 2018, 8, 150. [Google Scholar] [CrossRef] [Green Version]
  12. Belz, R.G. Allelopathy in crop/weed interactions—An update. Pest Manag. Sci. Former. Pestic. Sci. 2007, 63, 308–326. [Google Scholar] [CrossRef]
  13. Pethö, M. Occurence and physiological role of benzoxazinones and their derivates. IV: Isolation of hydroxamic acids from wheat and rye root secretions. Acta Agron. Hung. 1992, 41, 167–175. [Google Scholar]
  14. Farooq, N.; Abbas, T.; Tanveer, A.; Jabran, K. Allelopathy for Weed Management. In Co-Evolution of Secondary Metabolites; Mérillon, J.-M., Ramawat, K.G., Eds.; Springer International Publishing: Cham, Switzerland, 2020; pp. 505–519. [Google Scholar]
  15. Rao, V.S. Principles of Weed Science, 2nd ed.; CRC Press: New Yourk, NY, USA, 2000. [Google Scholar]
  16. Juraimi, A.S.; Drennan, S.H.D.; Anuar, N. Competitive effect of Cynodon dactylon (L.) Pers. on four crop species, soybean [Glycine max (L.) Merr.], maize (Zea mays), spring wheat (Triticum aestivum) and faba bean [Vicia faba (L.)]. Asian J. Plant Sci. 2005, 4, 90–94. [Google Scholar] [CrossRef] [Green Version]
  17. Korav, S.; Dhaka, A.K.; Singh, R.; Premaradhya, N.; Reddy, G.C. A study on crop weed competition in field crops. J. Pharmacogn. Phytochem. 2018, 7, 3235–3240. [Google Scholar]
  18. Narwal, S.; Sarmah, M.; Nandal, D. Allelopathic effects of wheat residues on growth and yield of fodder crops. Allelopath. J. 1997, 4, 111–120. [Google Scholar]
  19. Copaja, S.V.; Nicol, D.; Wratten, S.D. Accumulation of hydroxamic acids during wheat germination. Phytochemistry 1999, 50, 17–24. [Google Scholar] [CrossRef]
  20. Wu, H.; Pratley, J.; Lemerle, D.; Haig, T.; Verbeek, B. Differential allelopathic potential among wheat accessions to annual ryegrass. In Proceedings of the 9th Australian Agronomy Conference, Wagga Wagga, Australia, 20–23 July 1998; pp. 567–571. [Google Scholar]
  21. Wu, H.; Pratley, J.; Haig, T. Phytotoxic effects of wheat extracts on a herbicide-resistant biotype of annual ryegrass (Lolium rigidum). J. Agric. Food Chem. 2003, 51, 4610–4616. [Google Scholar] [CrossRef]
  22. Macias, F.A. Allelopathy in the search for natural herbicide models. In Allelopathy. Organisms, Processes and Applications; Inderjit, Dakshini, K.M.M., Einhellig, F.A., Eds.; ACS Publications: Cambridge, MA, USA, 1995; pp. 310–329. [Google Scholar]
  23. Yang, X.; He, Y.; Song, X.E.; Yuan, X.; Li, Y.; Sun, D. Reduced growth responses of mesosulfuron-methyl-resistant blackgrass to allelopathic wheat are driven by underground chemical interaction. Plant Soil 2020, 448, 369–381. [Google Scholar] [CrossRef]
  24. Mahmood, K.; Khaliq, A.; Cheema, Z.A.; Arshad, M. Allelopathic activity of Pakistani wheat genotypes against wild oat (Avena fatua L.). Pak. J. Agri. Sci 2013, 50, 169–176. [Google Scholar]
  25. Jabran, K.; Mahajan, G.; Sardana, V.; Chauhan, B.S. Allelopathy for weed control in agricultural systems. Crop Prot. 2015, 72, 57–65. [Google Scholar] [CrossRef]
  26. Kaur, G.J.; Arora, D.S. Antibacterial and phytochemical screening of Anethum graveolens, Foeniculum vulgare and Trachyspermum ammi. BMC Complement. Altern. Med. 2009, 9, 30. [Google Scholar] [CrossRef] [Green Version]
  27. Schmer, M.R.; Xue, Q.; Hendrickson, J.R. Salinity effects on perennial, warm-season (C4) grass germination adapted to the northern Great Plains. Can. J. Plant Sci. 2012, 92, 873–881. [Google Scholar] [CrossRef] [Green Version]
  28. Kitis, Y.E.; Tekin, M.; Taner, A. The Allelopathic Effects of Turkish Hulled Wheat Lines on Germination of Amaranthus retroflexus L. and Lolium perenne L. Seeds. Uluslararası Tarım Ve Yaban Hayatı Bilim. Derg. 2021, 7, 56–62. [Google Scholar] [CrossRef]
  29. Biswas, K.; Das, A.P. Allelopathic effects of teak (Tectona grandis Lf) on germination and seedling growth of Plumbago zeylanica L. Pleione 2016, 10, 262–268. [Google Scholar]
  30. Li, J.; Chen, L.; Chen, Q.; Miao, Y.; Peng, Z.; Huang, B.; Guo, L.; Liu, D.; Du, H. Allelopathic effect of Artemisia argyi on the germination and growth of various weeds. Sci. Rep. 2021, 11, 4303. [Google Scholar] [CrossRef] [PubMed]
  31. Yang, C.-M.; Chang, K.-W.; Yin, M.-H.; Huang, H.-M. Methods for the determination of the chlorophylls and their derivatives. Taiwania 1998, 43, 116–122. [Google Scholar]
  32. Braniša, J.; Jenisová, Z.; Porubská, M.; Jomová, K.; Valko, M. Spectrophotometric determination of chlorophylls and carotenoids. An effect of sonication and sample processing. J. Microbiol. Biotechnol. Food Sci. 2021, 2021, 61–64. [Google Scholar]
  33. Fales, F.W. The Assimilation and Degradation of Carbohydrates of Yeast Cells. J. Biol. Chem. 1951, 193, 113–118. [Google Scholar] [CrossRef] [PubMed]
  34. Lowry, O.; Rosebrough, N.; Farr, A.L.; Randall, R. Protein Measurement with the Folin Phenol Reagent. J. Biol. Chem. 1951, 193, 265–275. [Google Scholar] [CrossRef]
  35. Waterborg, J.H. The Lowry Method for Protein Quantitation. In The Protein Protocols Handbook; Walker, J.M., Ed.; Humana Press: Totowa, NJ, USA, 2009; pp. 7–10. [Google Scholar]
  36. Moore, S.; Stein, W.H. Photometric ninhydrin method for use in the chromatography of amino acids. J. Biol. Chem. 1948, 176, 367–388. [Google Scholar] [CrossRef]
  37. Cakmak, I.; Marschner, H. Magnesium deficiency and high light intensity enhance activities of superoxide dismutase, ascorbate peroxidase, and glutathione reductase in bean leaves. Plant Physiol. 1992, 98, 1222–1227. [Google Scholar] [CrossRef] [Green Version]
  38. Misra, H.P.; Fridovich, I. The role of superoxide anion in the autoxidation of epinephrine and a simple assay for superoxide dismutase. J. Biol. Chem. 1972, 247, 3170–3175. [Google Scholar] [CrossRef]
  39. Nakano, Y.; Asada, K. Hydrogen peroxide is scavenged by ascorbate-specific peroxidase in spinach chloroplasts. Plant Cell Physiol. 1981, 22, 867–880. [Google Scholar]
  40. Aebi, H. [13] Catalase in vitro. In Methods in Enzymology; Academic Press: Cambridge, MA, USA, 1984; Volume 105, pp. 121–126. [Google Scholar]
  41. Farooq, M.; Bajwa, A.A.; Cheema, S.A.; Cheema, Z.A. Application of allelopathy in crop production. Int. J. Agric. Biol. 2013, 15, 1367–1378. [Google Scholar]
  42. Rizvi, S.; Haque, H.; Singh, V.; Rizvi, V. A discipline called allelopathy. In Allelopathy; Springer: Berlin/Heidelberg, Germany, 1992; pp. 1–10. [Google Scholar]
  43. Harper, J.R.; Balke, N.E. Characterization of the Inhibition of K+ Absorption in Oat Roots by Salicylic Acid. Plant Physiol. 1981, 68, 1349–1353. [Google Scholar] [CrossRef] [PubMed] [Green Version]
  44. Einhellig, F.A.; Rasmussen, J.A. Effects of three phenolic acids on chlorophyll content and growth of soybean and grain sorghum seedlings. J. Chem. Ecol. 1979, 5, 815–824. [Google Scholar] [CrossRef]
  45. Kruse, M.; Strandberg, M.; Strandberg, B. Ecological Effects of Allelopathic Plants—A Review; NERI Technical Report No. 315; National Environmental Research Institute: Silkeborg, Denmark, 2000. [Google Scholar]
  46. Scavo, A.; Pandino, G.; Restuccia, A.; Caruso, P.; Lombardo, S.; Mauromicale, G. Allelopathy in Durum Wheat Landraces as Affected by Genotype and Plant Part. Plants 2022, 11, 1021. [Google Scholar] [CrossRef]
  47. Shan-lin, L.I.; Zhen-guo, Y.O.U.; Sun-rong, L.I. Allelopathy of wheat extraction to the growth of two weeds. Chin. J. Biol. Control 1996, 12, 168–170. [Google Scholar]
  48. Wu, H.; Pratley, J.; Lemerle, D.; Haig, T. Allelopathy in wheat (Triticum aestivum). Ann. Appl. Biol. 2001, 139, 1–9. [Google Scholar] [CrossRef]
  49. Khaliq, A.; Matloob, A.; Aslam, F.; Mushtaq, M.N.; Khan, M.B. Toxic action of aqueous wheat straw extract on horse purslane. Planta Daninha 2012, 30, 269–278. [Google Scholar] [CrossRef] [Green Version]
  50. Khaliq, A.; Matloob, A.; Riaz, Y. Bio-economic and qualitative impact of reduced herbicide use in direct seeded fine rice through multipurpose tree water extracts. Chil. J. Agric. Res. 2012, 72, 350–357. [Google Scholar] [CrossRef] [Green Version]
  51. Ma, Y. Allelopathic studies of common wheat (Triticum aestivum L.). Weed Biol. Manag. 2005, 5, 93–104. [Google Scholar] [CrossRef]
  52. Chon, S.U.; Kim, Y.M. Herbicidal potential and quantification of suspected allelochemicals from four grass crop extracts. J. Agron. Crop Sci. 2004, 190, 145–150. [Google Scholar] [CrossRef]
  53. Hashem, A.; Adkins, S.W. Introduction of Allelopathy to Wheat: Effect of Triticum speltoides on Two Weeds of Wheat. In Proceedings of the Eleventh Australian Weeds Conference, Melbourne, Australia, 30 September–3 October 1996; pp. 45–48. [Google Scholar]
  54. Spruell, J.A. Allelopathic Potential of Wheat Accessions; The University of Oklahoma: Norman, OK, USA, 1984. [Google Scholar]
  55. Wynne, K.; Adams, C.; Neely, C.; DeLaune, P.; Kimura, E.; Thapa, S. Canola Emergence and Early Growth Were Not Affected by Allelopathic Properties of Wheat Residue. Agrosyst. Geosci. Environ. 2019, 2, 1–7. [Google Scholar] [CrossRef] [Green Version]
  56. Wu, H.; Haig, T.; Pratley, J.; Lemerle, D.; An, M. Allelochemicals in wheat (Triticum aestivum L.): Variation of phenolic acids in shoot tissues. J. Chem. Ecol. 2001, 27, 125–135. [Google Scholar] [CrossRef] [PubMed]
  57. Salomonsson, A.C.; Theander, O.; Aman, P. Quantitative determination by GLC of phenolic acids as ethyl derivatives in cereal straws. J. Agric. Food Chem. 1978, 26, 830–835. [Google Scholar] [CrossRef]
  58. Lodhi, M.A.K.; Bilal, R.; Malik, K.A. Allelopathy in agroecosystems: Wheat phytotoxicity and its possible roles in crop rotation. J. Chem. Ecol. 1987, 13, 1881–1891. [Google Scholar] [CrossRef] [PubMed]
  59. Ben-Hammouda, M.; Kremer, R.J.; Minor, H.C.; Sarwar, M. A chemical basis for differential allelopathic potential of sorghum hybrids on wheat. J. Chem. Ecol. 1995, 21, 775–786. [Google Scholar] [CrossRef]
  60. Fatholahi, S.; Karimmojeni, H.; Ehsanzadeh, P. Phenolic compounds and allelopathic activities of ancient emmer wheats: Perspective for non-chemical weed control scenarios. Acta Physiol. Plant. 2020, 42, 135. [Google Scholar] [CrossRef]
  61. Wu, H.; Pratley, J.; Lemerle, D.; Haig, T. Crop cultivars with allelopathic capability. Weed Res.-Oxf. 1999, 39, 171–180. [Google Scholar] [CrossRef]
  62. Batish, D.; Tung, P.; Singh, H.; Kohli, R. Phytotoxicity of sunflower residues against some summer season crops. J. Agron. Crop Sci. 2002, 188, 19–24. [Google Scholar] [CrossRef]
  63. Đorđević, T.; Sarić-Krsmanović, M.; Gajić Umiljendić, J. Phenolic compounds and allelopathic potential of fermented and unfermented wheat and corn straw extracts. Chem. Biodivers 2019, 16, e1800420. [Google Scholar] [CrossRef]
  64. McClure, J.W. Physiology and functions of flavonoids. In The Flavonoids; Springer: Berlin/Heidelberg, Germany, 1975; pp. 970–1055. [Google Scholar]
  65. Chung, I.M.; Kim, K.H.; Ahn, J.K.; Chun, S.C.; Kim, C.S.; Kim, J.T.; Kim, S.H. Screening of allelochemicals on barnyardgrass (Echinochloa crus-galli) and identification of potentially allelopathic compounds from rice (Oryza sativa) variety hull extracts. Crop Prot. 2002, 21, 913–920. [Google Scholar] [CrossRef]
  66. Avelar Amado, P.; Fonsêca Castro, A.H.; Samúdio Santos Zanuncio, V.; Stein, V.C.; Brentan da Silva, D.; Alves Rodrigues dos Santos Lima, L. Assessment of allelopathic, cytotoxic, genotoxic and antigenotoxic potential of Smilax brasiliensis Sprengel leaves. Ecotoxicol. Environ. Saf. 2020, 192, 110310. [Google Scholar] [CrossRef] [PubMed]
  67. Chaves, N.; Sosa, T.; Escudero, J.C. Plant Growth Inhibiting Flavonoids in Exudate of Cistus ladanifer and in Associated Soils. J. Chem. Ecol. 2001, 27, 623–631. [Google Scholar] [CrossRef] [PubMed]
  68. Ribeiro, R.C.; de Carvalho, M.G.; de Moraes, M.d.L.L.; Rossiello, R.O.P.; de Oliveira, D.R.; de Amorim, R.M.Q.; Junior, E.B. Chemical screening of Urochloa humidicola: Methods for characterizing secondary metabolites and allelopathic activity on forage legumes. Am. J. Plant Sci. 2018, 9, 1260–1278. [Google Scholar] [CrossRef] [Green Version]
  69. Batish, D.R.; Singh, H.P.; Kaur, S.; Kohli, R.K.; Yadav, S.S. Caffeic acid affects early growth, and morphogenetic response of hypocotyl cuttings of mung bean (Phaseolus aureus). J. Plant Physiol. 2008, 165, 297–305. [Google Scholar] [CrossRef]
  70. Guan, Y.; Lin, H.; Ma, L.; Yang, Y.; Hu, X. Nitric oxide and hydrogen peroxide are important signals mediating the allelopathic response of Arabidopsis to p-hydroxybenzoic acid. Physiol. Plant. 2014, 152, 275–285. [Google Scholar] [CrossRef]
  71. Liu, Y.A.N.; Zhang, C.; Wei, S.; Cui, H.; Huang, H. Compounds from the subterranean part of Johnsongrass and their allelopathic potential. Weed Biol. Manag. 2011, 11, 160–166. [Google Scholar] [CrossRef]
  72. Chen, Q.; Sun, D.; Fang, T.; Zhu, B.; Liu, W.; He, X.; Sun, X.; Duan, S. In vitro allelopathic effects of compounds from Cerbera manghas L. on three Dinophyta species responsible for harmful common red tides. Sci. Total Environ. 2021, 754, 142253. [Google Scholar] [CrossRef]
  73. Shao, J.; Wu, Z.; Yu, G.; Peng, X.; Li, R. Allelopathic mechanism of pyrogallol to Microcystis aeruginosa PCC7806 (Cyanobacteria): From views of gene expression and antioxidant system. Chemosphere 2009, 75, 924–928. [Google Scholar] [CrossRef]
  74. Zhu, J.; Liu, B.; Wang, J.; Gao, Y.; Wu, Z. Study on the mechanism of allelopathic influence on cyanobacteria and chlorophytes by submerged macrophyte (Myriophyllum spicatum) and its secretion. Aquat. Toxicol. 2010, 98, 196–203. [Google Scholar] [CrossRef]
  75. Aslam, F.; Khaliq, A.; Matloob, A.; Tanveer, A.; Hussain, S.; Zahir, Z.A. Allelopathy in agro-ecosystems: A critical review of wheat allelopathy-concepts and implications. Chemoecology 2017, 27, 1–24. [Google Scholar] [CrossRef]
  76. Barkosky, R.R.; Einhellig, F.A. Allelopathic interference of plant-water relationships by para-hydroxybenzoic acid. Bot. Bull. Acad. Sin. 2003, 44, 53–58. [Google Scholar]
  77. Barkosky, R.R.; Einhellig, F.A. Effects of salicylic acid on plant-water relationships. J. Chem. Ecol. 1993, 19, 237–247. [Google Scholar] [CrossRef] [PubMed]
  78. Sánchez-Moreiras, A.M.; Weiss, O.A.; Reigosa-Roger, M.J. Allelopathic evidence in the Poaceae. Bot. Rev. 2003, 69, 300–319. [Google Scholar] [CrossRef]
  79. Barkosky, R.R.; Einhellig, F.A.; Butler, J.L. Caffeic Acid-Induced Changes in Plant–Water Relationships and Photosynthesis in Leafy Spurge Euphorbia esula. J. Chem. Ecol. 2000, 26, 2095–2109. [Google Scholar] [CrossRef]
  80. Devi, S.R.; Prasad, M.N.V. Effect of ferulic acid on growth and hydrolytic enzyme activities of germinating maize seeds. J. Chem. Ecol. 1992, 18, 1981–1990. [Google Scholar] [CrossRef] [PubMed]
  81. Unal, B.T.; Bayram, M. The Allelopathic Effects of Sunflower and Wheat Root Exudates on Sinapis arvensis and Sinapis alba. Phyton 2019, 88, 413–423. [Google Scholar] [CrossRef] [Green Version]
  82. El-Shora, H.M.; Alharbi, M.M.; Darwish, D.B.; Gad, D. Allelopathic potential of aqueous leaf extract of Rumex dentatus L. on metabolites and enzyme activities of common purslane leaves. J. Plant Interact. 2022, 17, 267–276. [Google Scholar] [CrossRef]
  83. Ahmed, H.A.; El-Darier, S.M. Phytochemistry, allelopathy and anticancer potentiality of Withania somnifera (L.) Dunal (Solanaceae). Braz. J. Biol. 2022, 84, e263815. [Google Scholar] [CrossRef]
  84. Batista-Silva, W.; Heinemann, B.; Rugen, N.; Nunes-Nesi, A.; Araújo, W.L.; Braun, H.P.; Hildebrandt, T.M. The role of amino acid metabolism during abiotic stress release. Plant Cell Environ. 2019, 42, 1630–1644. [Google Scholar] [CrossRef] [Green Version]
  85. Rakszegi, M.; Darko, E.; Lovegrove, A.; Molnár, I.; Lang, L.; Bedő, Z.; Molnár-Láng, M.; Shewry, P. Drought stress affects the protein and dietary fiber content of wholemeal wheat flour in wheat/Aegilops addition lines. PLoS ONE 2019, 14, e0211892. [Google Scholar] [CrossRef] [PubMed] [Green Version]
  86. Sharma, P.; Dubey, R.S. Protein synthesis by plants under stressful conditions. In Handbook of Plant and Crop Stress, Fourth Edition; CRC Press: Boca Raton, FL, USA, 2019; pp. 405–449. [Google Scholar]
  87. Rai, V.K. Role of amino acids in plant responses to stresses. Biol. Plant. 2002, 45, 481–487. [Google Scholar] [CrossRef]
  88. Miller, G.A.D.; Suzuki, N.; Ciftci-Yilmaz, S.; Mittler, R.O.N. Reactive oxygen species homeostasis and signalling during drought and salinity stresses. Plant Cell Environ. 2010, 33, 453–467. [Google Scholar] [CrossRef] [PubMed]
  89. Keunen, E.L.S.; Peshev, D.; Vangronsveld, J.; Van Den Ende, W.I.M.; Cuypers, A.N.N. Plant sugars are crucial players in the oxidative challenge during abiotic stress: Extending the traditional concept. Plant Cell Environ. 2013, 36, 1242–1255. [Google Scholar] [CrossRef]
  90. Gulzar, A.; Siddiqui, M.B. Evaluation of allelopathic effect of Eclipta alba (L.) Hassk on biochemical activity of Amaranthus spinosus L., Cassia tora L. and Cassia sophera L. Afr. J. Environ. Sci. Technol. 2014, 8, 1–5. [Google Scholar]
  91. Abdulghader, K.; Nojavan, M.; Naghshbandi, N. Chemical stress induced by heliotrope (Heliotropium europaeum L.) allelochemicals and increased activity of antioxidant enzymes. Pak. J. Biol. Sci. PJBS 2008, 11, 915–919. [Google Scholar] [CrossRef] [Green Version]
  92. Sahar, A.; El-Khawas, S.M.M. The allelopathic potential of Acacia nilotica and Eucalyptus rostata on monocot (Zea mays L.) and dicot (Phaseolus vulgaris) plants. Biotechnology 2005, 4, 23–34. [Google Scholar]
  93. Baziramakenga, R.; Leroux, G.D.; Simard, R.R.; Nadeau, P. Allelopathic effects of phenolic acids on nucleic acid and protein levels in soybean seedlings. Can. J. Bot. 1997, 75, 445–450. [Google Scholar] [CrossRef]
  94. Yang, C.-M.; Lee, C.-N.; Chou, C.-H. Effects of three allelopathic phenolics on chlorophyll accumulation of rice (Oryza sativa) seedlings: I. Inhibition of supply-orientation. Bot. Bull. Acad. Sin. 2002, 43, 299–304. [Google Scholar]
  95. Mersie, W.; Singh, M. Phenolic acids affect photosynthesis and protein synthesis by isolated leaf cells of velvet-leaf. J. Chem. Ecol. 1993, 19, 1293–1301. [Google Scholar] [CrossRef]
  96. Hussain, M.I.; González, L.; Reigosa, M.J. Phytotoxic effect of allelochemicals and herbicides on photosynthesis, growth and carbon isotope discrimination in Lactuca sativa. Allelopath. J 2010, 26, 157–174. [Google Scholar]
  97. Bertin, C.; Weston, L.A.; Huang, T.; Jander, G.; Owens, T.; Meinwald, J.; Schroeder, F.C. Grass roots chemistry: Meta-Tyrosine, an herbicidal nonprotein amino acid. Proc. Natl. Acad. Sci. USA 2007, 104, 16964–16969. [Google Scholar] [CrossRef] [PubMed] [Green Version]
  98. Gniazdowska, A.; Dobrzyńska, U.; Babańczyk, T.; Bogatek, R. Breaking the apple embryo dormancy by nitric oxide involves the stimulation of ethylene production. Planta 2007, 225, 1051–1057. [Google Scholar] [CrossRef] [PubMed]
  99. Kamal, J. Impact of allelopathy of sunflower (Helianthus annuus L.) roots extract on physiology of wheat (Triticum aestivum L.). Afr. J. Biotechnol. 2011, 10, 14465–14477. [Google Scholar]
  100. Abbas, T.; Nadeem, M.A.; Tanveer, A.; Chauhan, B.S. Can hormesis of plant-released phytotoxins be used to boost and sustain crop production? Crop Prot. 2017, 93, 69–76. [Google Scholar] [CrossRef]
  101. Hua, Q.; Liu, Y.-G.; Yan, Z.-L.; Zeng, G.-M.; Liu, S.-B.; Wang, W.-J.; Tan, X.-F.; Deng, J.-Q.; Tang, X.; Wang, Q.-P. Allelopathic effect of the rice straw aqueous extract on the growth of Microcystis aeruginosa. Ecotoxicol. Environ. Saf. 2018, 148, 953–959. [Google Scholar] [CrossRef]
  102. Hong, Y.; Hu, H.-Y.; Xie, X.; Sakoda, A.; Sagehashi, M.; Li, F.-M. Gramine-induced growth inhibition, oxidative damage and antioxidant responses in freshwater cyanobacterium Microcystis aeruginosa. Aquat. Toxicol. 2009, 91, 262–269. [Google Scholar] [CrossRef]
  103. García-Sánchez, M.; Garrido, I.; Casimiro, I.d.J.; Casero, P.J.; Espinosa, F.; García-Romera, I.; Aranda, E. Defence response of tomato seedlings to oxidative stress induced by phenolic compounds from dry olive mill residue. Chemosphere 2012, 89, 708–716. [Google Scholar] [CrossRef]
Figure 1. HPLC chromatograms of wheat straw aqueous extract: (a) phenolic acids; (b) flavonoids.
Sustainability 14 15989 g001
Figure 2. Seed germination and seedling biomass of bermudagrass subjected to the treatment with wheat straw aqueous extract at different concentrations: (a) germination percentage; (b) germination index; (c) fresh weight; (d) dry weight. Values are represented as the mean (n = 5) ± SD indicated by the vertical bars. Columns denoted by similar lowercase letters indicate nonsignificant differences between treatments tested by LSD at p ≤ 0.05.
Sustainability 14 15989 g002
Figure 3. Morphological responses of bermudagrass seedlings subjected to the treatment with wheat straw aqueous extract at different concentrations: (a) shoot length; (b) root length; (c) seedling length. Values are represented as the mean (n = 5) ± SD indicated by the vertical bars. Columns denoted by similar lowercase letters indicate nonsignificant differences between treatments tested by LSD at p ≤ 0.05.
Sustainability 14 15989 g003
Figure 4. A photograph showing the morphological responses of bermudagrass seedlings subjected to the treatment with wheat straw aqueous extract at different concentrations.
Sustainability 14 15989 g004
Figure 5. Growth inhibition/stimulation of bermudagrass subjected to the treatment with wheat straw aqueous extract at different concentrations.
Sustainability 14 15989 g005
Figure 6. Vigor indices of bermudagrass subjected to the treatment with wheat straw aqueous extract at different concentrations: (a) shoot vigor index; (b) root vigor index; (c) seedling vigor index. Values are represented as the mean (n = 5) ± SD indicated by the vertical bars. Columns denoted by similar lowercase letters indicate nonsignificant differences between treatments tested by LSD at p ≤ 0.05.
Sustainability 14 15989 g006
Figure 7. Photosynthetic pigments content in leaves of bermudagrass subjected to the treatment with wheat straw aqueous extract at different concentrations: (a) chlorophyll a; (b) chlorophyll b; (c) total carotenoids. Values are represented as the mean (n = 5) ± SD indicated by the vertical bars. Columns denoted by similar lowercase letters indicate nonsignificant differences between treatments tested by LSD at p ≤ 0.05.
Sustainability 14 15989 g007
Figure 8. Biochemical traits of bermudagrass subjected to the treatment with wheat straw aqueous extract at different concentrations: (a) total free amino acids; (b) soluble proteins; (c) soluble carbohydrates. Values are represented as the mean (n = 5) ± SD indicated by the vertical bars. Columns denoted by similar lowercase letters indicate nonsignificant differences between treatments tested by LSD at p ≤ 0.05.
Sustainability 14 15989 g008
Figure 9. Activity of antioxidant enzymes in bermudagrass subjected to the treatment with wheat straw aqueous extract at different concentrations: (a) SOD; (b) CAT; (c) APX. Values are represented as the mean (n = 5) ± SD indicated by the vertical bars. Columns denoted by similar lowercase letters indicate nonsignificant differences between treatments tested by LSD at p ≤ 0.05.
Sustainability 14 15989 g009
Figure 10. Biplot of principal component analysis (PCA) for all traits of bermudagrass subjected to the treatments with wheat straw aqueous extract at different concentrations. The first two principal components (PC1 and PC2) explain 95.7% of the total variation. The circle has a perfect correlation value (1.0), and arrows (vectors) represent the variables whose lengths are proportional to the correlation coefficient for each variable.
Sustainability 14 15989 g010
Table 1. List of phenolic acids detected and quantified by HPLC in wheat straw aqueous extract.
NoCompoundRetention Time
min
Concentration
μg/mL
Aqueous Extract
µg/g
Dry Extract
μg/g
Straw DW
1p-coumaric acid6.03.6620.911.99
2Caffeic acid8.12.6515.141.44
3p-hydroxybenzoic acid8.53.0517.431.66
4Pyrogallol9.025.33144.7413.75
5Gallic acid9.815.6689.498.50
6Isoferulic acid10.58.2347.034.47
7Ferulic acid11.018.09103.379.82
Table 2. List of flavonoids detected and quantified by HPLC in wheat straw aqueous extract.
NoCompoundRetention Time
min
Concentration
μg/mL
Aqueous Extract
µg/g
Dry Extract
μg/g
Straw DW
1Quercetin7.014.2581.437.74
2Kaempferol8.05.3630.632.91
3Luteolin9.015.2186.918.26
4Hesperidin10.07.1440.803.88
5Catechin11.920.33116.1711.04
6Chrysoeriol15.05.2129.772.83
Publisher’s Note: MDPI stays neutral with regard to jurisdictional claims in published maps and institutional affiliations.

